llc 12.31.17 -10k - bnsf.com llc 12.31.17 -10k created date: 20180222084600z
TRANSCRIPT

Table of Contents
i
UNITED STATESSECURITIES AND EXCHANGE COMMISSION
WASHINGTON, D.C. 20549
FORM 10-K[x]ANNUAL REPORT PURSUANT TO SECTION 13 OR 15(d) OF THE SECURITIES EXCHANGE ACT OF 1934
FOR THE FISCAL YEAR ENDED DECEMBER 31, 2017 OR
[ ]TRANSITION REPORT PURSUANT TO SECTION 13 OR 15(d) OF THE SECURITIES EXCHANGE ACT OF 1934FOR THE TRANSITION PERIOD FROM ___________TO ___________
COMMISSION FILE NUMBER: 1-11535
(Exact name of registrant as specified in its charter)
Burlington Northern Santa Fe, LLCState of Organization
DelawareI.R.S. Employer Identification No.
27-1754839Address of principal executive offices, including zip code2650 Lou Menk Drive, Fort Worth, Texas 76131-2830
Registrant’s telephone number, including area code(800) 795-2673
Securities registered pursuant to Section 12(b) of the Act:Title of each class
NoneName of each exchange on which registered
NoneSecurities registered pursuant to Section 12(g) of the Act:
Limited Liability Company Membership Interest
Indicate by check mark if the registrant is a well-known seasoned issuer, as defined in Rule 405 of the Securities Act. Yes [x] No [ ]
Indicate by check mark if the registrant is not required to file reports pursuant to Section 13 or Section 15(d) of the Act. Yes [ ] No [x]
Indicate by check mark whether the registrant: (1) has filed all reports required to be filed by Section 13 or 15(d) of the Securities Exchange Act of 1934 during the preceding 12 months (or for such shorter period that the registrant was required to file such reports), and (2) has been subject to such filing requirement for the past 90 days.
Yes [x] No [ ]
Indicate by check mark whether the registrant has submitted electronically and posted on its corporate Web site, if any, every Interactive Data File required to be submitted and posted pursuant to Rule 405 of Regulation S-T (§ 232.405 of this chapter) during the preceding 12 months (or for such shorter period that the registrant was required to submit and post such files).
Yes [x] No [ ]
Indicate by check mark if disclosure of delinquent filers pursuant to Item 405 of Regulation S-K (§ 229.405) is not contained herein, and will not be contained, to the best of registrant’s knowledge, in definitive proxy or information statements incorporated by reference in Part III of this Form 10-K or any amendment to this Form 10-K. [x]
Indicate by check mark whether the registrant is a large accelerated filer, an accelerated filer, a non-accelerated filer, smaller reporting company, or an emerging growth company. See the definitions of “large accelerated filer,” “accelerated filer,” “smaller reporting company,” and “emerging growth company” in Rule 12b-2 of the Exchange Act.
Large accelerated filer [ ] Accelerated filer [ ] Non-accelerated filer [x] Smaller reporting company [ ] Emerging growth company [ ]
If an emerging growth company, indicate by check mark if the registrant has elected not to use the extended transition period for complying with any new or revised financial accounting standards provided pursuant to Section 13(a) of the Exchange Act. [ ]
Indicate by check mark whether the registrant is a shell company (as defined in Rule 12b-2 of the Act). Yes [ ] No [x]
Burlington Northern Santa Fe, LLC is an indirect, wholly-owned subsidiary of Berkshire Hathaway Inc.; as a result, there is no market data with respect to registrant’s membership interests.
Indicate the number of shares outstanding of each of the registrant’s classes of common stock, as of the latest practicable date:100% of the membership interests of Burlington Northern Santa Fe, LLC outstanding as of February 23, 2018 is held by National Indemnity Company, a wholly-owned subsidiary of Berkshire Hathaway Inc.
Documents Incorporated by Reference: NoneREGISTRANT MEETS THE CONDITIONS SET FORTH IN GENERAL INSTRUCTION (I)(1)(a) AND (b) OF FORM 10-K AND IS THEREFORE FILING THIS FORM WITH THE REDUCED DISCLOSURE FORMAT.

Table of Contents
ii
Table of Contents
Part I Item 1. Business Item 1A. Risk Factors Item 1B. Unresolved Staff Comments 5 Item 2. Properties Item 3. Legal Proceedings
Item 4. Mine Safety Disclosures
Part II Item 5. Market for Registrant’s Common Equity, Related Stockholder Matters
and Issuer Purchases of Equity Securities Item 7. Management’s Narrative Analysis of Results of Operations Item 7A. Quantitative and Qualitative Disclosures About Market Risk Item 8. Financial Statements and Supplementary Data
Item 9. Changes in and Disagreements With Accountants on Accounting and Financial
Disclosure Item 9A. Controls and Procedures Item 9B. Other Information Part III Item 14. Principal Accountant Fees and Services Part IV Item 15. Exhibits and Financial Statement Schedules Signatures S-1
1
2
6
8
8
9
9
13
14
48
48
48
49
50

Table of Contents
1
Part I
Item 1. Business
Burlington Northern Santa Fe Corporation was incorporated in the State of Delaware on December 16, 1994. On February 12, 2010, Berkshire Hathaway Inc., a Delaware corporation (Berkshire), acquired 100% of the outstanding shares of Burlington Northern Santa Fe Corporation common stock that it did not already own. The acquisition was completed through the merger (Merger) of a Berkshire wholly-owned merger subsidiary and Burlington Northern Santa Fe Corporation with the surviving entity renamed Burlington Northern Santa Fe, LLC (BNSF). Further information about the Merger is incorporated by reference from Note 1 to the Consolidated Financial Statements. BNSF is a holding company that conducts no operating activities and owns no significant assets other than through its interests in its subsidiaries. Through its subsidiaries, BNSF is engaged primarily in the freight rail transportation business. At December 31, 2017, BNSF and its subsidiaries had approximately 41,000 employees. The rail operations of BNSF Railway Company (BNSF Railway), the Company’s principal operating subsidiary, comprise one of the largest railroad systems in North America. BNSF’s internet address is www.bnsf.com. Through this internet website (under the “About BNSF/Financial Information” link), BNSF makes available, free of charge, its Annual Report on Form 10-K, Quarterly Reports on Form 10-Q and Current Reports on Form 8-K, as well as all amendments to these reports, as soon as reasonably practicable after these reports are electronically filed with or furnished to the Securities and Exchange Commission (SEC). BNSF makes available on its website other previously filed SEC reports, registration statements and exhibits via a link to the SEC’s website at www.sec.gov. BNSF’s Code of Conduct for officers and salaried employees, along with other information about our business, is also made available on the Company’s website. BNSF intends to disclose any amendments to the Code of Conduct or any waiver from a provision of the Code of Conduct on its website. Further discussion of the Company’s business, including equipment and its business sectors, is incorporated by reference from Item 2, “Properties.”

Table of Contents
2
Item 1A. Risk Factors
The information set forth in Item 1A should be read in conjunction with the rest of the information in this report, including Item 7, "Management’s Narrative Analysis of Results of Operations", and Item 8, "Financial Statements and Supplementary Data".
Changes in government policy could negatively impact demand for the Company’s services, impair its ability to price its services or increase its costs or liability exposure.Changes in United States and foreign government policies could change the economic environment and affect demand for the Company’s services. For example, changes in clean air laws, regulation of greenhouse gas emissions, permitting or other regulatory requirements could reduce the demand for coal or other products and revenues from the transportation services provided by BNSF Railway. Also, changes in environmental laws and other laws and regulations could reduce the demand for drilling products and products produced by drilling. United States and foreign government agriculture tariffs or subsidies could affect the demand for grain. Developments and changes in laws and regulations as well as increased economic regulation of the rail industry through legislative action and revised rules and standards applied by the U.S. Surface Transportation Board (STB) in various areas, including rates, services and access to facilities could adversely impact the Company’s ability to determine prices for rail services and significantly affect the revenues, costs and profitability of the Company’s business. Additionally, because of the significant costs to maintain its rail network, a reduction in profitability could hinder the Company’s ability to maintain, improve or expand its rail network, facilities and equipment. Federal or state spending on infrastructure improvements or incentives that favor other modes of transportation could also adversely affect the Company’s revenues. Changes in tax rates, enactment of new tax laws and amendments to existing tax regulations could have a material adverse impact on the Company’s operating results, financial condition or liquidity. The Company’s success depends on its ability to continue to comply with the significant federal, state and local governmental regulations to which it is subject.The Company is subject to a significant amount of governmental laws and regulations with respect to its rates and practices, taxes, railroad operations and a variety of health, safety, labor, environmental and other matters. Failure to comply with applicable laws and regulations could have a material adverse effect on the Company. Governments may change the legislative and/or regulatory framework within which the Company operates without providing the Company with any recourse for any adverse effects that the change may have on its business. For example, federal legislation enacted in 2008 and amended in 2015 mandates the implementation of positive train control technology by December 31, 2018, on certain mainline track where intercity and commuter passenger railroads operate and where toxic-by-inhalation (TIH) hazardous materials are transported. Complying with legislative and regulatory changes may pose significant operating and implementation risks and require significant capital expenditures. As part of its railroad operations, the Company frequently transports chemicals and other hazardous materials, which could expose it to the risk of significant claims, losses and penalties and operating restrictions.BNSF Railway frequently transports chemicals and other hazardous materials and is required to transport these commodities to the extent of its common carrier obligation. An accidental release of TIH or hazardous commodities could result in a significant loss of life and extensive property damage as well as environmental remediation and restoration obligations and penalties. The associated costs could have an adverse effect on the Company’s operating results, financial condition or liquidity as the Company is not insured above a certain threshold. Further, the rates BNSF Railway receives for transporting these commodities do not adequately compensate it should there be some type of accident. In addition, insurance premiums charged for some or all of the coverage currently maintained by the Company could increase dramatically or certain coverage may not be available to the Company in the future if there is a catastrophic event related to rail transportation of these commodities. Regulatory imposition of routing or speed or other restrictions on the transportation of such products could adversely affect train velocity and network fluidity and adversely affect the Company’s results of operations, financial condition or liquidity.

Table of Contents
3
The Company faces intense competition from rail carriers and other transportation providers, and its failure to compete effectively could adversely affect its results of operations, financial condition or liquidity.The Company operates in a highly competitive business environment. Depending on the specific market, the Company faces intermodal, intramodal, product and geographic competition. Competition from other railroads and motor carriers, as well as barges, ships and pipelines in certain markets, may be reflected in pricing, market share, level of services, reliability and other factors. For example, the Company believes that high service truck lines, due to their ability to deliver non-bulk products on an expedited basis, may have an adverse effect on the Company’s ability to compete for deliveries of non-bulk, time-sensitive freight. While the Company must build or acquire, maintain, and privately fund its rail system, trucks and barges are able to use public rights-of-way maintained and funded by public entities. Any material increase in the capacity and quality or decrease in the cost of these alternative methods or the passage of legislation granting greater latitude to motor carriers with respect to size and weight restrictions or driver requirements could have an adverse effect on the Company’s results of operations, financial condition or liquidity. In addition, a failure to provide the level of service required by the Company’s customers could result in loss of business to competitors. Changes in the ports used by ocean carriers or the use of all-water routes from the Pacific Rim to the East Coast or other changes in the supply chain or trade policy could also have an adverse effect on the Company’s volumes and revenues. Further, low natural gas or oil prices could impact future energy-related commodities demand.
The Company is subject to various claims and lawsuits, and increases in the amount or severity of these claims and lawsuits could adversely affect the Company’s operating results, financial condition or liquidity.As part of its railroad operations, the Company is exposed to various claims and litigation related to commercial disputes, personal injury, property damage, environmental liability and other matters. Personal injury claims by BNSF Railway employees are subject to the Federal Employers’ Liability Act (FELA), rather than state workers’ compensation laws. The Company believes that the FELA system, which includes unscheduled awards and a reliance on the jury system, can contribute to increased expenses. Other proceedings include claims by third parties for punitive as well as compensatory damages, and from time to time may include proceedings that have been certified as or purport to be class actions. Developments in legislative and judicial standards, material changes to litigation trends, or a catastrophic rail accident or series of accidents involving any or all of property damage, personal injury, and environmental liability could have a material adverse effect on the Company’s operating results, financial condition or liquidity.
The Company is subject to stringent environmental laws and regulations, which may impose significant costs on its business operations.The Company’s operations are subject to extensive federal, state and local environmental laws and regulations concerning, among other things, emissions to the air; discharges to waters; the generation, handling, storage, transportation and disposal of waste and hazardous materials; and the cleanup of hazardous material or petroleum releases. Changes to or limits on greenhouse gas emissions could result in significant capital expenditures to comply with these regulations with respect to BNSF Railway’s locomotives, equipment, vehicles and machinery and its yards and intermodal facilities and the cranes and trucks serving those facilities. Emission regulations, including carbon pricing, could also adversely affect fuel efficiency and increase operating costs. Delays, litigation, local concerns, special interest opposition and difficulty in obtaining approvals for projects requiring federal, state or local equivalent permitting could inhibit the Company’s ability to build strategic facilities and rail infrastructure, which could adversely impact growth and operational efficiency. In addition, many land holdings are and have been used for industrial or transportation-related purposes or leased to commercial or industrial companies whose activities may have resulted in discharges onto the property. Environmental liability can extend to previously owned or operated properties, leased properties and properties owned by third parties, as well as to properties currently owned and used by the Company’s subsidiaries. Environmental liabilities have arisen and may continue to arise from claims asserted by adjacent landowners, other third parties in toxic tort litigation or as a result of alleged damages to natural resources or environmental incidents. The Company’s subsidiaries have been and may continue to be subject to allegations or findings to the effect that they have violated, or are strictly liable under, these laws or regulations. The Company’s operating results, financial condition or liquidity could be adversely affected as a result of any of the foregoing, and it may be required to incur significant expenses to investigate and remediate environmental contamination. The Company may also incur fines, penalties and other sanctions to resolve any alleged violations of environmental law.
Downturns in the economy could adversely affect demand for the Company’s services.Significant, extended negative changes in domestic and global economic conditions that impact the producers and consumers of the commodities transported by the Company may have an adverse effect on the Company’s operating results, financial condition or liquidity. Declines in or muted manufacturing activity, economic growth and international trade all could result in reduced revenues in one or more business units.

Table of Contents
4
Negative changes in general economic conditions could lead to disruptions in the credit markets, increase credit risks and could adversely affect the Company’s financial condition or liquidity.Challenging economic conditions may not only affect revenues due to reduced demand for many goods and commodities, but could result in payment delays, increased credit risk and possible bankruptcies of customers. The Company’s business is capital-intensive and the Company may finance a portion of the building and maintenance of infrastructure as well as the acquisition of locomotives and other rail equipment. Economic slowdowns and related credit market disruptions may adversely affect the Company’s cost structure, its timely access to capital to meet financing needs and costs of its financings. The Company could also face increased counterparty risk to its cash investments. Adverse economic conditions could also affect the Company’s costs for insurance or its ability to acquire and maintain adequate insurance coverage for risks associated with the railroad business if insurance companies experience credit downgrades or bankruptcies. Declines in the securities and credit markets could also affect the Company’s pension fund and railroad retirement tax rates, which in turn could increase funding requirements.
Fuel supply availability, fuel prices and dependency on certain key railroad equipment and material suppliers may adversely affect the Company’s results of operations, financial condition or liquidity.Fuel supply availability could be impacted as a result of limitations in refining capacity, disruptions to the supply chain, rising global demand and international political and economic factors. A significant reduction in fuel availability could impact the Company’s ability to provide transportation services at current levels, increase fuel costs and impact the economy. Each of these factors could have an adverse effect on the Company’s operating results, financial condition or liquidity. If the price of fuel increases substantially, the Company expects to be able to recover a significant portion of these higher fuel costs. However, to the extent that the Company is unable to recover these costs, increases in fuel prices could have an adverse effect on the Company’s operating results, financial condition or liquidity. Due to the capital intensive nature and sophistication of certain railroad equipment and material, prospective new suppliers are subject to high barriers of entry. If railroad equipment and material suppliers discontinue operations or if they are unable to meet regulatory specifications, the Company could experience significant cost increases, as well as limited supply of railroad equipment and material necessary for the Company’s operations. Severe weather and natural disasters could disrupt normal business operations, the potential effects of which could result in increased costs and liabilities and decreases in revenues.The Company’s success is dependent on its ability to operate its railroad system efficiently. Severe weather, climate change and natural disasters, such as tornados, fires, flooding and earthquakes, could cause significant business interruptions and result in increased costs and liabilities and decreased revenues. In addition, damages to or loss of use of significant aspects of the Company’s infrastructure due to natural or man-made disruptions could have an adverse effect on the Company’s operating results, financial condition or liquidity for an extended period of time until repairs or replacements could be made. Additionally, during natural disasters, the Company’s workforce may be unavailable, which could result in further delays. Extreme swings in weather could also negatively affect the performance of locomotives and rolling stock.
The Company’s operational dependencies may adversely affect results of operations, financial condition or liquidity.Due to the integrated nature of the United States’ freight transportation infrastructure, the Company’s operations may be negatively affected by service disruptions of other entities such as ports, passenger trains and other railroads which interchange with the Company. A significant prolonged service disruption of one or more of these entities could have an adverse effect on the Company’s results of operations, financial condition or liquidity. Significant unexpected increases in demand for the Company’s services may adversely affect service levels and operational efficiency.If increases in demand for the Company’s services significantly exceed expectations, including in a particular geographical region, the Company may experience network difficulties including congestion or reduced velocity, negatively impacting the level of service provided. Although investments to add capacity continue to be made to meet future anticipated demand, delays in or inability to complete permitting may delay or preclude implementation of these capacity improvements. This may impact operational efficiency and could adversely affect the Company’s results of operations, financial condition or liquidity.

Table of Contents
5
Acts of terrorism or war, as well as the threat of terrorism or war, may cause significant disruptions in the Company’s business operations.Terrorist attacks and any government response to those types of attacks and war or risk of war may adversely affect the Company’s results of operations, financial condition or liquidity. The Company’s rail lines and facilities could be direct targets or indirect casualties of an act or acts of terror, which could cause significant business interruption and result in increased costs and liabilities and decreased revenues and have an adverse effect on operating results and financial condition. Such effects could be magnified if releases of hazardous materials are involved. Any act of terror, retaliatory strike, sustained military campaign or war or risk of war may have an adverse impact on the Company’s operating results and financial condition by causing unpredictable operating or financial conditions, including disruptions of BNSF Railway or connecting rail lines, loss of critical customers or partners, volatility of or a sustained increase of fuel prices, fuel shortages, general economic decline and instability or weakness of financial markets. In addition, insurance premiums charged for some or all of the coverage currently maintained by the Company could increase dramatically, the coverage available may not adequately compensate it for certain types of incidents and certain coverages may not be available to the Company in the future. The Company depends on the stability and availability of its information technology systems.The Company relies on information technology in all aspects of its business. A significant disruption or failure of its information technology systems could result in service interruptions, safety failures, security violations, regulatory compliance failures and the inability to protect corporate information assets against intruders or other operational difficulties. Although the Company has taken steps to mitigate these risks, including business continuity planning, disaster recovery planning, systems testing, protection and monitoring, and business impact analysis, a significant disruption or cyber intrusion could lead to misappropriation of assets or data corruption and could adversely affect the Company’s results of operations, financial condition or liquidity. Additionally, if the Company is unable to acquire, implement or protect rights around new technology, it may suffer a competitive disadvantage, which could also have an adverse effect on the Company’s results of operations, financial condition or liquidity.
Most of the Company’s employees are represented by unions, and failure to negotiate reasonable collective bargaining agreements may result in strikes, work stoppages or substantially higher ongoing labor costs.A significant majority of BNSF Railway’s employees are union-represented. BNSF Railway’s union employees work under collective bargaining agreements with various labor organizations. Wages, health and welfare benefits, work rules and other issues have traditionally been addressed through industry-wide negotiations. These negotiations have generally taken place over an extended period of time and have previously not resulted in any extended work stoppages. For ongoing negotiations, the existing agreements have remained in effect and will continue to remain in effect until new agreements are reached or the Railway Labor Act’s procedures (which include mediation, cooling-off periods and the possibility of presidential or congressional intervention) are exhausted. While the negotiations have not yet resulted in any extended work stoppages, if BNSF Railway is unable to negotiate acceptable new agreements, it could result in strikes by the affected workers, loss of business, disruption of operations and increased operating costs as a result of higher wages or benefits paid to union members, any of which could have an adverse effect on the Company’s operating results, financial condition or liquidity.
The unavailability of qualified personnel could adversely affect the Company’s operations.Changes in demographics, training requirements and the unavailability of qualified personnel, particularly engineers and trainmen, could negatively impact the Company’s ability to meet demand for rail service. Recruiting and retaining qualified personnel, particularly those with expertise in the railroad industry, are vital to operations. Although the Company believes that it has adequate personnel for the current business environment, unpredictable increases in demand for rail services may exacerbate the risk of not having sufficient numbers of trained personnel, which could have a negative impact on operational efficiency and otherwise have an adverse effect on the Company’s operating results, financial condition or liquidity.
Item 1B. Unresolved Staff Comments
None.

Table of Contents
6
Item 2. Properties
Track ConfigurationBNSF Railway operates one of the largest railroad networks in North America. BNSF Railway operates approximately 32,500route miles of track (excluding multiple main tracks, yard tracks and sidings) in 28 states and also operates in three Canadian provinces. BNSF Railway owns over 23,000 route miles, including easements, and operates on over 9,000 route miles of trackage rights that permit BNSF Railway to operate its trains with its crews over other railroads’ tracks.
As of December 31, 2017, the total BNSF Railway system, including single and multiple main tracks, yard tracks and sidings, consisted of over 50,000 operated miles of track, all of which are owned by or held under easement by BNSF Railway except for over 10,000 miles operated under trackage rights.
Property and FacilitiesBNSF Railway operates various facilities and equipment to support its transportation system, including its infrastructure and locomotives and freight cars. It also owns or leases other equipment to support rail operations, such as vehicles. Support facilities for rail operations include yards and terminals throughout its rail network, system locomotive shops to perform locomotive servicing and maintenance, a centralized network operations center for train dispatching and network operations monitoring and management in Fort Worth, Texas, regional dispatching centers, computers, telecommunications equipment, signal systems and other support systems. Transfer facilities are maintained for rail-to-rail as well as intermodal transfer of containers, trailers and other freight traffic. These facilities include approximately 25 intermodal hubs located across the system. As of December 31, 2017, BNSF Railway owned or held under non-cancelable leases exceeding one year approximately 8,000locomotives and 71,000 freight cars, in addition to maintenance of way and other equipment. In the ordinary course of business, BNSF incurs significant costs in repairing and maintaining its properties. In 2017, BNSF recorded approximately $2 billion in repairs and maintenance expense in the Consolidated Statements of Income.

Table of Contents
7
Business MixIn serving the Midwest, Pacific Northwest, Western, Southwestern and Southeastern regions and ports of the country, BNSF transports, through one operating transportation services segment, a range of products and commodities derived from the manufacturing, agricultural and natural resource industries. Over half of the freight revenues of the Company are covered by contractual agreements of varying durations, while the balance is subject to common carrier published prices or quotations offered by the Company. BNSF’s financial performance is influenced by, among other things, general and industry economic conditions at the international, national and regional levels. The following map illustrates the Company’s primary routes, including trackage rights, which allow BNSF to access major cities and ports in the western and southern United States as well as Canadian and Mexican traffic. In addition to major cities and ports, BNSF efficiently serves many smaller markets by working closely with approximately 200 shortline railroads. BNSF has also entered into marketing agreements with other rail carriers, expanding the marketing reach for each railroad and our collective customers.
Consumer Products:The Consumer Products freight business provided 35 percent of freight revenues for the year ended December 31, 2017, and consisted of the following business sectors: Domestic Intermodal (including Truckload/Intermodal Marketing Companies and Expedited Truckload/Less-than-Truckload/Parcel), International Intermodal and Automotive.
Industrial Products:The Industrial Products freight business provided 25 percent of freight revenues for the year ended December 31, 2017, and consisted of the following five business areas: Construction Products, Petroleum Products, Building Products, Chemicals and Plastics Products and Food and Beverages.
Agricultural Products:The transportation of Agricultural Products provided 21 percent of freight revenues for the year ended December 31, 2017. These products include corn, wheat, soybeans, ethanol, fertilizer, bulk foods, feeds, oil seeds and meals, milo, oils, barley, oats and rye, flour and mill products, specialty grains and malt.

Table of Contents
8
Coal:The transportation of coal contributed 19 percent of freight revenues for the year ended December 31, 2017, with more than 90 percent of all BNSF’s coal tons originating from the Powder River Basin of Wyoming and Montana. Government Regulation and LegislationThe Company’s rail operations are subject to the regulatory jurisdiction of the STB of the United States Department of Transportation (DOT), the Federal Railroad Administration of the DOT, the Occupational Safety and Health Administration (OSHA), as well as other federal and state regulatory agencies and Canadian regulatory agencies for operations in Canada. The STB has jurisdiction over disputes and complaints involving certain rates, routes and services, the sale or abandonment of rail lines, applications for line extensions and construction and consolidation or merger with, or acquisition of control of, rail common carriers. The outcome of STB proceedings can affect the profitability of BNSF’s business.
DOT and OSHA have jurisdiction under several federal statutes over a number of safety and health aspects of rail operations, including the transportation of hazardous materials. State agencies regulate some aspects of rail operations with respect to health and safety in areas not otherwise preempted by federal law. Further discussion is incorporated by reference from Note 12 to the Consolidated Financial Statements. CompetitionThe business environment in which BNSF Railway operates is highly competitive. Depending on the specific market, deregulated motor carriers and other railroads, as well as river barges, ships and pipelines in certain markets, may exert pressure on price and service levels. The presence of advanced, high service truck lines with expedited delivery, subsidized infrastructure and minimal empty mileage continues to affect the market for non-bulk, time-sensitive freight. The potential expansion of longer combination vehicles could further encroach upon markets traditionally served by railroads. In order to remain competitive, BNSF Railway and other railroads continue to seek to develop and implement operating efficiencies to improve productivity. As railroads streamline, rationalize and otherwise enhance their franchises, competition among rail carriers intensifies. BNSF Railway’s primary rail competitor in the western region of the United States is the Union Pacific Railroad Company. Other Class I railroads and numerous regional railroads and motor carriers also operate in parts of the same territories served by BNSF Railway. Based on weekly reporting by the Association of American Railroads, BNSF Railway’s share of the western United States rail traffic in 2017 was 50.9 percent.
Item 3. Legal Proceedings Beginning May 14, 2007, some 30 similar class action complaints were filed in six federal district courts around the country by rail shippers against BNSF Railway and other Class I railroads alleging that they have conspired to fix fuel surcharges with respect to unregulated freight transportation services in violation of the antitrust laws. The complaints seek injunctive relief and unspecified treble damages. These cases were consolidated and are currently pending in the federal District Court for the District of Columbia for coordinated or consolidated pretrial proceedings. (In re: Rail Freight Fuel Surcharge Antitrust Litigation, MDL No. 1869). Consolidated amended class action complaints were filed against BNSF Railway and three other Class I railroads in April 2008. On June 21, 2012, the District Court certified the class sought by the plaintiffs. BNSF Railway and the other three Class I railroads appealed the class certification decision to the U.S. Court of Appeals. On August 9, 2013, the U.S. Court of Appeals vacated the District Court’s class certification decision and remanded the case to permit the District Court to reconsider its decision in light of the United States Supreme Court case of Comcast Corp. v. Behrend. In September 2016, the District Court held a hearing to determine whether to certify a class. On October 10, 2017, the District Court denied the plaintiffs’ motion to certify a class. The plaintiffs appealed the denial of class certification to the U.S. Court of Appeals. The Company continues to believe that these claims are without merit and continues to defend against the allegations vigorously. The Company does not believe that the outcome of these proceedings will have a material effect on its financial condition, results of operations or liquidity.
Information concerning certain pending tax-related administrative or adjudicative state proceedings or appeals is incorporated by reference from Note 4 to the Consolidated Financial Statements, and information concerning other claims and litigation is incorporated by reference from Note 12 to the Consolidated Financial Statements.
Item 4. Mine Safety Disclosures
Not applicable.

Table of Contents
9
Part II
Item 5. Market for Registrant’s Common Equity,Related Stockholder Matters and Issuer Purchases of Equity Securities
All of the membership interests in Burlington Northern Santa Fe, LLC are owned by a subsidiary of Berkshire Hathaway Inc. and therefore are not traded on any market.
Item 7. Management’s Narrative Analysis of Results of Operations Management’s narrative analysis relates to the results of operations of Burlington Northern Santa Fe, LLC and its majority-owned subsidiaries (collectively BNSF, Registrant or Company). The principal operating subsidiary of BNSF is BNSF Railway Company (BNSF Railway) through which BNSF derives substantially all of its revenues. The following narrative analysis should be read in conjunction with the Consolidated Financial Statements and the accompanying notes. The following narrative analysis of results of operations includes a brief discussion of the factors that materially affected the Company’s operating results in the year ended December 31, 2017, and a comparative analysis of the year ended December 31, 2016.
Results of Operations
Revenues SummaryThe following tables present BNSF’s revenue information by business group:
Revenues (in millions) Cars / Units (in thousands)Year Ended Year Ended Year Ended Year Ended
December 31,
2017December 31,
2016December 31,
2017December 31,
2016Consumer Products $ 7,111 $ 6,534 5,439 5,118Industrial Products 5,133 4,764 1,813 1,727Agricultural Products 4,316 4,240 1,108 1,110Coal 3,846 3,383 1,917 1,803Total freight revenues 20,406 18,921 10,277 9,758Other revenues 981 908 Total operating revenues $ 21,387 $ 19,829
Average Revenue Per Car / UnitYear Ended Year Ended
December 31,
2017December 31,
2016Consumer Products $ 1,307 $ 1,277Industrial Products 2,831 2,759Agricultural Products 3,895 3,820Coal 2,006 1,876 Total freight revenues $ 1,986 $ 1,939

Table of Contents
10
Fuel SurchargesFreight revenues include both revenue for transportation services and fuel surcharges. Where BNSF’s fuel surcharge program is applied, it is intended to recover BNSF's incremental fuel costs when fuel prices exceed a threshold fuel price. Fuel surcharges are calculated differently depending on the type of commodity transported. BNSF has two standard fuel surcharge programs - Percent of Revenue and Mileage-Based. In addition, in certain commodities, fuel surcharge is calculated using a fuel price from a time period that can be up to 60 days earlier. In a period of volatile fuel prices or changing customer business mix, changes in fuel expense and fuel surcharge may differ significantly. The following table presents fuel surcharge and fuel expense information (in millions):
Year Ended Year Ended
December 31,
2017December 31,
2016Total fuel expensea $ 2,518 $ 1,934BNSF fuel surcharges $ 853 $ 580
a Total fuel expense includes locomotive and non-locomotive fuel.
Year Ended December 31, 2017 vs. Year Ended December 31, 2016
RevenuesRevenues for the year ended December 31, 2017 were $21,387 million, an increase of $1,558 million, or 8 percent, as compared with the year ended December 31, 2016. The increase in revenue is primarily due to a 5 percent increase in unit volume and an increase in average revenue per car / unit. The change in revenues is due to the following:
• Average revenue per car / unit increased 2 percent primarily as a result of higher fuel surcharges, increased rates per car /unit, and business mix changes.
• Consumer Products volumes increased due to higher domestic intermodal, international intermodal, and automotive volumes. The increases were primarily due to improving economic conditions, normalizing of retail inventories, new services, and higher market share.
• Industrial Products volumes increased primarily due to higher sand and other commodities that support drilling. In addition, broad strengthening in the industrial sector drove greater demand for steel and taconite. The volume increase was partially offset by lower petroleum products volume due to pipeline displacement of U.S. crude rail traffic.
• Agricultural Products volumes were relatively flat due to higher shipments of domestic grain as well as ethanol and other grain products, offset by lower grain exports.
• Coal volumes increased due to continued effects of higher natural gas prices, which led to increased utility coal usage. This was partially offset by the effects of unit retirements at coal generating facilities, increased renewable generation, and coal inventory adjustments at customer facilities.

Table of Contents
11
Expense TableThe following table presents BNSF’s expense information (in millions):
Year Ended Year Ended
December 31,
2017December 31,
2016Compensation and benefits $ 4,969 $ 4,769Fuel 2,518 1,934Purchased services 2,514 2,418Depreciation and amortization 2,352 2,128Equipment rents 784 766Materials and other 903 1,129 Total operating expenses $ 14,040 $ 13,144
Interest expense $ 1,016 $ 992Other expense, net $ 3 $ —Income tax expense (benefit) $ (4,972) $ 2,124
ExpensesOperating expenses for the year ended December 31, 2017 were $14,040 million, an increase of $896 million, or 7 percent, as compared with the year ended December 31, 2016. A significant portion of this increase is due to the following changes in underlying trends in expenses:
• Compensation and benefits increased due to higher health and welfare costs and increased volumes, partially offset by lower headcount.
• Fuel expense increased due to higher average fuel prices and increased volumes.
• Depreciation and amortization expense increased due to a larger depreciable asset base.
• Materials and other expense decreased primarily as a result of the impact of the Tax Cuts and Jobs Act (the Tax Act) on an equity method subsidiary, as well as lower personal injury and casualty related costs.
• There were no significant changes in purchased services, equipment rents, and other expense, net.
• Interest expense increased primarily due to a higher average debt balance.
• The effective tax rate was negative 78.6 percent and positive 37.3 percent for the years ended December 31, 2017 and 2016, respectively. The decrease is primarily driven by the Tax Act signed into law on December 22, 2017, which decreased the federal income tax rate from 35 percent to 21 percent effective January 1, 2018. Net income for the fourth quarter and the full year 2017 included a decrease to income tax expense of $7.3 billion to reflect the revaluation of BNSF’s deferred tax liability as of December 31, 2017 to reflect the new lower tax rate.

Table of Contents
12
Forward-Looking InformationTo the extent that statements made by the Company relate to the Company’s future economic performance or business outlook, projections or expectations of financial or operational results, or refer to matters that are not historical facts, such statements are “forward-looking” statements within the meaning of the federal securities laws.
Forward-looking statements involve a number of risks and uncertainties, and actual performance or results may differ materially. For a discussion of material risks and uncertainties that the Company faces, see the discussion in Item 1A, “Risk Factors.” Important factors that could cause actual results to differ materially include, but are not limited to, the following:
• Economic and industry conditions: material adverse changes in economic or industry conditions, both in the United States and globally; volatility in the capital or credit markets including changes affecting the timely availability and cost of capital; changes in customer demand; effects of adverse economic conditions affecting shippers or BNSF’s supplier base; effects due to more stringent regulatory policies such as the regulation of greenhouse gas emissions that could reduce the demand for coal or governmental tariffs or subsidies that could affect the demand for grain; the impact of low natural gas or oil prices on energy-related commodities demand; changes in environmental laws and other laws and regulations that could affect the demand for drilling products and products produced by drilling; changes in prices of fuel and other key materials, the impact of high barriers to entry for prospective new suppliers and disruptions in supply chains for these materials; competition and consolidation within the transportation industry; and changes in crew availability, labor and benefits costs and labor difficulties, including stoppages affecting either BNSF’s operations or customers’ abilities to deliver goods to BNSF for shipment.
• Legal, legislative and regulatory factors: developments and changes in laws and regulations, including those affecting train operations, the marketing of services or regulatory restrictions on equipment; the ultimate outcome of shipper and rate claims subject to adjudication; claims, investigations or litigation alleging violations of the antitrust laws; increased economic regulation of the rail industry through legislative action and revised rules and standards applied by the U.S. Surface Transportation Board in various areas including rates and services; developments in environmental investigations or proceedings with respect to rail operations or current or past ownership or control of real property or properties owned by others impacted by BNSF operations; losses resulting from claims and litigation relating to personal injuries, asbestos and other occupational diseases; the release of hazardous materials, environmental contamination and damage to property; regulation, restrictions or caps, or other controls on transportation of energy-related commodities or other operating restrictions that could affect operations or increase costs; the availability of adequate insurance to cover the risks associated with operations; and changes in tax rates and tax laws.
• Operating factors: changes in operating conditions and costs; operational and other difficulties in implementing positive train control technology, including increased compliance or operational costs or penalties; restrictions on development and expansion plans due to environmental concerns; disruptions to BNSF’s technology network including computer systems and software, such as cybersecurity intrusions, misappropriation of assets or sensitive information, corruption of data or operational disruptions; network congestion, including effects of greater than anticipated demand for transportation services and equipment; as well as natural events such as severe weather, fires, floods and earthquakes or man-made or other disruptions of BNSF’s or other railroads’ operating systems, structures, or equipment including the effects of acts of terrorism on the Company’s system or other railroads’ systems or other links in the transportation chain.
The Company cautions against placing undue reliance on forward-looking statements, which reflect its current beliefs and are based on information currently available to it as of the date a forward-looking statement is made. The Company undertakes no obligation to revise forward-looking statements to reflect future events, changes in circumstances, or changes in beliefs. In the event the Company does update any forward-looking statement, no inference should be made that the Company will make additional updates with respect to that statement, related matters, or any other forward-looking statements.

Table of Contents
13
Item 7A. Quantitative and Qualitative Disclosures About Market Risk Commodity Price SensitivityAt December 31, 2017, BNSF maintained fuel inventories for use in normal operations, which were not material to BNSF’s overall financial position and, therefore, represent no significant market exposure. The frequency of BNSF’s fuel inventory turnover also reduces market exposure, should fuel inventories become material to BNSF’s overall financial position.
Interest Rate SensitivityAt December 31, 2017, the fair value of BNSF’s debt, excluding capital leases and unamortized gains on interest rate swaps, was $25,062 million. The following table is an estimate of the impact to the fair value of total debt, excluding capital leases and unamortized gains on interest rate swaps, that could result from hypothetical interest rate changes during the twelve-month period ending December 31, 2018, based on debt levels as of December 31, 2017:
Sensitivity Analysis
Hypothetical Changein Interest Rates
Change in Fair ValueTotal Debt
1-percent decrease $3,006 million increase1-percent increase $2,496 million decrease
Information on the Company’s debt, which may be sensitive to interest rate fluctuations, is incorporated by reference from Note 11 to the Consolidated Financial Statements.

Table of Contents
14
Item 8. Financial Statements and Supplementary Data The Consolidated Financial Statements of BNSF and subsidiary companies, together with the report of the Company’s independent registered public accounting firm, are included as part of this filing. The following documents are filed as a part of this report:
Consolidated Financial StatementsReport of Independent Registered Public Accounting Firm
Consolidated Statements of Income for the years ended December 31, 2017, 2016 and 2015
Consolidated Statements of Comprehensive Income for the years ended December 31, 2017, 2016 and 2015
Consolidated Balance Sheets as of December 31, 2017 and 2016
Consolidated Statements of Cash Flows for the years ended December 31, 2017, 2016 and 2015
Consolidated Statements of Changes in Equity for the years ended December 31, 2017, 2016 and 2015
Notes to Consolidated Financial Statements
15
16
17
18
19
20
21

Table of Contents
15
Report of Independent Registered Public Accounting Firm
To the Board of Managers and Member ofBurlington Northern Santa Fe, LLC Opinion on the Financial Statements
We have audited the accompanying consolidated balance sheets of Burlington Northern Santa Fe, LLC and subsidiaries (the “Company”) as of December 31, 2017 and 2016, and the related consolidated statements of income, comprehensive income, changes in equity, and cash flows for each of the three years in the period ended December 31, 2017, and the related notes (collectively referred to as the “financial statements”). In our opinion, the financial statements present fairly, in all material respects, the financial position of the Company as of December 31, 2017 and 2016, and the results of its operations and its cash flows for each of the three years in the period ended December 31, 2017, in conformity with accounting principles generally accepted in the United States of America.
Basis for Opinion
These financial statements are the responsibility of the Company's management. Our responsibility is to express an opinion on the Company’s financial statements based on our audits. We are a public accounting firm registered with the Public Company Accounting Oversight Board (United States) (PCAOB) and are required to be independent with respect to the Company in accordance with the U.S. federal securities laws and the applicable rules and regulations of the Securities and Exchange Commission and the PCAOB.
We conducted our audits in accordance with the standards of the PCAOB. Those standards require that we plan and perform the audit to obtain reasonable assurance about whether the financial statements are free of material misstatement, whether due to error or fraud. The Company is not required to have, nor were we engaged to perform, an audit of its internal control over financial reporting. As part of our audits, we are required to obtain an understanding of internal control over financial reporting but not for the purpose of expressing an opinion on the effectiveness of the Company’s internal control over financial reporting. Accordingly, we express no such opinion.
Our audits included performing procedures to assess the risks of material misstatement of the financial statements, whether due to error or fraud, and performing procedures that respond to those risks. Such procedures included examining, on a test basis, evidence regarding the amounts and disclosures in the financial statements. Our audits also included evaluating the accounting principles used and significant estimates made by management, as well as evaluating the overall presentation of the financial statements. We believe that our audits provide a reasonable basis for our opinion.
/s/ DELOITTE & TOUCHE LLP Fort Worth, TexasFebruary 23, 2018
We have served as the Company’s auditor since 2010.

Table of Contents
16
Burlington Northern Santa Fe, LLC and Subsidiaries
Consolidated Statements of IncomeIn millions
Year Ended Year Ended Year Ended
December 31,
2017December 31,
2016December 31,
2015Revenues $ 21,387 $ 19,829 $ 21,967Operating expenses: Compensation and benefits 4,969 4,769 5,043 Fuel 2,518 1,934 2,656 Purchased services 2,514 2,418 2,546 Depreciation and amortization 2,352 2,128 2,001 Equipment rents 784 766 801 Materials and other 903 1,129 1,196 Total operating expenses 14,040 13,144 14,243 Operating income 7,347 6,685 7,724Interest expense 1,016 992 928Other expense, net 3 — 21 Income before income taxes 6,328 5,693 6,775Income tax expense (benefit) (4,972) 2,124 2,527 Net income $ 11,300 $ 3,569 $ 4,248
See accompanying Notes to Consolidated Financial Statements.
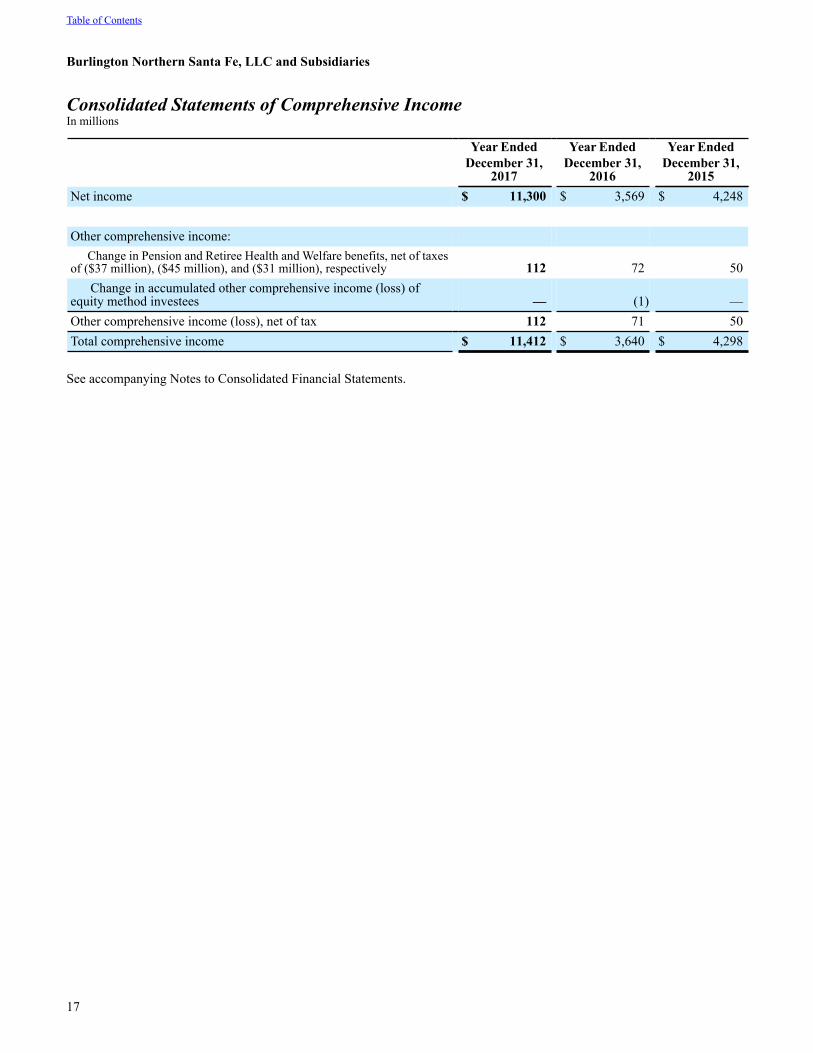
Table of Contents
17
Burlington Northern Santa Fe, LLC and Subsidiaries
Consolidated Statements of Comprehensive IncomeIn millions
Year Ended Year Ended Year Ended
December 31,
2017December 31,
2016December 31,
2015Net income $ 11,300 $ 3,569 $ 4,248
Other comprehensive income: Change in Pension and Retiree Health and Welfare benefits, net of taxes of ($37 million), ($45 million), and ($31 million), respectively 112 72 50 Change in accumulated other comprehensive income (loss) ofequity method investees — (1) —Other comprehensive income (loss), net of tax 112 71 50Total comprehensive income $ 11,412 $ 3,640 $ 4,298
See accompanying Notes to Consolidated Financial Statements.

Table of Contents
18
Burlington Northern Santa Fe, LLC and Subsidiaries
Consolidated Balance SheetsIn millions
December 31,
2017December 31,
2016Assets Current assets: Cash and cash equivalents $ 1,975 $ 3,218 Accounts receivable, net 1,448 1,272 Materials and supplies 803 825 Other current assets 408 235 Total current assets 4,634 5,550
Property and equipment, net of accumulated depreciation of $8,627 and $6,130,respectively 62,313 61,250Goodwill 14,845 14,845Intangible assets, net 394 430Other assets 2,337 2,047
Total assets $ 84,523 $ 84,122
Liabilities and Equity Current liabilities: Accounts payable and other current liabilities $ 3,169 $ 3,438 Long-term debt due within one year 740 735 Total current liabilities 3,909 4,173
Long-term debt 21,759 21,309Deferred income taxes 13,452 19,866Casualty and environmental liabilities 499 584Intangible liabilities, net 471 567Pension and retiree health and welfare liability 310 321Other liabilities 1,114 1,130
Total liabilities 41,514 47,950Commitments and contingencies (see Notes 11 and 12)Equity: Member's equity 42,778 36,053 Accumulated other comprehensive income (loss) 231 119
Total equity 43,009 36,172Total liabilities and equity $ 84,523 $ 84,122
See accompanying Notes to Consolidated Financial Statements.

Table of Contents
19
Burlington Northern Santa Fe, LLC and Subsidiaries
Consolidated Statements of Cash FlowsIn millions
Year Ended Year Ended Year Ended
December 31,
2017December 31,
2016December 31,
2015Operating Activities Net income $ 11,300 $ 3,569 $ 4,248Adjustments to reconcile net income to net cash provided by operating activities:
Depreciation and amortization 2,352 2,128 2,001 Deferred income taxes (6,435) 998 1,148 Long-term casualty and environmental liabilities, net (85) (35) (35) Other, net (289) 27 (47)Changes in current assets and liabilities: Accounts receivable, net (177) (74) 196 Materials and supplies 22 4 (34) Other current assets (163) (129) (4) Accounts payable and other current liabilities (206) 437 (298) Net cash provided by operating activities 6,319 6,925 7,175
Investing Activities Capital expenditures excluding equipment (2,860) (3,205) (4,425)Acquisition of equipment (397) (614) (1,226)Purchases of investments and investments in time deposits (13) (8) (151)Proceeds from sales of investments and maturities of time deposits 34 27 27Partnership investment — — (36)Other, net (247) (181) (16) Net cash used for investing activities (3,483) (3,981) (5,827)
Financing Activities Proceeds from issuance of long-term debt 1,250 750 3,000Payments on long-term debt (735) (292) (371)Cash distributions (4,575) (2,500) (4,000)Other, net (19) (13) (32) Net cash used for financing activities (4,079) (2,055) (1,403)Increase (decrease) in cash and cash equivalents (1,243) 889 (55)Cash and cash equivalents: Beginning of period 3,218 2,329 2,384 End of period $ 1,975 $ 3,218 $ 2,329
Supplemental Cash Flow Information Interest paid, net of amounts capitalized $ 1,062 $ 1,016 $ 953Capital investments accrued but not yet paid $ 192 $ 305 $ 421Income taxes paid, net of refunds $ 1,789 $ 752 $ 1,281
See accompanying Notes to Consolidated Financial Statements.

Table of Contents
20
Burlington Northern Santa Fe, LLC and Subsidiaries
Consolidated Statements of Changes in EquityIn millions
Member'sEquity
Accumulated Other
Comprehensive (Loss) Income
TotalEquity
Balance at December 31, 2014 $ 34,736 $ (2) $ 34,734Comprehensive income, net of tax 4,248 50 4,298Cash distributions to Parent (4,000) — (4,000)Balance at December 31, 2015 34,984 48 35,032Comprehensive income, net of tax 3,569 71 3,640Cash distributions to Parent (2,500) — (2,500)Balance at December 31, 2016 36,053 119 36,172Comprehensive income, net of tax 11,300 112 11,412Cash distributions to Parent (4,575) — (4,575)Balance at December 31, 2017 $ 42,778 $ 231 $ 43,009
See accompanying Notes to Consolidated Financial Statements.

Table of Contents
21
Burlington Northern Santa Fe, LLC and Subsidiaries
Notes to Consolidated Financial Statements
1. The Company Burlington Northern Santa Fe, LLC (BNSF or the Company) is a holding company that conducts no operating activities and owns no significant assets other than through its interests in its subsidiaries. BNSF’s principal, wholly-owned subsidiary is BNSF Railway Company (BNSF Railway), which operates one of the largest railroad networks in North America. BNSF Railway operates approximately 32,500 route miles of track (excluding multiple main tracks, yard tracks and sidings) in 28 states and also operates in three Canadian provinces. Through one operating transportation services segment, BNSF Railway transports a wide range of products and commodities including the transportation of Consumer Products, Industrial Products, Agricultural Products, and Coal, derived from manufacturing, agricultural and natural resource industries, which constituted 35 percent, 25 percent, 21 percent, and 19 percent, respectively, of total freight revenues for the year ended December 31, 2017. These Consolidated Financial Statements include BNSF, BNSF Railway and other majority-owned subsidiaries, all of which are separate legal entities. Burlington Northern Santa Fe Corporation was incorporated in the State of Delaware on December 16, 1994. On February 12, 2010, Berkshire Hathaway Inc., a Delaware corporation (Berkshire), acquired 100 percent of the outstanding shares of Burlington Northern Santa Fe Corporation common stock that it did not already own. The acquisition was completed through the merger (Merger) of a Berkshire wholly-owned merger subsidiary and Burlington Northern Santa Fe Corporation with the surviving entity renamed Burlington Northern Santa Fe, LLC. Berkshire’s cost of acquiring BNSF was pushed-down to establish a new accounting basis for BNSF beginning as of February 13, 2010. Earnings per share data is not presented because BNSF has only one holder of its membership interests.
2. Significant Accounting Policies Principles of ConsolidationThe Consolidated Financial Statements include the accounts of BNSF, including its principal subsidiary BNSF Railway. All intercompany accounts and transactions have been eliminated. The Company evaluates its less than majority-owned investments for consolidation pursuant to authoritative accounting guidance related to the consolidation of variable interest entities (VIEs). The Company consolidates a VIE when it possesses both the power to direct the activities of the VIE that most significantly impact its economic performance and when the Company is either obligated to absorb the losses that could potentially be significant to the VIE or the Company holds the right to receive benefits from the VIE that could potentially be significant to the VIE. Use of EstimatesThe preparation of financial statements in accordance with generally accepted accounting principles in the United States of America (GAAP) requires management to make estimates and assumptions that affect the reported amounts of assets and liabilities and disclosure of contingent assets and liabilities at the date of the financial statements and the reported amounts of revenues and expenses during the periods presented. These estimates and assumptions are periodically reviewed by management. Actual results could differ from those estimates.
Revenue RecognitionTransportation revenues are recognized based upon the proportion of service provided as of the balance sheet date, with related expenses recognized as incurred. Revenues from ancillary services are recognized when performed. Customer incentives, which are primarily provided for shipping a specified cumulative volume or shipping to/from specific locations, are recorded as a reduction to revenue on a pro-rata basis based on actual or projected future customer shipments. When using projected shipments, the Company relies on historical trends as well as economic and other indicators to estimate the liability for customer incentives. Accounts Receivable, NetAccounts receivable, net includes accounts receivable reduced by an allowance for bill adjustments and uncollectible accounts. The allowance for bill adjustments and uncollectible accounts is based on historical experience as well as any known trends or uncertainties related to customer billing and account collectibility. Receivables are generally written off against allowances after all reasonable collection efforts are exhausted.

Table of Contents
22
Cash and Cash EquivalentsAll short-term investments with maturities of 90 days or less from the date of purchase are considered cash equivalents. Cash equivalents are stated at cost, which approximates market value because of the short maturity of these instruments.
Investments in Equity and Fixed Maturity SecuritiesInvestments in fixed maturity securities and equity securities are classified at the acquisition date and the classification is re-evaluated at each balance sheet date. Trading securities are investments acquired with the intent to sell in the near term and are carried at fair value. All investments currently held are classified as trading securities and gains or losses are recorded in income. Materials and SuppliesMaterials and supplies, which consist mainly of rail, ties and other items for construction and maintenance of property and equipment, as well as diesel fuel, are valued at the lower of average cost or market. Goodwill and Other Intangible Assets and LiabilitiesGoodwill is the excess of the cost of an acquired entity over the net of the amounts assigned to assets acquired and liabilities assumed. Goodwill is tested for impairment annually or more frequently if events or circumstances indicate that the carrying amount may not be recoverable. The impairment test involves a two-step process. The first step is to estimate the fair value of the reporting unit using valuation models such as discounting projected future net cash flows and/or a multiple of earnings. If the carrying amount of a reporting unit, including goodwill, exceeds the estimated fair value, a second step is performed. Under the second step, the identifiable assets and liabilities, including identifiable intangible assets and liabilities, of the reporting unit are estimated at fair value as of the current testing date. The excess of the estimated fair value of the reporting unit over the estimated fair value of net assets establishes the implied value of goodwill. If the carrying amount of goodwill exceeds the implied value of goodwill, an impairment loss is recognized in an amount equal to that excess. Other intangible assets and liabilities are amortized based on the estimated pattern in which the economic benefits are expected to be consumed or on a straight-line basis over their estimated economic lives. Other intangible assets and liabilities are reviewed for impairment when events or changes in circumstances indicate that the carrying amount may not be recoverable or realized. See Note 8 to the Consolidated Financial Statements for further information related to goodwill and other intangible assets and liabilities. Property and Equipment, NetBNSF’s railroad operations are highly capital intensive and its large base of homogeneous, network-type assets turns over on a continuous basis. Each year BNSF develops a capital program for the replacement of assets and for the acquisition or construction of assets intended to enable BNSF to increase capacity, enhance the efficiency of operations, gain strategic benefit or provide new service offerings to customers. Assets purchased or constructed throughout the year are capitalized if they meet applicable minimum units of property criteria. Normal repairs and maintenance are charged to operating expense as incurred, while costs incurred that extend the useful life of an asset, improve the safety of BNSF’s operations, improve operating efficiency, or significantly increase asset values are capitalized. Property and equipment are stated at cost and are depreciated and amortized on a straight-line basis over their estimated useful lives. The Company uses the group method of depreciation in which a single depreciation rate is applied to the gross investment in a particular class of property, despite differences in the service life or salvage value of individual property units within the same class. The Company conducts studies of depreciation rates and the required accumulated depreciation balance as required by the Surface Transportation Board (STB), which is generally every three years for equipment and every six years for track structure and other roadway property. These detailed studies form the basis for the Company’s depreciation methods used in accordance with GAAP. There are no differences between assumptions used in determining average service lives between STB reporting and GAAP.

Table of Contents
23
Depreciation studies take into account the following factors:
• Statistical analysis of historical patterns of use and retirements of each of BNSF’s asset classes;
• Evaluation of any expected changes in current operations and the outlook for continued use of the assets;
• Evaluation of technological advances and changes to maintenance practices; and
• Expected salvage to be received upon retirement.
Changes in the estimated service lives of the assets and their related depreciation rates are implemented prospectively. Currently, BNSF is not aware of any specific factors that would cause significant changes in average useful service lives. Under group depreciation, the historical cost net of salvage of depreciable property that is retired or replaced in the ordinary course of business is charged to accumulated depreciation and no gain or loss is recognized. This historical cost of certain assets is estimated as it is impracticable to track individual, homogeneous network-type assets. Historical costs are estimated by deflating current costs using the Producer Price Index (PPI) or a unit cost method. These methods closely correlate with the major costs of the items comprising the asset classes. Because of the number of estimates inherent in the depreciation and retirement processes and because it is impossible to precisely estimate each of these variables until a group of property is completely retired, BNSF monitors the estimated service lives of its assets and the accumulated depreciation associated with each asset class to ensure its depreciation rates are appropriate. For retirements of depreciable asset classes that do not occur in the normal course of business, a gain or loss may be recognized in operating expense if the retirement meets each of the following conditions: (i) is unusual, (ii) is significant in amount, and (iii) varies significantly from the retirement profile identified through BNSF’s depreciation studies. During the three fiscal years presented, no material gains or losses were recognized due to the retirement of depreciable assets. Gains or losses from disposals of land and non-rail property are recorded at the time of their occurrence. When BNSF purchases an asset, all costs necessary to make the asset ready for its intended use are capitalized. BNSF self-constructs portions of its track structure and rebuilds certain classes of rolling stock. Expenditures that extend the useful life of an asset, improve the safety of BNSF's operations, improve operating efficiency, or significantly increase asset values are capitalized. In addition to direct labor and material, certain indirect costs such as materials, small tools and project supervision are capitalized. Annually, a study is performed for the purpose of identifying indirect costs that clearly relate to capital projects. From those studies, an overhead application rate is developed. Indirect project costs are then allocated to capital projects using this overhead application rate. BNSF incurs certain direct labor, contract service and other costs associated with the development and installation of internal-use computer software. Costs for newly developed software or significant enhancements to existing software are typically capitalized. Research, preliminary project, operations, maintenance and training costs are charged to operating expense when the work is performed. Assets held under capital leases are recorded at the lower of the net present value of the minimum lease payments or at the fair value of the leased assets at the inception of the lease. Amortization expense is computed using the straight-line method over the shorter of the estimated useful lives of the assets or the period of the related lease. Leasehold improvements that meet capitalization criteria are capitalized and amortized on a straight-line basis over the lesser of their estimated useful lives or the remaining lease term. Long-lived assets are reviewed for impairment when events or changes in circumstances indicate that the carrying amount of an asset may not be recoverable. If impairment indicators are present and the estimated future undiscounted cash flows are less than the carrying value of the long-lived assets, the carrying value is reduced to the estimated fair value as measured by the discounted cash flows. Planned Major Maintenance ActivitiesBNSF utilizes the deferral method of accounting for leased locomotive overhauls, which includes the complete refurbishment of the engine and related components which extends the useful life of the locomotive. Accordingly, BNSF has established an asset for overhauls that have been performed. This asset, which is included in property and equipment, net in the Consolidated Balance Sheets, is amortized to expense using the straight-line method until the next overhaul is performed, typically between six and tenyears.
Table of Contents
24
Rail Grinding CostsBNSF uses the direct expense method of accounting for rail grinding costs, under which the Company expenses rail grinding costs as incurred.
Environmental LiabilitiesLiabilities for environmental cleanup costs are initially recorded when BNSF’s liability for environmental cleanup is both probable and reasonably estimable. Subsequent adjustments to initial estimates are recorded as necessary based upon additional information developed in subsequent periods. Estimates for these liabilities are undiscounted.
Personal Injury ClaimsLiabilities for personal injury claims are initially recorded when the expected loss is both probable and reasonably estimable. Subsequent adjustments to initial estimates are recorded as necessary based upon additional information developed in subsequent periods. Liabilities recorded for unasserted personal injury claims, including those related to asbestos, are based on information currently available. Estimates of liabilities for personal injury claims are undiscounted.
Income TaxesDeferred tax assets and liabilities are measured using the tax rates that apply to taxable income in the period in which the deferred tax asset or liability is expected to be realized or paid. Changes in the Company’s estimates regarding the statutory tax rate to be applied to the reversal of deferred tax assets and liabilities could materially affect the effective tax rate. Valuation allowances are established to reduce deferred tax assets if it is more likely than not that some or all of the deferred tax asset will not be realized. BNSF has not recorded a valuation allowance, as it believes that the deferred tax assets will be fully realized in the future. Investment tax credits are accounted for using the flow-through method. The Company recognizes the tax benefit from an uncertain tax position only if it is more likely than not that the tax position will be sustained on examination by the taxing authorities, based on the technical merits of the position. The tax benefits recognized in the financial statements from such a position are measured based on the largest benefit that has a greater than fifty percent likelihood of being realized upon ultimate settlement. BNSF is included in the U.S. consolidated federal income tax return of Berkshire. In addition, BNSF files income tax returns in state, local and foreign jurisdictions, as applicable. BNSF’s tax expense and liabilities have been computed on a stand alone basis, and all of its current federal income taxes payable is remitted to Berkshire. Employment Benefit PlansThe Company estimates liabilities and expenses for pension and retiree health and welfare plans. Estimated amounts are based on historical information, current information and estimates regarding future events and circumstances. Significant assumptions used in the valuation of pension and/or retiree health and welfare liabilities include the expected return on plan assets, discount rate, rate of increase in compensation levels and the health care cost trend rate. Fair Value MeasurementsAs defined under authoritative accounting guidance, fair value is the price that would be received to sell an asset or paid to transfer a liability between market participants in the principal market or in the most advantageous market when no principal market exists. Adjustments to transaction prices or quoted market prices may be required in illiquid or disorderly markets in order to estimate fair value. Different valuation techniques may be appropriate under the circumstances to determine the value that would be received to sell an asset or paid to transfer a liability in an orderly transaction. Market participants are assumed to be independent, knowledgeable, able and willing to transact an exchange and not under duress. Nonperformance or credit risk is considered in determining the fair value of liabilities. Considerable judgment may be required in interpreting market data used to develop the estimates of fair value. Accordingly, estimates of fair value presented herein are not necessarily indicative of the amounts that could be realized in a current or future market exchange. The authoritative accounting guidance specifies a three-level hierarchy of valuation inputs which was established to increase consistency, clarity and comparability in fair value measurements and related disclosures.
• Level 1–Quoted prices for identical assets or liabilities in active markets that the Company has the ability to access at the measurement date.
• Level 2–Quoted prices for similar assets or liabilities in active markets; quoted prices for identical or similar assets or liabilities in markets that are not active; and model-derived valuations in which all significant inputs are observable market data.
• Level 3–Valuations derived from valuation techniques in which one or more significant inputs are unobservable.

Table of Contents
25
3. Accounting Pronouncements
In May 2014, the Financial Accounting Standards Board (FASB) issued Accounting Standards Update No. 2014-09 (ASU 2014-09), Revenue from Contracts with Customers (Topic 606). The guidance in ASU 2014-09 supersedes the revenue recognition requirements in Accounting Standards Codification (ASC) Topic 605, Revenue Recognition. ASU 2014-09 applies to most contracts with customers. Insurance and leasing contracts are excluded from the scope. ASU 2014-09 prescribes a five-step framework in accounting for revenues from contracts within its scope, including (a) identification of the contract, (b) identification of the performance obligation under the contract, (c) determination of the transaction price, (d) allocation of the transaction price to the identified performance obligation and (e) recognition of revenue as the identified performance obligation is satisfied. ASU 2014-09 also prescribes additional disclosures and financial statement presentations. ASU 2014-09 is effective for public companies in annual reporting periods beginning after December 15, 2017. ASU 2014-09 may be adopted retrospectively or under a modified retrospective method where the cumulative effect is recognized at the date of initial application. Under the new standard, the Company will continue to recognize transportation revenues based upon the proportion of the service provided as of the balance sheet date. Furthermore, the Company will assess variable consideration at each reporting period. The Company adopted the standard as of January 1, 2018 (using the modified retrospective method), resulting in an immaterial impact to the Consolidated Financial Statements. In February 2016, the FASB issued Accounting Standards Update No. 2016-02 (ASU 2016-02), Leases (Topic 842). The guidance in ASU 2016-02 supersedes the lease recognition requirements in ASC Topic 840, Leases (FAS 13). ASU 2016-02 requires an entity to recognize assets and liabilities arising from a lease for both financing and operating leases, along with additional qualitative and quantitative disclosures. ASU 2016-02 is effective for fiscal years beginning after December 15, 2018, with early adoption permitted. At December 31, 2017, BNSF had long-term operating leases with $3.0 billion of remaining minimum lease payments. This new standard will require the present value of these leases to be recorded in the Consolidated Balance Sheets as a right of use asset and lease liability.
In March 2017, the FASB issued Accounting Standards Update No. 2017-07 (ASU 2017-07), Compensation-Retirement Benefits (Topic 715): Improving the Presentation of Net Periodic Pension Cost and Net Periodic Postretirement Benefit Cost. ASU 2017-07 requires an entity to present the service cost component of net benefit cost in the same line item as other current employee compensation costs (including being capitalized, if appropriate, as part of an asset). The other components of net benefit cost will be presented below income from operations. ASU 2017-07 is effective for fiscal years beginning after December 15, 2017 with early adoption permitted. The retrospective application of ASU 2017-07 will decrease operating income for the year ended December 31, 2017 by $54 million when it is adopted in 2018. However, it will have no impact on net income. See Note 13 to the Consolidated Financial Statements.
In February 2018, the FASB issued Accounting Standards Update No. 2018-02 (ASU 2018-02), Income Statement - Reporting Comprehensive Income (Topic 220). The guidance in ASU 2018-02 allows an entity to elect to reclassify the stranded tax effects related to the Tax Cuts and Jobs Act (the Tax Act) of 2017 from accumulated other comprehensive income into retained earnings. ASU 2018-02 is effective for fiscal years beginning after December 15, 2018, with early adoption permitted. The Company is currently evaluating the effect this standard will have on its Consolidated Financial Statements.

Table of Contents
26
4. Income Taxes Income tax expense was as follows (in millions):
Year Ended Year Ended Year Ended
December 31,
2017December 31,
2016December 31,
2015Current: Federal $ 1,286 $ 999 $ 1,211 State 163 127 168
Total current 1,449 1,126 1,379Deferred: Federal (6,555) 901 1,097 State 134 97 51
Total deferred (6,421) 998 1,148 Total $ (4,972) $ 2,124 $ 2,527
Reconciliation of the U.S. federal statutory income tax rate to the effective tax rate was as follows:
Year Ended Year Ended Year Ended
December 31,
2017December 31,
2016December 31,
2015U.S. Federal statutory income tax rate 35.0 % 35.0% 35.0%State income taxes, net of federal tax benefit 2.9 2.5 2.2Tax law change (116.0) — —Other, net (0.5) (0.2) 0.1 Effective tax rate (78.6)% 37.3% 37.3%
The components of deferred tax assets and liabilities were as follows (in millions):
December 31,
2017December 31,
2016Deferred tax liabilities: Property and equipment $ (13,583) $ (20,634) Other (391) (340) Total deferred tax liabilities (13,974) (20,974)Deferred tax assets: Casualty and environmental 159 278 Compensation and benefits 112 334 Long-term debt fair value adjustment under acquisition method accounting 32 76 Intangible assets and liabilities 32 72 Pension and retiree health and welfare benefits 16 89 Other 171 259 Total deferred tax assets 522 1,108 Net deferred tax liability $ (13,452) $ (19,866)
BNSF is included in the consolidated U.S. federal income tax return of Berkshire. BNSF’s tax expense and liabilities have been computed on a stand-alone basis, and all of its currently payable federal income taxes are remitted to Berkshire. See Note 14 to the Consolidated Financial Statements for information related to income taxes paid to Berkshire during 2017.

Table of Contents
27
All U.S. federal income tax returns of BNSF are closed for audit through the tax period ending February 12, 2010. BNSF is currently under examination for the period February 13 - December 31, 2010 and years 2011, 2012 and 2013. BNSF and its subsidiaries have various state income tax returns in the process of examination, administrative appeal or litigation. State income tax returns are generally subject to examination for a period of three to five years after filing of the respective return. The state impact of any federal changes remains subject to examination by various states for a period of up to one year after formal notification to the states.
Tax ReformAs a result of the Tax Act signed into law on December 22, 2017, the provision for income taxes for the fourth quarter of 2017 was adjusted to reflect the revaluation of BNSF's deferred tax liability by $7.3 billion as a result of the reduction of the federal income tax rate from 35 percent to 21 percent effective January 1, 2018. The effective tax rate for 2017 was negative 78.6 percent. Without the decrease to income tax expense arising from the Tax Act, the effective tax rate for 2017 would have been positive 37.4 percent.
Uncertain Tax PositionsThe amount of unrecognized tax benefits for the years ended December 31, 2017, 2016 and 2015, was $57 million, $62 million, and $69 million, respectively. The amount of unrecognized tax benefits at December 31, 2017 that would affect the Company’s effective tax rate if recognized was $34 million, computed at the federal income tax rate expected to be applicable in the taxable period in which the amount may be incurred by the Company. A reconciliation of the beginning and ending amount of unrecognized tax benefits is as follows (in millions):
Year Ended Year Ended Year Ended
December 31,
2017December 31,
2016December 31,
2015Beginning balance $ 62 $ 69 $ 78Additions for tax positions related to current year 7 4 7Additions (reductions) for tax positions taken in prior years (1) (1) (8)Additions (reductions) for tax positions as a result of: Settlements — 1 1 Lapse of statute of limitations (11) (11) (9) Ending balance $ 57 $ 62 $ 69
It is expected that the amount of unrecognized tax benefits will change in the next twelve months; however, BNSF does not expect the change to have a significant impact on the results of operations, the financial position or the cash flows of the Company. The Company recognizes interest accrued related to unrecognized tax benefits in interest expense and penalties in income tax expense in the Consolidated Statements of Income, which is consistent with the recognition of these items in prior reporting periods. The Company had recorded a liability of approximately $6 million and $5 million for interest and penalties for the years ended December 31, 2017 and 2016, respectively. For the years ended December 31, 2017 and 2016, the incremental interest and penalty expense recognized each year was less than $1 million. For the year ended December 31, 2015, the Company recognized a reduction of approximately $4 million in interest and penalty expense.
5. Accounts Receivable, Net Accounts receivable, net consists of freight and other receivables, reduced by an allowance for bill adjustments and uncollectible accounts, based upon expected collectibility. At December 31, 2017 and 2016, $87 million and $88 million, respectively, of such allowances had been recorded.
At December 31, 2017 and 2016, $82 million and $88 million, respectively, of accounts receivable were greater than 90 days old.

Table of Contents
28
6. Investments BNSF holds investments which are classified as trading securities and included in Other Assets on the balance sheet. The following table summarizes the fair value of investments held as of December 31, 2017 and December 31, 2016 (in millions):
December 31,2017
December 31,2016
Debt securities $ 43 $ 47Equity securities 54 60 Total $ 97 $ 107 The fair value measurements of BNSF’s debt securities are based on Level 2 inputs and equity securities are based on Level 1 inputs, using a market approach. Gains and losses recognized in other (income) expense, net for the Company for the years ended December 31, 2017, 2016, and 2015 were not material.
7. Property and Equipment, Net Property and equipment, net (in millions), and the corresponding ranges of estimated useful lives were as follows:
2017
December 31,
2017December 31,
2016
Range ofEstimatedUseful Life
Land for transportation purposes $ 6,088 $ 6,063 —Track structure 23,217 22,287 15 – 50 yearsOther roadway 28,103 25,990 9 – 100 yearsLocomotives 8,528 8,338 7 – 35 yearsFreight cars and other equipment 2,940 2,755 8 – 41 yearsComputer hardware, software and other 1,075 982 6 – 15 yearsConstruction in progress 989 965 — Total cost 70,940 67,380 Less accumulated depreciation and amortization (8,627) (6,130) Property and equipment, net $ 62,313 $ 61,250
The Consolidated Balance Sheets at December 31, 2017 and 2016, included $687 million, net of $382 million of amortization, and $738 million, net of $333 million of amortization, respectively, for property and equipment under capital leases, primarily for rolling stock.
The Company capitalized $22 million, $26 million and $34 million of interest for the years ended December 31, 2017, 2016 and 2015, respectively.

Table of Contents
29
8. Goodwill and Other Intangible Assets and Liabilities
During the years ended December 31, 2017, 2016 and 2015, no impairment losses related to goodwill were incurred. As of December 31, 2017 and 2016, there were no accumulated impairment losses related to goodwill. For both the years ended December 31, 2017 and 2016, the carrying values were $14,845 million and no additional goodwill was recognized.
Intangible assets and liabilities were as follows (in millions):
As of December 31, 2017 As of December 31, 2016
Gross CarryingAmount
AccumulatedAmortization
Gross CarryingAmount
AccumulatedAmortization
Intangible assets $ 647 $ 253 $ 661 $ 231Intangible liabilities $ 1,403 $ 932 $ 1,403 $ 836
As of December 31, 2017 and 2016, intangible assets primarily consisted of franchise and customer assets. Intangible liabilities primarily consisted of customer and shortline contracts which were in an unfavorable position at the date of Merger.
Amortizable intangible assets and liabilities are amortized based on the estimated pattern in which the economic benefits are expected to be consumed or on a straight-line basis over their estimated economic lives.
Amortization of intangible assets and liabilities was as follows (in millions):
December 31,
2017December 31,
2016December 31,
2015Amortization of intangible assets $ 36 $ 39 $ 58Amortization of intangible liabilities $ 96 $ 100 $ 115
Amortization of intangible assets and liabilities for the next five years is expected to approximate the following (in millions):
Amortization ofintangible assets
Amortization ofintangible liabilities
2018 $ 33 $ 902019 $ 31 $ 272020 $ 31 $ 262021 $ 31 $ 242022 $ 31 $ 23

Table of Contents
30
9. Other Assets In July 2010, the Company entered into a low-income housing partnership (the Partnership) as the limited partner, holding a 99.9 percent interest in the Partnership. The Partnership is a VIE, with the purpose of developing and operating low-income housing rental properties. Recovery of the Company’s investment is accomplished through the utilization of low-income housing tax credits and the tax benefits of Partnership losses. The general partner, who holds a 0.1 percent interest in the Partnership, is an unrelated third party and is responsible for controlling and managing the business and financial operation of the Partnership. As the Company does not have the power to direct the activities that most significantly impact the Partnership’s economic performance, the Company is not the primary beneficiary and therefore, does not consolidate the Partnership. The Company does not provide financial support to the Partnership that it was not previously contractually obligated to provide.
The Company has accounted for its investment in the Partnership using the effective yield method. The risk of loss of the Company’s investment in the Partnership is considered low as an affiliate of the general partner has provided certain guarantees of tax credits and minimum annual returns. For the years ended December 31, 2017, 2016, and 2015, the Company recognized a reduction to income tax expense of $8 million, $39 million, and $29 million, respectively. The current year reduction to income tax expense was lower than prior year reductions primarily as a result of the Tax Act. The Company’s maximum exposure to loss related to the Partnership is the unamortized investment balance. The following table provides information related to this Partnership (in millions):
Year Ended Year EndedDecember 31,
2017December 31,
2016Unamortized investment balance classified as Other Assets $ 118 $ 196Maximum exposure to loss $ 118 $ 196
Included within Other Assets are capitalized right-to-use fixed assets of $958 million and $895 million, and related accumulated amortization of $287 million and $265 million, at December 31, 2017 and 2016, respectively.
10. Accounts Payable and Other Current Liabilities Accounts payable and other current liabilities consisted of the following (in millions):
December 31,
2017December 31,
2016Compensation and benefits payable $ 857 $ 776Accounts payable 309 487Property and income tax liabilities 301 497Accrued interest 289 300Customer incentives 201 149Capital expenditure estimated liabilities 167 202Casualty and environmental liabilities 125 125Rents and leases 109 117Other 811 785 Total $ 3,169 $ 3,438

Table of Contents
31
11. Debt
Debt outstanding was as follows (in millions):
December 31, 2017 a December 31, 2016 a
Notes and debentures, due 2018 to 2097 $ 21,245 4.8% $ 20,651 4.8%Equipment obligations, due 2018 to 2028 493 3.6 516 3.6Capitalized lease obligations, due 2018 to 2029 466 6.1 512 6.1Mortgage bonds, due 2020 to 2047 81 4.5 81 4.5Financing obligations, due 2018 to 2029 211 6.3 226 6.3Unamortized fair value adjustment under acquisition methodaccounting, discount and other, net 3 58 Total 22,499 22,044 Less current portion of long-term debt (740) 5.7% (735) 5.6% Long-term debt $ 21,759 $ 21,309
a Amounts represent debt outstanding and weighted average effective interest rates for 2017 and 2016, respectively. Maturities are as of December 31, 2017.
As of December 31, 2017, certain BNSF Railway properties and other assets were subject to liens securing $81 million of mortgage debt. Certain locomotives and rolling stock of BNSF Railway were subject to equipment obligations and capital leases.
The Company is required to maintain certain financial covenants in conjunction with $500 million of certain issued and outstanding junior subordinated notes. As of December 31, 2017, the Company was in compliance with these financial covenants.
The fair value of BNSF’s long-term debt is primarily based on market value price models using observable market-based data for the same or similar issues, or on the estimated rates that would be offered to BNSF for debt of the same remaining maturities (Level 2 inputs). Capital leases and unamortized gains on interest rate swaps have been excluded from the calculation of fair value for both 2017 and 2016.
The following table provides fair value information for the Company’s debt obligations including principal cash flows, related weighted average interest rates by contractual maturity dates and fair value. The Company had no outstanding variable rate debt at December 31, 2017.
December 31, 2017 Maturity Date
TotalIncluding
CapitalLeases
Total Excluding
CapitalLeases a,b
Fair Value
Excluding Capital
Leases b 2018 2019 2020 2021 2022 ThereafterFixed-rate debt (in millions) $740 $836 $571 $918 $1,557 $17,877 $22,499 $22,030 $25,062Average interest rate 5.7% 4.8% 5.7% 4.3% 4.1% 4.8% 4.8%
a Amount also excludes unamortized fair value adjustment under acquisition method accounting related to capital leases.b Amount also excludes unamortized gains on interest rate swaps. As of December 31, 2016, the fair value of fixed-rate debt excluding capital leases and unamortized gains on interest rate swaps was $23,618 million.
Notes and Debentures2017In March 2017, the Board of Managers (the Board) of the Company authorized an additional $1.5 billion of debt securities that may be issued pursuant to the debt shelf registration statement filed with the Securities and Exchange Commission (SEC), for a total of $1.75 billion that remains authorized by the Board to be issued through the SEC debt shelf offering process.
In March 2017, BNSF issued $500 million of 3.25 percent debentures due June 15, 2027 and $750 million of 4.125 percentdebentures due June 15, 2047. The net proceeds from the sale of the debentures were used for general corporate purposes, which may include but are not limited to working capital, capital expenditures, repayment of outstanding indebtedness, and distributions.

Table of Contents
32
2016In May 2016, BNSF issued $750 million of 3.9 percent debentures due August 1, 2046. The net proceeds from the sale of the debentures were used for general corporate purposes.
2015In August 2015, BNSF issued $350 million of 3.65 percent debentures due September 1, 2025 and $650 million of 4.7 percentdebentures due September 1, 2045. The net proceeds from the sale of the debentures were used for general corporate purposes.
In March 2015, BNSF issued $500 million of 3.0 percent debentures due April 1, 2025 and $1 billion of 4.15 percent debentures due April 1, 2045. The net proceeds from the sale of the debentures were used for general corporate purposes.
Equipment ObligationIn June 2015, BNSF Railway entered into a 13-year equipment obligation totaling $500 million at 3.442 percent.
Capital LeasesIn 2017 and 2016, additions to capital leases were not material. There were no additions to capital leases in 2015.
GuaranteesAs of December 31, 2017, BNSF has not been called upon to perform under the guarantees specifically disclosed in this footnote and does not anticipate a significant performance risk in the foreseeable future. Debt and other obligations of non-consolidated entities guaranteed by the Company as of December 31, 2017, were as follows (dollars in millions):
Guarantees
BNSFOwnership Percentage
PrincipalAmount
Guaranteed
MaximumFuture
Payments
MaximumRecourseAmount a
RemainingTerm
(in years)CapitalizedObligations
Kinder Morgan EnergyPartners, L.P. 0.5% $ 190 $ 190 $ —
Terminationof
Ownership $ 2 b
Chevron Phillips ChemicalCompany LP —% N/A d N/A d N/A d 10 $ 20 c
a Reflects the maximum amount the Company could recover from a third party other than the counterparty.b Reflects capitalized obligations that are recorded on the Company’s Consolidated Balance Sheet.c Reflects the asset and corresponding liability for the fair value of these guarantees required by authoritative accounting guidance related to guarantees.d There is no cap to the liability that can be sought from BNSF for BNSF’s negligence or the negligence of the indemnified party. However, BNSF could receive reimbursement from certain insurance policies if the liability exceeds a certain amount.
Kinder Morgan Energy Partners, L.P.Santa Fe Pacific Pipelines, Inc., an indirect, wholly-owned subsidiary of BNSF, has a guarantee in connection with its remaining special limited partnership interest in Santa Fe Pacific Pipeline Partners, L.P. (SFPP), a subsidiary of Kinder Morgan Energy Partners, L.P., to be paid only upon default by the partnership. All obligations with respect to the guarantee will cease upon termination of ownership rights, which would occur upon a put notice issued by BNSF or the exercise of the call rights by the general partners of SFPP. Chevron Phillips Chemical Company LPBNSF has an indemnity agreement with Chevron Phillips Chemical Company LP (Chevron Phillips), granting certain rights of indemnity from BNSF, in order to facilitate access to a storage facility. Under certain circumstances, payment under this obligation may be required in the event Chevron Phillips were to incur certain liabilities or other incremental costs resulting from trackage access.

Table of Contents
33
IndemnitiesIn the ordinary course of business, BNSF enters into agreements with third parties that include indemnification clauses. The Company believes that these clauses are generally customary for the types of agreements in which they are included. At times, these clauses may involve indemnification for the acts of the Company, its employees and agents, indemnification for another party’s acts, indemnification for future events, indemnification based upon a certain standard of performance, indemnification for liabilities arising out of the Company’s use of leased equipment or other property, or other types of indemnification. Despite the uncertainty whether events which would trigger the indemnification obligations would ever occur, the Company does not believe that these indemnity agreements will have a material adverse effect on the Company’s results of operations, financial position or liquidity. Additionally, the Company believes that, due to lack of historical payment experience, the fair value of indemnities cannot be estimated with any amount of certainty and that the fair value of any such amount would be immaterial to the Consolidated Financial Statements. Agreements that reflect unique circumstances, particularly agreements that contain guarantees that indemnify for another party’s acts, are disclosed separately, if appropriate. Unless separately disclosed above, no fair value liability related to indemnities has been recorded in the Consolidated Financial Statements. Variable Interest Entities - LeasesBNSF Railway has entered into various lease transactions in which the structure of the lease contains VIEs. These leases are primarily for equipment. These VIEs were created solely for the lease transactions and have no other activities, assets or liabilities outside of the lease transactions. In some of the arrangements, BNSF Railway has the option to purchase some or all of the leased assets at a fixed-price, thereby creating variable interests for BNSF Railway in the VIEs. The future minimum lease payments associated with the VIE leases were approximately $2 billion as of December 31, 2017. The future minimum lease payments are included in future operating lease payments disclosed in Note 12 to the Consolidated Financial Statements. In the event the leased asset is destroyed, BNSF Railway is generally obligated to either replace the asset or pay a fixed loss amount. The inclusion of the fixed loss amount is a standard clause within the lease arrangements. Historically, BNSF Railway has not incurred significant losses related to this clause. As such, it is not anticipated that the maximum exposure to loss would materially differ from the future minimum lease payments. BNSF Railway does not provide financial support to the VIEs that it was not previously contractually obligated to provide. BNSF Railway maintains and operates the leased assets based on contractual obligations within the lease arrangements, which set specific guidelines consistent within the industry. As such, BNSF Railway has no control over activities that could materially impact the fair value of the leased assets. BNSF Railway does not hold the power to direct the activities of the VIEs and therefore does not control the ongoing activities that have a significant impact on the economic performance of the VIEs. Additionally, BNSF Railway does not have the obligation to absorb losses of the VIEs or the right to receive benefits of the VIEs that could potentially be significant to the VIEs. Depending on market conditions, the fixed-price purchase options could potentially provide benefit to the Company; however, any benefits potentially received from a fixed-price purchase option are generally expected to be minimal. Based on these factors, BNSF Railway is not the primary beneficiary of the VIEs. As BNSF Railway is not the primary beneficiary and the majority of the VIE leases are operating leases, the assets and liabilities related to the VIEs recorded in the Company’s Consolidated Balance Sheet are immaterial.

Table of Contents
34
12. Commitments and Contingencies Lease CommitmentsBNSF has substantial lease commitments for locomotives, freight cars, office buildings, operating facilities and other property, and many of these leases provide the option to purchase the leased item at fair market value at the end of the lease. However, some provide fixed price purchase options. Future minimum lease payments as of December 31, 2017, are summarized as follows (in millions):
December 31, Capital Leases Operating Leases a
2018 $ 75 $ 458 2019 71 452 2020 69 453 2021 200 378 2022 35 294 Thereafter 129 984 Total 579 $ 3,019 Less amount representing interest (113) Present value of minimum lease payments $ 466
a Excludes leases having non-cancelable lease terms of less than one year and per diem leases. Minimum lease payments have not been reduced by minimum sublease rentals of $137 million due under future non-cancelable subleases. Lease rental expense for all operating leases, excluding per diem leases, was $587 million, $600 million and $627 million for the years ended December 31, 2017, 2016 and 2015, respectively. When rental payments are not made on a straight-line basis, the Company recognizes rental expense on a straight-line basis over the lease term. Contingent rentals and sublease rental income were not significant for the years ended December 31, 2017, 2016 and 2015. Other CommitmentsIn the normal course of business, the Company enters into long-term contractual requirements for future goods and services needed for the operations of the business. Such commitments are not in excess of expected requirements and are not reasonably likely to result in performance penalties or payments that would have a material adverse effect on the Company’s liquidity. Personal Injury and Environmental CostsPersonal InjuryPersonal injury claims, including asbestos claims and employee work-related injuries and third-party injuries (collectively, other personal injury), are a significant expense for the railroad industry. Personal injury claims by BNSF Railway employees are subject to the provisions of the Federal Employers’ Liability Act (FELA) rather than state workers’ compensation laws. FELA’s system of requiring the finding of fault, coupled with unscheduled awards and reliance on the jury system, contributed to increased expenses in past years. Other proceedings include claims by non-employees for punitive as well as compensatory damages, and from time to time may include proceedings that have been certified as or purport to be class actions. The variability present in settling these claims, including non-employee personal injury and matters in which punitive damages are alleged, could result in increased expenses in future years. BNSF has implemented a number of safety programs designed to reduce the number of personal injuries as well as the associated claims and personal injury expense. BNSF records an undiscounted liability for personal injury claims when the expected loss is both probable and reasonably estimable. The liability and ultimate expense projections are estimated using standard actuarial methodologies. Liabilities recorded for unasserted personal injury claims are based on information currently available. Due to the inherent uncertainty involved in projecting future events such as the number of claims filed each year, developments in judicial and legislative standards and the average costs to settle projected claims, actual costs may differ from amounts recorded. Expense accruals and any required adjustments are classified as materials and other in the Consolidated Statements of Income. AsbestosThe Company is party to a number of personal injury claims by employees and non-employees who may have been exposed to asbestos. The heaviest exposure for certain BNSF employees was due to work conducted in and around the use of steam locomotive engines that were phased out between the years of 1950 and 1967. However, other types of exposures, including exposure from locomotive component parts and building materials, continued after 1967 until they were substantially eliminated at BNSF by 1985.

Table of Contents
35
BNSF assesses its unasserted asbestos liability exposure on an annual basis during the third quarter. BNSF determines its asbestos liability by estimating its exposed population, the number of claims likely to be filed, the number of claims that will likely require payment and the estimated cost per claim. Estimated filing and dismissal rates and average cost per claim are determined utilizing recent claim data and trends. Key elements of the assessment include:
• Because BNSF did not have detailed employment records in order to compute the population of potentially exposed employees, it computed an estimate using Company employee data from 1970 forward and estimated the BNSF employee base from 1938-1969 using railroad industry historical census data and estimating BNSF’s representation in the total railroad population.
• The projected incidence of disease was estimated based on epidemiological studies using employees’ age, duration and intensity of exposure while employed.
• An estimate of the future anticipated claims filing rate by type of disease (non-malignant, cancer and mesothelioma) was computed using the Company’s average historical claim filing rates observed in 2014-2017.
• An estimate of the future anticipated dismissal rate by type of claim was computed using the Company’s historical average dismissal rates observed in 2013-2017.
• An estimate of the future anticipated settlement by type of disease was computed using the Company’s historical average of dollars paid per claim for pending and future claims using the average settlement by type of incidence observed during 2013-2017.
From these assumptions, BNSF projected the incidence of each type of disease to the estimated population to arrive at an estimate of the total number of employees that could potentially assert a claim. Historical claim filing rates were applied for each type of disease to the total number of employees that could potentially assert a claim to determine the total number of anticipated claim filings by disease type. Historical dismissal rates, which represent claims that are closed without payment, were then applied to calculate the number of future claims by disease type that would likely require payment by the Company. Finally, the number of such claims was multiplied by the average settlement value to estimate BNSF’s future liability for unasserted asbestos claims. The most sensitive assumptions for this accrual are the estimated future filing rates and estimated average claim values. Asbestos claim filings are typically sporadic and may include large batches of claims solicited by law firms. To reflect these factors, BNSF used a multi-year calibration period (i.e., average historical filing rates observed in 2014-2017) because it believed it would be most representative of its future claim experience. In addition, for non-malignant claims, the number of future claims to be filed against BNSF declines at a rate consistent with both mortality and age as there is a decreasing propensity to file a claim as the population ages. BNSF believes the average claim values by type of disease from the historical period 2013-2017 are most representative of future claim values. Non-malignant claims, which represent approximately 70 percent of the total number and 40 percent of the cost of estimated future asbestos claims, were priced by age of the projected claimants. Historically, the ultimate settlement value of these types of claims is most sensitive to the age of the claimant. During the third quarters of 2017, 2016 and 2015, the Company analyzed recent filing and payment trends to ensure the assumptions used by BNSF to estimate its future asbestos liability were reasonable. In 2017, management recorded a decrease to the liability of $29 million. No adjustment was recorded in 2016. In 2015, management recorded an increase to the liability of $5 million. The Company plans to update its study again in the third quarter of 2018.
Throughout the year, BNSF monitors actual experience against the number of forecasted claims and expected claim payments and will record adjustments to the Company’s estimates as necessary. Based on BNSF’s estimate of the potentially exposed employees and related mortality assumptions, it is anticipated that unasserted asbestos claims will continue to be filed through the year 2050. The Company recorded an amount for the full estimated filing period through 2050 because it had a relatively finite exposed population (former and current employees hired prior to 1985), which it was able to identify and reasonably estimate and about which it had obtained reliable demographic data (including age, hire date and occupation) derived from industry or BNSF specific data that was the basis for the study. BNSF projects that approximately 65, 80 and 95 percent of the future unasserted asbestos claims will be filed within the next 10, 15 and 25 years, respectively.

Table of Contents
36
Other Personal InjuryBNSF estimates its other personal injury liability claims and expense quarterly based on the covered population, activity levels and trends in frequency and the costs of covered injuries. Estimates include unasserted claims except for certain repetitive stress and other occupational trauma claims that allegedly result from prolonged repeated events or exposure. Such claims are estimated on an as-reported basis because the Company cannot estimate the range of reasonably possible loss due to other non-work related contributing causes of such injuries and the fact that continued exposure is required for the potential injury to manifest itself as a claim. BNSF has not experienced any significant adverse trends related to these types of claims in recent years. Key elements of the actuarial assessment include:
• Size and demographics (employee age and craft) of the workforce.
• Activity levels (manhours by employee craft and carloadings).
• Expected claim frequency rates by type of claim (employee FELA or third-party liability) based on historical claim frequency trends.
• Expected dismissal rates by type of claim based on historical dismissal rates.
• Expected average paid amounts by type of claim for open and incurred but not reported claims that eventually close with payment.
From these assumptions, BNSF estimates the number of open claims by accident year that will likely require payment by the Company. The projected number of open claims by accident year that will require payment is multiplied by the expected average cost per claim by accident year and type to determine BNSF’s estimated liability for all asserted claims. Additionally, BNSF estimates the number of its incurred but not reported claims that will likely result in payment based upon historical emergence patterns by type of claim. The estimated number of projected claims by accident year requiring payment is multiplied by the expected average cost per claim by accident year and type to determine BNSF’s estimated liability for incurred but not reported claims. BNSF monitors quarterly actual experience against the number of forecasted claims to be received, the forecasted number of claims closing with payment and expected claim payments. Adjustments to the Company’s estimates are recorded quarterly as necessary or more frequently as new events or changes in estimates develop. The following table summarizes the activity in the Company’s accrued obligations for asbestos and other personal injury matters (in millions):
Year Ended Year Ended Year Ended
December 31,
2017December 31,
2016December 31,
2015Beginning balance $ 367 $ 375 $ 375Accruals / changes in estimates (1) 80 81Payments (59) (88) (81) Ending balance $ 307 $ 367 $ 375
At December 31, 2017 and 2016, $85 million was included in current liabilities for both periods. Defense and processing costs, which are recorded on an as-reported basis, were not included in the recorded liability. The Company is primarily self-insured for personal injury claims. Because of the uncertainty surrounding the ultimate outcome of personal injury claims, it is reasonably possible that future costs to settle personal injury claims may range from approximately $265 million to $370 million. However, BNSF believes that the $307 million recorded at December 31, 2017, is the best estimate of the Company’s future obligation for the settlement of personal injury claims.
The amounts recorded by BNSF for personal injury liabilities were based upon currently known facts. Future events, such as the number of new claims to be filed each year, the average cost of disposing of claims, as well as the numerous uncertainties surrounding personal injury litigation in the United States, could cause the actual costs to be higher or lower than projected.

Table of Contents
37
Although the final outcome of personal injury matters cannot be predicted with certainty, considering among other things the meritorious legal defenses available and liabilities that have been recorded, it is the opinion of BNSF that none of these items, when finally resolved, will have a material adverse effect on the Company’s financial position or liquidity. However, the occurrence of a number of these items in the same period could have a material adverse effect on the results of operations in a particular quarter or fiscal year. BNSF Insurance CompanyThe Company has a consolidated, wholly-owned subsidiary, Burlington Northern Santa Fe Insurance Company, Ltd. (BNSFIC), that offers insurance coverage for certain risks, FELA claims, railroad protective and force account insurance claims and certain excess general liability and property coverage, and certain other claims which are subject to reinsurance. BNSFIC has entered into annual reinsurance treaty agreements with several other companies. The treaty agreements insure workers compensation, general liability, auto liability and FELA risk. In accordance with the agreements, BNSFIC cedes a portion of its FELA exposure through the treaty and assumes a proportionate share of the entire risk. Each year BNSFIC reviews the objectives and performance of the treaty to determine its continued participation in the treaty. The treaty agreements provide for certain protections against the risk of treaty participants’ non-performance. On an ongoing basis, BNSF and/or the treaty manager reviews the creditworthiness of each of the participants. BNSF does not believe its exposure to treaty participants’ non-performance is material at this time. BNSFIC typically invests in time deposits and money market accounts. At December 31, 2017, there was $497 million related to these third-party investments, which were classified as cash and cash equivalents on the Company’s Consolidated Balance Sheet, as compared with $457 million at December 31, 2016.
EnvironmentalThe Company’s operations, as well as those of its competitors, are subject to extensive federal, state and local environmental regulation. BNSF’s operating procedures include practices to protect the environment from the risks inherent in railroad operations, which frequently involve transporting chemicals and other hazardous materials. Additionally, many of BNSF’s land holdings are and have been used for industrial or transportation-related purposes or leased to commercial or industrial companies whose activities may have resulted in discharges onto the property. As a result, BNSF is subject to environmental cleanup and enforcement actions. In particular, the federal Comprehensive Environmental Response, Compensation and Liability Act of 1980 (CERCLA), also known as the Superfund law, as well as similar state laws, generally impose joint and several liability for cleanup and enforcement costs on current and former owners and operators of a site without regard to fault or the legality of the original conduct. BNSF has been notified that it is a potentially responsible party (PRP) for study and cleanup costs at Superfund sites for which investigation and remediation payments are or will be made or are yet to be determined (the Superfund sites) and, in many instances, is one of several PRPs. In addition, BNSF may be considered a PRP under certain other laws. Accordingly, under CERCLA and other federal and state statutes, BNSF may be held jointly and severally liable for all environmental costs associated with a particular site. If there are other PRPs, BNSF generally participates in the cleanup of these sites through cost-sharing agreements with terms that vary from site to site. Costs are typically allocated based on such factors as relative volumetric contribution of material, the amount of time the site was owned or operated and/or the portion of the total site owned or operated by each PRP. BNSF is involved in a number of administrative and judicial proceedings and other mandatory cleanup efforts for 218 sites, including 18 Superfund sites, at which it is participating in the study or cleanup, or both, of alleged environmental contamination. Liabilities for environmental cleanup costs are recorded when BNSF’s liability for environmental cleanup is probable and reasonably estimable. Subsequent adjustments to initial estimates are recorded as necessary based upon additional information developed in subsequent periods. Environmental costs include initial site surveys and environmental studies as well as costs for remediation of sites determined to be contaminated. BNSF estimates the ultimate cost of cleanup efforts at its known environmental sites on an annual basis during the third quarter. Ultimate cost estimates for environmental sites are based on current estimated percentage to closure ratios, possible remediation work plans and estimates of the costs and likelihood of each possible outcome, historical payment patterns, and benchmark patterns developed from data accumulated from industry and public sources, including the Environmental Protection Agency and other governmental agencies. These factors incorporate into the estimates experience gained from cleanup efforts at other similar sites. The most significant assumptions are the possible remediation work plans and estimates of the costs and likelihood of each possible outcome for the larger sites. Annual studies do not include (i) contaminated sites of which the Company is not aware; (ii) additional amounts for third-party tort claims, which arise out of contaminants allegedly migrating from BNSF property, due to a limited number of sites; or (iii) natural resource damage claims. BNSF continues to estimate third-party tort claims on a site by site basis when the liability for such claims is probable and reasonably estimable. BNSF’s recorded liability for third-party tort claims as of December 31, 2017and 2016 was $9 million and $12 million, respectively.

Table of Contents
38
On a quarterly basis, BNSF monitors actual experience against the forecasted remediation and related payments made on existing sites and conducts ongoing environmental contingency analyses, which consider a combination of factors including independent consulting reports, site visits, legal reviews and analysis of the likelihood of other PRPs’ participation in, and their ability to pay for, cleanup. Adjustments to the Company’s estimates will continue to be recorded as necessary based on developments in subsequent periods. Additionally, environmental accruals, which are classified as materials and other in the Consolidated Statements of Income, include amounts for newly identified sites or contaminants, third-party claims and legal fees incurred for defense of third-party claims and recovery efforts. The following table summarizes the activity in the Company’s accrued obligations for environmental matters (in millions):
Year Ended Year Ended Year Ended
December 31,
2017December 31,
2016December 31,
2015Beginning balance $ 342 $ 369 $ 404Accruals / changes in estimates 5 5 4Payments (30) (32) (39) Ending balance $ 317 $ 342 $ 369
At December 31, 2017 and 2016, $40 million was included in current liabilities for both periods.
During the third quarters of 2017, 2016 and 2015, the Company analyzed recent data and trends to ensure the assumptions used by BNSF to estimate its future environmental liability were reasonable. As a result of this study, in the third quarters of 2017, 2016and 2015, management recorded additional expense of $2 million, $8 million and $7 million as of the respective June 30 measurement dates. The Company plans to update its study again in the third quarter of 2018.
BNSF’s environmental liabilities are not discounted. BNSF anticipates that the majority of the accrued costs at December 31, 2017, will be paid over the next ten years, and no individual site is considered to be material. Liabilities recorded for environmental costs represent BNSF’s best estimate of its probable future obligation for the remediation and settlement of these sites and include both asserted and unasserted claims. Although recorded liabilities include BNSF’s best estimate of all probable costs, without reduction for anticipated recoveries from third parties, BNSF’s total cleanup costs at these sites cannot be predicted with certainty due to various factors such as the extent of corrective actions that may be required, evolving environmental laws and regulations, advances in environmental technology, the extent of other parties’ participation in cleanup efforts, developments in ongoing environmental analyses related to sites determined to be contaminated and developments in environmental surveys and studies of contaminated sites. Because of the uncertainty surrounding these factors, it is reasonably possible that future costs for environmental liabilities may range from approximately $260 million to $415 million. However, BNSF believes that the $317 million recorded at December 31, 2017, is the best estimate of the Company’s future obligation for environmental costs. Although the final outcome of these environmental matters cannot be predicted with certainty, it is the opinion of BNSF that none of these items, when finally resolved, will have a material adverse effect on the Company’s financial position or liquidity. However, the occurrence of a number of these items in the same period could have a material adverse effect on the results of operations in a particular quarter or fiscal year. Other Claims and LitigationIn addition to asbestos, other personal injury and environmental matters discussed above, BNSF and its subsidiaries are also parties to a number of other legal actions and claims, governmental proceedings and private civil suits arising in the ordinary course of business, including those related to disputes and complaints involving certain transportation rates and charges. Some of the legal proceedings include claims for punitive as well as compensatory damages, and from time to time may include proceedings that purport to be class actions. Although the final outcome of these matters cannot be predicted with certainty, considering among other things the meritorious legal defenses available and liabilities that have been recorded along with applicable insurance, BNSF currently believes that none of these items, when finally resolved, will have a material adverse effect on the Company’s financial position or liquidity. However, an unexpected adverse resolution of one or more of these items could have a material adverse effect on the results of operations in a particular quarter or fiscal year.

Table of Contents
39
13. Employment Benefit Plans BNSF provides a funded, noncontributory qualified pension plan, the BNSF Retirement Plan, which covers most non-union employees, and an unfunded non-tax-qualified pension plan, the BNSF Supplemental Retirement Plan, which covers certain officers and other employees. The benefits under these pension plans are based on years of credited service and the highest consecutive sixty months of compensation for the last ten years of salaried employment with BNSF. The Company also provides two funded, noncontributory qualified pension plans which cover certain union employees of the former The Atchison, Topeka and Santa Fe Railway Company (Union Plans). The benefits under these pension plans are based on elections made at the time the plans were implemented. BNSF’s funding policy is to contribute annually not less than the regulatory minimum and not more than the maximum amount deductible for income tax purposes with respect to the funded plans.
Certain salaried employees of BNSF who have met age and years of service requirements are eligible for medical benefits, including prescription drug coverage, during retirement. For pre-Medicare participants, the postretirement medical and prescription drug benefit is contributory and provides benefits to retirees and their covered dependents. Retiree contributions are adjusted annually. The plan also contains fixed deductibles, coinsurance and out-of-pocket limitations. For Medicare eligible participants, a yearly stipend is recorded in a Health Reimbursement Account (HRA) established on their behalf. Retirees can use these HRAs to reimburse themselves for eligible out-of-pocket expenses, as well as premiums for personal supplemental insurance policies. HRAs are unfunded, so no funds are expended until the reimbursements are paid. Generally, employees beginning salaried employment with BNSF subsequent to September 22, 1995, are not eligible for medical benefits during retirement. In addition, retirees who were salaried employees on or before January 1, 2018 and are age 45 or older at July 1, 2018 are covered under a basic life insurance plan that is noncontributory. Optional life insurance coverage is available for some retirees; however, the retiree is responsible for the full cost. These benefits are collectively referred to as retiree health and welfare benefits.
Components of the net (benefit) cost for certain employee benefit plans were as follows (in millions):
Pension BenefitsYear Ended Year Ended Year Ended
December 31,
2017December 31,
2016December 31,
2015Service cost $ 42 $ 46 $ 48Interest cost 88 95 90Expected return on plan assets (149) (142) (138)Amortization of prior service credits — (1) (1)Amortization of net loss — 1 2Settlements — (1) (1) Net (benefit) cost recognized $ (19) $ (2) $ —
Retiree Health and Welfare BenefitsYear Ended Year Ended Year Ended
December 31,
2017December 31,
2016December 31,
2015Service cost $ 1 $ 1 $ 1Interest cost 9 10 10Amortization of prior service credits (2) (2) (2)Amortization of net loss — 1 2 Net cost recognized $ 8 $ 10 $ 11

Table of Contents
40
The projected benefit obligation is the present value of benefits earned to date by plan participants, including the effect of assumed future salary increases and expected healthcare cost trend rate increases. The following tables show the change in projected benefit obligation (in millions):
Pension Benefits
Change in Benefit ObligationDecember 31,
2017December 31,
2016Projected benefit obligation at beginning of period $ 2,247 $ 2,320Service cost 42 46Interest cost 88 95Actuarial loss (gain) 166 (55)Benefits paid (144) (143)Settlements (12) (16) Projected benefit obligation at end of period 2,387 2,247 Component representing future salary increases (135) (102) Accumulated benefit obligation at end of period $ 2,252 $ 2,145
Retiree Health and Welfare Benefits
Change in Benefit ObligationDecember 31,
2017December 31,
2016Projected benefit obligation at beginning of period $ 237 $ 258Service cost 1 1Interest cost 9 10Plan participants’ contributions 4 5Actuarial loss (gain) 14 (13)Benefits paid (23) (24)Plan amendment (1) — Projected benefit obligation at end of period $ 241 $ 237
The following tables show the change in plan assets of the plans (in millions):
Pension Benefits
Change in Plan AssetsDecember 31,
2017December 31,
2016Fair value of plan assets at beginning of period $ 2,333 $ 2,289Actual return on plan assets 479 193Employer contributionsa 13 10Benefits paid (144) (143)Settlements (12) (16) Fair value of plan assets at measurement date $ 2,669 $ 2,333
a Employer contributions were classified as Other, Net under Operating Activities in the Company’s Consolidated Statements of Cash Flows.
Retiree Health and Welfare Benefits
Change in Plan AssetsDecember 31,
2017December 31,
2016Fair value of plan assets at beginning of period $ — $ —Employer contributionsa 48 19Plan participants’ contributions 4 5Benefits paid (23) (24) Fair value of plan assets at measurement date $ 29 $ —
a Employer contributions were classified as Other, Net under Operating Activities in the Company’s Consolidated Statements of Cash Flows.

Table of Contents
41
The following table shows the funded status, defined as plan assets less the projected benefit obligation (in millions):
Pension BenefitsRetiree Health and
Welfare Benefits
December 31,
2017December 31,
2016December 31,
2017December 31,
2016Funded status (plan assets less projected benefitobligations) $ 282 $ 86 $ (212) $ (237)
Of the net combined pension and retiree health and welfare benefits asset of $70 million recognized as of December 31, 2017 and liability of $151 million recognized as of December 31, 2016, $16 million and $30 million were included in other current liabilities at December 31, 2017 and 2016, respectively, and $396 million and $200 million were included in other assets at December 31, 2017 and 2016, respectively.
The BNSF Supplemental Retirement Plan and the Union Plans have accumulated and projected benefit obligations in excess of plan assets. The following table shows the projected benefit obligation, accumulated benefit obligation, and fair value of plan assets for the three plans (in millions):
December 31,2017
December 31,2016
Projected benefit obligation $ 157 $ 165Accumulated benefit obligation $ 157 $ 165Fair value of plan assets $ 43 $ 51
Actuarial gains and losses and prior service credits are recognized in the Consolidated Balance Sheets through an adjustment to accumulated other comprehensive income / (loss) (AOCI). The following tables show the pre-tax change in AOCI attributable to the components of the net cost and the change in benefit obligation (in millions):
Pension BenefitsYear Ended Year Ended Year Ended
Change in AOCIDecember 31,
2017December 31,
2016December 31,
2015Beginning balance $ 207 $ 102 $ 34Amortization of net loss — 1 2Amortization of prior service credits — (1) (1)Actuarial gain 164 106 68Settlements — (1) (1) Ending balance $ 371 $ 207 $ 102
Retiree Health and Welfare BenefitsYear Ended Year Ended Year Ended
Change in AOCIDecember 31,
2017December 31,
2016December 31,
2015Beginning balance $ (9) $ (21) $ (34)Amortization of net loss — 1 2Amortization of prior service credits (2) (2) (2)Actuarial (loss) gain (14) 13 13Prior service credits 1 — — Ending balance $ (24) $ (9) $ (21)

Table of Contents
42
Approximately $1 million, net of tax, of the actuarial losses and less than $1 million, net of tax, of the prior service credits from defined benefit pension plans in AOCI are required to be amortized into net periodic benefit cost over the next fiscal year. Approximately $2 million, net of tax, of the prior service credits and less than $1 million, net of tax, of the actuarial losses from retiree health and welfare benefit plans in AOCI are required to be amortized into net periodic benefit cost over the next fiscal year. Pre-tax amounts currently recognized in AOCI consist of the following (in millions):
Pension BenefitsRetiree Health and
Welfare Benefits 2017 2016 2017 2016Net gain (loss) $ 370 $ 206 $ (28) $ (14)Prior service credits 4 4 4 5Settlements (3) (3) — —Pre-tax amount recognized in AOCI at December 31, $ 371 $ 207 $ (24) $ (9)After-tax amount recognized in AOCI at December 31, $ 251 $ 128 $ (17) $ (6)
The assumptions used in accounting for the BNSF plans were as follows:
Pension BenefitsYear Ended Year Ended Year Ended
Assumptions Used to Determine Net CostDecember 31,
2017December 31,
2016December 31,
2015Discount rate 4.1% 4.2% 3.8%Expected long-term rate of return on plan assets 6.6% 6.6% 6.6%Rate of compensation increase 3.3% 3.8% 3.8%
Retiree Health and Welfare BenefitsYear Ended Year Ended Year Ended
Assumptions Used to Determine Net CostDecember 31,
2017December 31,
2016December 31,
2015Discount rate 3.9% 4.1% 3.7%Rate of compensation increase 3.3% 3.8% 3.8%
Pension BenefitsRetiree Health and
Welfare BenefitsAssumptions Used to Determine BenefitObligations
December 31,2017
December 31,2016
December 31,2017
December 31,2016
Discount rate 3.6% 4.1% 3.5% 3.9%Rate of compensation increase 3.6% 3.3% 3.6% 3.3%
BNSF determined the discount rate based on a yield curve that utilized year-end market yields of high-quality corporate bonds to develop spot rates that are matched against the plans’ expected benefit payments. The discount rate used for the 2018 calculation of net benefit cost decreased to 3.6 percent for pension and 3.5 percent for retiree health and welfare benefits, which reflects market conditions at the December 31, 2017 measurement date.
Various other assumptions including retirement and withdrawal rates, compensation increases, payment form and benefit commencement age are based upon a five-year experience study. In 2016, BNSF obtained an updated study which had an immaterial impact on its pension and retiree health and welfare projected benefit obligations.
In 2016, BNSF adopted actuary-produced mortality tables and an improvement scale derived from the updated tables, which were used in the calculation of its December 31, 2017 and 2016 liabilities.

Table of Contents
43
Pension plan assets are generally invested with the long-term objective of earning sufficient amounts to cover expected benefit obligations, while assuming a prudent level of risk. Allocations may change as a result of changing market conditions and investment opportunities. Generally, BNSF’s policy is to fund the retiree health and welfare benefits as they come due, however the Company pre-funded $29 million towards the plans in 2017. This amount is expected to be fully used within two years.
The expected rates of return on plan assets reflect subjective assessments of expected invested asset returns over a period of several years. Actual experience will differ from the assumed rates. The expected rate of return on pension plan assets was 6.6 percentfor 2017 and will be 6.6 percent for 2018. The expected rate of return on retiree health and welfare benefit plan assets will be 1.7 percent for 2018. The following table is an estimate of the impact on future net benefit cost that could result from hypothetical changes to the most sensitive assumptions, the discount rate and expected rate of return on plan assets:
Sensitivity Analysis Change in 2018 Net Benefit CostHypothetical Discount Rate Change Pension Retiree Health and Welfare50 basis point decrease $ — million increase $ 1 million increase50 basis point increase $ 4 million decrease $ — million increaseHypothetical Expected Rate of Returnon Plan Assets Change Pension Retiree Health and Welfare50 basis point decrease $ 12 million increase $ — million increase50 basis point increase $ 12 million decrease $ — million decrease
The following table presents assumed health care cost trend rates:
Year Ended Year Ended Year Ended
December 31,
2017December 31,
2016December 31,
2015Assumed health care cost trend rate for next year (participants over 65) 3.0% 3.0% 3.0%Assumed health care cost trend rate for next year (participants under 65) 7.0% 7.4% 7.7%Rate to which health care cost trend rate for participants under 65 isexpected to decline and remain 4.5% 4.4% 4.5%Year that the rate reaches the ultimate trend rate 2039 2039 2038
Assumed health care cost trend rates have a significant effect on the amounts reported for the postretirement health care plans. A one percentage point change in assumed health care cost trend rates would have the following effects (in millions):
One Percentage-
Point IncreaseOne Percentage-
Point DecreaseEffect on total service and interest cost $ 1 $ (1)Effect on postretirement benefit obligation $ 18 $ (15)
Investments are stated at fair value. The various types of investments are valued as follows:
(i) Equity securities are valued at the last trade price at primary exchange close time on the last business day of the year (Level 1 input). If the last trade price is not available, values are based on bid, ask/offer quotes from contracted pricing vendors, brokers, or investment managers (Level 3 input or Level 2 if corroborated).
(ii) Highly liquid government obligations, such as U.S. Treasury securities, are valued based on quoted prices in active markets for identical assets (Level 1 input). Other fixed maturity securities and government obligations are valued based on institutional bid evaluations from contracted vendors. Where available, vendors use observable market-based data to evaluate prices (Level 2 input). If observable market-based data is not available, unobservable inputs such as extrapolated data, proprietary models, and indicative quotes are used to arrive at estimated prices representing the price a dealer would pay for the security (Level 3 input).

Table of Contents
44
(iii) Investment funds / other are valued at the daily net asset value of shares held at year end. Net asset value is considered a Level 1 input if net asset value is computed daily and redemptions at this value are available to all shareholders without restriction. Net asset value is considered a Level 2 input if the fund may restrict share redemptions under limited circumstances or if net asset value is not computed daily. Net asset value is considered a Level 3 input if shares could not be redeemed on the reporting date and net asset value cannot be corroborated by trading activity.
The following table summarizes the investments of BNSF’s funded pension plans as of December 31, 2017, based on the inputs used to value them (in millions):
Total as of
Asset CategoryDecember 31,
2017Level 1Inputs a
Level 2Inputs a
Level 3Inputs a
Cash and equivalents $ 13 $ 2 $ 11 $ —Equity securitiesb 2,440 2,440 — —Government obligations 197 197 — —Other fixed maturity securities 14 — 14 —Investment funds and other 5 5 — —
Totalc $ 2,669 $ 2,644 $ 25 $ —a See Note 2 to the Consolidated Financial Statements under the heading “Fair Value Measurements” for a definition of each of these levels of inputs.b As of December 31, 2017, three equity securities each exceeded 10 percent of total plan assets. These investments represent approximately 47 percent of total plan assets.c Excludes less than $1 million accrued for dividend and interest receivable.
In addition, there was $29 million invested in cash and cash equivalents, valued using Level 1 inputs, related to the retiree health and welfare benefit plans as of December 31, 2017. There were no investments held on the retiree health and welfare plans as of December 31, 2016.
Comparative Prior Year InformationThe following table summarizes the investments of BNSF’s funded pension plans as of December 31, 2016, based on the inputs used to value them (in millions):
Total as of
Asset CategoryDecember 31,
2016Level 1Inputs a
Level 2Inputs a
Level 3Inputs a
Cash and equivalents $ 1 $ 1 $ — $ —Equity securitiesb 2,139 2,139 — —Government obligations 164 — 164 —Other fixed maturity securities 21 — 21 —Investment funds and other 8 8 — —
Total c $ 2,333 $ 2,148 $ 185 $ —a See Note 2 to the Consolidated Financial Statements under the heading “Fair Value Measurements” for a definition of each of these levels of inputs.b As of December 31, 2016, four equity securities each exceeded 10 percent of total plan assets. These investments represented approximately 56 percent of total plan assets.c Excludes less than $1 million accrued for dividend and interest receivable.
The Company is not required to make contributions to its funded pension plans or its retiree health and welfare benefit plans in 2018. The Company expects to contribute $10 million to its unfunded non-qualified pension plan in 2018.

Table of Contents
45
The following table shows expected benefit payments from its defined benefit pension plans and expected claim payments for the retiree health and welfare plan for the next five fiscal years and the aggregate five years thereafter (in millions):
Fiscal year
ExpectedPension
Plan BenefitPayments a
ExpectedRetiree Health
and WelfarePayments b
2018 $ 165 $ 192019 $ 153 $ 182020 $ 153 $ 172021 $ 147 $ 172022 $ 142 $ 162023-2027 $ 652 $ 71
a Primarily consists of the BNSF Retirement Plan payments, which are made from the plan trust and do not represent an immediate cash outflow to the Company.b Expected payments for 2018 and a portion of 2019 will be made from the plan trust and do not represent an immediate cash outflow to the Company.
Defined Contribution PlansBNSF sponsors qualified 401(k) plans that cover substantially all employees and a non-qualified defined contribution plan that covers certain officers and other employees. BNSF matched 75 percent of the first six percent of non-union employees’ contributions and matched 25 percent on the first four percent of a limited number of union employees’ contributions, which are subject to certain percentage limits of the employees’ earnings, at each pay period. Employer contributions are subject to a five-year length of service vesting schedule. BNSF’s 401(k) matching expense was $35 million during the year ended December 31, 2017 and $34 million during the years ended December 31, 2016 and 2015.
OtherUnder collective bargaining agreements, BNSF participates in multi-employer benefit plans that provide certain postretirement health care and life insurance benefits for eligible union employees. Health care claim payments and life insurance premiums paid attributable to retirees, which are generally expensed as incurred, were $75 million, $61 million and $58 million during the years ended December 31, 2017, 2016 and 2015, respectively. The average number of employees covered under these plans were 35 thousand, 36 thousand and 40 thousand during the years ended December 31, 2017, 2016, and 2015, respectively.
14. Related Party Transactions
The companies identified as affiliates of BNSF include Berkshire and its subsidiaries. For the years ended December 31, 2017, 2016 and 2015, the Company declared and paid cash distributions of $4.6 billion, $2.5 billion and $4.0 billion, respectively, to its parent company. For the years ended December 31, 2017, 2016 and 2015, the Company received tax refunds of $29 million, $235 million and $167 million, respectively, from Berkshire, and made tax payments of $1,603 million, $893 million and $1,285 million, respectively to Berkshire. As of December 31, 2017, the Company has a receivable from Berkshire of $235 million recorded in Other Current Assets and a payable to Berkshire of $19 million. As of December 31, 2016, the Company has a payable to Berkshire of $109 million. Uncertain tax positions will affect the tax payable to Berkshire if and when settled. As of December 31, 2017and 2016, the Company has $32 million and $90 million payable to Berkshire related to prior year tax audit settlements. BNSF engages in various transactions with related parties in the ordinary course of business. The following table summarizes revenues earned by BNSF for services provided to related parties and expenditures to related parties (in millions):
Year Ended Year Ended Year Ended
December 31,
2017December 31,
2016December 31,
2015Revenues $ 139 $ 146 $ 178Expenditures $ 342 $ 286 $ 298

Table of Contents
46
BNSF owns 17.3 percent of TTX Company (TTX) while other North American railroads own the remaining interest. As BNSF possesses the ability to exercise significant influence, but not control, over the operating and financial policies of TTX, BNSF applies the equity method of accounting to its investment in TTX. In applying the equity method, the investment is recorded in Other Assets. Equity income or losses are recorded in Materials and Other in the Consolidated Statements of Income. North American railroads pay TTX car hire to use TTX’s freight equipment to serve their customers. BNSF’s car hire expenditures incurred with TTX are included in the table above. BNSF had $554 million and $414 million recognized as investments related to TTX in its Consolidated Balance Sheets as of December 31, 2017 and 2016, respectively.
15. Accumulated Other Comprehensive Income Other comprehensive income refers to revenues, expenses, gains and losses that under generally accepted accounting principles are included in accumulated other comprehensive income, a component of equity within the Consolidated Balance Sheets, rather than net income on the Consolidated Statements of Income. Under existing accounting standards, other comprehensive income may include, among other things, unrecognized gains and losses and prior service credit related to pension and other postretirement benefit plans.
The following tables provide the components of accumulated other comprehensive income / (loss) (AOCI) by component (in millions):
Pension and Retiree Health
and Welfare Benefit Itemsa
EquityMethod
Investments TotalBalance at December 31, 2016 $ 122 $ (3) $ 119Other comprehensive income (loss) before reclassifications 114 — 114Amounts reclassified from AOCI (2) — (2)Balance at December 31, 2017 $ 234 $ (3) $ 231
Balance at December 31, 2015 $ 50 $ (2) $ 48Other comprehensive income (loss) before reclassifications 73 (1) 72Amounts reclassified from AOCI (1) — (1)Balance at December 31, 2016 $ 122 $ (3) $ 119
a Amounts are net of tax. See Note 13 to the Consolidated Financial Statements for additional details.
Reclassifications out of AOCIb
Year Ended Year Ended
Details about AOCI ComponentsDecember 31,
2017December 31,
2016 Income Statement Line ItemAmortization of pension and retiree health andwelfare benefit items Actuarial losses $ — $ (1) c
Prior service credits 2 3 c
2 2 Total before tax— (1) Tax (expense) / benefit
Total reclassifications for the period $ 2 $ 1 Net of taxb Amounts in parenthesis indicate debits to the income statement.c This accumulated other comprehensive income component is included in the computation of net periodic pension and retiree health and welfare cost (see Note 13 to the Consolidated Financial Statements for additional details).

Table of Contents
47
16. Quarterly Financial Data—Unaudited Dollars in millions
2017 Fourth Third Second FirstRevenues $ 5,638 $ 5,314 $ 5,250 $ 5,185Operating income $ 2,013 $ 1,953 $ 1,787 $ 1,594Net income $ 8,462 $ 1,042 $ 958 $ 838
2016 Fourth Third Second FirstRevenues $ 5,310 $ 5,167 $ 4,585 $ 4,767Operating income $ 1,813 $ 1,880 $ 1,487 $ 1,505Net income $ 993 $ 1,020 $ 772 $ 784

Table of Contents
48
Item 9. Changes in and Disagreements With Accountants on Accounting and Financial Disclosure None.
Item 9A. Controls and Procedures Disclosure Controls and ProceduresBased on their evaluation as of the end of the period covered by this Annual Report on Form 10-K, the Company’s principal executive officer and principal financial officer have concluded that BNSF’s disclosure controls and procedures (as defined in Rules 13a-15(e) and 15d-15(e) of the Securities Exchange Act of 1934) are effective to ensure that information required to be disclosed by BNSF in the reports that it files or submits under the Securities Exchange Act of 1934 is recorded, processed, summarized and reported within the time periods specified in Securities and Exchange Commission rules and forms and that such information is accumulated and communicated to BNSF’s management, including its principal executive and principal financial officers, as appropriate to allow timely decisions regarding required disclosure. Management’s Report on Internal Control Over Financial ReportingThe management of BNSF is responsible for establishing and maintaining adequate internal control over financial reporting. BNSF’s internal control over financial reporting was designed to provide reasonable assurance regarding the reliability of financial reporting and the preparation of BNSF’s financial statements for external reporting purposes in accordance with generally accepted accounting principles in the United States of America. Management assessed the effectiveness of BNSF’s internal control over financial reporting as of December 31, 2017. In making this assessment, management adopted and used the criteria set forth in the Internal Control – Integrated Framework (2013) issued by the Committee of Sponsoring Organizations of the Treadway Commission. Based on management’s assessment, management concluded that as of December 31, 2017, BNSF’s internal control over financial reporting was effective based on those criteria. This annual report does not include an attestation report of the Company’s independent registered public accounting firm regarding internal control over financial reporting. Management’s report was not subject to attestation by the Company’s registered public accounting firm pursuant to rules of the Securities and Exchange Commission that permit the Company to provide only management’s report in this Annual Report on Form 10-K. Changes in Internal Control Over Financial ReportingAs of the period covered by this report, the Company has concluded that there have been no changes in BNSF’s internal control over financial reporting that occurred during BNSF’s fourth fiscal quarter that have materially affected, or are reasonably likely to materially affect, BNSF’s internal control over financial reporting.
Item 9B. Other Information None.

Table of Contents
49
Part III
Item 14. Principal Accountant Fees and Services
Independent Registered Public Accounting Firm FeesThe following table presents the fees incurred by BNSF, including its majority-owned subsidiaries, for services provided by Deloitte & Touche LLP, the independent registered public accounting firm, for the year ended December 31, 2017 and 2016 (in thousands):
2017 2016Audit fees $ 2,546 $ 2,422Audit-related fees 11 —Tax fees — —All other fees 23 24 Total $ 2,580 $ 2,446
Audit Fees Audit fees consist of professional services for audits of financial statements, quarterly reviews, internal control reviews, comfort letters provided in conjunction with the issuance of debt, and agreed-upon procedures performed on the Annual Report R-1 filed by BNSF Railway with the Surface Transportation Board.
Audit-Related FeesThis category consists of assurance and related services by the independent registered public accounting firm that are reasonably related to the performance of the audit or review of BNSF’s financial statements and are not reported above under "Audit Fees".
Tax FeesTax fees consist of professional services for tax compliance, tax audit and tax planning for specific transactions or potential transactions of the Company. No tax fees were billed in 2017 or 2016. All Other FeesAll other fees consist of subscription-related fees. Pre-Approval Policies and ProceduresThe Registrant is an indirect, wholly-owned subsidiary of Berkshire Hathaway Inc. and does not have an audit committee. During 2017 and 2016, the Audit Committee of Berkshire Hathaway Inc. pre-approved all fees and services provided by the independent registered public accounting firm, subject to the exceptions for non-audit services described in the Securities Exchange Act of 1934 and rules and regulations thereunder.

Item 15. Exhibits and Financial Statement Schedules
(a) The following documents are filed as part of this report:
1. Consolidated Financial Statements—see Item 8.
Schedules are omitted because they are not required or applicable, or the required information is included in theConsolidated Financial Statements or related notes.
2. Exhibits.
Incorporated by Reference(if applicable)
Exhibit Number and Description Form File Date File No. Exhibit(3) Articles of Incorporation and Bylaws
3.1 Certificate of Formation dated November 2, 2009. 8-K 2/16/2010 1-11535 3.13.2 8-K 2/16/2010 1-11535 3.2
3.3
Amended and Restated Limited Liability Operating Agreement of Burlington Northern Santa Fe, LLC, dated February 12, 2010. ◇Written Consent of the Sole Member, dated April 8, 2010, amending the Amended and Restated Limited Liability Operating Agreement.
8-K 4/13/2010 1-11535 3.1
(4) Instruments defining the rights of security holders, including indentures4.1 Indenture, dated as of December 1, 1995, between BNSF and The
First National Bank of Chicago, as Trustee.S-3 2/8/1999 333-72013 4
4.2 Form of BNSF’s 6 3/4% Debenture Due March 15, 2029. 10-K 3/31/1999 1-11535 4.34.3 Form of BNSF’s 6.70% Debenture Due August 1, 2028. 10-K 3/31/1999 1-11535 4.44.4 Form of BNSF’s 8.125% Debenture Due April 15, 2020. 10-K 2/12/2001 1-11535 4.64.5 Form of BNSF’s 7.95% Debenture Due August 15, 2030. 10-K 2/12/2001 1-11535 4.74.6 Indenture, dated as of December 8, 2005, between BNSF and U.S.
Bank Trust National Association, as Trustee.S-3 ASR 12/8/2005 333-130214 4.1
4.7 Certificate of Trust of BNSF Funding Trust I, executed and filedby U.S. Bank Trust National Association, Linda Hurt and JamesGallegos, as Trustees.
S-3 ASR 12/8/2005 333-130214 4.3
4.8 Amended and Restated Declaration of Trust of BNSF FundingTrust I, dated as of December 15, 2005.
8-K 12/15/2005 1-11535 4.4
4.9 Guarantee Agreement between BNSF and U.S. Bank TrustNational Association, as Guarantee Trustee, dated as of December15, 2005.
8-K 12/15/2005 1-11535 4.5
4.10 First Supplemental Indenture, dated as of December 15, 2005,between BNSF and U.S. Bank Trust National Association, asTrustee.
8-K 12/15/2005 1-11535 4.6
4.11 Agreement as to Expenses and Liabilities dated as of December15, 2005, between BNSF and BNSF Funding Trust I.
8-K 12/15/2005 1-11535 4.4(Exhibit C)
4.12 Form of BNSF Funding Trust I’s 6.613% Trust PreferredSecurities.
8-K 12/15/2005 1-11535 4.4(Exhibit D)
4.13 Officer’s Certificate of Determination as to the terms of BNSF’s6.20% Debentures Due August 15, 2036, including the form ofthe Debentures.
10-Q 10/24/2006 1-11535 4.1
Ø References to BNSF refer to Burlington Northern Santa Fe Corporation for all periods through February 12, 2010, and toBurlington Northern Santa Fe, LLC for all periods on or after February 13, 2010.
Table of Contents
50
Part IV

Incorporated by Reference(if applicable)
Exhibit Number and Description Form File Date File No. Exhibit4.14 First Supplemental Indenture, dated as of April 13, 2007, to
Indenture dated as of December 1, 1995, between BNSF and TheBank of New York Trust Company, N.A., as Trustee.
8-K 4/13/2007 1-11535 4.1
4.15 Officer’s Certificate of Determination as to the terms of BNSF’s5.65% Debentures due May 1, 2017, and 6.15% Debentures DueMay 1, 2037, including the forms of the Debentures.
8-K 4/13/2007 1-11535 4.2
4.16 Second Supplemental Indenture, dated as of March 14, 2008, toIndenture dated as of December 1, 1995, between BNSF and TheBank of New York Mellon Trust Company, N.A., as Trustee.
8-K 3/14/2008 1-11535 4.1
4.17 Officers’ Certificate of Determination as to the terms of BNSF’s5.75% Notes due March 15, 2018, including the form of the Notes.
8-K 3/14/2008 1-11535 4.2
4.18 Third Supplemental Indenture, dated as of December 3, 2008, toIndenture dated as of December 1, 1995, between BNSF and TheBank of New York Mellon Trust Company, N.A., as Trustee.
8-K 12/3/2008 1-11535 4.1
4.19 Fourth Supplemental Indenture, dated as of September 24, 2009,to Indenture dated as of December 1, 1995, between BNSF andThe Bank of New York Mellon Trust Company, N.A., as Trustee,including the form of BNSF’s 4.700% Notes due October 1, 2019.
8-K 9/24/2009 1-11535 4.1
4.20 Certificate of Determination as to the terms of BNSF’s 4.700%Notes due October 1, 2019.
8-K 9/24/2009 1-11535 4.2
4.21 Fifth Supplemental Indenture, dated as of February 11, 2010, byand among Burlington Northern Santa Fe Corporation, RAcquisition Company, LLC and The Bank of New York MellonTrust Company, N.A.
8-K 2/16/2010 1-11535 4.1
4.22 Second Supplemental Indenture, dated as of February 11, 2010,by and among Burlington Northern Santa Fe Corporation, RAcquisition Company, LLC and U.S. Bank Trust NationalAssociation.
8-K 2/16/2010 1-11535 4.2
4.23 Sixth Supplemental Indenture, dated as of May 17, 2010, toIndenture dated as of December 1, 1995, between BNSF and TheBank of New York Mellon Trust Company, N.A., as Trustee.
8-K 5/17/2010 1-11535 4.1
4.24 Certificate of Determination as to the terms of BNSF’s 5.75%Debentures due May 1, 2040.
8-K 5/17/2010 1-11535 4.2
4.25 Seventh Supplemental Indenture, dated as of September 10, 2010,to Indenture dated as of December 1, 1995, between BNSF andThe Bank of New York Mellon Trust Company, N.A., as Trustee.
8-K 9/10/2010 1-11535 4.1
4.26 Certificate of Determination as to the terms of BNSF’s 3.60%Debentures due September 1, 2020 and 5.05% Debentures dueMarch 1, 2041.
8-K 9/10/2010 1-11535 4.2
4.27 Eighth Supplemental Indenture, dated as of May 19, 2011, toIndenture dated as of December 1, 1995, between BNSF and TheBank of New York Mellon Trust Company, N.A., as Trustee.
8-K 5/19/2011 1-11535 4.1
4.28 Certificate of Determination as to the terms of BNSF’s 4.10%Debentures due June 1, 2021 and 5.40% Debentures due June 1,
8-K 5/19/2011 1-11535 4.2
4.29 Ninth Supplemental Indenture, dated as of August 22, 2011, toIndenture dated as of December 1, 1995, between BNSF and TheBank of New York Mellon Trust Company, N.A., as Trustee.
8-K 8/22/2011 1-11535 4.1
4.30 Certificate of Determination as to the terms of BNSF's 3.45%Debentures due September 15, 2021 and 4.95% Debentures dueSeptember 15, 2041.
8-K 8/22/2011 1-11535 4.2
4.31 Tenth Supplemental Indenture, dated as of March 2, 2012, toIndenture dated as of December 1, 1995, between BNSF and TheBank of New York Mellon Trust Company, N.A., as Trustee.
8-K 3/2/2012 1-11535 4.1
4.32 Certificate of Determination as to the terms of BNSF's 3.05%Debentures due March 15, 2022 and 4.40% Debentures dueMarch 15, 2042.
8-K 3/2/2012 1-11535 4.2
4.33 Eleventh Supplemental Indenture, dated as of August 23, 2012,to Indenture dated as of December 1, 1995 between BNSF andThe Bank of New York Mellon Trust Company, N.A., as Trustee.
8-K 8/23/2012 1-11535 4.1
4.34 Certificate of Determination as to the terms of BNSF's 3.050%Debentures due September 1, 2022 and 4.375% Debentures dueSeptember 1, 2042.
8-K 8/23/2012 1-11535 4.2
Table of Contents
51

Incorporated by Reference(if applicable)
Exhibit Number and Description Form File Date File No. Exhibit4.35 Twelfth Supplemental Indenture, dated as of March 12, 2013, to
Indenture dated as of December 1, 1995 between BNSF and TheBank of New York Mellon Trust Company, N.A., as Trustee.
8-K 3/12/2013 1-11535 4.1
4.36 Certificate of Determination as to the terms of BNSF's 3.00%Debentures due March 15, 2023 and 4.45% Debentures due March15, 2043.
8-K 3/12/2013 1-11535 4.2
4.37 Thirteenth Supplemental Indenture, dated as of August 22, 2013,to Indenture dated December 1, 1995, between BNSF and TheBank of New York Mellon Trust Company, N.A., as Trustee.
8-K 8/22/2013 1-11535 4.1
4.38 Certificate of Determination as to the terms of BNSF's 3.850%Debentures due September 1, 2023 and 5.150% Debentures dueSeptember 1, 2043.
8-K 8/22/2013 1-11535 4.2
4.39 Fourteenth Supplemental Indenture, dated as of March 7, 2014,to Indenture dated as of December 1, 1995, between BNSF andThe Bank of New York Mellon Trust Company, N.A., as Trustee.
8-K 3/7/2014 1-11535 4.1
4.40 Certificate of Determination as to the terms of BNSF’s 3.750%Debentures due April 1, 2024 and 4.900% Debentures due April1, 2044.
8-K 3/7/2014 1-11535 4.2
4.41 Fifteenth Supplemental Indenture, dated as of August 18, 2014,to Indenture dated as of December 1, 1995, between BNSF andThe Bank of New York Mellon Trust Company, N.A., as Trustee.
8-K 8/18/2014 1-11535 4.1
4.42 Certificate of Determination as to the terms of BNSF’s 3.400%Debentures due September 1, 2024 and 4.550% Debentures dueSeptember 1, 2044.
8-K 8/18/2014 1-11535 4.2
4.43 Sixteenth Supplemental Indenture, dated as of March 9, 2015, toIndenture dated as of December 1, 1995, between BNSF and TheBank of New York Mellon Trust Company, N.A., as Trustee.
8-K 3/9/2015 1-11535 4.1
4.44 Certificate of Determination as to the terms of BNSF’s 3.000%Debentures due April 1, 2025 and 4.150% Debentures due April1, 2045.
8-K 3/9/2015 1-11535 4.2
4.45 Seventeenth Supplemental Indenture, dated as of August 20, 2015,to Indenture dated as of December 1, 1995, between BNSF andThe Bank of New York Mellon Trust Company, N.A., as Trustee.
8-K 8/20/2015 1-11535 4.1
4.46 Certificate of Determination as to the terms of BNSF's 3.650%Debentures due September 1, 2025 and 4.700% Debentures dueSeptember 1, 2045.
8-K 8/20/2015 1-11535 4.2
4.47 Eighteenth Supplemental Indenture, dated as of May 16, 2016, toIndenture dated as of December 1, 1995, between BNSF and TheBank of New York Mellon Trust Company, N.A., as Trustee.
8-K 5/16/2016 1-11535 4.1
4.48 Certificate of Determination as to the terms of BNSF's 3.900%Debentures due August 1, 2046.
8-K 5/16/2016 1-11535 4.2
4.49 Nineteenth Supplemental Indenture, dated as of March 9, 2017,to Indenture dated as of December 1, 1995, between BNSF andThe Bank of New York Mellon Trust Company, N.A., as Trustee.
8-K 3/9/2017 1-11535 4.1
4.50 Certificate of Determination as to the terms of BNSF's 3.250%Debentures due June 15, 2027 and 4.125% Debentures due June15, 2047.
8-K 3/9/2017 1-11535 4.2
Certain instruments evidencing long-term indebtedness of BNSF are not being filed as exhibits to this Report because the totalamount of securities authorized under any single such instrument does not exceed 10% of BNSF’s total assets. BNSF will furnishcopies of any material instruments upon request of the Securities and Exchange Commission.
(10) Material Contracts10.1 Replacement Capital Covenant, dated as of December 15, 2005,
by BNSF in favor of and for the benefit of each CoveredDebtholder (as defined therein).
8-K 12/15/2005 1-11535 10.1
(12) Statements re: Computation of Ratios12.1 Computation of Ratio of Earnings to Fixed Charges. ‡
(23) Consents of experts and counsel23.1 Consent of Deloitte & Touche LLP. ‡
‡ Filed herewith
Table of Contents
52

Table of Contents
53
Incorporated by Reference
(if applicable)Exhibit Number and Description Form File Date File No. Exhibit(24) Power of Attorney
24.1 Power of Attorney. ‡
(31) Rule 13a-14(a)/15d-14(a) Certifications31.1 Principal Executive Officer’s Certifications Pursuant to Rule
13a-14(a) (Section 302 of the Sarbanes-Oxley Act of 2002). ‡ 31.2 Principal Financial Officer’s Certifications Pursuant to Rule
13a-14(a) (Section 302 of the Sarbanes-Oxley Act of 2002). ‡
(32) Section 1350 Certifications32.1 Certification Pursuant to Rule 13a-14(b) and 18 U.S.C. § 1350
(Section 906 of the Sarbanes-Oxley Act of 2002). ‡(101) XBRL-Related Documents
101 eXtensible Business Reporting Language (XBRL) documents submitted electronically: 101.INS - XBRL Instance Document 101.SCH - XBRL Taxonomy Extension Schema Document 101.CAL - XBRL Extension Calculation Linkable Document 101.DEF - XBRL Taxonomy Extension Definition Linkable Document 101.LAB - XBRL Taxonomy Extension Label Linkbase Document 101.PRE - XBRL Taxonomy Extension Presentation Linkbase Document
The following financial information from Burlington Northern Santa Fe, LLC's Annual Report on Form 10-K for the year ended December 31, 2017, formatted in XBRL includes: (i) the Consolidated Statements of Income for the years ended December 31, 2017, 2016 and 2015, (ii) the Consolidated Statements of Comprehensive Income for the years ended December 31, 2017, 2016 and 2015, (iii) the Consolidated Balance Sheets as of December 31, 2017 and 2016, (iv) the Consolidated Statements of Cash Flows for the years ended December 31, 2017, 2016 and 2015, (v) the Consolidated Statements of Changes in Equity for the years ended December 31, 2017, 2016 and 2015, and (v) the Notes to the Consolidated Financial Statements. ‡
‡ Filed herewith

Table of Contents
S-1
Signatures
Pursuant to the requirements of Section 13 or 15(d) of the Securities Exchange Act of 1934, Burlington Northern Santa Fe, LLC has duly caused this report to be signed on its behalf by the undersigned, thereunto duly authorized.
Burlington Northern Santa Fe, LLC By: /s/ Matthew K. Rose
Dated: February 23, 2018 Matthew K. Rose
Executive Chairman and Chief Executive Officer
Pursuant to the requirements of the Securities Exchange Act of 1934, this report has been signed below by the following persons on behalf of Burlington Northern Santa Fe, LLC and in the capacities and on the date indicated.
Signature Title /s/ Matthew K. Rose Executive Chairman and Chief Executive Officer Matthew K. Rose (Principal Executive Officer), and Manager
/s/ Carl R. Ice President and Chief Operating OfficerCarl R. Ice (Principal Operating Officer), and Manager
/s/ Julie A. Piggott Executive Vice President and Chief Financial Officer Julie A. Piggott (Principal Financial Officer), and Manager
/s/ Jon I. Stevens Vice President and Controller Jon I. Stevens (Principal Accounting Officer)
/s/ Gregory E. Abel* ManagerGregory E. Abel
/s/ Stevan B. Bobb Manager Stevan B. Bobb
/s/ Warren E. Buffett* Manager Warren E. Buffett
/s/ David L. Freeman ManagerDavid L. Freeman
/s/ Marc D. Hamburg* Manager Marc D. Hamburg
/s/ Roger Nober Manager Roger Nober
*By: /s/ Judy K. CarterDated: February 23, 2018 Judy K. Carter, Attorney-in-fact

E-1
Exhibit 12.1
Burlington Northern Santa Fe, LLC and Subsidiaries Computation of Ratio of Earnings to Fixed ChargesIn millions, except ratio amounts(Unaudited)
2017 2016 2015 2014 2013Earnings:Income before income taxes $ 6,328 $ 5,693 $ 6,775 $ 6,169 $ 5,928Add:Interest and other fixed charges, excluding capitalizedinterest 1,016 992 928 833 729Reasonable approximation of portion of rent underlong-term operating leases representative of an interestfactor 184 192 200 200 189Distributed income of investees accounted for under theequity method 7 6 14 7 7Amortization of capitalized interest 5 4 4 3 2Less:Equity in earnings of investments accounted for underthe equity method 136 16 16 16 14 Total earnings available for fixed charges $ 7,404 $ 6,871 $ 7,905 $ 7,196 $ 6,841Fixed charges:Interest and fixed charges $ 1,038 $ 1,018 $ 962 $ 863 $ 758Reasonable approximation of portion of rent underlong-term operating leases representative of an interestfactor 184 192 200 200 189 Total fixed charges $ 1,222 $ 1,210 $ 1,162 $ 1,063 $ 947Ratio of earnings to fixed charges 6.06x 5.68x 6.80x 6.77x 7.22x

E-2
Exhibit 23.1
CONSENT OF INDEPENDENT REGISTERED PUBLIC ACCOUNTING FIRM
We consent to the incorporation by reference in Registration Statement No. 333-211220 on Form S-3 of our report dated February 23, 2018, relating to the consolidated financial statements of Burlington Northern Santa Fe, LLC and subsidiaries, appearing in this Annual Report on Form 10-K of Burlington Northern Santa Fe, LLC for the year ended December 31, 2017.
/s/ DELOITTE & TOUCHE LLP
Fort Worth, Texas February 23, 2018

E-3
Exhibit 24.1
POWER OF ATTORNEY
WHEREAS, BURLINGTON NORTHERN SANTA FE, LLC, a Delaware limited liability company (the “Company”), will file with the U.S. Securities and Exchange Commission, under the provisions of the Securities Exchange Act of 1934, as amended, its Annual Report on Form 10-K for the fiscal year ended December 31, 2017; and
WHEREAS, the undersigned serve the Company in the capacity indicated;
NOW, THEREFORE, the undersigned hereby constitutes and appoints JULIE A. PIGGOTT or JUDY K. CARTER, the undersigned's attorney with full power to act for the undersigned in the undersigned's name, place and stead, to sign the undersigned's name in the capacity set forth below, to the Annual Report on Form 10-K of the Company for the fiscal year ended December 31, 2017, and to any and all amendments to such Annual Report on Form 10-K, and hereby ratifies and confirms all that said attorney may or shall lawfully do or cause to be done by virtue hereof.
IN WITNESS WHEREOF, this Power of Attorney has been executed by the undersigned this 23rd day of February, 2018.
/s/ Warren E. Buffett /s/ Marc D. HamburgWarren E. Buffett, Manager Marc D. Hamburg, Manager
/s/ Gregory E. Abel /s/ Matthew K. RoseGregory E. Abel, Manager Matthew K. Rose, Manager and
Executive Chairman and Chief Executive Officer
/s/ Carl R. Ice /s/ David L. FreemanCarl R. Ice, Manager andPresident and Chief Operating Officer
David L. Freeman, Manager
/s/ Julie A. Piggott /s/ Stevan B. BobbJulie A. Piggott, Manager and Executive Vice President and Chief Financial Officer
Stevan B. Bobb, Manager
/s/ Roger NoberRoger Nober, Manager

E-4
Exhibit 31.1
Principal Executive Officer’s CertificationsPursuant to Section 302 of the Sarbanes-Oxley Act of 2002
I, Matthew K. Rose, certify that:
1. I have reviewed this annual report on Form 10-K of Burlington Northern Santa Fe, LLC;
2. Based on my knowledge, this report does not contain any untrue statement of a material fact or omit to state a material fact necessary to make the statements made, in light of the circumstances under which such statements were made, not misleading with respect to the period covered by this report;
3. Based on my knowledge, the financial statements, and other financial information included in this report, fairly present in all material respects the financial condition, results of operations and cash flows of the registrant as of, and for, the periods presented in this report;
4. The registrant’s other certifying officer and I are responsible for establishing and maintaining disclosure controls and procedures (as defined in Exchange Act Rules 13a-15(e) and 15d-15(e)) and internal control over financial reporting (as defined in Exchange Act Rules 13a-15(f) and 15d-15(f)) for the registrant and have:
(a) Designed such disclosure controls and procedures, or caused such disclosure controls and procedures to be designed under our supervision, to ensure that material information relating to the registrant, including its consolidated subsidiaries, is made known to us by others within those entities, particularly during the period in which this report is being prepared;
(b) Designed such internal control over financial reporting, or caused such internal control over financial reporting to be designed under our supervision, to provide reasonable assurance regarding the reliability of financial reporting and the preparation of financial statements for external purposes in accordance with generally accepted accounting principles;
(c) Evaluated the effectiveness of the registrant’s disclosure controls and procedures and presented in this report our conclusions about the effectiveness of the disclosure controls and procedures, as of the end of the period covered by this report based on such evaluation; and
(d) Disclosed in this report any change in the registrant’s internal control over financial reporting that occurred during the registrant’s most recent fiscal quarter (the registrant’s fourth fiscal quarter in the case of an annual report) that has materially affected, or is reasonably likely to materially affect, the registrant’s internal control over financial reporting; and
5. The registrant’s other certifying officer and I have disclosed, based on our most recent evaluation of internal control over financial reporting, to the registrant’s auditors and the audit committee of the registrant’s board of directors (or persons performing the equivalent functions):
(a) All significant deficiencies and material weaknesses in the design or operation of internal control over financial reporting
which are reasonably likely to adversely affect the registrant’s ability to record, process, summarize and report financial information; and
(b) Any fraud, whether or not material, that involves management or other employees who have a significant role in the registrant’s internal control over financial reporting.
/s/ Matthew K. RoseDate: February 23, 2018 Matthew K. Rose
Executive Chairman and Chief Executive Officer

E-5
Exhibit 31.2
Principal Financial Officer’s CertificationsPursuant to Section 302 of the Sarbanes-Oxley Act of 2002
I, Julie A. Piggott, certify that:
1. I have reviewed this annual report on Form 10-K of Burlington Northern Santa Fe, LLC;
2. Based on my knowledge, this report does not contain any untrue statement of a material fact or omit to state a material fact necessary to make the statements made, in light of the circumstances under which such statements were made, not misleading with respect to the period covered by this report;
3. Based on my knowledge, the financial statements, and other financial information included in this report, fairly present in all material respects the financial condition, results of operations and cash flows of the registrant as of, and for, the periods presented in this report;
4. The registrant’s other certifying officer and I are responsible for establishing and maintaining disclosure controls and procedures (as defined in Exchange Act Rules 13a-15(e) and 15d-15(e)) and internal control over financial reporting (as defined in Exchange Act Rules 13a-15(f) and 15d-15(f)) for the registrant and have:
(a) Designed such disclosure controls and procedures, or caused such disclosure controls and procedures to be designed under our supervision, to ensure that material information relating to the registrant, including its consolidated subsidiaries, is made known to us by others within those entities, particularly during the period in which this report is being prepared;
(b) Designed such internal control over financial reporting, or caused such internal control over financial reporting to be designed under our supervision, to provide reasonable assurance regarding the reliability of financial reporting and the preparation of financial statements for external purposes in accordance with generally accepted accounting principles;
(c) Evaluated the effectiveness of the registrant’s disclosure controls and procedures and presented in this report our conclusions about the effectiveness of the disclosure controls and procedures, as of the end of the period covered by this report based on such evaluation; and
(d) Disclosed in this report any change in the registrant’s internal control over financial reporting that occurred during the registrant’s most recent fiscal quarter (the registrant’s fourth fiscal quarter in the case of an annual report) that has materially affected, or is reasonably likely to materially affect, the registrant’s internal control over financial reporting; and
5. The registrant’s other certifying officer and I have disclosed, based on our most recent evaluation of internal control over financial reporting, to the registrant’s auditors and the audit committee of the registrant’s board of directors (or persons performing the equivalent functions):
(a) All significant deficiencies and material weaknesses in the design or operation of internal control over financial reporting
which are reasonably likely to adversely affect the registrant’s ability to record, process, summarize and report financial information; and
(b) Any fraud, whether or not material, that involves management or other employees who have a significant role in the registrant’s internal control over financial reporting.
/s/ Julie A. PiggottDate: February 23, 2018 Julie A. Piggott
Executive Vice President and Chief Financial Officer

E-6
Exhibit 32.1
Certification Pursuant to 18 U.S.C. § 1350(Section 906 of Sarbanes-Oxley Act of 2002)
Burlington Northern Santa Fe, LLC
In connection with the Annual Report of Burlington Northern Santa Fe, LLC (the “Company”) on Form 10-K for the year ended December 31, 2017, as filed with the Securities and Exchange Commission on the date hereof (the “Report”), the undersigned, Matthew K. Rose, Executive Chairman and Chief Executive Officer of the Company, and Julie A. Piggott, Executive Vice President and Chief Financial Officer of the Company, each hereby certifies that, to his/her knowledge on the date hereof:
1. The Report fully complies with the requirements of section 13(a) or 15(d) of the Securities Exchange Act of 1934; and
2. The information contained in the Report fairly presents, in all material respects, the financial condition and results of operations of the Company.
Dated: February 23, 2018
/s/ Matthew K. Rose /s/ Julie A. Piggott Matthew K. Rose
Executive Chairman and Chief Executive Officer
Julie A. Piggott Executive Vice President and Chief Financial Officer
A signed original of this written statement required by Section 906 has been provided to Burlington Northern Santa Fe, LLC and will be retained by Burlington Northern Santa Fe, LLC and furnished to the Securities and Exchange Commission or its staff upon request.