lmt board presentation
TRANSCRIPT
Buy
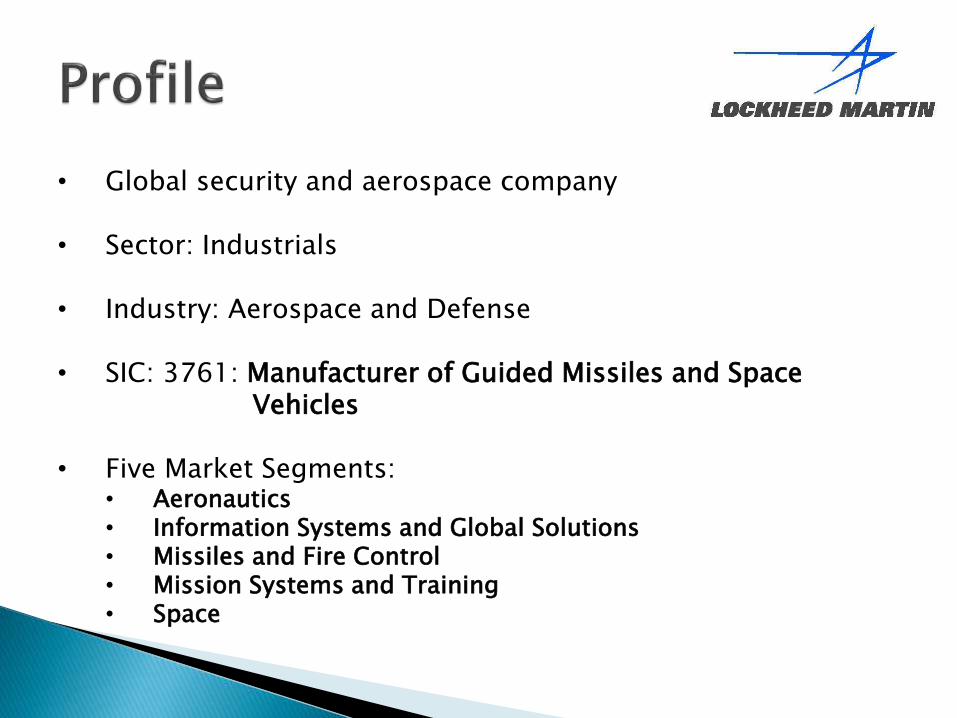
• Global security and aerospace company
• Sector: Industrials
• Industry: Aerospace and Defense
• SIC: 3761: Manufacturer of Guided Missiles and Space Vehicles
• Five Market Segments:• Aeronautics• Information Systems and Global Solutions• Missiles and Fire Control• Mission Systems and Training• Space

$45,358
21%
$86,623
41%
$31,218
15%
$24,661
12%
$23,706
11%
2013 Sales
Lockheed Martin
(LMT)Boeing (BA)
General Dynamics
(GD)Northrop
Grumman (NOC)Raytheon (RTN)
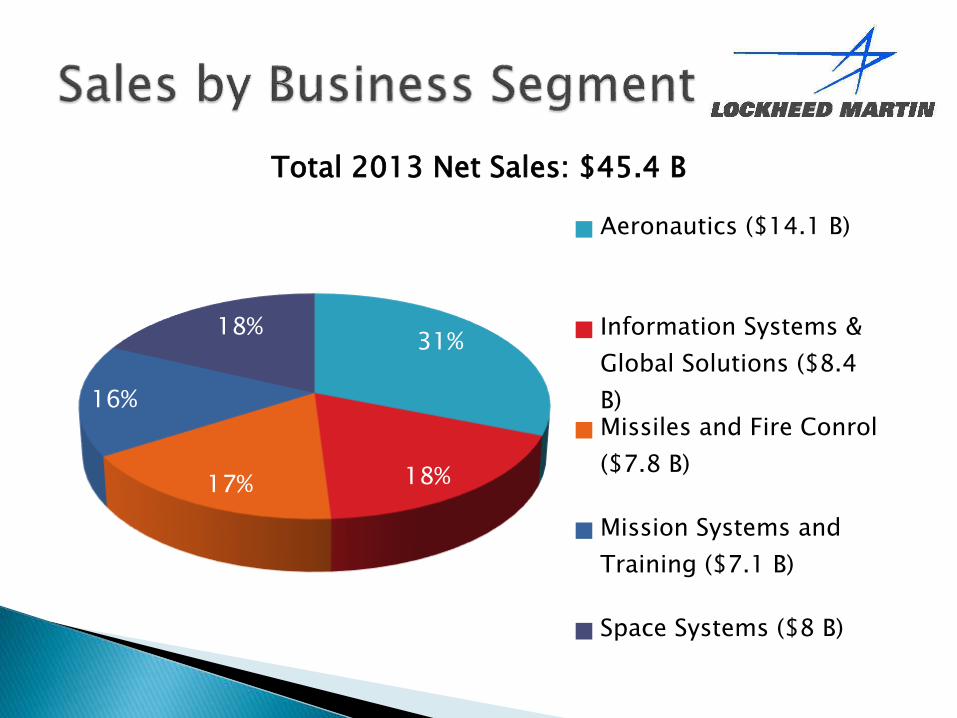
31%
18%17%
16%
18%
Total 2013 Net Sales: $45.4 B
Aeronautics ($14.1 B)
Information Systems &
Global Solutions ($8.4
B)Missiles and Fire Conrol
($7.8 B)
Mission Systems and
Training ($7.1 B)
Space Systems ($8 B)
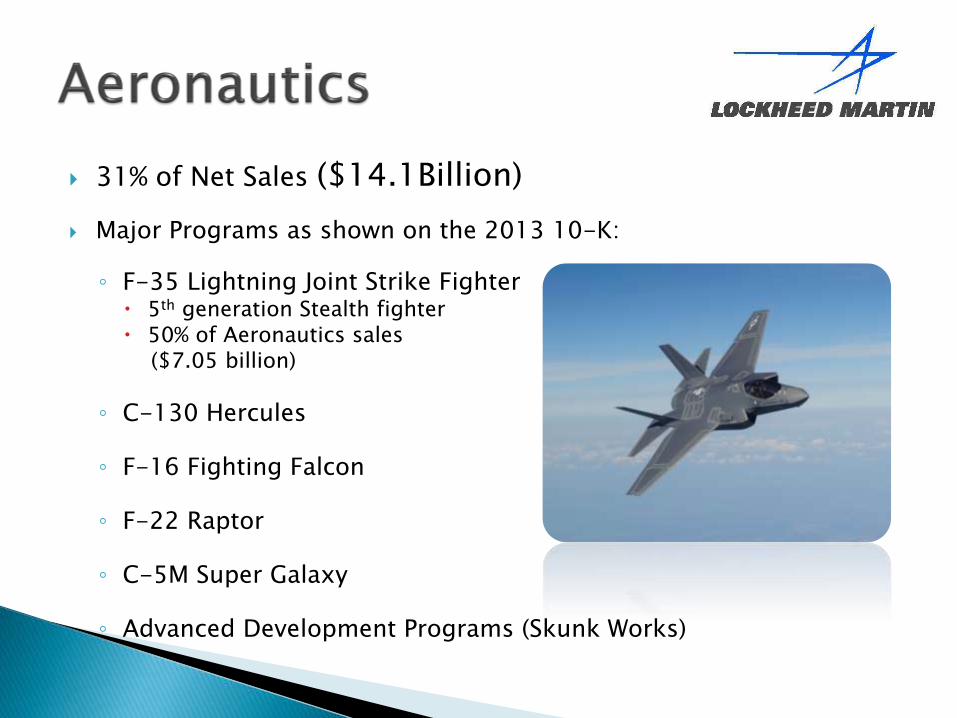
31% of Net Sales ($14.1Billion)
Major Programs as shown on the 2013 10-K:
◦ F-35 Lightning Joint Strike Fighter 5th generation Stealth fighter 50% of Aeronautics sales
($7.05 billion)
◦ C-130 Hercules
◦ F-16 Fighting Falcon
◦ F-22 Raptor
◦ C-5M Super Galaxy
◦ Advanced Development Programs (Skunk Works)
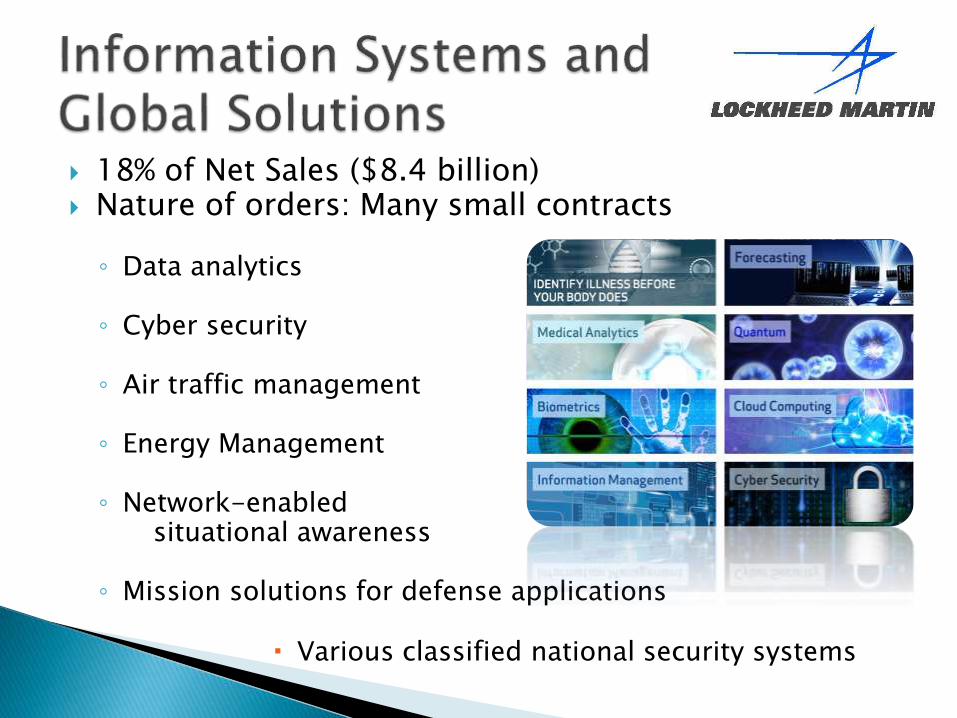
18% of Net Sales ($8.4 billion) Nature of orders: Many small contracts
◦ Data analytics
◦ Cyber security
◦ Air traffic management
◦ Energy Management
◦ Network-enabled situational awareness
◦ Mission solutions for defense applications
Various classified national security systems
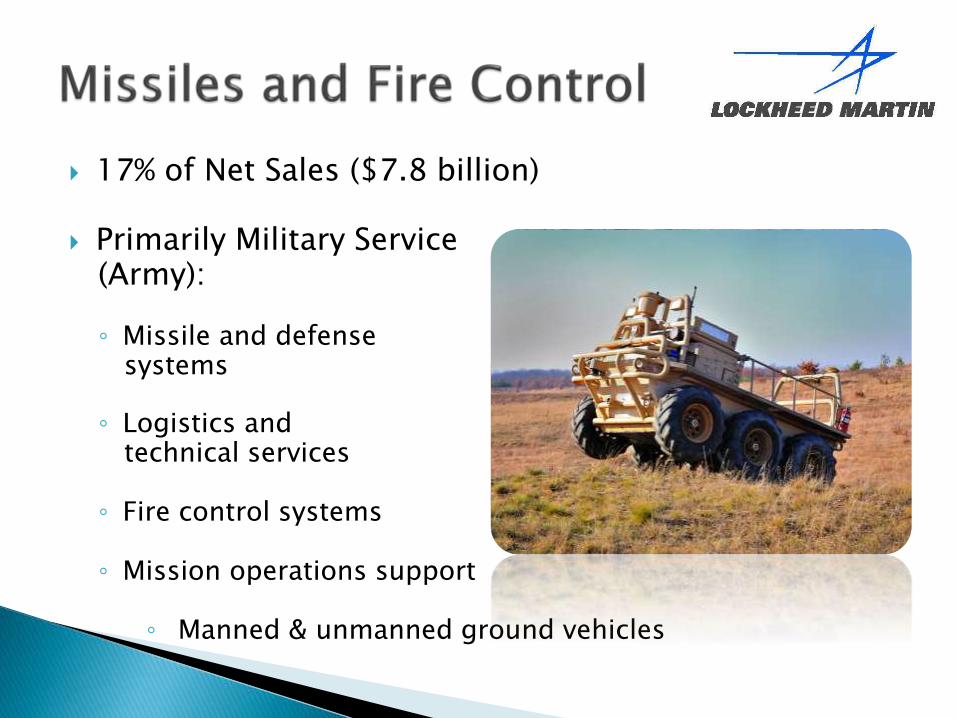
17% of Net Sales ($7.8 billion)
Primarily Military Service (Army):
◦ Missile and defense systems
◦ Logistics and technical services
◦ Fire control systems
◦ Mission operations support
◦ Manned & unmanned ground vehicles
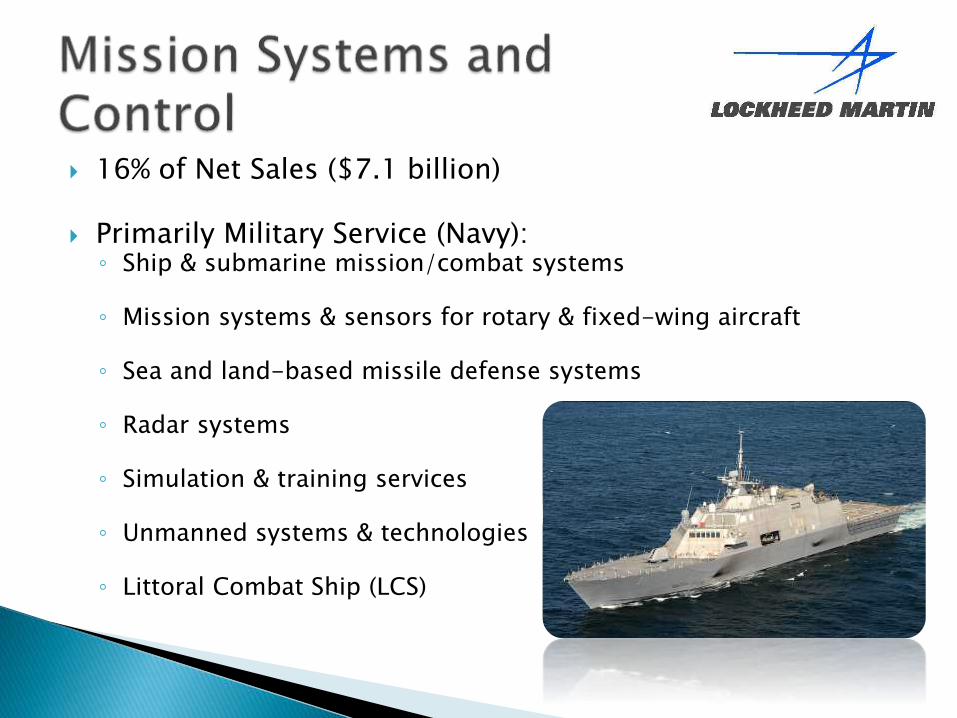
16% of Net Sales ($7.1 billion)
Primarily Military Service (Navy):◦ Ship & submarine mission/combat systems
◦ Mission systems & sensors for rotary & fixed-wing aircraft
◦ Sea and land-based missile defense systems
◦ Radar systems
◦ Simulation & training services
◦ Unmanned systems & technologies
◦ Littoral Combat Ship (LCS)
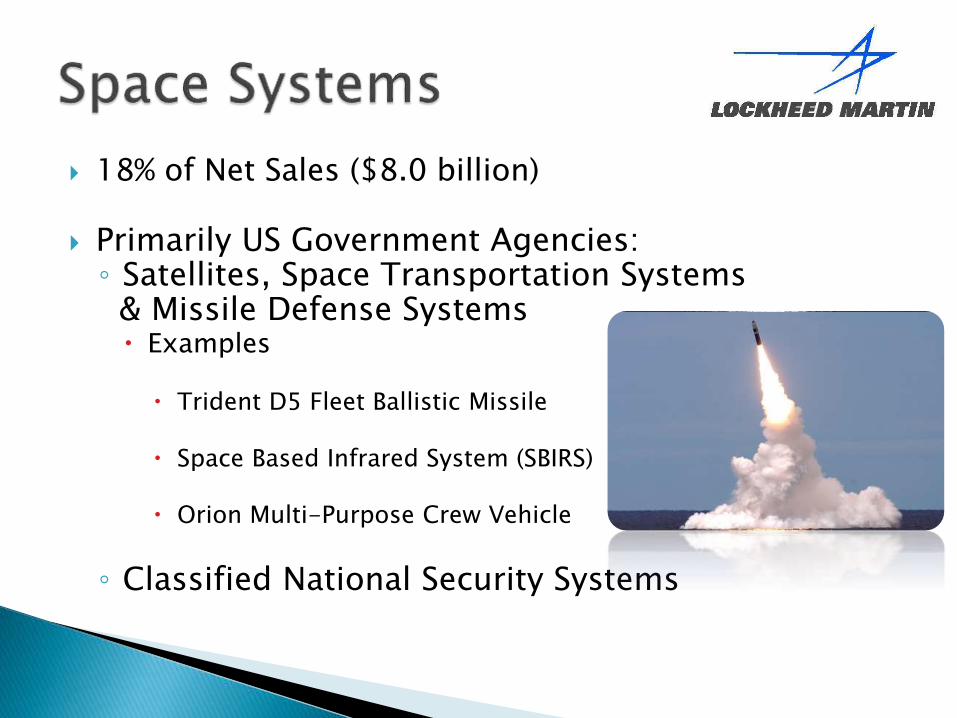
18% of Net Sales ($8.0 billion)
Primarily US Government Agencies:◦ Satellites, Space Transportation Systems
& Missile Defense Systems Examples
Trident D5 Fleet Ballistic Missile
Space Based Infrared System (SBIRS)
Orion Multi-Purpose Crew Vehicle
◦ Classified National Security Systems
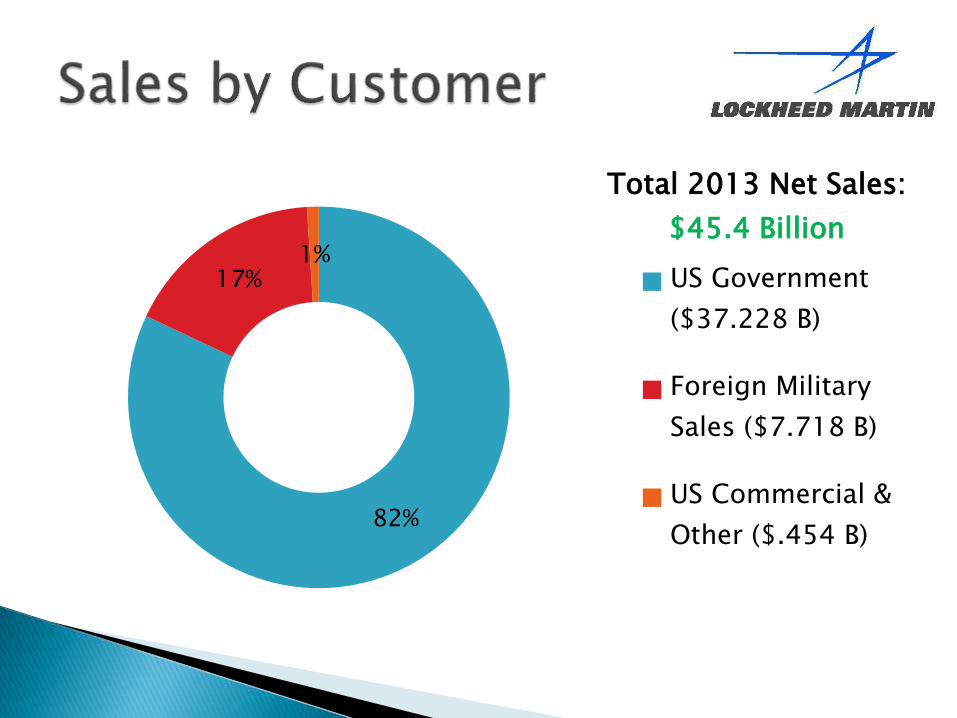
82%
17%1%
Total 2013 Net Sales:
$45.4 Billion
US Government
($37.228 B)
Foreign Military
Sales ($7.718 B)
US Commercial &
Other ($.454 B)
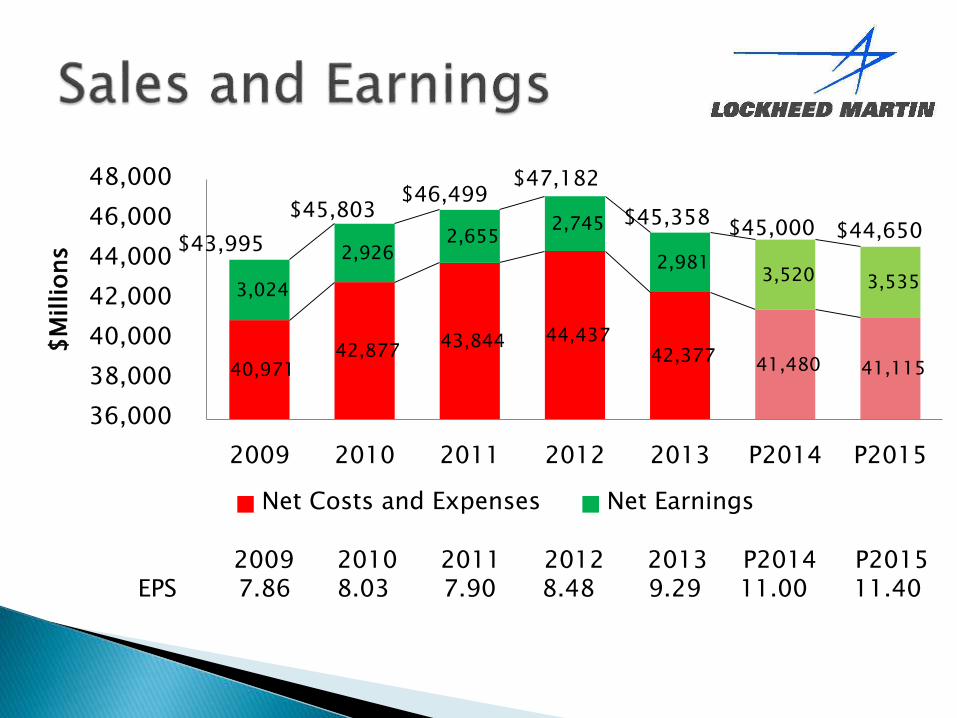
40,971 42,877
43,844 44,437 42,377 41,480 41,115
3,024
2,926 2,655
2,745
2,981 3,520 3,535
36,000
38,000
40,000
42,000
44,000
46,000
48,000
2009 2010 2011 2012 2013 P2014 P2015
$M
illions
Net Costs and Expenses Net Earnings
$43,995
$45,803$46,499
$47,182
$45,358$45,000 $44,650
2009 2010 2011 2012 2013 P2014 P2015EPS 7.86 8.03 7.90 8.48 9.29 11.00 11.40
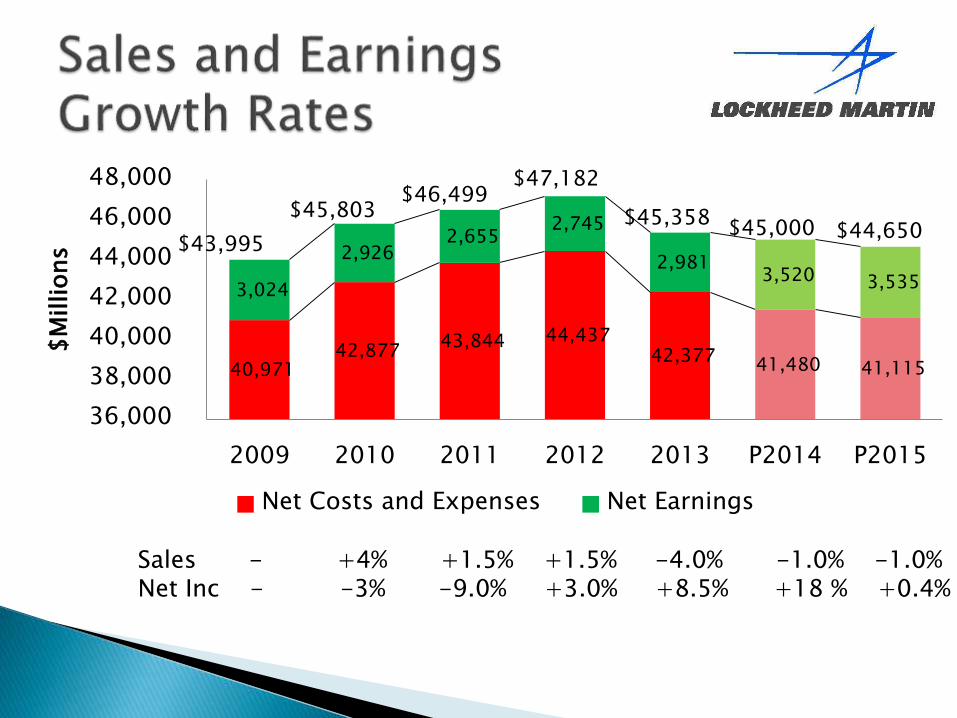
40,971 42,877
43,844 44,437 42,377 41,480 41,115
3,024
2,926 2,655
2,745
2,981 3,520 3,535
36,000
38,000
40,000
42,000
44,000
46,000
48,000
2009 2010 2011 2012 2013 P2014 P2015
$M
illions
Net Costs and Expenses Net Earnings
$43,995
$45,803$46,499
$47,182
$45,358$45,000 $44,650
Sales - +4% +1.5% +1.5% -4.0% -1.0% -1.0%Net Inc - -3% -9.0% +3.0% +8.5% +18.% +0.4%

40,971 42,877
43,844 44,437 42,377 41,480 41,115
3,024
2,926 2,655
2,745
2,981 3,520 3,535
36,000
38,000
40,000
42,000
44,000
46,000
48,000
2009 2010 2011 2012 2013 P2014 P2015
$M
illions
Net Costs and Expenses Net Earnings
$43,995
$45,803$46,499
$47,182
$45,358$45,000 $44,650
SPS - +9% +9% +2% -3.0% +2% +2.5%EPS - +2% -2% +7% +9.5% +18% +3.6%
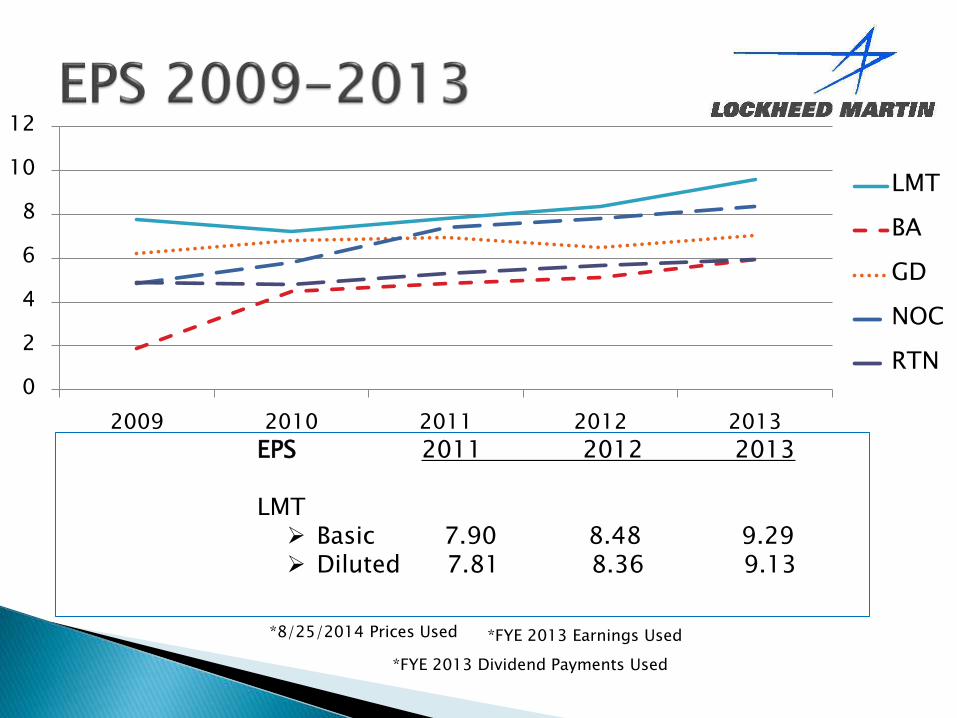
EPS 2011 2012 2013
LMT Basic 7.90 8.48 9.29 Diluted 7.81 8.36 9.13
*8/25/2014 Prices Used *FYE 2013 Earnings Used
*FYE 2013 Dividend Payments Used
0
2
4
6
8
10
12
2009 2010 2011 2012 2013
LMT
BA
GD
NOC
RTN

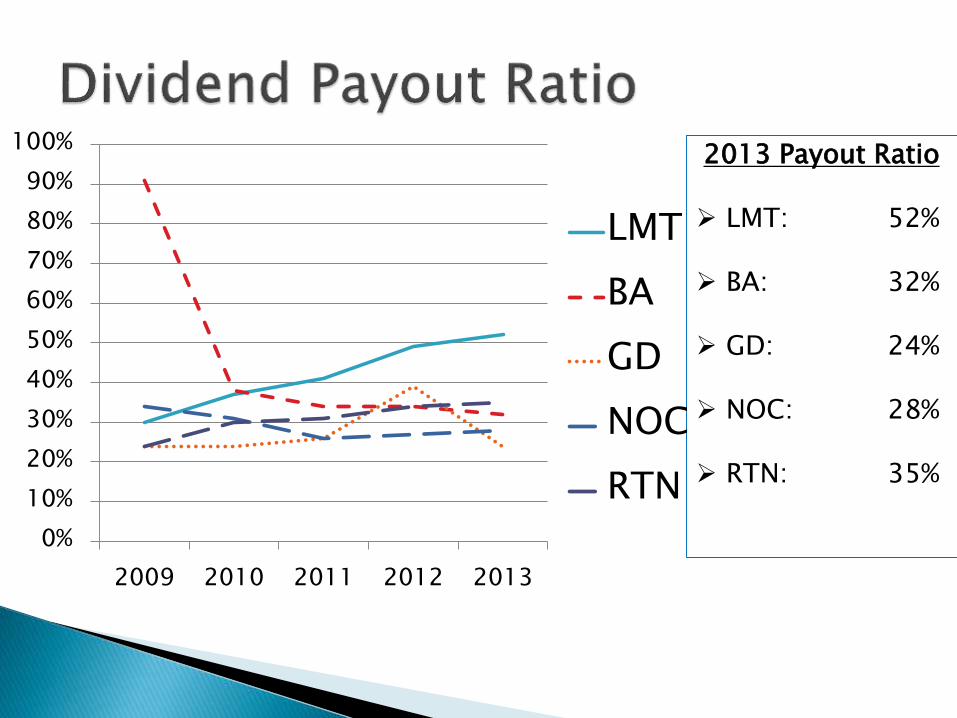
2013 Payout Ratio
LMT: 52%
BA: 32%
GD: 24%
NOC: 28%
RTN: 35%
0%
10%
20%
30%
40%
50%
60%
70%
80%
90%
100%
2009 2010 2011 2012 2013
LMT
BA
GD
NOC
RTN
0
50
100
150
200
250
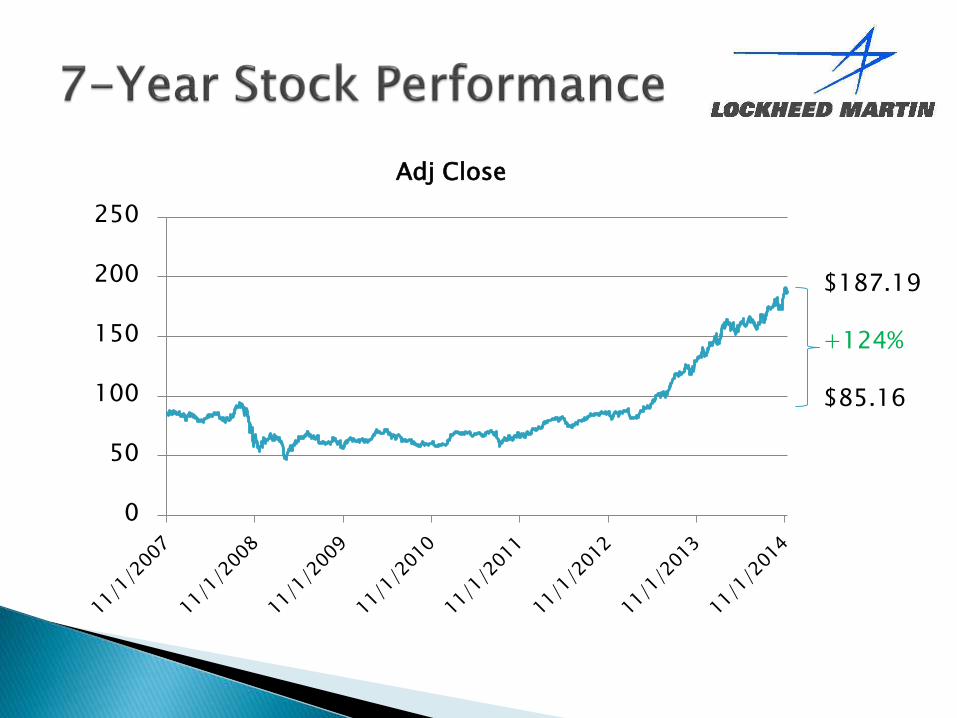
Adj Close
$187.19
+124%
$85.16
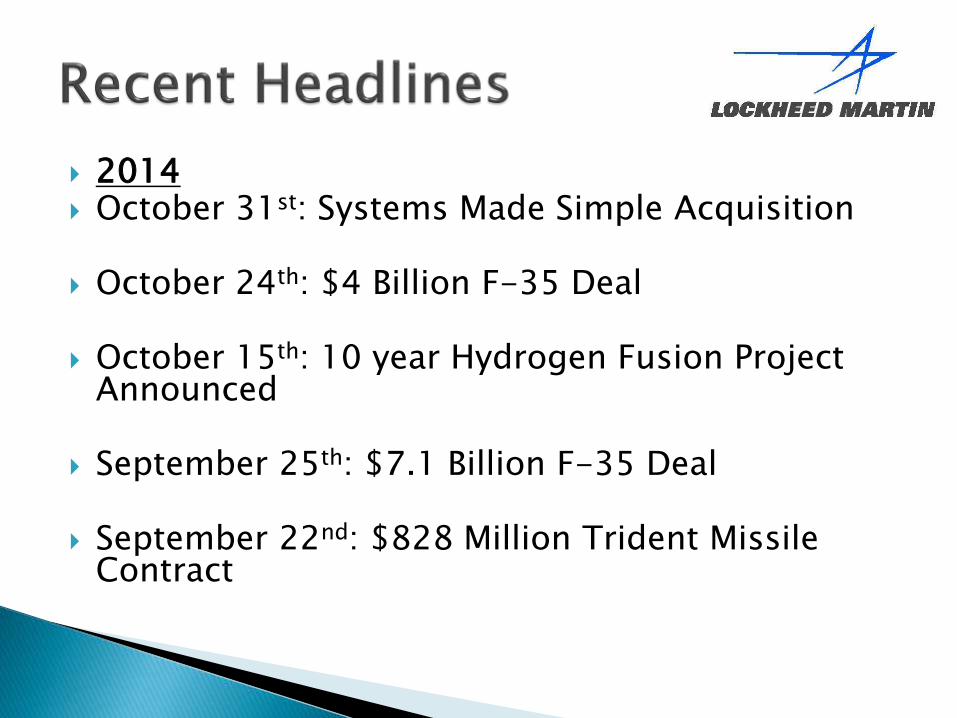
2014 October 31st: Systems Made Simple Acquisition
October 24th: $4 Billion F-35 Deal
October 15th: 10 year Hydrogen Fusion Project Announced
September 25th: $7.1 Billion F-35 Deal
September 22nd: $828 Million Trident Missile Contract
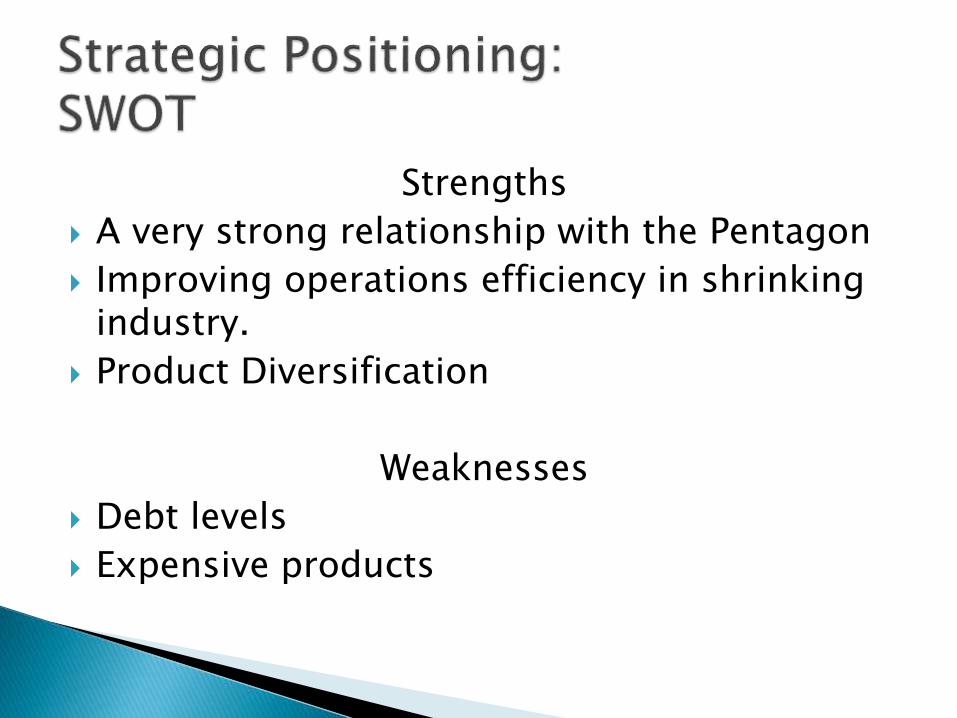
Strengths
A very strong relationship with the Pentagon
Improving operations efficiency in shrinking industry.
Product Diversification
Weaknesses
Debt levels
Expensive products
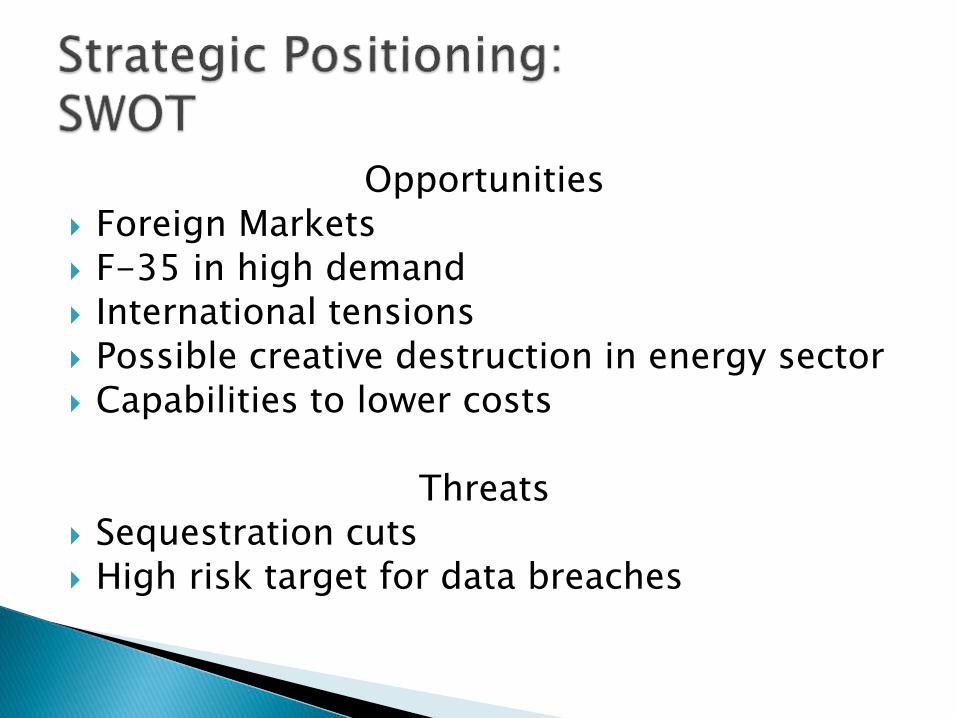
Opportunities Foreign Markets F-35 in high demand International tensions Possible creative destruction in energy sector Capabilities to lower costs
Threats Sequestration cuts High risk target for data breaches
8
10
12
14
16
18
20
22
24
2009 2010 2011 2012 2013
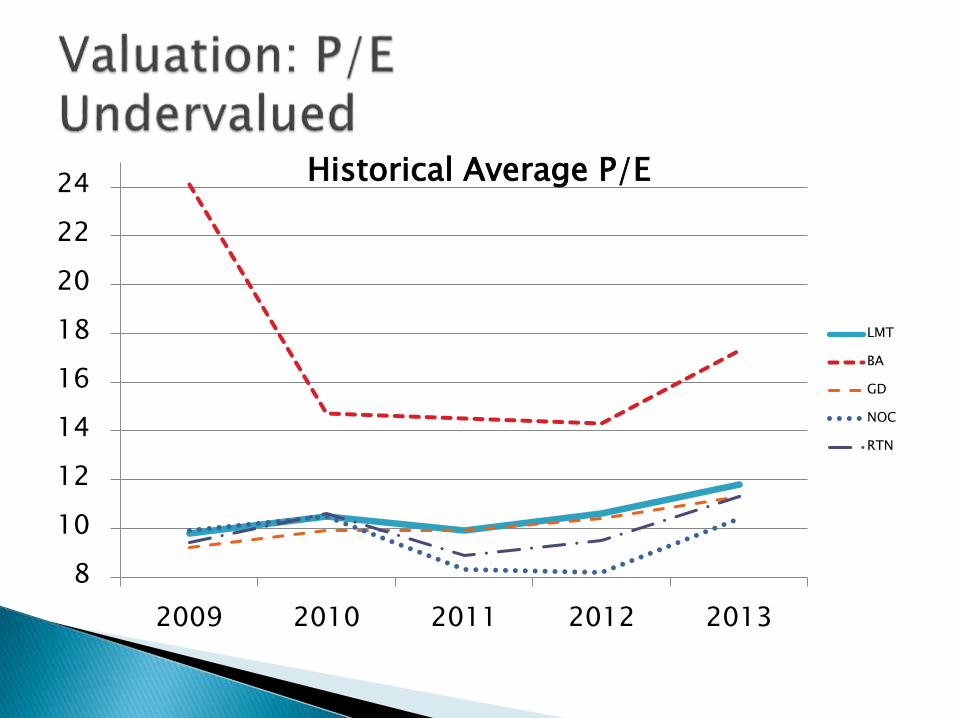
Historical Average P/E
LMT
BA
GD
NOC
RTN
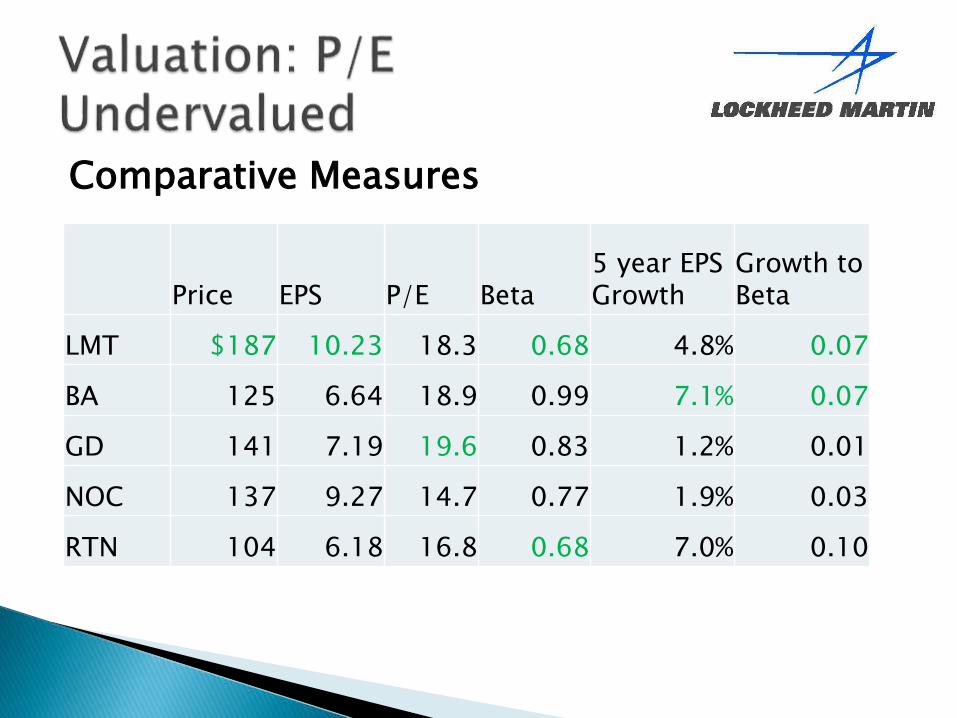
Comparative Measures
Price EPS P/E Beta5 year EPS Growth
Growth to Beta
LMT $187 10.23 18.3 0.68 4.8% 0.07
BA 125 6.64 18.9 0.99 7.1% 0.07
GD 141 7.19 19.6 0.83 1.2% 0.01
NOC 137 9.27 14.7 0.77 1.9% 0.03
RTN 104 6.18 16.8 0.68 7.0% 0.10
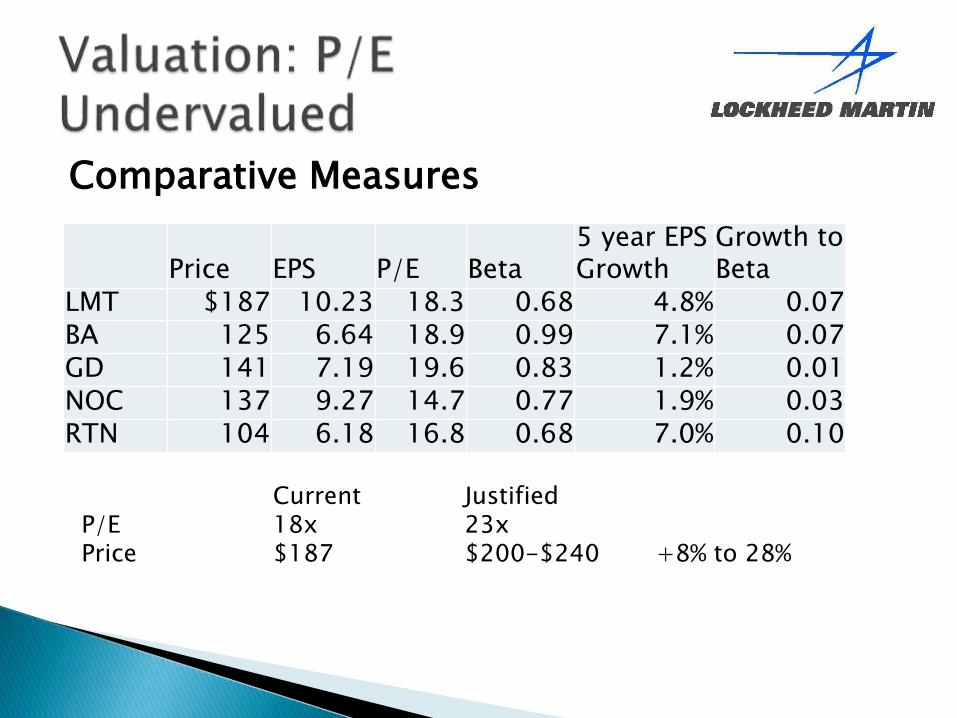
Comparative Measures
Price EPS P/E Beta5 year EPS Growth
Growth to Beta
LMT $187 10.23 18.3 0.68 4.8% 0.07BA 125 6.64 18.9 0.99 7.1% 0.07
GD 141 7.19 19.6 0.83 1.2% 0.01
NOC 137 9.27 14.7 0.77 1.9% 0.03RTN 104 6.18 16.8 0.68 7.0% 0.10
Current JustifiedP/E 18x 23xPrice $187 $200-$240 +8% to 28%
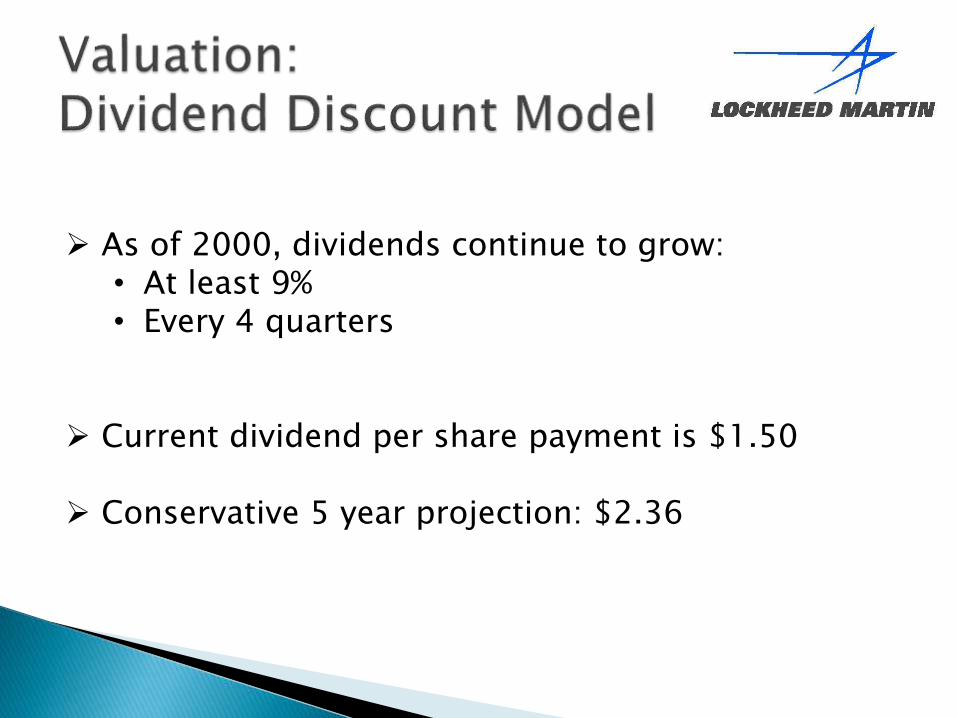
As of 2000, dividends continue to grow:• At least 9%• Every 4 quarters
Current dividend per share payment is $1.50
Conservative 5 year projection: $2.36
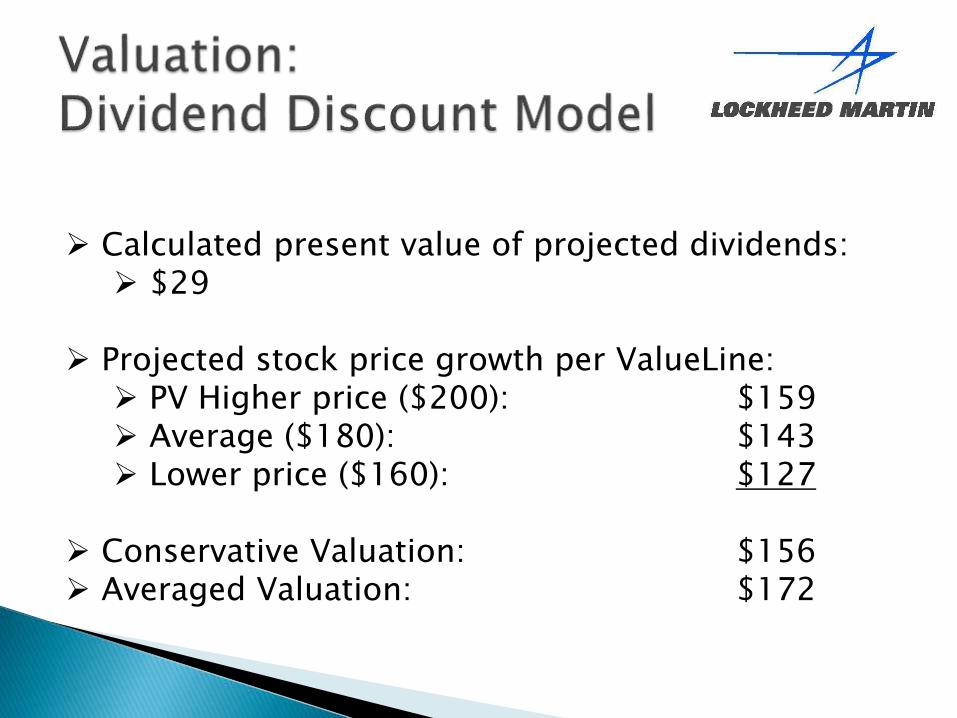
Calculated present value of projected dividends: $29
Projected stock price growth per ValueLine: PV Higher price ($200): $159 Average ($180): $143 Lower price ($160): $127
Conservative Valuation: $156 Averaged Valuation: $172
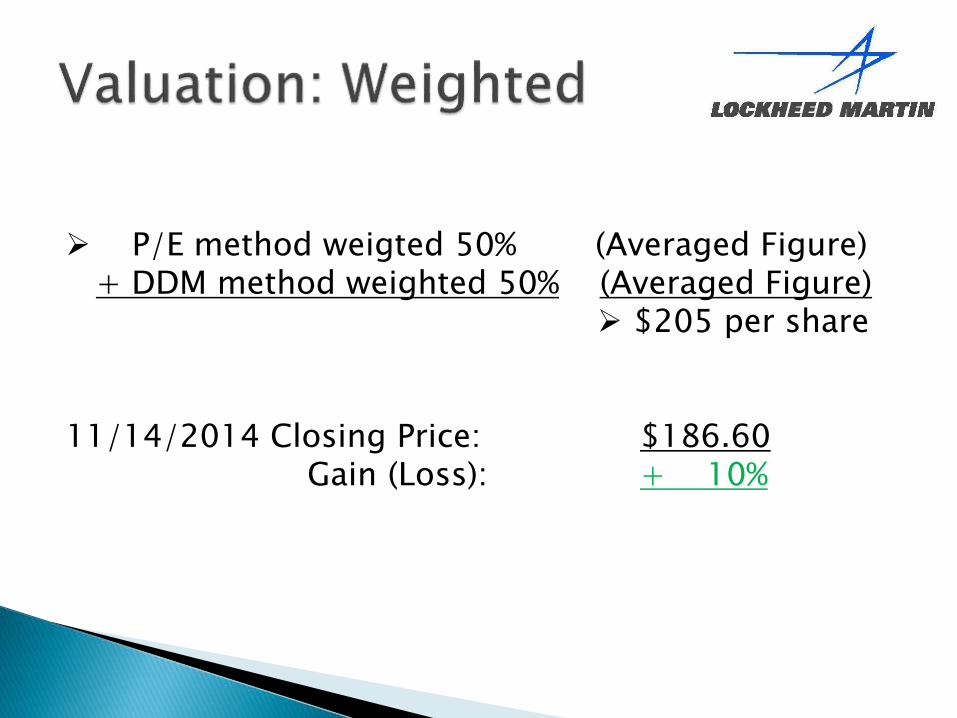
P/E method weigted 50% (Averaged Figure)+ DDM method weighted 50% (Averaged Figure)
$205 per share
11/14/2014 Closing Price: $186.60.....Gain (Loss): + 10%
Buy Lockheed Martin◦ Demand for products are growing.
◦ International issues are growing tense.
◦ Strong relations with US government.
◦ High diversification.
Appendix
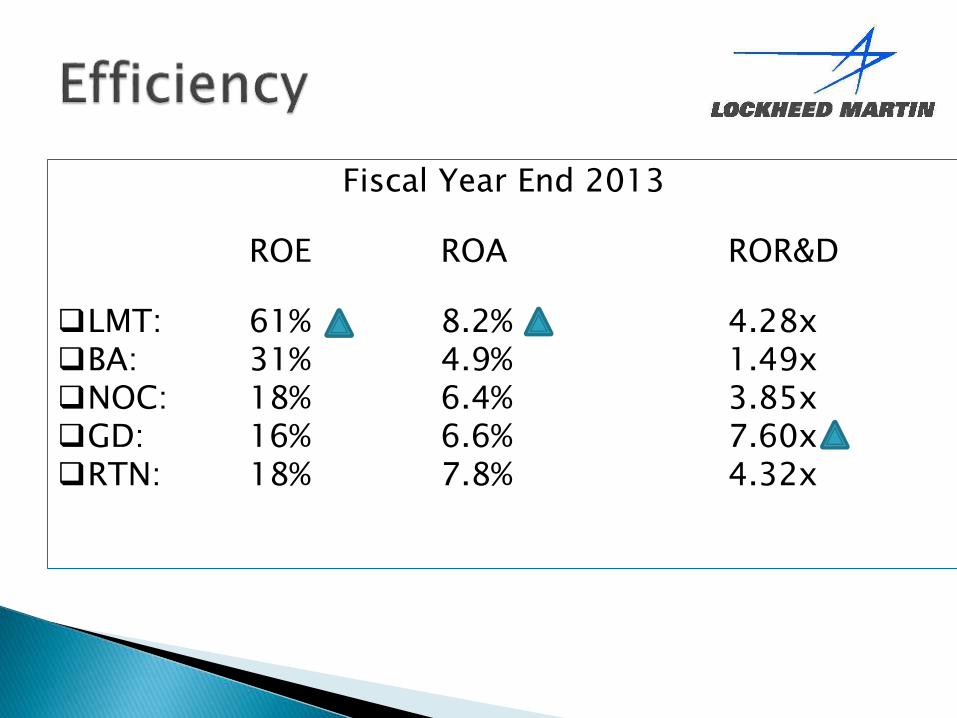
Fiscal Year End 2013
ROE ROA ROR&D
LMT: 61% 8.2% 4.28xBA: 31% 4.9% 1.49xNOC: 18% 6.4% 3.85xGD: 16% 6.6% 7.60xRTN: 18% 7.8% 4.32x
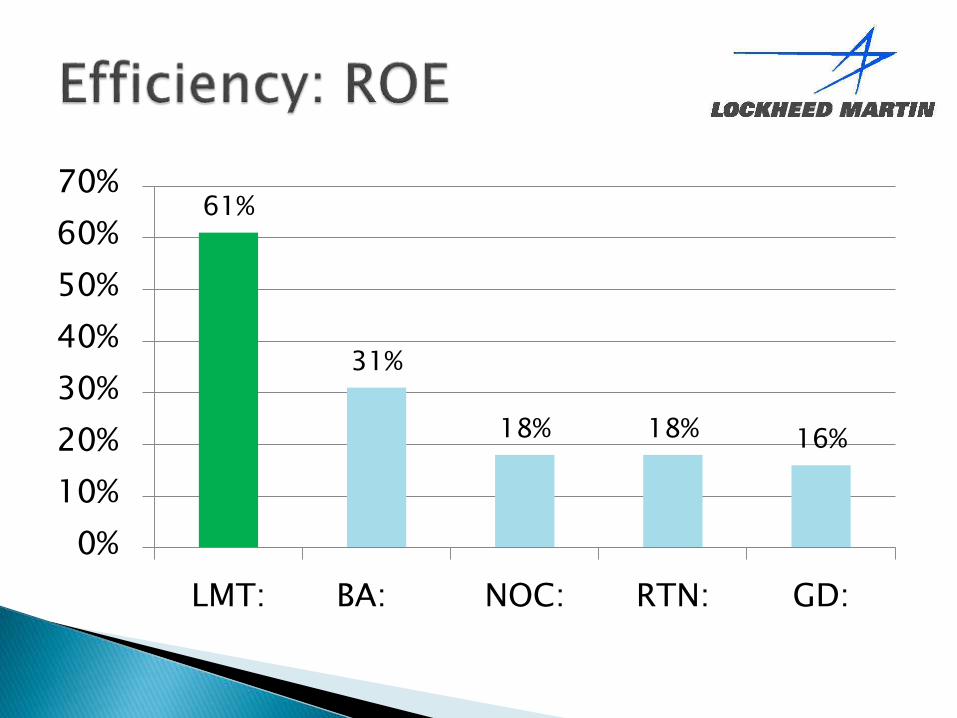
61%
31%
18% 18% 16%
0%
10%
20%
30%
40%
50%
60%
70%
LMT: BA: NOC: RTN: GD:
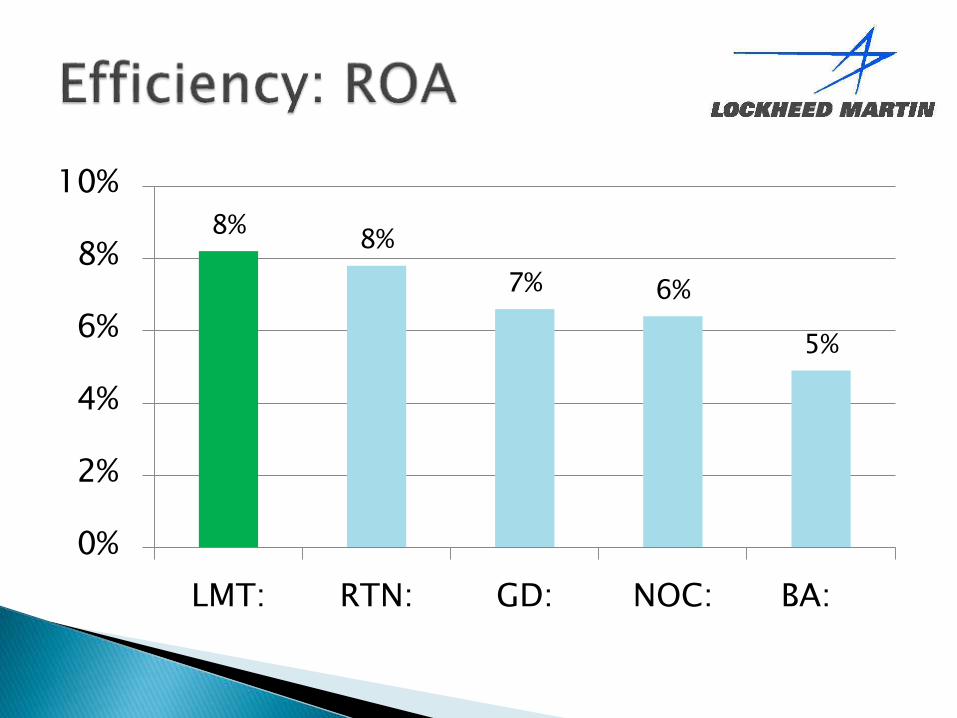
8%8%
7% 6%
5%
0%
2%
4%
6%
8%
10%
LMT: RTN: GD: NOC: BA:
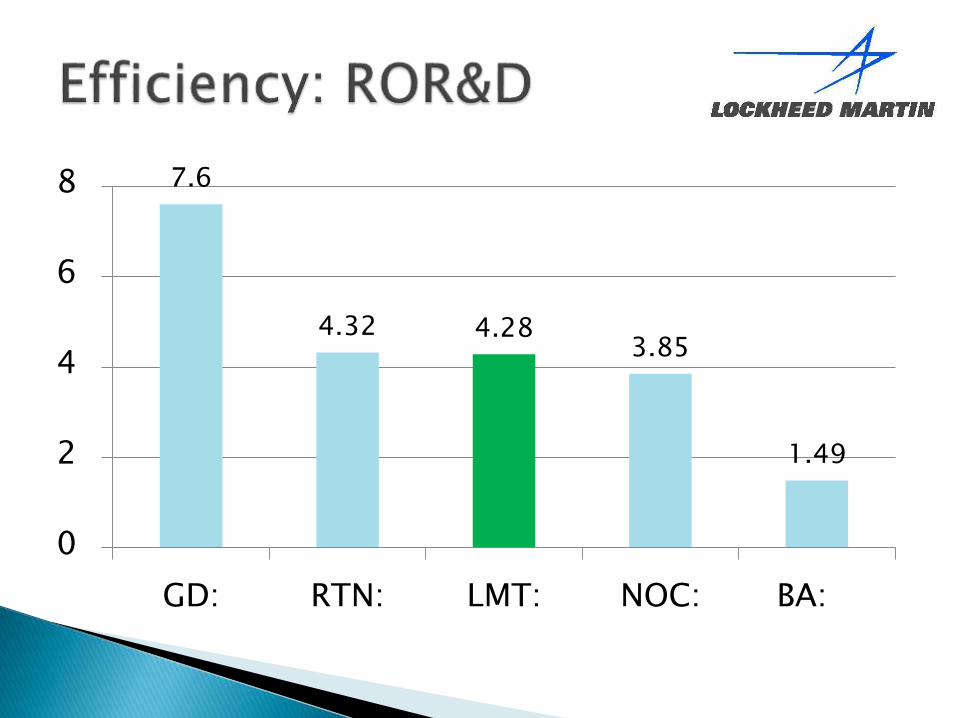
7.6
4.32 4.283.85
1.49
0
2
4
6
8
GD: RTN: LMT: NOC: BA:

EPS 2011 2012 2013
LMT Basic 7.90 8.48 9.29 Diluted 7.81 8.36 9.13
*8/25/2014 Prices Used *FYE 2013 Earnings Used
*FYE 2013 Dividend Payments Used
0
2
4
6
8
10
12
2009 2010 2011 2012 2013
LMT
BA
GD
NOC
RTN
2013 Payout Ratio
LMT: 52%
BA: 32%
GD: 24%
NOC: 28%
RTN: 35%
0%
10%
20%
30%
40%
50%
60%
70%
80%
90%
100%
2009 2010 2011 2012 2013
LMT
BA
GD
NOC
RTN
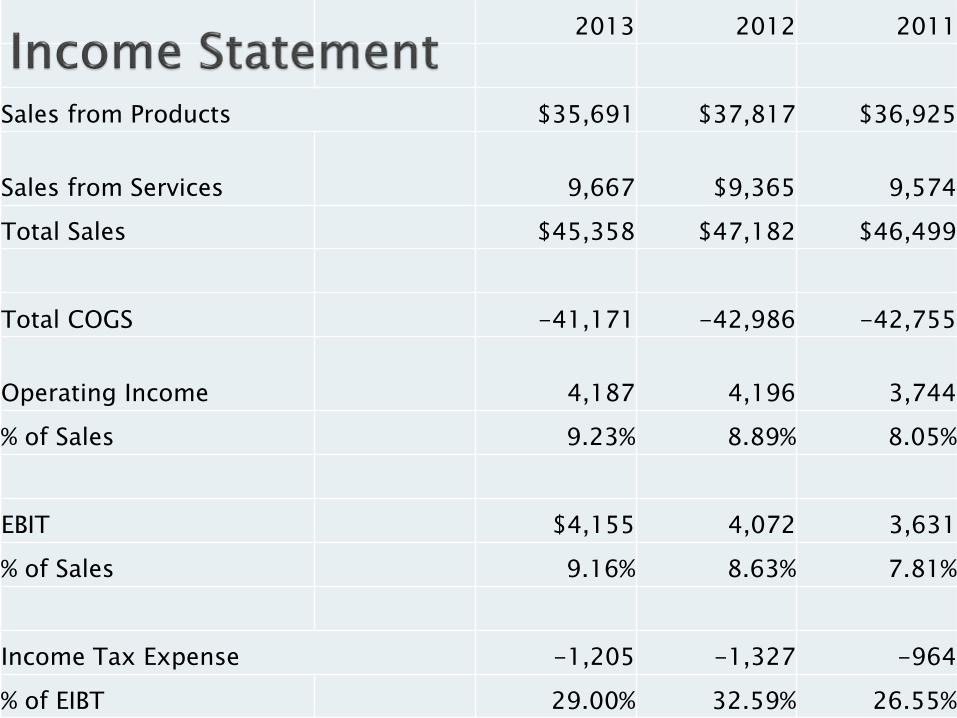
2013 2012 2011
Sales from Products $35,691 $37,817 $36,925
Sales from Services 9,667 $9,365 9,574
Total Sales $45,358 $47,182 $46,499
Total COGS -41,171 -42,986 -42,755
Operating Income 4,187 4,196 3,744
% of Sales 9.23% 8.89% 8.05%
EBIT $4,155 4,072 3,631
% of Sales 9.16% 8.63% 7.81%
Income Tax Expense -1,205 -1,327 -964
% of EIBT 29.00% 32.59% 26.55%
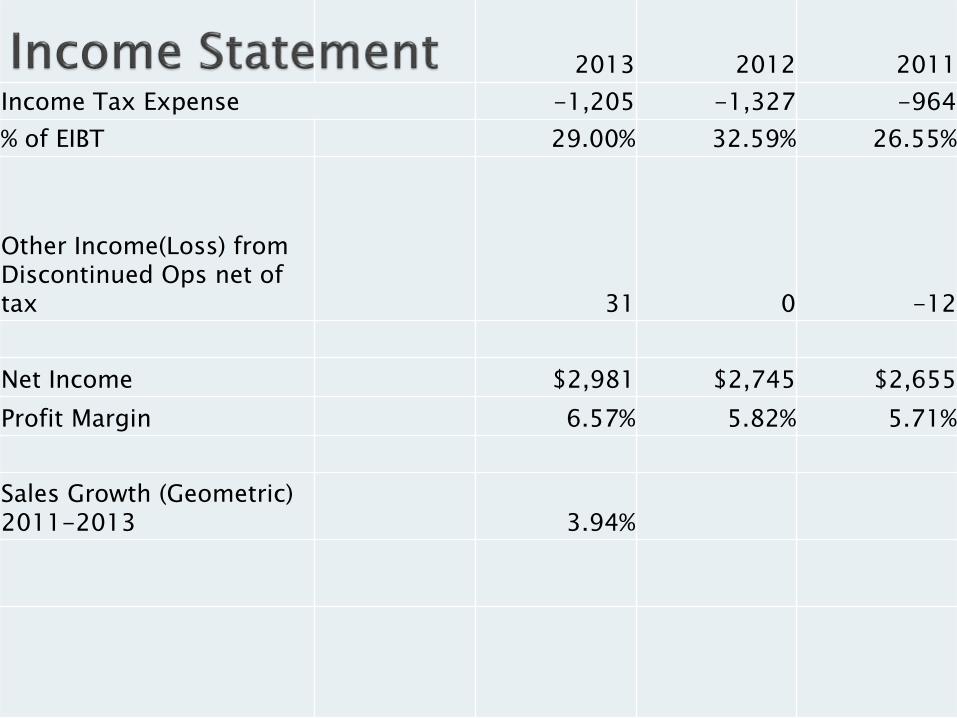
2013 2012 2011
Income Tax Expense -1,205 -1,327 -964
% of EIBT 29.00% 32.59% 26.55%
Other Income(Loss) from Discontinued Ops net of tax 31 0 -12
Net Income $2,981 $2,745 $2,655
Profit Margin 6.57% 5.82% 5.71%
Sales Growth (Geometric) 2011-2013 3.94%
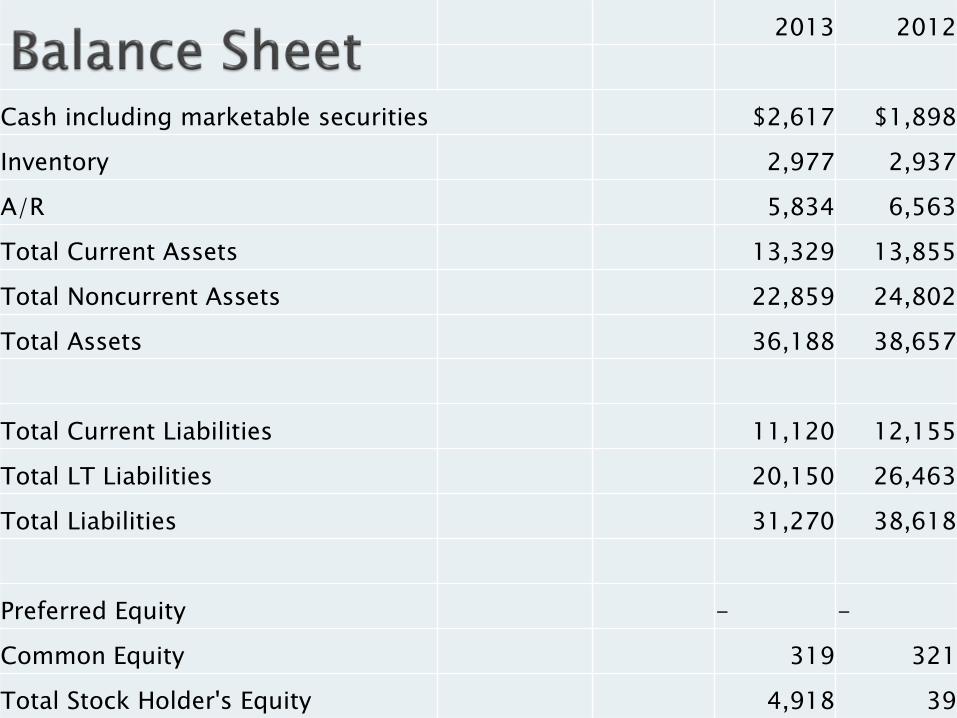
2013 2012
Cash including marketable securities $2,617 $1,898
Inventory 2,977 2,937
A/R 5,834 6,563
Total Current Assets 13,329 13,855
Total Noncurrent Assets 22,859 24,802
Total Assets 36,188 38,657
Total Current Liabilities 11,120 12,155
Total LT Liabilities 20,150 26,463
Total Liabilities 31,270 38,618
Preferred Equity - -
Common Equity 319 321
Total Stock Holder's Equity 4,918 39
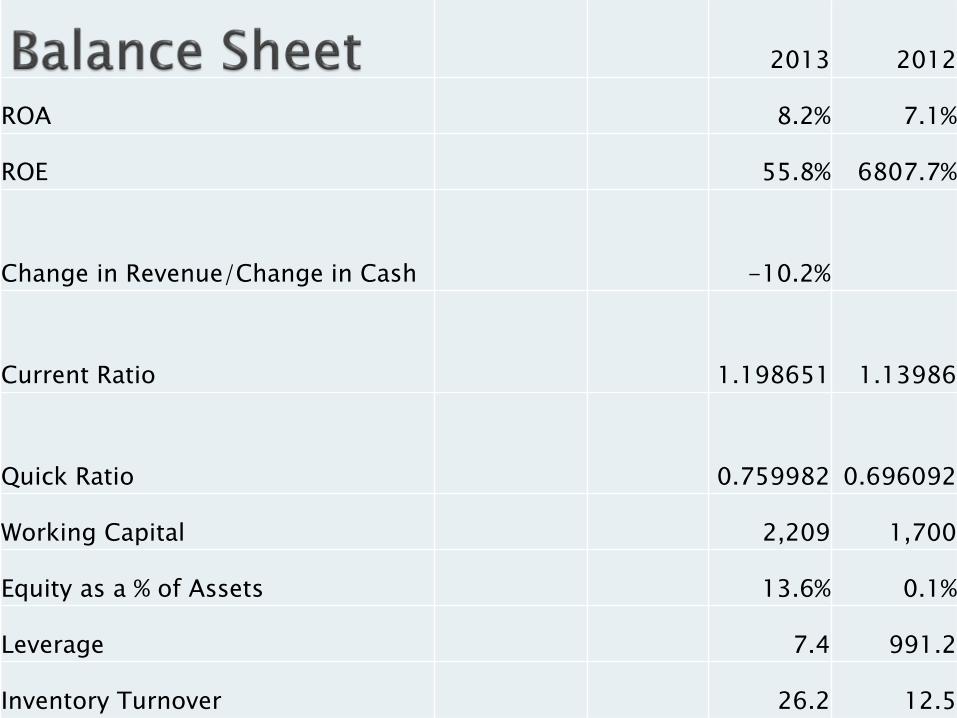
2013 2012
ROA 8.2% 7.1%
ROE 55.8% 6807.7%
Change in Revenue/Change in Cash -10.2%
Current Ratio 1.198651 1.13986
Quick Ratio 0.759982 0.696092
Working Capital 2,209 1,700
Equity as a % of Assets 13.6% 0.1%
Leverage 7.4 991.2
Inventory Turnover 26.2 12.5