lngs-p28/2001 icarus-tm/2001-03 march 1, 2001 · ready to propose the construction of a second t600...
TRANSCRIPT
arX
iv:h
ep-e
x/01
0300
8v1
7 M
ar 2
001
LNGS-P28/2001ICARUS-TM/2001-03
March 1, 2001
THE ICARUS EXPERIMENT, A Second-Generation ProtonDecay Experiment and Neutrino Observatory at the Gran Sasso
Laboratory
by the ICARUS Collaboration
F. Arneodo1, B. Babussinov2, A. Badertscher3, B. Bade lek4, G. Battistoni5, P. Benetti6,
E. Bernardini1, M. Bischofberger3, A. Borio di Tigliole7, R. Brunetti6, A. Bueno3,
E. Calligarich6, M. Campanelli3, C. Carpanese3, D. Cavalli5, F. Cavanna8, P. Cennini9,
S. Centro2, A. Cesana7, C. Chen10, Y. Chen10, D. Cline11, A. D ιabrowska12, R. Dolfini6,
M. Felcini3, A. Ferrari9,†, K. He10, J. Holeczek13, X. Huang10, A. Gigli Berzolari6,
I. Gil-Botella3, D. Grech14, B. Jokisz13, C. Juszczak14, J. Kisiel13, D. Kie lczewska4,
T. Koz lowski15, M. Laffranchi3, J. Lagoda4, Z. Li10, F. Lu10, J. Ma10, C. Matthey11,
F. Mauri6, M. Markiewicz16, D. Mazza8, L. Mazzone6, G. Meng2, C. Montanari6,
M. Moszynski15, S. Navas-Concha3, G. Nurzia8, S. Otwinowski11, O. Palamara1,
D. Pascoli2, J. Pasternak14, L. Periale17, S. Petrera8, G. Piano Mortari8, A. Piazzoli6,
P. Picchi17,‡, F. Pietropaolo9,§, A. Rappoldi6, G.L. Raselli6, J. Rico3, E. Rondio15,
M. Rossella6, C. Rossi8 A. Rubbia3, C. Rubbia6,¶, P. Sala5, T. Rancati5,
D. Scannicchio6, F. Sergiampietri18, J. Sobczyk14, N. Sinanis3 J. Stepaniak15,
M. Stodulski12, M. Szeptycka15, M. Szleper15, M. Terrani7 S. Ventura2 C. Vignoli6,
H. Wang11, M. Wojcik19, J. Woo11, G. Xu10, Z. Xu6, A. Zalewska12, J. Zalipska15,
C. Zhang10, Q. Zhang10, S. Zhen10, W. Zipper13
1Laboratori Nazionali di Gran Sasso, INFN, s.s. 17bis, km 18+910, Assergi (AQ), Italy2Dipartimento di Fisica e INFN, Universita di Padova, via Marzolo 8, Padova, Italy3Institute for Particle Physics, ETH Honggerberg, Zurich, Switzerland4Institute of Experimental Physics, Warsaw University, Warszawa, Poland5Dipartimento di Fisica e INFN, Universita di Milano, via Celoria 16, Milano, Italy6Dipartimento di Fisica e INFN, Universita di Pavia, via Bassi 6, Pavia, Italy7Politecnico di Milano (CESNF), Universita di Milano, via Ponzio 34/3, Milano, Italy8Dipartimento d Fisica e INFN, Universita dell’Aquila, via Vetoio, L’Aquila, Italy9CERN, CH 1211 Geneva 23, Switzerland
10IHEP – Academia Sinica, 19 Yuqnan Road, Beijing, People’s Republic of China11Department of Physics, UCLA, Los Angeles, CA 90024, USA12H.Niewodniczanski Institute of Nuclear Physics, Krakow, Poland13Institute of Physics, University of Silesia, Katowice, Poland14Institute of Theoretical Physics, Wroc law University, Wroc law, Poland15A.So ltan Institute for Nuclear Studies, Warszawa, Poland16Faculty of Physics and Nuclear Techniques, University of Mining and Metallurgy, Krakow, Poland17University of Torino, Torino, Italy18INFN Pisa, via Livornese 1291, San Piero a Grado (PI), Italy19Institute of Physics, Jagellonian University, Krakow, Poland†Also at Dipartimento di Fisica e INFN, Universita di Milano, via Celoria 16, Milano, Italy‡Also at Laboratori Nazionali di Frascati, INFN, Frascati, Italy and Istituto di Cosmogeofisica, CNR, Torino,
Italy§Also at Dipartimento di Fisica e INFN, Universita di Padova, via Marzolo 8, Padova, Italy¶Spokesman
1

Abstract
The final phase of the ICARUS physics program requires a sensitive mass of liquid Argonof 5000 tons or more. This is still true today, even after the operation of large or theplanning of even larger underground detectors. The superior bubble-chamber-like features ofthe ICARUS detector will always provide additional and fundamental contributions to thefield.
The most conservative way to reach a liquid Argon sensitive mass of 5000 tons is to startwith a first prototype of a modest mass: the T600 detector. This step-wise strategy allowedus to develop progressively the necessary know-how to build a large liquid Argon detector.
The T600 detector stands today as the first living proof that such large detector can bebuilt and that liquid Argon imaging technology can be implemented on such large scales.
After the successful completion of a series of technical tests to be performed at theassembly hall in Pavia, the T600 detector will be ready to be transported into theLNGS tunnel. The operation of the T600 at the LNGS will allow us (1) to develop thelocal infrastructure needed to operate our large detector (2) to start the handling of theunderground liquid argon technology (3) to study the local background (4) to start the datataking with an initial liquid argon mass that will reach in a 5-6 year program the multi-ktongoal. The T600 is to be considered as the first milestone on the road towards a total sensitivemass of 5000 tons: it is the first piece of the detector to be complemented by further modulesof appropriate size and dimensions, in order to reach in a most efficient and rapid way thefinal design mass.
In this document, we describe the physics program that will be accomplished within thefirst phase of the program.
1 Introduction
The ICARUS physics program has been described in Volume I of the 1994 proposal [1]. Theentire physics community has largely endorsed its physics goals, since Japan, America and alsoEurope have set up many programs with similar purposes, and much progress has been achievedin the field.
As already described in the original proposal, the final phase of the ICARUS project requiresa sensitive mass of liquid Argon of 5000 tons or more. This is still true today, even afterthe advent of the SuperKamiokande with its fiducial mass of 22.5 ktons [2]. The superiorbubble-chamber-like features of the ICARUS detector will provide additional and fundamentalcontributions to the field.
Back in 1995, it was decided that the most conservative way to reach the liquid Argonsensitive mass of 5000 tons was to go through a first step: the T600 detector [3]. This step-wise strategy allowed us to develop progressively the necessary know-how to build a large liquidArgon detector.
As a yet additional step, a large 10m3 prototype was built in 1997, in order to assess the majorissues concerning cryogenics, internal detector mechanics and liquid Argon purification. The10m3 prototype has undergone several cooling and filling tests in Pavia; this phase successfullyended in July 1999. The 10m3 was then dismounted and transported to an external hall ofLNGS. Complementing the dewar with appropriate H.V., wire readout, a scintillation lightdetection system and an external trigger, turned the prototype into a fully functional liquidArgon imaging chamber. A test, that lasted about 100 consecutive days, has allowed to provethe technique in a configuration similar to the one adopted for the T600 detector and, thanks toa perfectly mastered LAr purification technique, has resulted in the collection of ionizing eventsof excellent quality.
The T600 detector stands today as the first living proof that a large detector can be builtand that liquid Argon imaging technology can be implemented on such large scales. We are now
2
ready to propose the construction of a second T600 “clone”, within a 24 months program, tocomplete within 2003 the first 35 meters of the experimental hall, with 1.2 kton of active liquidArgon mass.
After the successful completion of a series of technical tests to be performed at the assemblyhall in Pavia, the T600 detector will be ready to be transported into the LNGS tunnel.
The operation of the T600 at the LNGS will allow us (1) to develop the local infrastructureneeded to operate our large detector (2) to start the handling of the underground liquid argontechnology (3) to study the local background (4) to start the data taking with an initial liquidargon mass that will reach in a 5-6 year program the multi-kton goal. The T600 is to beconsidered as the first milestone on the road towards a total sensitive mass of 5000 tons: it isthe first piece of the detector to be complemented by further modules of appropriate size anddimensions, in order to reach in a most efficient and rapid way the final design mass.
In this document, we describe the physics program that will be accomplishable with the firstmodules of liquid Argon. Given this initial phase in which a limited amount of liquid Argon isavailable, we consider the physics program achievable with exposures of 1 or 2 kton × year.
In section 2, we discuss the benchmark measurement provided by the detection of downward-going muons. In section 3, we address the detection of atmospheric neutrinos, including fully-contained and partially-contained events, and upward going muons. In section 4 the detection ofsolar neutrinos is discussed. The sensitivity to nucleon decays is explored in section 5. Finally,the detection of supernova neutrinos is treated in section 6.
2 Detection Of Downward–Going Muons
The rock overburden at Gran Sasso underground laboratory filters secondary cosmic ray particlesproduced in atmospheric showers, and only high energy muons (coming from the decay ofsecondary π and K mesons) survive, with a rate of about 1 particle /m2 hour. The energythreshold for an atmospheric muon to reach the underground hall has an exponential dependenceon the rock depth h(θ,φ) [4], which is a function of the direction, depending on the mountaintopography. In correspondence of the minimum thickness (∼ 3100 hg/cm2, in the direction ofCampo Imperatore) Ethr ∼ 1.3 TeV. The average residual energy of muons at the depth of GranSasso underground hall is about 300 GeV. In their propagation through the rock muons undergodifferent interaction processes affecting also their direction. The average scattering angle hasbeen calculated to be around 1 degree, mostly dominated by multiple scattering in the last partof their path.
The measurement of atmospheric muons surviving underground is not a primary goal ofICARUS. However, it can be considered a benchmark test of the detector performance, butalso an interesting by–product of the physics research program. As a matter of fact, muons arepractically the only available high energy particles with a quite constant rate which can be usedto perform an effective monitoring of the detector performance as far as track reconstructionis concerned. An example of a possible measurement is that of the muon flux as a function ofthe rock depth, or “depth-intensity” function I(h). The comparison with the world average ofI(h) [5], and in particular with the results from the previous experiments at Gran Sasso [6, 7],provides a check of the efficiency and stability of the detector operation. Such a measurementrequires a precise knowledge of the detector acceptance and in addition, is a good check of thedetector simulation codes.
From the physics point of view, the measurement of the underground muon flux allows,by means of a detailed simulation of atmospheric showers, to extract the parameters of theall–nucleon flux of primary cosmic rays, in the region around a few TeV/nucleon, where also
3
direct measurements suffer of large errors. A better knowledge of the primary flux in this energyregion is still important to reduce uncertainties in the calculations of the flux of atmosphericneutrinos. The main interest is in a new analysis, more than in the statistics, which has beenlargely collected by MACRO and LVD, since the interpretation is limited by both, theoreticalsystematics (hadronic interaction models) and the knowledge of rock depth. At present, GranSasso rock is known with an accuracy which is not better than a few percent. Furthermore,further measurements at large zenith angle, i.e. at very large values of h(θ,φ), where the rate isquite low, are important to extract informations about prompt muon production, connected tothe charm production in atmospheric showers [4]. Also, the measurement close to the horizontaldirection is known to be dominated by atmospheric neutrino interaction in the rock, and itis useful to establish the ν flux normalization in a direction where the oscillation phenomena,according to the present estimate of parameters, are marginal. In this large zenith angularregion, the contribution of new data is in any case important and ICARUS has at least a clearadvantage, for instance, with respect to MACRO, which did not present a specific analysis inthis field.
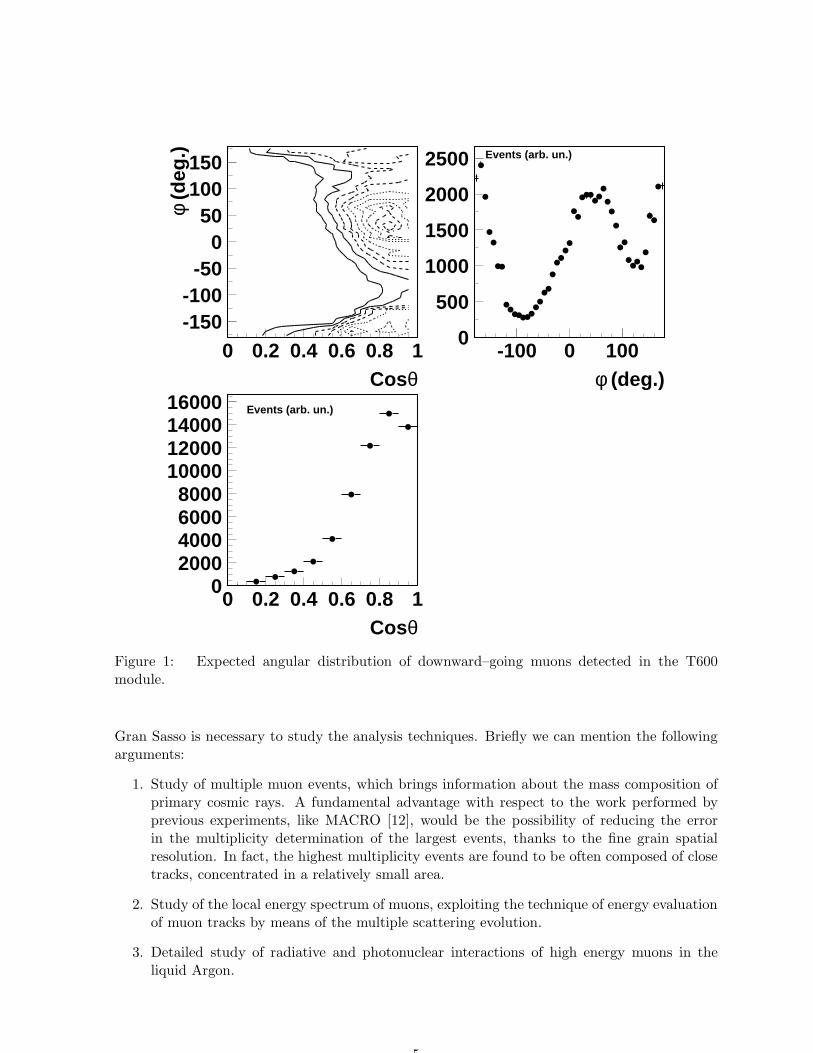
In order to evaluate the rate of downward–going muons detectable in the T600 module, wehave performed a full simulation in the FLUKA environment [8, 9], assuming that the module islocated in the Hall B of the Gran Sasso underground laboratory. In order to generate the localmuon flux, a cos(zenith) - φ matrix, unfolded from the MACRO experimental data, has beenused. For this first iteration of this kind of calculation, the contribution of multiple muon events(about 6% of the total muon event rate) has been neglected. To identify a muon, we require atrack of at least 20 cm, passing through at least one half–module. The experience gained withthe operation of the 10 m3 module [11] allows us to have confidence that, with this minimumtrack length, a 3–Dimensional reconstruction is fully assured (at least 40–50 hits/view). In thisway we expect to detect 120 tracks/hour. The expected angular distribution, the shape of whichis dominated by the rock overburden, is reported in Fig.11.
Within one year of live time, the data collected by the T600 module would reach half thestatistics collected by LVD in [6].
From the above angular distribution the bin-by-bin muon intensity I(h) referred to thevertical direction is extracted as follows:
I(h) =
(
1
∆T
)
ΣiNimi
Σj∆ΩjAjǫj/fθj(1)
where ∆T is the live time; Ni is the number of observed events of muon multiplicity mi in the binof slant depth h; Aj is the effective detector projected area for that bin; ǫj is the combined triggerand reconstruction efficiency and θj is the muon zenith angle. The function 1/fθj representsthe zenith distribution of muons in the atmosphere, which, for these energies and up to 60,is well approximated by secθj . For larger angles corrections must be introduced to take intoaccount the earth’s curvature. The projected area Aj(θ, φ) and the detector tracking efficiencyǫj(θ, φ) must be calculated from a detailed Monte Carlo study. In order to compare experimentalresults from different sites, it is customary to convert the actual rock thickness to “standardrock” (Z=11, A=22) slant depth, using the known chemical composition of the Gran Sasso rockand a conversion formula, like the one described in [10].
The topic of the study of atmospheric muons includes other items which can be of interestfor ICARUS. In addition to the test runs foreseen in Pavia, the run of the T600 module in
1There the φ angle is measured counter–clockwise from the axis parallel to the longitudinal section of Hall B,which makes an angle of 128.4 with respect to the geographical North. The azimuth angle is normally definedas the angle measured clockwise from the North direction.
4
-150-100
-500
50100150
0 0.2 0.4 0.6 0.8 1Cosθ
φ (d
eg.)
0
500
1000
1500
2000
2500
-100 0 100
Events (arb. un.)
φ (deg.)
02000400060008000
10000120001400016000
0 0.2 0.4 0.6 0.8 1
Events (arb. un.)
CosθFigure 1: Expected angular distribution of downward–going muons detected in the T600module.
Gran Sasso is necessary to study the analysis techniques. Briefly we can mention the followingarguments:
1. Study of multiple muon events, which brings information about the mass composition ofprimary cosmic rays. A fundamental advantage with respect to the work performed byprevious experiments, like MACRO [12], would be the possibility of reducing the errorin the multiplicity determination of the largest events, thanks to the fine grain spatialresolution. In fact, the highest multiplicity events are found to be often composed of closetracks, concentrated in a relatively small area.
2. Study of the local energy spectrum of muons, exploiting the technique of energy evaluationof muon tracks by means of the multiple scattering evolution.
3. Detailed study of radiative and photonuclear interactions of high energy muons in theliquid Argon.
5
3 Atmospheric Neutrinos
3.1 Contained and partially contained events
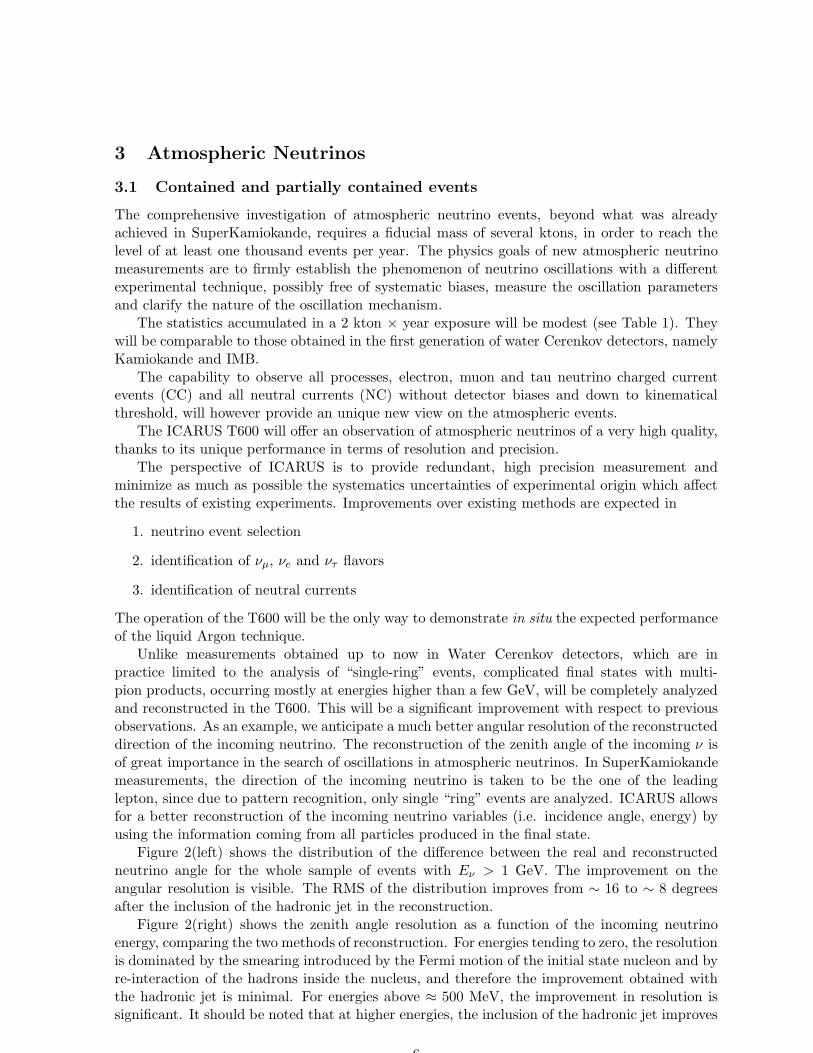
The comprehensive investigation of atmospheric neutrino events, beyond what was alreadyachieved in SuperKamiokande, requires a fiducial mass of several ktons, in order to reach thelevel of at least one thousand events per year. The physics goals of new atmospheric neutrinomeasurements are to firmly establish the phenomenon of neutrino oscillations with a differentexperimental technique, possibly free of systematic biases, measure the oscillation parametersand clarify the nature of the oscillation mechanism.
The statistics accumulated in a 2 kton × year exposure will be modest (see Table 1). Theywill be comparable to those obtained in the first generation of water Cerenkov detectors, namelyKamiokande and IMB.
The capability to observe all processes, electron, muon and tau neutrino charged currentevents (CC) and all neutral currents (NC) without detector biases and down to kinematicalthreshold, will however provide an unique new view on the atmospheric events.
The ICARUS T600 will offer an observation of atmospheric neutrinos of a very high quality,thanks to its unique performance in terms of resolution and precision.
The perspective of ICARUS is to provide redundant, high precision measurement andminimize as much as possible the systematics uncertainties of experimental origin which affectthe results of existing experiments. Improvements over existing methods are expected in
1. neutrino event selection
2. identification of νµ, νe and ντ flavors
3. identification of neutral currents
The operation of the T600 will be the only way to demonstrate in situ the expected performanceof the liquid Argon technique.
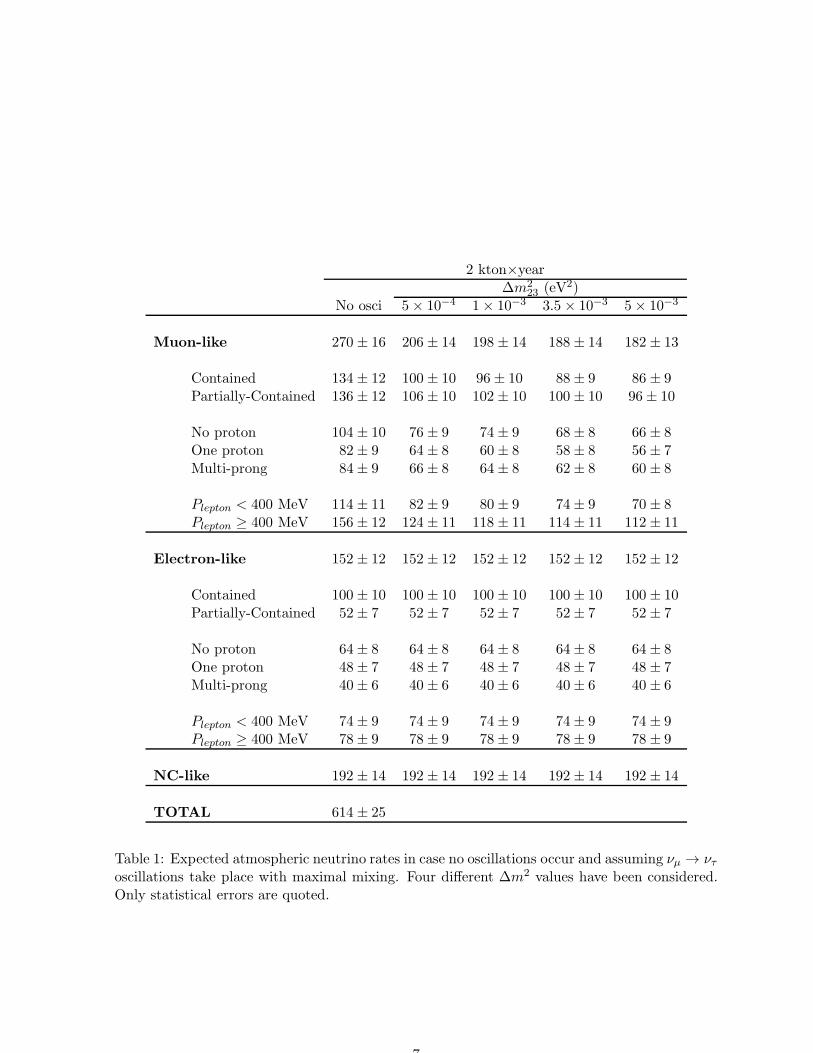
Unlike measurements obtained up to now in Water Cerenkov detectors, which are inpractice limited to the analysis of “single-ring” events, complicated final states with multi-pion products, occurring mostly at energies higher than a few GeV, will be completely analyzedand reconstructed in the T600. This will be a significant improvement with respect to previousobservations. As an example, we anticipate a much better angular resolution of the reconstructeddirection of the incoming neutrino. The reconstruction of the zenith angle of the incoming ν isof great importance in the search of oscillations in atmospheric neutrinos. In SuperKamiokandemeasurements, the direction of the incoming neutrino is taken to be the one of the leadinglepton, since due to pattern recognition, only single “ring” events are analyzed. ICARUS allowsfor a better reconstruction of the incoming neutrino variables (i.e. incidence angle, energy) byusing the information coming from all particles produced in the final state.
Figure 2(left) shows the distribution of the difference between the real and reconstructedneutrino angle for the whole sample of events with Eν > 1 GeV. The improvement on theangular resolution is visible. The RMS of the distribution improves from ∼ 16 to ∼ 8 degreesafter the inclusion of the hadronic jet in the reconstruction.
Figure 2(right) shows the zenith angle resolution as a function of the incoming neutrinoenergy, comparing the two methods of reconstruction. For energies tending to zero, the resolutionis dominated by the smearing introduced by the Fermi motion of the initial state nucleon and byre-interaction of the hadrons inside the nucleus, and therefore the improvement obtained withthe hadronic jet is minimal. For energies above ≈ 500 MeV, the improvement in resolution issignificant. It should be noted that at higher energies, the inclusion of the hadronic jet improves
6
2 kton×year∆m2
23 (eV2)No osci 5× 10⁻⁴ 1× 10⁻³ 3.5 × 10⁻³ 5× 10⁻³
Muon-like 270 ± 16 206 ± 14 198 ± 14 188 ± 14 182 ± 13
Contained 134 ± 12 100 ± 10 96± 10 88± 9 86 ± 9Partially-Contained 136 ± 12 106 ± 10 102 ± 10 100 ± 10 96± 10
No proton 104 ± 10 76 ± 9 74± 9 68± 8 66 ± 8One proton 82± 9 64 ± 8 60± 8 58± 8 56 ± 7Multi-prong 84± 9 66 ± 8 64± 8 62± 8 60 ± 8
Plepton < 400 MeV 114 ± 11 82 ± 9 80± 9 74± 9 70 ± 8Plepton ≥ 400 MeV 156 ± 12 124 ± 11 118 ± 11 114 ± 11 112 ± 11
Electron-like 152 ± 12 152 ± 12 152 ± 12 152 ± 12 152 ± 12
Contained 100 ± 10 100 ± 10 100 ± 10 100 ± 10 100 ± 10Partially-Contained 52± 7 52 ± 7 52± 7 52± 7 52 ± 7
No proton 64± 8 64 ± 8 64± 8 64± 8 64 ± 8One proton 48± 7 48 ± 7 48± 7 48± 7 48 ± 7Multi-prong 40± 6 40 ± 6 40± 6 40± 6 40 ± 6
Plepton < 400 MeV 74± 9 74 ± 9 74± 9 74± 9 74 ± 9Plepton ≥ 400 MeV 78± 9 78 ± 9 78± 9 78± 9 78 ± 9
NC-like 192 ± 14 192 ± 14 192 ± 14 192 ± 14 192 ± 14
TOTAL 614 ± 25
Table 1: Expected atmospheric neutrino rates in case no oscillations occur and assuming νµ → ντoscillations take place with maximal mixing. Four different ∆m2 values have been considered.Only statistical errors are quoted.
7
0
2000
4000
6000
8000
10000
-100 -80 -60 -40 -20 0 20 40 60 80 100
Mean
RMS
0.1036
7.296
θreal - θmeasured (degrees)
0
500
1000
1500
2000
2500
3000
3500
4000
-100 -80 -60 -40 -20 0 20 40 60 80 100
Mean
RMS
-0.1374
16.16
θreal - θmeasured (degrees)
0
5
10
15
20
25
30
35
0 1 2 3 4 5 6 7 8 9 10
All particles
Only lepton
EνMC (GeV)
θ real
-θm
easu
red
(d
egre
es)
Figure 2: (left) Zenith angle resolution. The top plot shows the resolution obtained byreconstructing the incoming neutrino direction using all particles momenta, the bottom plotshows the resolution obtained using only the leading lepton momentum. (right) Zenith angleresolution as a function of the neutrino energy.
by a factor three the reconstruction of incoming neutrino direction. This will allow to have amore precise reconstruction of the neutrino L/E (see ICANOE proposal [13]).
We recall the expected atmospheric neutrino rates obtained per year for an exposure of 2ktons in Table 1, with and without νµ → ντ oscillation hypothesis (sin2 2θ = 1).
Muon-like events contain an identified muon and correspond to νµ/νµ CC events. Electron-like are events with an identified electron and are νe/νe CC events. Given the clean eventreconstruction, the ratio R of “muon-like” to “electron-like” events can be determined free oflarge experimental systematic errors. In fact, the expected purity of the samples is above 99%. Inparticular, the contamination from π0 in the “electron-like” sample is expected to be completelynegligible.
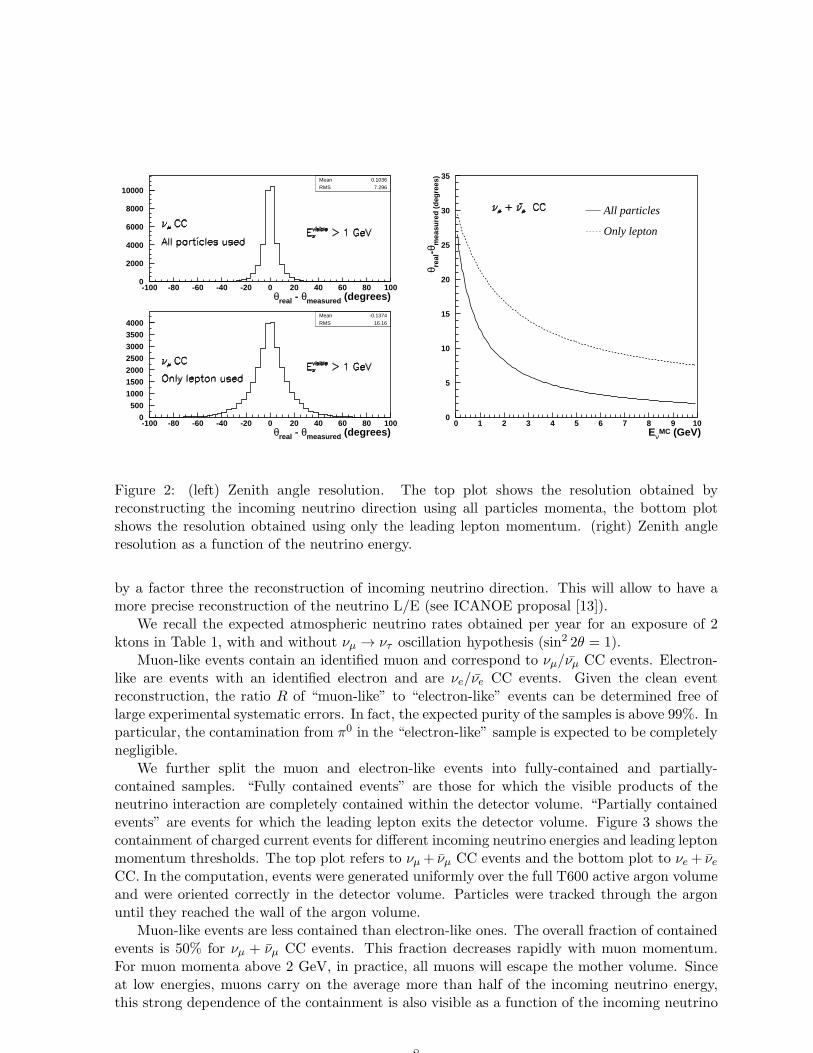
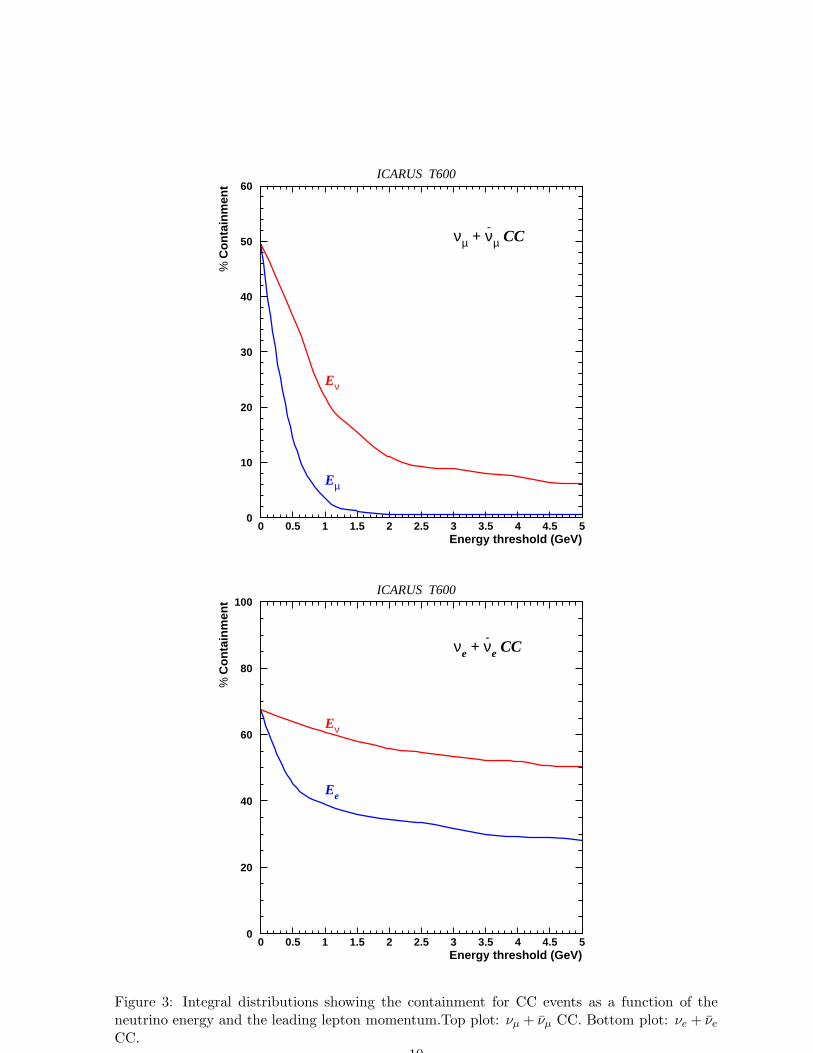
We further split the muon and electron-like events into fully-contained and partially-contained samples. “Fully contained events” are those for which the visible products of theneutrino interaction are completely contained within the detector volume. “Partially containedevents” are events for which the leading lepton exits the detector volume. Figure 3 shows thecontainment of charged current events for different incoming neutrino energies and leading leptonmomentum thresholds. The top plot refers to νµ+ νµ CC events and the bottom plot to νe+ νeCC. In the computation, events were generated uniformly over the full T600 active argon volumeand were oriented correctly in the detector volume. Particles were tracked through the argonuntil they reached the wall of the argon volume.
Muon-like events are less contained than electron-like ones. The overall fraction of containedevents is 50% for νµ + νµ CC events. This fraction decreases rapidly with muon momentum.For muon momenta above 2 GeV, in practice, all muons will escape the mother volume. Sinceat low energies, muons carry on the average more than half of the incoming neutrino energy,this strong dependence of the containment is also visible as a function of the incoming neutrino
8
energy (see Figure 3, top plot). The fraction of contained νe + νe CC is close to 70% of thetotal expected rate. The decrease of containment with energy is not so dramatic for electron-likeevents. For neutrino energies in excess of 5 GeV, we expect half of the νe + νe CC sample to befully contained (see Figure 3, bottom plot).
For the muon-like contained events, the muon energy is precisely determined by integrationof the dE/dx measurements along the track. For partially contained events, in which the muonescapes the detector active volume, the muon momentum is estimated via the multiple scatteringmethod (see ICANOE proposal [13]). Fully contained electromagnetic showers are extremelywell measured thanks to the superb calorimetric performance of liquid Argon. The energy ofpartially contained showers can be recovered by a careful “shower-shape” analysis.
We also illustrate the expected event rates classified according to their final state multiplicity(see Table 1). Approximately 40% of CC events contain no proton in the final state2,corresponding to the “one-ring” sample. The rest of the events will contain a proton or multi-prongs final states, which will provide, thanks to the precise reconstruction of all particles, aprecise determination of the incoming neutrino energy and direction.
Finally, we also point out that in ICARUS atmospheric neutrino events can be analyzeddown to production threshold, given the excellent imaging. We illustrate this by classifying theevents according to the energy of the leading lepton (electron or muon). We split the samplesinto Plepton < 400 MeV and Plepton > 400 MeV, which correspond to the threshold used inSuper-Kamiokande [2]. Almost 50% of the expected rate lies below the threshold and henceICARUS can really contribute to the understanding of the low energy part of the atmosphericneutrino spectrum.
An improved observation of about 100 neutral current (NC) events per kton × year is alsoexpected, given the clean classification of events based on the absence of an electron or muon inthe final state. In this case, the excellent e/π0 separation plays a fundamental role to select anunbiased, free of background neutral current sample.
2 kton×year∆m2
23 (eV2)No osci 5× 10⁻⁴ 1× 10⁻³ 3.5× 10⁻³ 5× 10⁻³
Muon-like 270± 16 206 ± 14 198± 14 188± 14 182 ± 13
Downward 102± 10 102 ± 10 102± 10 98 ± 10 95± 10Upward 94 ± 10 46± 7 46± 7 47± 7 49± 7
Electron-like 152± 12 152 ± 12 152± 12 152± 12 152 ± 12
Downward 56± 7 56± 7 56± 7 56± 7 56± 7Upward 48± 7 48± 7 48± 7 48± 7 48± 7
Table 2: Predicted downward (cos θzenith > 0.2) and upward (cos θzenith < −0.2) atmosphericneutrino rates in case no oscillations occur and assuming νµ → ντ oscillations take place withmaximal mixing. Four different ∆m2 values have been considered. Only statistical errors arequoted. As a reference, we also show the total expected rates for both muon and electron-likeevents.
2A proton is identified if its kinetic energy is above 50 MeV.
9
ICARUS T600
0
10
20
30
40
50
60
0 0.5 1 1.5 2 2.5 3 3.5 4 4.5 5Energy threshold (GeV)
% C
on
tain
men
t
Eµ
Eν
νµ + ν-
µ CC
ICARUS T600
0
20
40
60
80
100
0 0.5 1 1.5 2 2.5 3 3.5 4 4.5 5Energy threshold (GeV)
% C
on
tain
men
t
Ee
Eν
νe + ν-
e CC
Figure 3: Integral distributions showing the containment for CC events as a function of theneutrino energy and the leading lepton momentum.Top plot: νµ + νµ CC. Bottom plot: νe + νeCC.
10
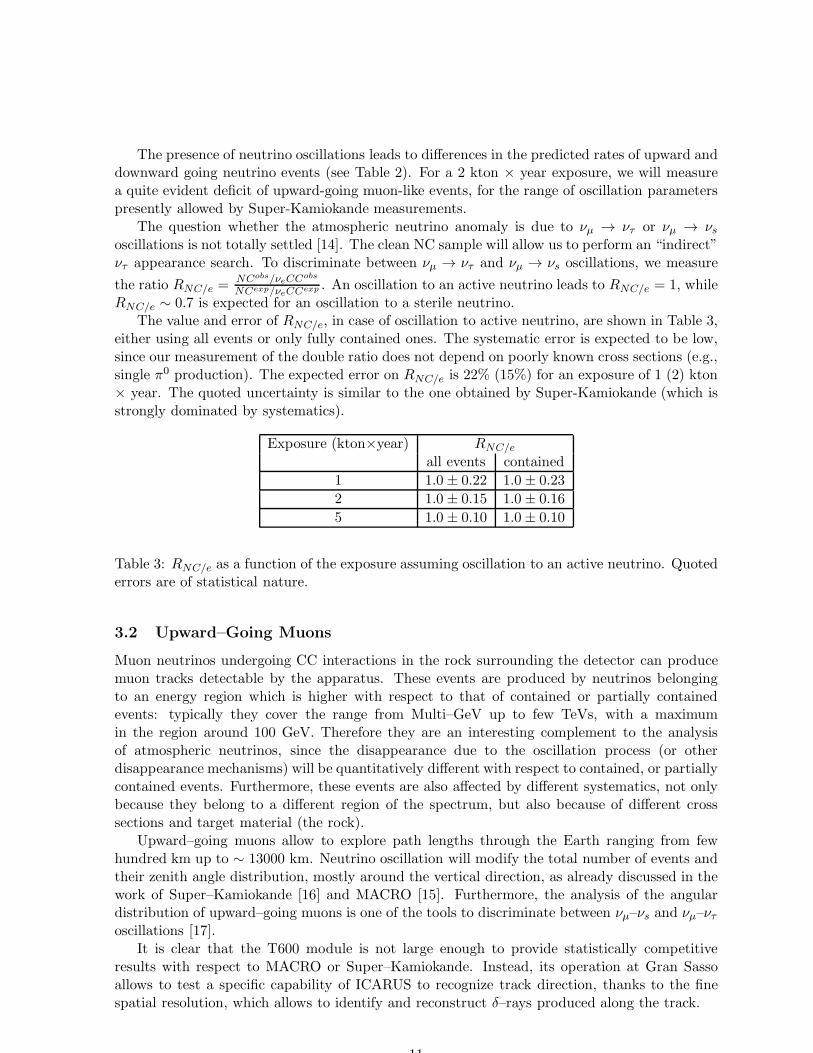
The presence of neutrino oscillations leads to differences in the predicted rates of upward anddownward going neutrino events (see Table 2). For a 2 kton × year exposure, we will measurea quite evident deficit of upward-going muon-like events, for the range of oscillation parameterspresently allowed by Super-Kamiokande measurements.
The question whether the atmospheric neutrino anomaly is due to νµ → ντ or νµ → νsoscillations is not totally settled [14]. The clean NC sample will allow us to perform an “indirect”ντ appearance search. To discriminate between νµ → ντ and νµ → νs oscillations, we measure
the ratio RNC/e =NCobs/νeCCobs
NCexp/νeCCexp . An oscillation to an active neutrino leads to RNC/e = 1, whileRNC/e ∼ 0.7 is expected for an oscillation to a sterile neutrino.
The value and error of RNC/e, in case of oscillation to active neutrino, are shown in Table 3,either using all events or only fully contained ones. The systematic error is expected to be low,since our measurement of the double ratio does not depend on poorly known cross sections (e.g.,single π0 production). The expected error on RNC/e is 22% (15%) for an exposure of 1 (2) kton× year. The quoted uncertainty is similar to the one obtained by Super-Kamiokande (which isstrongly dominated by systematics).
Exposure (kton×year) RNC/e
all events contained
1 1.0 ± 0.22 1.0± 0.23
2 1.0 ± 0.15 1.0± 0.16
5 1.0 ± 0.10 1.0± 0.10
Table 3: RNC/e as a function of the exposure assuming oscillation to an active neutrino. Quotederrors are of statistical nature.
3.2 Upward–Going Muons
Muon neutrinos undergoing CC interactions in the rock surrounding the detector can producemuon tracks detectable by the apparatus. These events are produced by neutrinos belongingto an energy region which is higher with respect to that of contained or partially containedevents: typically they cover the range from Multi–GeV up to few TeVs, with a maximumin the region around 100 GeV. Therefore they are an interesting complement to the analysisof atmospheric neutrinos, since the disappearance due to the oscillation process (or otherdisappearance mechanisms) will be quantitatively different with respect to contained, or partiallycontained events. Furthermore, these events are also affected by different systematics, not onlybecause they belong to a different region of the spectrum, but also because of different crosssections and target material (the rock).
Upward–going muons allow to explore path lengths through the Earth ranging from fewhundred km up to ∼ 13000 km. Neutrino oscillation will modify the total number of events andtheir zenith angle distribution, mostly around the vertical direction, as already discussed in thework of Super–Kamiokande [16] and MACRO [15]. Furthermore, the analysis of the angulardistribution of upward–going muons is one of the tools to discriminate between νµ–νs and νµ–ντoscillations [17].
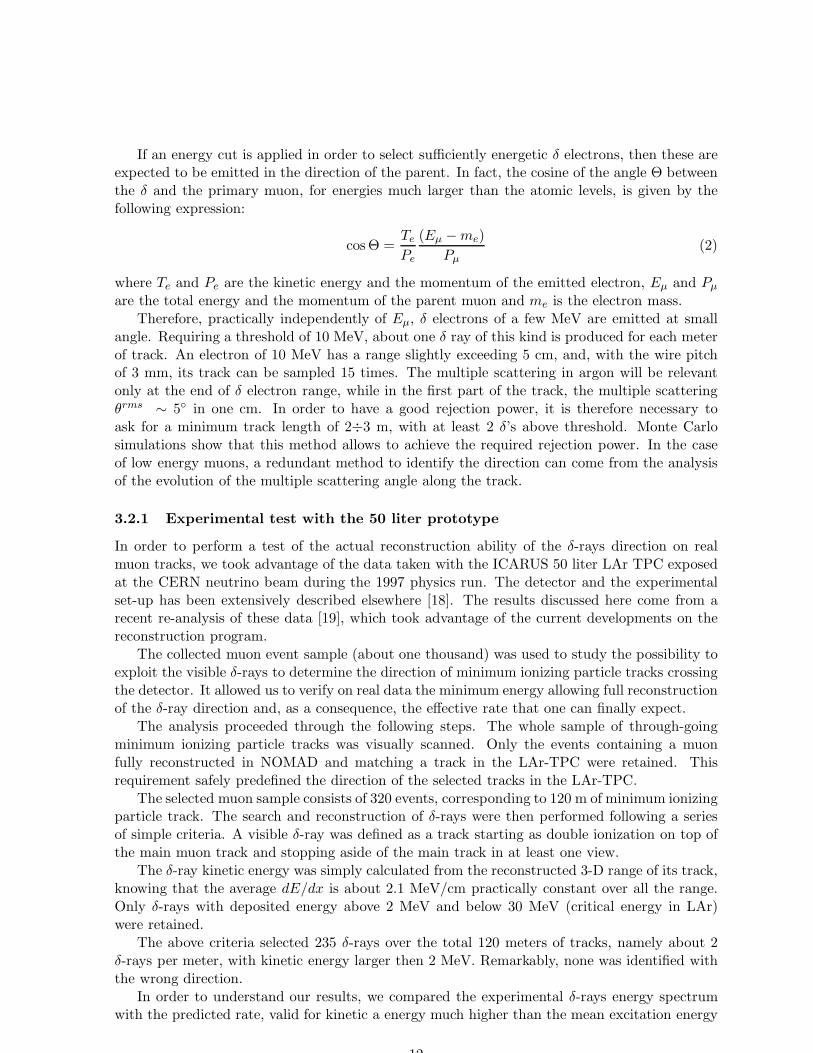
It is clear that the T600 module is not large enough to provide statistically competitiveresults with respect to MACRO or Super–Kamiokande. Instead, its operation at Gran Sassoallows to test a specific capability of ICARUS to recognize track direction, thanks to the finespatial resolution, which allows to identify and reconstruct δ–rays produced along the track.
11
If an energy cut is applied in order to select sufficiently energetic δ electrons, then these areexpected to be emitted in the direction of the parent. In fact, the cosine of the angle Θ betweenthe δ and the primary muon, for energies much larger than the atomic levels, is given by thefollowing expression:
cosΘ =Te
Pe
(Eµ −me)
Pµ(2)
where Te and Pe are the kinetic energy and the momentum of the emitted electron, Eµ and Pµ
are the total energy and the momentum of the parent muon and me is the electron mass.Therefore, practically independently of Eµ, δ electrons of a few MeV are emitted at small
angle. Requiring a threshold of 10 MeV, about one δ ray of this kind is produced for each meterof track. An electron of 10 MeV has a range slightly exceeding 5 cm, and, with the wire pitchof 3 mm, its track can be sampled 15 times. The multiple scattering in argon will be relevantonly at the end of δ electron range, while in the first part of the track, the multiple scatteringθrms ∼ 5 in one cm. In order to have a good rejection power, it is therefore necessary toask for a minimum track length of 2÷3 m, with at least 2 δ’s above threshold. Monte Carlosimulations show that this method allows to achieve the required rejection power. In the caseof low energy muons, a redundant method to identify the direction can come from the analysisof the evolution of the multiple scattering angle along the track.
3.2.1 Experimental test with the 50 liter prototype
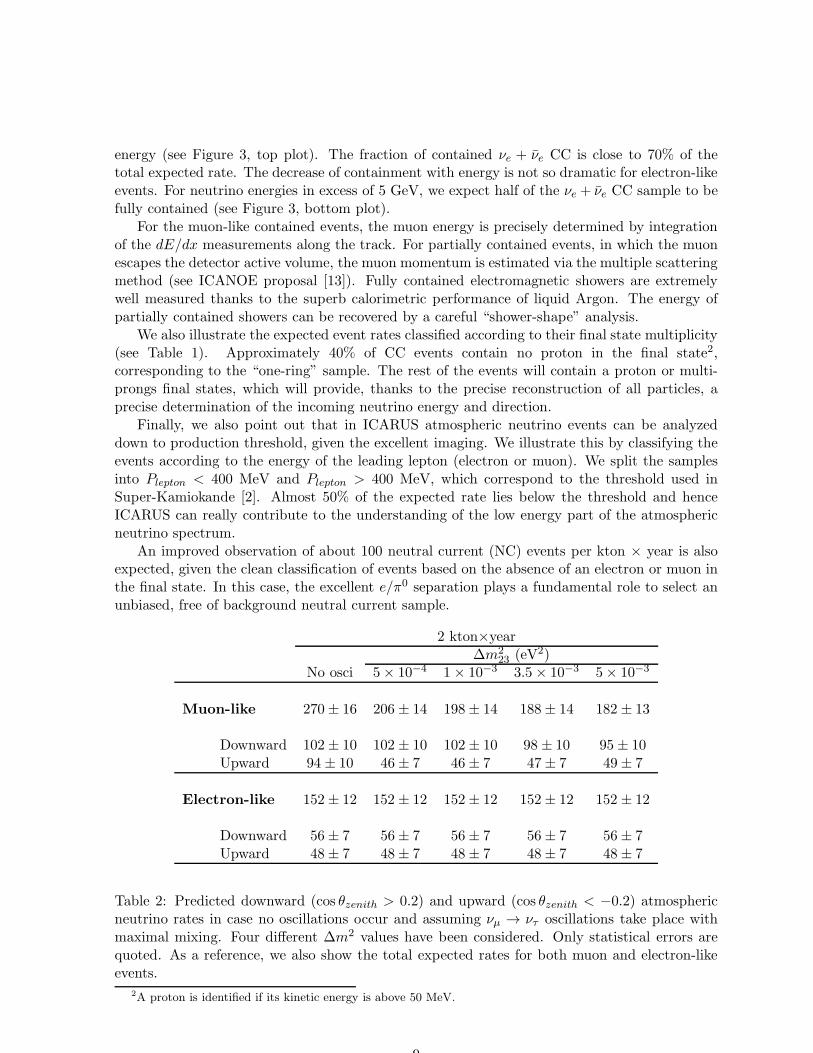
In order to perform a test of the actual reconstruction ability of the δ-rays direction on realmuon tracks, we took advantage of the data taken with the ICARUS 50 liter LAr TPC exposedat the CERN neutrino beam during the 1997 physics run. The detector and the experimentalset-up has been extensively described elsewhere [18]. The results discussed here come from arecent re-analysis of these data [19], which took advantage of the current developments on thereconstruction program.
The collected muon event sample (about one thousand) was used to study the possibility toexploit the visible δ-rays to determine the direction of minimum ionizing particle tracks crossingthe detector. It allowed us to verify on real data the minimum energy allowing full reconstructionof the δ-ray direction and, as a consequence, the effective rate that one can finally expect.
The analysis proceeded through the following steps. The whole sample of through-goingminimum ionizing particle tracks was visually scanned. Only the events containing a muonfully reconstructed in NOMAD and matching a track in the LAr-TPC were retained. Thisrequirement safely predefined the direction of the selected tracks in the LAr-TPC.
The selected muon sample consists of 320 events, corresponding to 120 m of minimum ionizingparticle track. The search and reconstruction of δ-rays were then performed following a seriesof simple criteria. A visible δ-ray was defined as a track starting as double ionization on top ofthe main muon track and stopping aside of the main track in at least one view.
The δ-ray kinetic energy was simply calculated from the reconstructed 3-D range of its track,knowing that the average dE/dx is about 2.1 MeV/cm practically constant over all the range.Only δ-rays with deposited energy above 2 MeV and below 30 MeV (critical energy in LAr)were retained.
The above criteria selected 235 δ-rays over the total 120 meters of tracks, namely about 2δ-rays per meter, with kinetic energy larger then 2 MeV. Remarkably, none was identified withthe wrong direction.
In order to understand our results, we compared the experimental δ-rays energy spectrumwith the predicted rate, valid for kinetic a energy much higher than the mean excitation energy
12
Figure 4: An example of muon track recorded in the ICARUS 50 liter liquid Argon TPCprototype exposed at the CERN neutrino beam. The horizontal axis is the drift time; thevertical one is the wire numbering (top is the collection view, bottom is the induction plan).The visible area in each view corresponds to 472 × 325 mm2. The muon enters from the top ofthe picture on both views. Some δ-rays are clearly visible. The track at the extreme right ofthe picture is not matched by NOMAD and exhibits a showering electron.
13
(T ≫ 188 eV for Argon) [20]:
d2N
dTdx≈
1
2Kρ
Z
A
1
β2
1
T 2F1F2 (3)
=9.67F1F2
(T/MeV )2m−1MeV −1 (4)
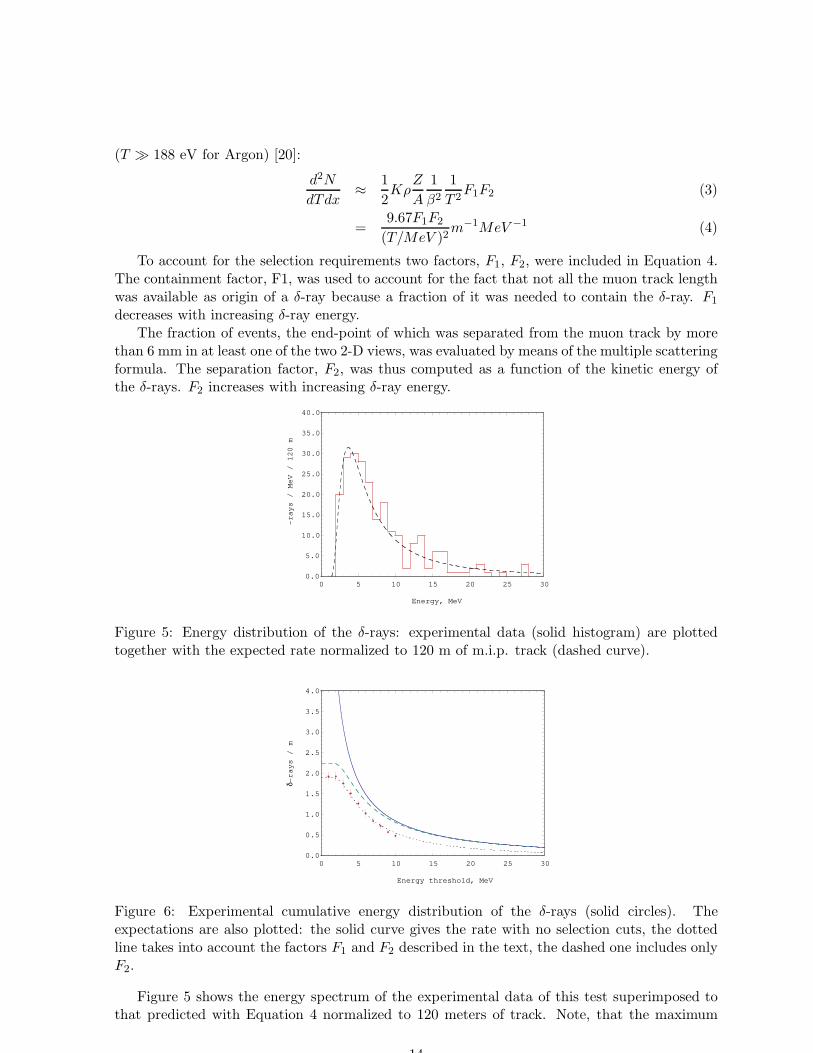
To account for the selection requirements two factors, F1, F2, were included in Equation 4.The containment factor, F1, was used to account for the fact that not all the muon track lengthwas available as origin of a δ-ray because a fraction of it was needed to contain the δ-ray. F1
decreases with increasing δ-ray energy.The fraction of events, the end-point of which was separated from the muon track by more
than 6 mm in at least one of the two 2-D views, was evaluated by means of the multiple scatteringformula. The separation factor, F2, was thus computed as a function of the kinetic energy ofthe δ-rays. F2 increases with increasing δ-ray energy.
0.0
5.0
10.0
15.0
20.0
25.0
30.0
35.0
40.0
0 5 10 15 20 25 30
-rays / MeV / 120 m
Energy, MeV
Figure 5: Energy distribution of the δ-rays: experimental data (solid histogram) are plottedtogether with the expected rate normalized to 120 m of m.i.p. track (dashed curve).
0.0
0.5
1.0
1.5
2.0
2.5
3.0
3.5
4.0
0 5 10 15 20 25 30
δ-rays / m
Energy threshold, MeV
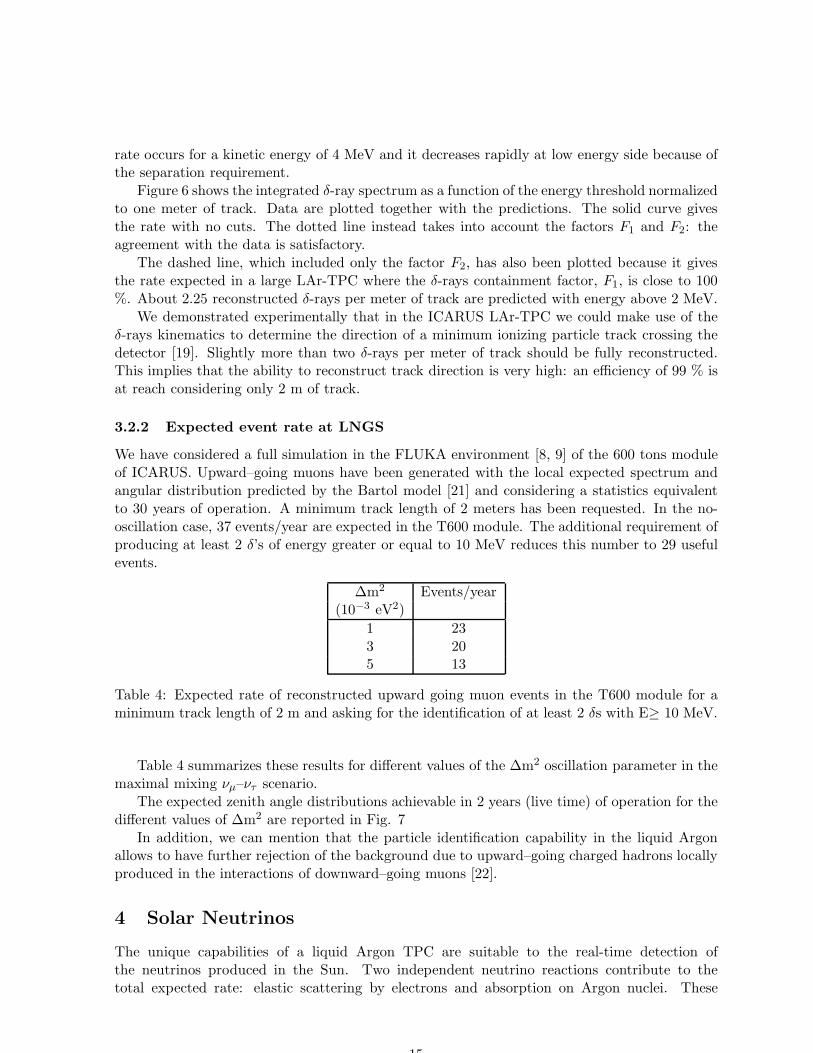
Figure 6: Experimental cumulative energy distribution of the δ-rays (solid circles). Theexpectations are also plotted: the solid curve gives the rate with no selection cuts, the dottedline takes into account the factors F1 and F2 described in the text, the dashed one includes onlyF2.
Figure 5 shows the energy spectrum of the experimental data of this test superimposed tothat predicted with Equation 4 normalized to 120 meters of track. Note, that the maximum
14
rate occurs for a kinetic energy of 4 MeV and it decreases rapidly at low energy side because ofthe separation requirement.
Figure 6 shows the integrated δ-ray spectrum as a function of the energy threshold normalizedto one meter of track. Data are plotted together with the predictions. The solid curve givesthe rate with no cuts. The dotted line instead takes into account the factors F1 and F2: theagreement with the data is satisfactory.
The dashed line, which included only the factor F2, has also been plotted because it givesthe rate expected in a large LAr-TPC where the δ-rays containment factor, F1, is close to 100%. About 2.25 reconstructed δ-rays per meter of track are predicted with energy above 2 MeV.
We demonstrated experimentally that in the ICARUS LAr-TPC we could make use of theδ-rays kinematics to determine the direction of a minimum ionizing particle track crossing thedetector [19]. Slightly more than two δ-rays per meter of track should be fully reconstructed.This implies that the ability to reconstruct track direction is very high: an efficiency of 99 % isat reach considering only 2 m of track.
3.2.2 Expected event rate at LNGS
We have considered a full simulation in the FLUKA environment [8, 9] of the 600 tons moduleof ICARUS. Upward–going muons have been generated with the local expected spectrum andangular distribution predicted by the Bartol model [21] and considering a statistics equivalentto 30 years of operation. A minimum track length of 2 meters has been requested. In the no-oscillation case, 37 events/year are expected in the T600 module. The additional requirement ofproducing at least 2 δ’s of energy greater or equal to 10 MeV reduces this number to 29 usefulevents.
∆m2 Events/year(10−3 eV2)
1 233 205 13
Table 4: Expected rate of reconstructed upward going muon events in the T600 module for aminimum track length of 2 m and asking for the identification of at least 2 δs with E≥ 10 MeV.
Table 4 summarizes these results for different values of the ∆m2 oscillation parameter in themaximal mixing νµ–ντ scenario.
The expected zenith angle distributions achievable in 2 years (live time) of operation for thedifferent values of ∆m2 are reported in Fig. 7
In addition, we can mention that the particle identification capability in the liquid Argonallows to have further rejection of the background due to upward–going charged hadrons locallyproduced in the interactions of downward–going muons [22].
4 Solar Neutrinos
The unique capabilities of a liquid Argon TPC are suitable to the real-time detection ofthe neutrinos produced in the Sun. Two independent neutrino reactions contribute to thetotal expected rate: elastic scattering by electrons and absorption on Argon nuclei. These
15

0
5
10
15
20
25
30
-1 -0.5 0cosθ
No osc.
0
5
10
15
20
25
30
-1 -0.5 0
∆m2=10-3
cosθ
0
5
10
15
20
25
30
-1 -0.5 0cosθ
∆m2=3 10-3
0
5
10
15
20
25
30
-1 -0.5 0cosθ
∆m2=5 10-3
Figure 7: Expected zenith angle distributions achievable in 2 years (live time) of operation forthe different values of ∆m2 (sin22θ=1) as a function of the cosine of the zenith angle. The boxshows the statistical error.
16
interactions usually result in the production of a primary electron track, sometimes accompaniedby secondary electron tracks of lower energy.
Small liquid Argon TPC prototypes have demonstrated that electrons with a kinetic energyas low as 150 keV can be detected [18]. This performance allows a detailed reconstruction of thesolar neutrino interactions. The background induced by natural radioactivity and the need toestablish the electron direction in elastic scattering events, require a threshold for the detectionof primary electrons. As will be discussed below, this threshold is of the order of 5 MeV forelastic and absorption events, thus allowing investigation on the higher energy part of the solarneutrino spectrum (8B and hep).
The performance of the ICARUS T600 detector in the analysis of solar neutrino events arewidely discussed in a recent, dedicated ICARUS publication [23]. We only recall here the mainresults of this study, referring to the paper for the detailed analysis, in particular regarding thebackground estimate.
4.1 Event and background rates evaluation
ICARUS can make a fundamental contribution to our understanding of solar neutrino intensitiesand their energy spectrum, by observing the electron produced in the following independentprocesses:
- elastic scattering by electrons: νe,µ,τ + e− → νe,µ,τ + e−
- absorption reactions on Argon nuclei: νe+40Ar→40K∗ + e−
The first step in the analysis of solar neutrino events is the calculation of event and backgroundrates.
4.1.1 Intensity of neutrino events
We consider separately neutrino elastic scattering (ES) on electrons and neutrino absorption byArgon with Fermi transition (F) to the 4.38 MeV Isotopic Analogue State (IAS) of 40K , andGamow-Teller transitions (GT) to several 40K levels [24]. The 8B solar neutrino flux used in thecalculation is taken from the BP98 standard solar model [25].
The elastic scattering event rate at different values of the cutoff kinetic energy of the recoilelectron is computed by using the cross section values taken from Ref. [26]. For neutrinoabsorption, the shape of the cross section (evaluated for a transition to the IAS) is assumed tobe the same for Fermi and Gamow-Teller transitions and the absolute values are computed bynormalization to the theoretical values obtained by shell model calculations [24]. The Fermi andGamow-Teller contributions to the neutrino absorption on 40Ar can also be obtained indirectlyfrom measurements of the β+-decay of the mirror nucleus 40Ti, assuming isospin symmetry. Tworecent experiments have been performed. One of them [27], yields cross section values somewhatlarger, while the second [28] essentially confirms the theoretical predictions. The lowest crosssection values have been used for the present calculations.
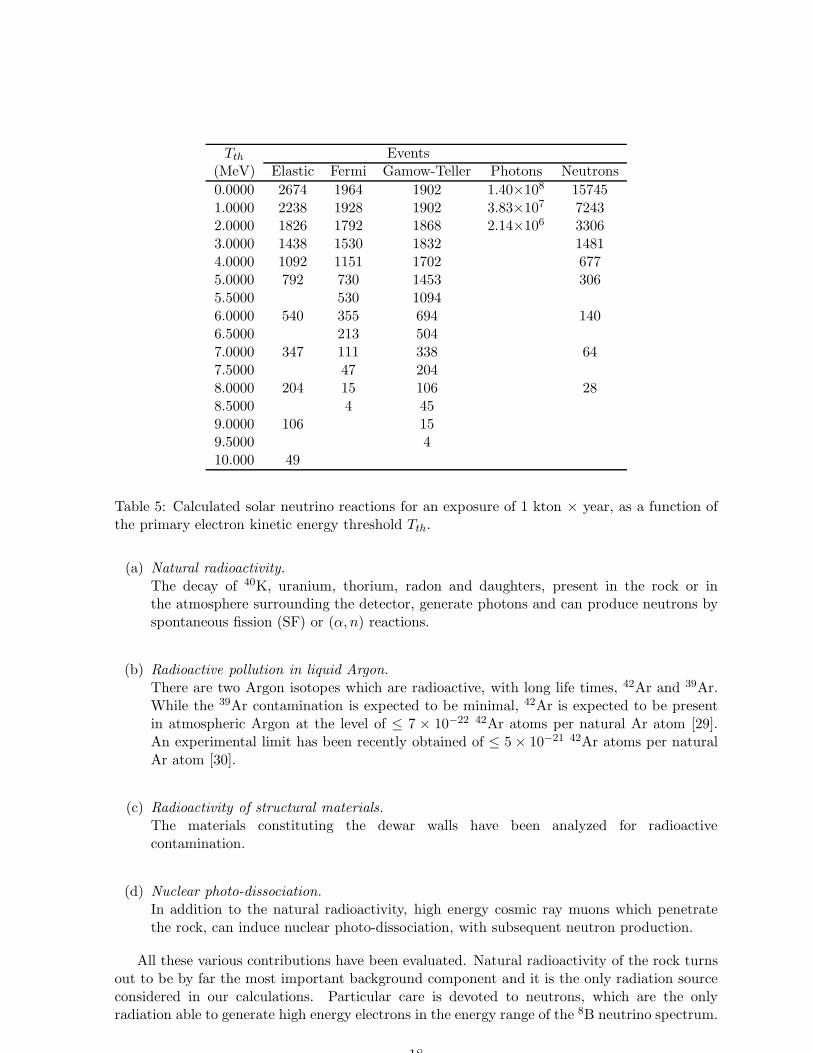
The resulting neutrino interaction achievable with an exposure of 1 kton × year, for ES,F and GT events, as a function of the threshold on the primary electron kinetic energy, aresummarized in columns 2 to 4 of table 5.
4.1.2 Background estimates
The following background sources have been considered:
17
Tth Events(MeV) Elastic Fermi Gamow-Teller Photons Neutrons
0.0000 2674 1964 1902 1.40×10⁸ 157451.0000 2238 1928 1902 3.83×10⁷ 72432.0000 1826 1792 1868 2.14×10⁶ 33063.0000 1438 1530 1832 14814.0000 1092 1151 1702 6775.0000 792 730 1453 3065.5000 530 10946.0000 540 355 694 1406.5000 213 5047.0000 347 111 338 647.5000 47 2048.0000 204 15 106 288.5000 4 459.0000 106 159.5000 410.000 49
Table 5: Calculated solar neutrino reactions for an exposure of 1 kton × year, as a function ofthe primary electron kinetic energy threshold Tth.
(a) Natural radioactivity.The decay of 40K, uranium, thorium, radon and daughters, present in the rock or inthe atmosphere surrounding the detector, generate photons and can produce neutrons byspontaneous fission (SF) or (α, n) reactions.
(b) Radioactive pollution in liquid Argon.There are two Argon isotopes which are radioactive, with long life times, 42Ar and 39Ar.While the 39Ar contamination is expected to be minimal, 42Ar is expected to be presentin atmospheric Argon at the level of ≤ 7 × 10⁻²² 42Ar atoms per natural Ar atom [29].An experimental limit has been recently obtained of ≤ 5× 10⁻²¹ 42Ar atoms per naturalAr atom [30].
(c) Radioactivity of structural materials.The materials constituting the dewar walls have been analyzed for radioactivecontamination.
(d) Nuclear photo-dissociation.In addition to the natural radioactivity, high energy cosmic ray muons which penetratethe rock, can induce nuclear photo-dissociation, with subsequent neutron production.
All these various contributions have been evaluated. Natural radioactivity of the rock turnsout to be by far the most important background component and it is the only radiation sourceconsidered in our calculations. Particular care is devoted to neutrons, which are the onlyradiation able to generate high energy electrons in the energy range of the 8B neutrino spectrum.
18
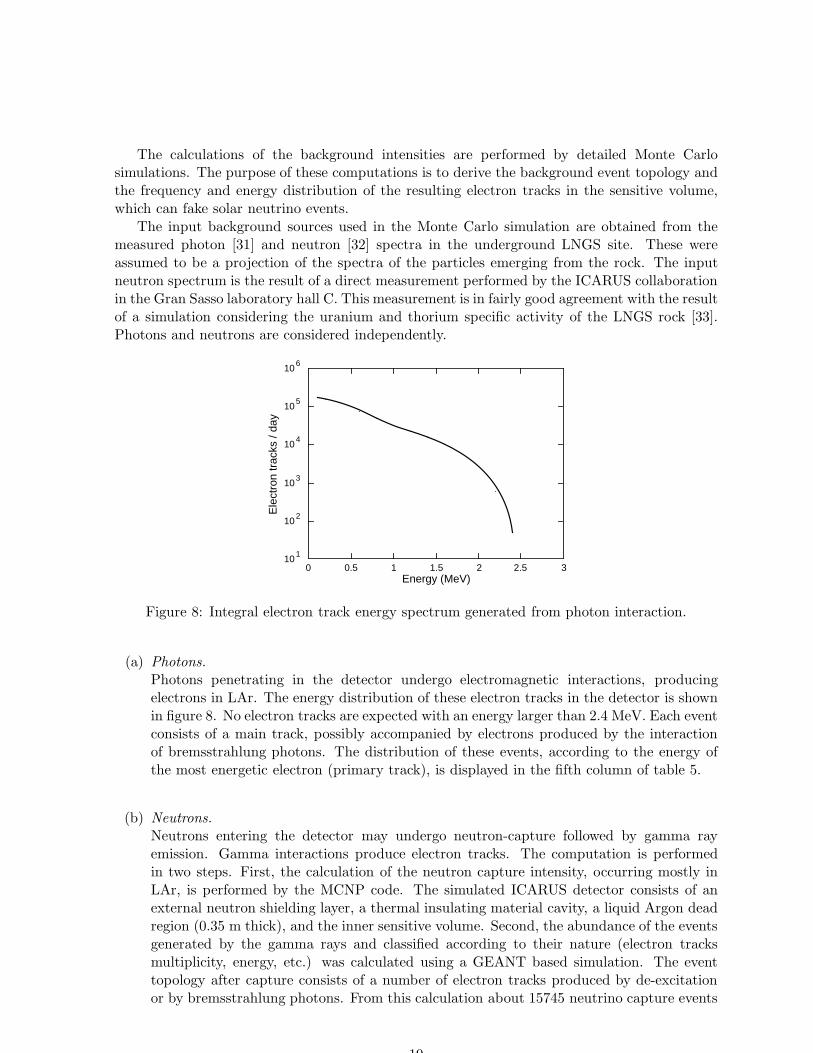
The calculations of the background intensities are performed by detailed Monte Carlosimulations. The purpose of these computations is to derive the background event topology andthe frequency and energy distribution of the resulting electron tracks in the sensitive volume,which can fake solar neutrino events.
The input background sources used in the Monte Carlo simulation are obtained from themeasured photon [31] and neutron [32] spectra in the underground LNGS site. These wereassumed to be a projection of the spectra of the particles emerging from the rock. The inputneutron spectrum is the result of a direct measurement performed by the ICARUS collaborationin the Gran Sasso laboratory hall C. This measurement is in fairly good agreement with the resultof a simulation considering the uranium and thorium specific activity of the LNGS rock [33].Photons and neutrons are considered independently.
10
10
10
10
10
10
1
2
3
4
5
6
0 0.5 1 1.5 2 2.5 3
Ele
ctro
n tr
acks
/ da
y
Energy (MeV)
Figure 8: Integral electron track energy spectrum generated from photon interaction.
(a) Photons.Photons penetrating in the detector undergo electromagnetic interactions, producingelectrons in LAr. The energy distribution of these electron tracks in the detector is shownin figure 8. No electron tracks are expected with an energy larger than 2.4 MeV. Each eventconsists of a main track, possibly accompanied by electrons produced by the interactionof bremsstrahlung photons. The distribution of these events, according to the energy ofthe most energetic electron (primary track), is displayed in the fifth column of table 5.
(b) Neutrons.Neutrons entering the detector may undergo neutron-capture followed by gamma rayemission. Gamma interactions produce electron tracks. The computation is performedin two steps. First, the calculation of the neutron capture intensity, occurring mostly inLAr, is performed by the MCNP code. The simulated ICARUS detector consists of anexternal neutron shielding layer, a thermal insulating material cavity, a liquid Argon deadregion (0.35 m thick), and the inner sensitive volume. Second, the abundance of the eventsgenerated by the gamma rays and classified according to their nature (electron tracksmultiplicity, energy, etc.) was calculated using a GEANT based simulation. The eventtopology after capture consists of a number of electron tracks produced by de-excitationor by bremsstrahlung photons. From this calculation about 15745 neutrino capture events
19
are expected for an exposure of 1 kton × year. The distribution of these events, accordingto the energy of the most energetic electron track, is displayed in the last column of table 5.
The topologies of the neutron capture events, in which at least one electron has kineticenergy larger then 5 MeV (obtained with the GEANT program) are displayed in table 6 d).Here, the fraction of events is shown as a function of the Compton electron multiplicity andits associated energy (total energy of secondary electrons). This table, together with thevalues displayed in the last column of table 5, will allow the computation of the backgroundcontamination in each class of events.
4.2 Solar neutrinos detection
The choice of a primary electron kinetic energy threshold of 5 MeV, to select the solar neutrinoevent sample, is justified by statistical considerations on neutrino signal versus background eventrates (reported in table 5). With this selection there is no photon background contribution, whilea total sample of 2975 solar neutrino events is expected (for 1 kton × year exposure), with acontamination of 306 events from neutron background.
In order to define off-line event versus background selection criteria, a full GEANT MonteCarlo simulation, which performs the transport of gamma rays and electrons inside the liquidArgon, has been carried out. Every electron track is then digitized by the following procedure:
(a) The deposited energy is converted in charge.
(b) The charge is drifted towards the anode of the chamber, with an infinite electron life timein LAr.
(c) Digitized electronic signals are generated on three wire planes (forming the anode), placedat 60 from one another, with 3 mm wire pitch.
(d) Gaussian distributed electronic noise is added with zero mean value and a RMS 1000electrons. The resulting electron threshold, which is strongly correlated with electronicnoise and with the sense wire pitch, is 150 keV.
The digitized signals are picked up from the noise by means of an integral-differential algorithmand the final parameters (position and energy after digitization) are obtained by a fittingprocedure of the signals, equivalent to the procedures used for the analysis of real events.
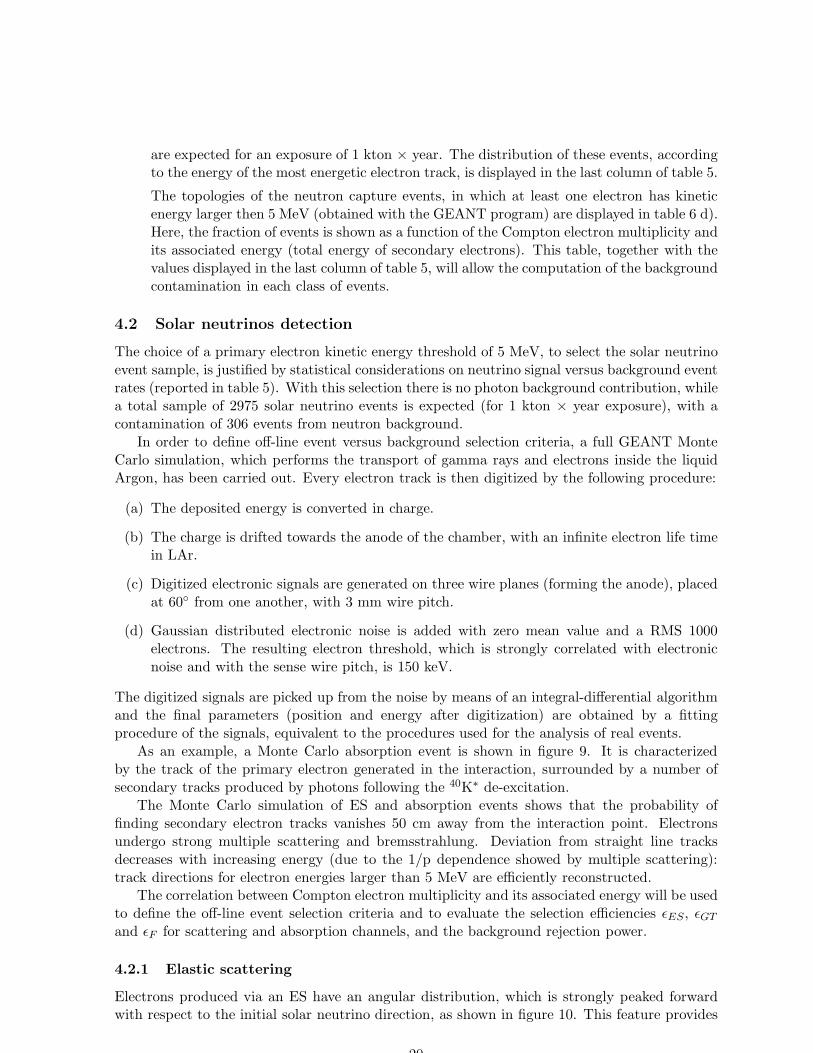
As an example, a Monte Carlo absorption event is shown in figure 9. It is characterizedby the track of the primary electron generated in the interaction, surrounded by a number ofsecondary tracks produced by photons following the 40K∗ de-excitation.
The Monte Carlo simulation of ES and absorption events shows that the probability offinding secondary electron tracks vanishes 50 cm away from the interaction point. Electronsundergo strong multiple scattering and bremsstrahlung. Deviation from straight line tracksdecreases with increasing energy (due to the 1/p dependence showed by multiple scattering):track directions for electron energies larger than 5 MeV are efficiently reconstructed.
The correlation between Compton electron multiplicity and its associated energy will be usedto define the off-line event selection criteria and to evaluate the selection efficiencies ǫES, ǫGT
and ǫF for scattering and absorption channels, and the background rejection power.
4.2.1 Elastic scattering
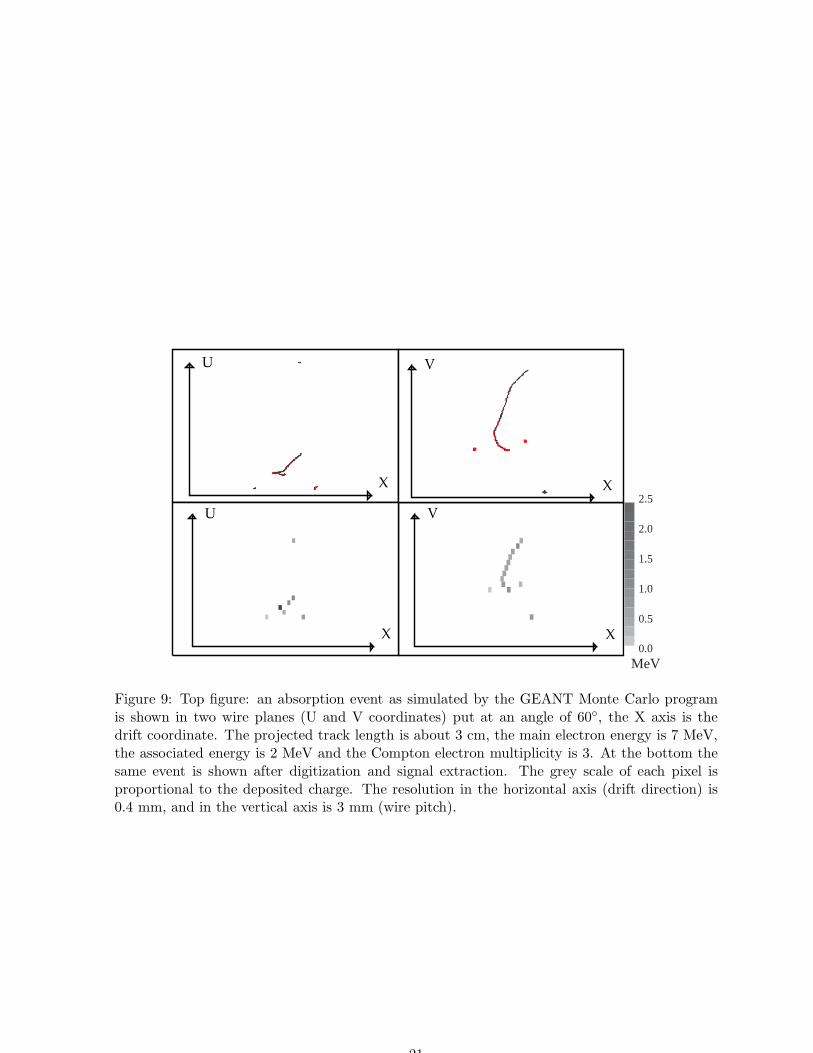
Electrons produced via an ES have an angular distribution, which is strongly peaked forwardwith respect to the initial solar neutrino direction, as shown in figure 10. This feature provides
20
MeV 0.0
0.5
1.0
1.5
2.0
2.5
U
X
V
X
U
X
V
X
Figure 9: Top figure: an absorption event as simulated by the GEANT Monte Carlo programis shown in two wire planes (U and V coordinates) put at an angle of 60, the X axis is thedrift coordinate. The projected track length is about 3 cm, the main electron energy is 7 MeV,the associated energy is 2 MeV and the Compton electron multiplicity is 3. At the bottom thesame event is shown after digitization and signal extraction. The grey scale of each pixel isproportional to the deposited charge. The resolution in the horizontal axis (drift direction) is0.4 mm, and in the vertical axis is 3 mm (wire pitch).
21

an efficient mean to distinguish neutrino elastic events from background, assuming that theelectron vertex is correctly reconstructed from the energy deposited along the track. In ourcomputations the first hit wire can be distinguished from the end point of one electron with anefficiency larger than 80%. Moreover, electrons from ES reactions are essentially isolated. Thefraction of the ES events as a function of the multiplicity and energy of the secondary tracks isshown in table 6 a).
a) Elastic scattering eventsAssociated Compton electron multiplicityEnergy 0 1 2 3
E < 1 MeV 0.880 0.073 0.008 0E ≥ 1 MeV 0 0.015 0.015 0.009
b) Gamow-Teller events
Associated Compton electron multiplicityEnergy 0 1 2 ≥ 3
E < 1 MeV 0.083 0.168 0.049 0E ≥ 1 MeV 0 0.075 0.297 0.328
c) Fermi eventsAssociated Compton electron multiplicityEnergy 0 1 2 ≥ 3
E < 1 MeV 0.032 0.039 0.018 0E ≥ 1 MeV 0 0.081 0.221 0.519
d) Neutron capture eventsAssociated Compton electron multiplicityEnergy 0 1 2 > 2
E < 1 MeV 0.46 0.26 0.10 0E ≥ 1 MeV 0 0.05 0.07 0.06
Table 6: Fraction of events with at least one electron with kinetic energy larger than 5 MeV, asa function of the Compton electron multiplicity and its associated energy. Data obtained afterdigitization are used.
Therefore, we assume the following off-line selection criteria for ES events:
1. primary electron energy larger than 5 MeV;
2. cone aperture around the direction of the emitted electron of 25: efficiency ǫ1 = 0.65;
3. Compton electron multiplicity M=0: efficiency ǫ2 = 0.88, see table 6 a).
The total detection efficiency is ǫES = 0.572, corresponding to an ES expected rate of 453 events,for 1 kton × year exposure (see table 5).
The contamination of neutron capture events is 306 events (see table 5). Applying the ESselection criteria on the neutron sample (angular cut efficiency ǫ1 = 0.047, multiplicity cutǫ2 = 0.46, using table 6 d)), we obtain 7 residual background events. If we are not able todetermine the electron direction of flight, the angular cut efficiency is half and we remain with14 background events.
22
0.0
0.2
0.4
0.6
0.8
1.0
Effi
cien
cy
Angle (degree)0 20 40 60 80 100 120 140 160 180
Figure 10: Fraction of elastic events (E > 5 MeV) as a function of the cone angle within whichthe reconstructed electron direction in space is contained; the cone axis is defined by the parentneutrino direction. Three wire planes put at 60 angle and a 3 mm wire pitch are used.
4.2.2 Absorption events
The angular distributions of electrons produced by absorption events, to a first approximation,can be considered isotropic, therefore angular cuts are not effective. Efficient discriminationcriteria are based on associated energy and multiplicity cuts.
(a) Allowed Gamow-Teller transitions.In table 6 b) the correlation between the associated multiplicity and secondary electrontotal energy for GT events is shown. We assume the following off-line selection criteria forthe GT sample:
1. primary electron kinetic energy larger than 5 MeV;
2. associated energy E ≥ 1 MeV and multiplicity M ≥ 1: ǫGT = 0.70, see table 6 b).
The final expectation after cuts is 1017 events, for 1 kton × year exposure.
(b) Super allowed Fermi transition.In table 6 c) the correlation between the associated multiplicity and energy is shown.
We assume the following off-line selection criteria for F events:
1. primary electron kinetic energy larger than 5 MeV,
2. associated energy E ≥ 1 MeV and multiplicity M ≥ 1: ǫF = 0.82, see table 6 c).
The final expectation after cuts is 599 events, for 1 kton × year exposure.
The total absorption rate (GT+F) is about 1616 events, for 1 kton × year exposure, with acontamination from neutron captures of 55 events, applying the absorption cuts to the neutronsample (see table 5 and 6 d)).
Besides the neutron contamination, 8.3% of the GT and 3.2% of the F type events can fakean elastic scattering event, as can be seen in tables 6 b) and 6 c) (multiplicity M=0). Taking
23

into account the angular cut, this reduces the contamination to 11 events, for 1 kton × yearexposure, in the ES sample. The contamination of the absorption sample from ES is 3.9%, i.e.17 events, for 1 kton × year exposure, as can be derived from tables 5 and 6 a) (multiplicityM ≥ 1 and associated energy ≥ 1 MeV).
4.3 Sensitivity to oscillations
We summarize the results in table 7, where the estimated rates of events per year are shown,together with the background rates. From this table we conclude that a clean measurementof 8B solar neutrinos can be performed in a reasonable data-taking time. Direct proof of theoscillation mechanism will be possible for a vast fraction of the presently allowed parameterregion through the comparison of the elastic and absorption event rates (table 8). An accuratemeasurement of the 8B spectrum will also be performed by means of the absorption eventsample. It is important to bear in mind that this is possible because of the low intensity ofbackground signals. Noise is mainly related to the neutron flux level in the LNGS laboratories,but the radioactive contamination of the materials employed in the detector construction mustbe accurately considered. At present in one of the half-modules the electric-insulation material isnot adequate from the point of view of the radiochemical purity. We estimate that this materialwill induce an increase of the background by a factor of 10. However, we plan to substitute itbefore the installation in the underground lab.
Events/year
Elastic channel (E ≥ 5 MeV) 453Background 14Absorption event contamination 11
Absorption channels 1616Background 55Elastic event contamination 17
Table 7: Number of events expected with an exposure of 1 kton × year, compared with thecomputed background (no oscillation).
In Super-K about 13 solar neutrino events/day (elastic scattering), with an energy thresholdof 5 MeV, are observed. In the ICARUS T600 detector, with a neutrino oscillation hypothesis,1.4 solar neutrino events/day (elastic scattering + absorption) with E > 5 MeV are expected.Therefore, the statistical accuracy attainable with the T600 experiment is by far worse comparedto Super-K. However, systematic uncertainty is expected to be lower, due to the higher eventselection efficiency and energy resolution. More important, with ICARUS one can exploit thetwo available solar neutrino interaction processes. This is relevant to enhance the sensitivity tooscillation.
Recently the SNO experiment started operation (November 1999). The active mass is about1 kton of heavy water (D2O) and the energy threshold is 5 MeV. The main solar neutrinodetectable reactions are CC neutrino absorption by deuterium and NC neutrino dissociationof deuterium. In case of no oscillation, the two reactions follow the CC:NC=2.05:1.00 ratio.The expected number of CC reactions is about 9 × 10³ events/year, without taking intoaccount efficiency cuts, depending on detector performance and varying with possible oscillationparameters [34]. At present (phase 1) only CC reactions can be detected, NC reaction detectionwill be possible in phase 2, when salt will be diluted in D2O. Just as for radiochemical solarneutrino experiments, there is no energy discrimination for the NC reaction. Oscillation analysis
24
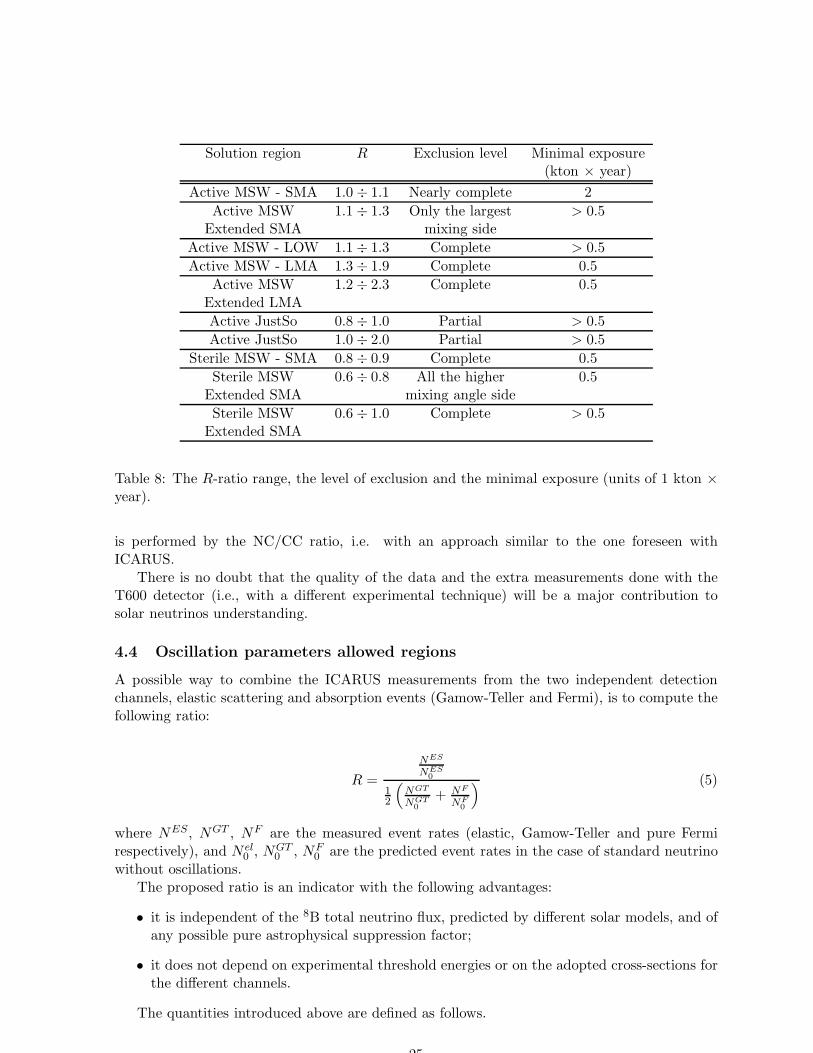
Solution region R Exclusion level Minimal exposure(kton × year)
Active MSW - SMA 1.0 ÷ 1.1 Nearly complete 2
Active MSW 1.1 ÷ 1.3 Only the largest > 0.5Extended SMA mixing side
Active MSW - LOW 1.1 ÷ 1.3 Complete > 0.5
Active MSW - LMA 1.3 ÷ 1.9 Complete 0.5
Active MSW 1.2 ÷ 2.3 Complete 0.5Extended LMA
Active JustSo 0.8 ÷ 1.0 Partial > 0.5
Active JustSo 1.0 ÷ 2.0 Partial > 0.5
Sterile MSW - SMA 0.8 ÷ 0.9 Complete 0.5
Sterile MSW 0.6 ÷ 0.8 All the higher 0.5Extended SMA mixing angle side
Sterile MSW 0.6 ÷ 1.0 Complete > 0.5Extended SMA
Table 8: The R-ratio range, the level of exclusion and the minimal exposure (units of 1 kton ×
year).
is performed by the NC/CC ratio, i.e. with an approach similar to the one foreseen withICARUS.
There is no doubt that the quality of the data and the extra measurements done with theT600 detector (i.e., with a different experimental technique) will be a major contribution tosolar neutrinos understanding.
4.4 Oscillation parameters allowed regions
A possible way to combine the ICARUS measurements from the two independent detectionchannels, elastic scattering and absorption events (Gamow-Teller and Fermi), is to compute thefollowing ratio:
R =
NES
NES0
12
(
NGT
NGT0
+ NF
NF0
) (5)
where NES, NGT , NF are the measured event rates (elastic, Gamow-Teller and pure Fermirespectively), and N el
0 , NGT0 , NF
0 are the predicted event rates in the case of standard neutrinowithout oscillations.
The proposed ratio is an indicator with the following advantages:
• it is independent of the 8B total neutrino flux, predicted by different solar models, and ofany possible pure astrophysical suppression factor;
• it does not depend on experimental threshold energies or on the adopted cross-sections forthe different channels.
The quantities introduced above are defined as follows.
25
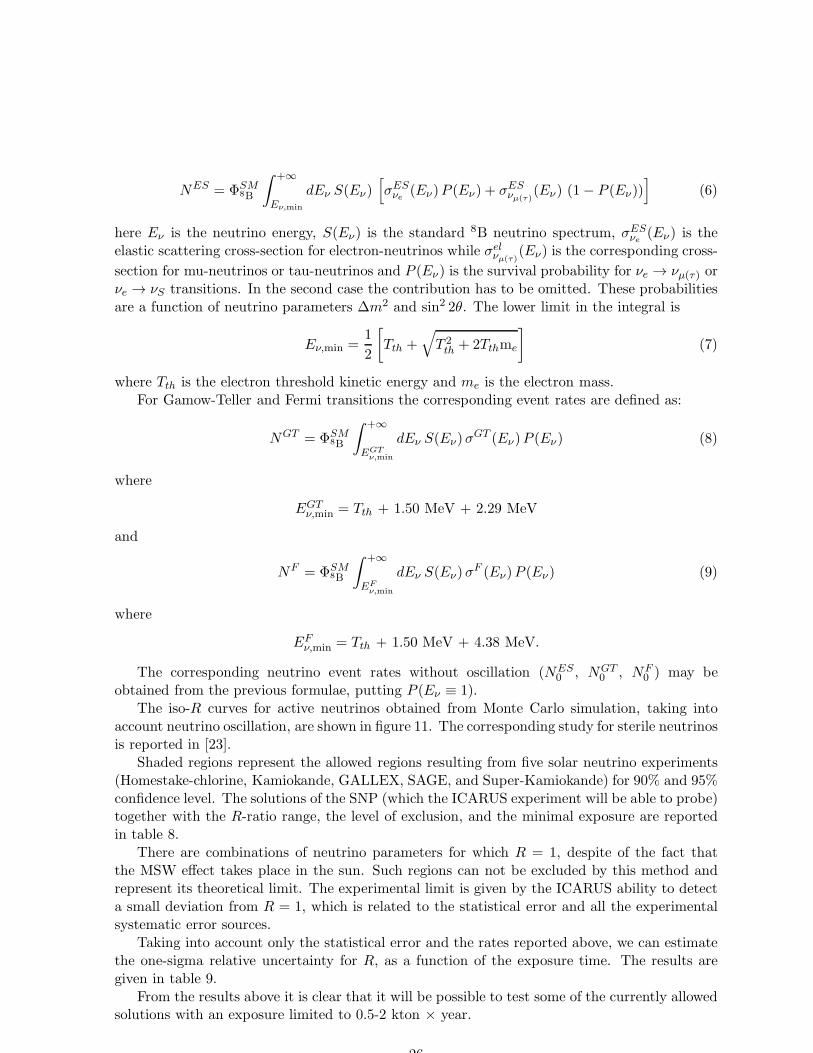
NES = ΦSM8B
∫ +∞
Eν,min
dEν S(Eν)[
σESνe (Eν)P (Eν) + σES
νµ(τ)(Eν) (1− P (Eν))
]
(6)
here Eν is the neutrino energy, S(Eν) is the standard 8B neutrino spectrum, σESνe (Eν) is the
elastic scattering cross-section for electron-neutrinos while σelνµ(τ)
(Eν) is the corresponding cross-
section for mu-neutrinos or tau-neutrinos and P (Eν) is the survival probability for νe → νµ(τ) orνe → νS transitions. In the second case the contribution has to be omitted. These probabilitiesare a function of neutrino parameters ∆m2 and sin2 2θ. The lower limit in the integral is
Eν,min =1
2
[
Tth +√
T 2th + 2Tthme
]
(7)
where Tth is the electron threshold kinetic energy and me is the electron mass.For Gamow-Teller and Fermi transitions the corresponding event rates are defined as:
NGT = ΦSM8B
∫ +∞
EGTν,min
dEν S(Eν)σGT (Eν)P (Eν) (8)
where
EGTν,min = Tth + 1.50 MeV + 2.29 MeV
and
NF = ΦSM8B
∫ +∞
EFν,min
dEν S(Eν)σF (Eν)P (Eν) (9)
where
EFν,min = Tth + 1.50 MeV + 4.38 MeV.
The corresponding neutrino event rates without oscillation (NES0 , NGT
0 , NF0 ) may be
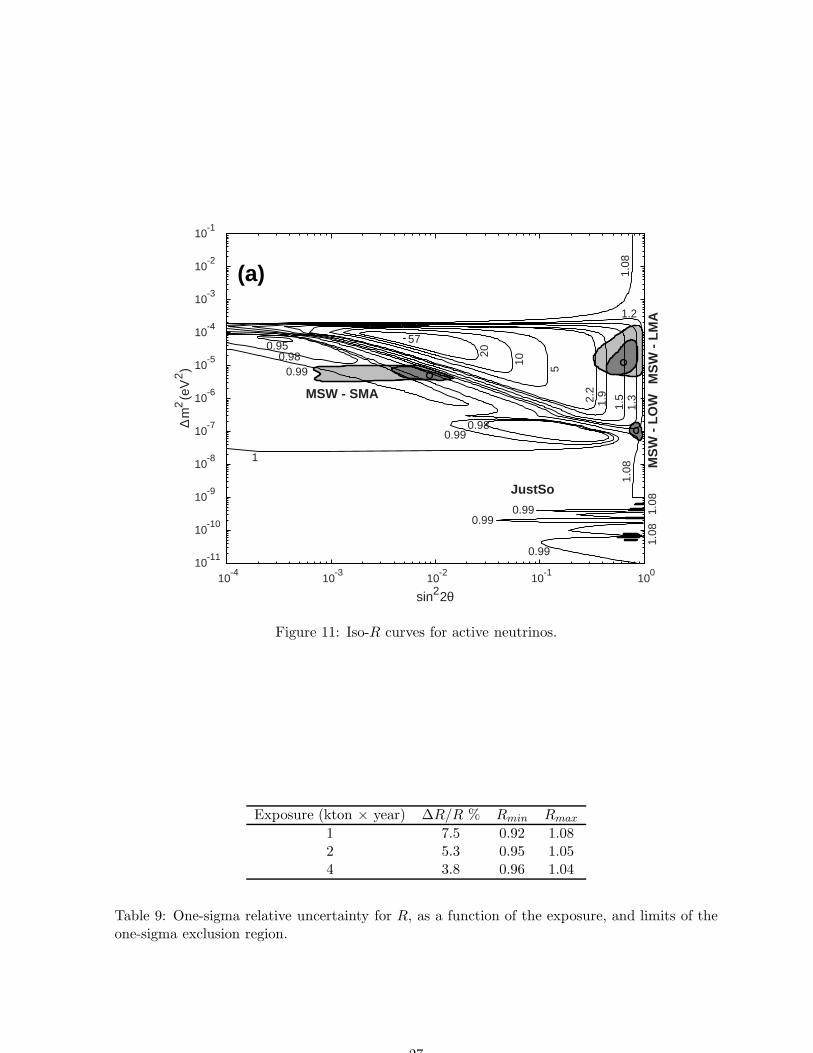
obtained from the previous formulae, putting P (Eν ≡ 1).The iso-R curves for active neutrinos obtained from Monte Carlo simulation, taking into
account neutrino oscillation, are shown in figure 11. The corresponding study for sterile neutrinosis reported in [23].
Shaded regions represent the allowed regions resulting from five solar neutrino experiments(Homestake-chlorine, Kamiokande, GALLEX, SAGE, and Super-Kamiokande) for 90% and 95%confidence level. The solutions of the SNP (which the ICARUS experiment will be able to probe)together with the R-ratio range, the level of exclusion, and the minimal exposure are reportedin table 8.
There are combinations of neutrino parameters for which R = 1, despite of the fact thatthe MSW effect takes place in the sun. Such regions can not be excluded by this method andrepresent its theoretical limit. The experimental limit is given by the ICARUS ability to detecta small deviation from R = 1, which is related to the statistical error and all the experimentalsystematic error sources.
Taking into account only the statistical error and the rates reported above, we can estimatethe one-sigma relative uncertainty for R, as a function of the exposure time. The results aregiven in table 9.
From the results above it is clear that it will be possible to test some of the currently allowedsolutions with an exposure limited to 0.5-2 kton × year.
26
10 10 10 10 10-4 -3 -2 -1 0
10
10
10
10
10
10
10
10
10
10
10
-11
-10
-9
-8
-7
-6
-5
-4
-3
-2
-1
0.950.98
0.98
0.990.99
0.99
0.99
0.99
1
1.08
1.08
1.08
1.08
1.2
1.3
1.51.92.2
5
10
20
57
MS
W -
LO
W
JustSo
MSW - SMA
MS
W -
LM
A
sin2 2 θ
∆ m
2 (eV
)2
(a)
Figure 11: Iso-R curves for active neutrinos.
Exposure (kton × year) ∆R/R % Rmin Rmax
1 7.5 0.92 1.082 5.3 0.95 1.054 3.8 0.96 1.04
Table 9: One-sigma relative uncertainty for R, as a function of the exposure, and limits of theone-sigma exclusion region.
27
5 Nucleon decay searches
The question of baryonic matter stability is of paramount importance, since proton decay offersan unique way to have an insight of what happens beyond what currently appears to be thedesert after the standard model. The theoretical ideas and models relevant to proton decayrequire some new, very high, intermediate mass scale. Such a mass scale will never be reachedwith today’s acceleration techniques. Non-accelerator experiments are the only way to exploreexperimentally the phenomenology at such high energies.
The Super-Kamiokande collaboration has extensively probe the classical decay channels (e.g.,p → e+π0) and the dominant decay mode, p → νK+ according to SUSY Grand Unified Theories(see e.g. Ref. [35]). Plans exist to operate a megaton water Cerenkov detector [36] in view ofimproving current sensitivities for p → e+π0 and p → νK+ modes by at least one order ofmagnitude. However, to unmistakably show the existence of a signal, these experiments have torely on statistical background subtraction.
A clear advantage and certainly the main strength of the ICARUS technique is, that discoverywill be possible at the level of a single event, thanks to its superb imaging and energy resolutioncapabilities. In addition, a full understanding of the mechanism responsible for proton decay,requires a precise measurement of all possible branching ratios. Since ICARUS provides a muchmore powerful background rejection, it can perform a large variety of exclusive decay modesmeasurements. Inclusive searches are obviously also possible.
Hence, a liquid Argon detector is an ideal device, in particular, for those channels that arenot accessible to Cerenkov detectors due to the complicated event topology, or because theemitted particles are below the Cerenkov threshold (e.g. K±). In particular, the operation ofa T600 module, at the Gran Sasso laboratory, will be of the utmost importance to verify both,the predicted background levels and the anticipated detector efficiencies.
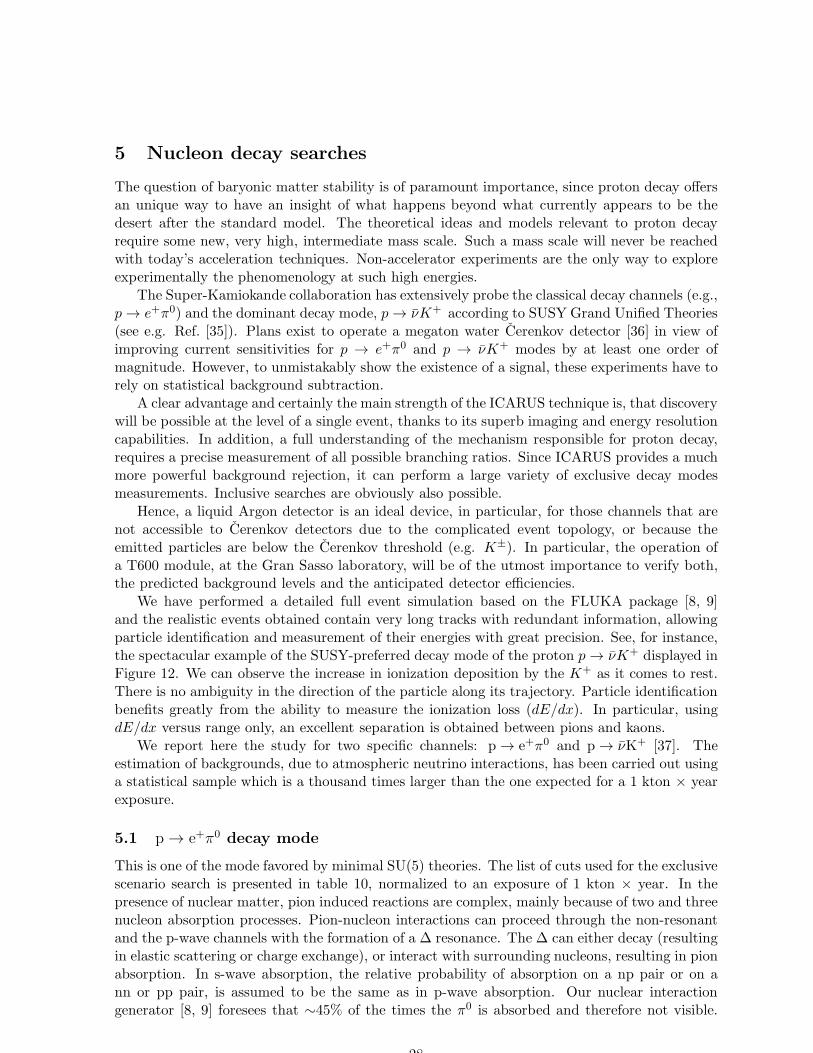
We have performed a detailed full event simulation based on the FLUKA package [8, 9]and the realistic events obtained contain very long tracks with redundant information, allowingparticle identification and measurement of their energies with great precision. See, for instance,the spectacular example of the SUSY-preferred decay mode of the proton p → νK+ displayed inFigure 12. We can observe the increase in ionization deposition by the K+ as it comes to rest.There is no ambiguity in the direction of the particle along its trajectory. Particle identificationbenefits greatly from the ability to measure the ionization loss (dE/dx). In particular, usingdE/dx versus range only, an excellent separation is obtained between pions and kaons.
We report here the study for two specific channels: p → e+π0 and p → νK+ [37]. Theestimation of backgrounds, due to atmospheric neutrino interactions, has been carried out usinga statistical sample which is a thousand times larger than the one expected for a 1 kton × yearexposure.
5.1 p → e+π0 decay mode
This is one of the mode favored by minimal SU(5) theories. The list of cuts used for the exclusivescenario search is presented in table 10, normalized to an exposure of 1 kton × year. In thepresence of nuclear matter, pion induced reactions are complex, mainly because of two and threenucleon absorption processes. Pion-nucleon interactions can proceed through the non-resonantand the p-wave channels with the formation of a ∆ resonance. The ∆ can either decay (resultingin elastic scattering or charge exchange), or interact with surrounding nucleons, resulting in pionabsorption. In s-wave absorption, the relative probability of absorption on a np pair or on ann or pp pair, is assumed to be the same as in p-wave absorption. Our nuclear interactiongenerator [8, 9] foresees that ∼45% of the times the π0 is absorbed and therefore not visible.
28

Figure 12: Simulated proton decay in the preferred channel in Supersymmetric models p → νK+
as could be observed in ICARUS .
29
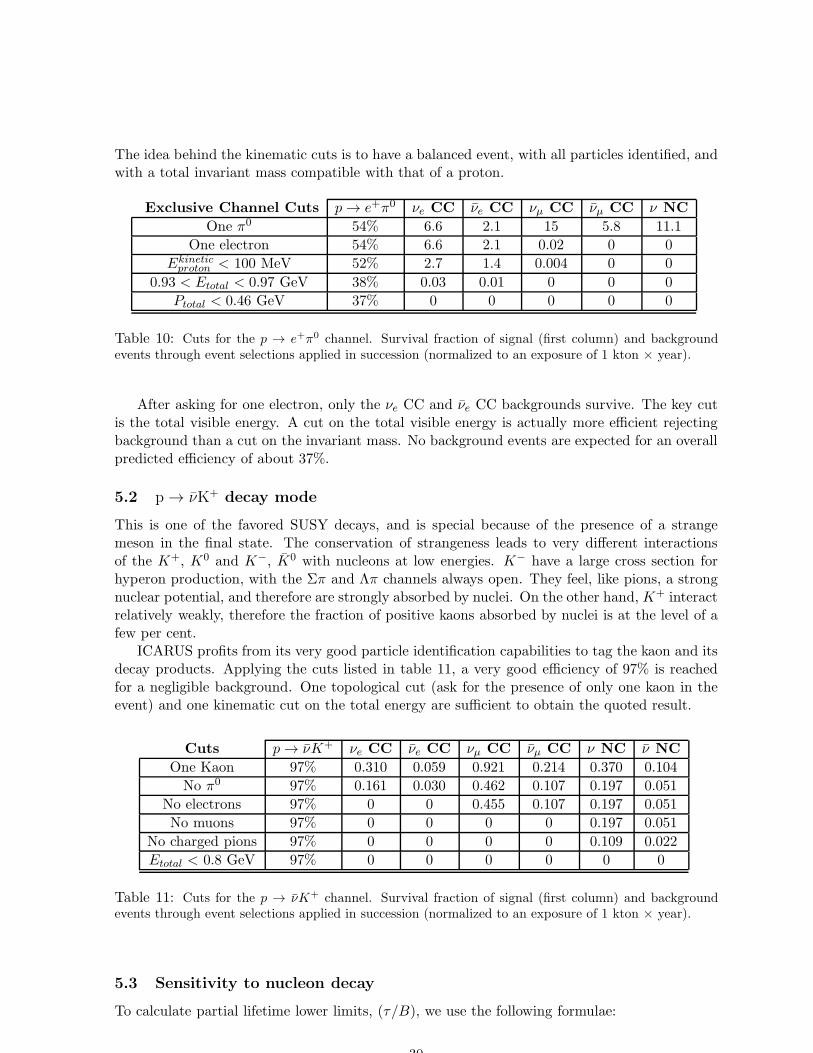
The idea behind the kinematic cuts is to have a balanced event, with all particles identified, andwith a total invariant mass compatible with that of a proton.
Exclusive Channel Cuts p → e+π0 νe CC νe CC νµ CC νµ CC ν NC
One π0 54% 6.6 2.1 15 5.8 11.1
One electron 54% 6.6 2.1 0.02 0 0
Ekineticproton < 100 MeV 52% 2.7 1.4 0.004 0 0
0.93 < Etotal < 0.97 GeV 38% 0.03 0.01 0 0 0
Ptotal < 0.46 GeV 37% 0 0 0 0 0
Table 10: Cuts for the p → e+π0 channel. Survival fraction of signal (first column) and backgroundevents through event selections applied in succession (normalized to an exposure of 1 kton × year).
After asking for one electron, only the νe CC and νe CC backgrounds survive. The key cutis the total visible energy. A cut on the total visible energy is actually more efficient rejectingbackground than a cut on the invariant mass. No background events are expected for an overallpredicted efficiency of about 37%.
5.2 p → νK+ decay mode
This is one of the favored SUSY decays, and is special because of the presence of a strangemeson in the final state. The conservation of strangeness leads to very different interactionsof the K+, K0 and K−, K0 with nucleons at low energies. K− have a large cross section forhyperon production, with the Σπ and Λπ channels always open. They feel, like pions, a strongnuclear potential, and therefore are strongly absorbed by nuclei. On the other hand, K+ interactrelatively weakly, therefore the fraction of positive kaons absorbed by nuclei is at the level of afew per cent.
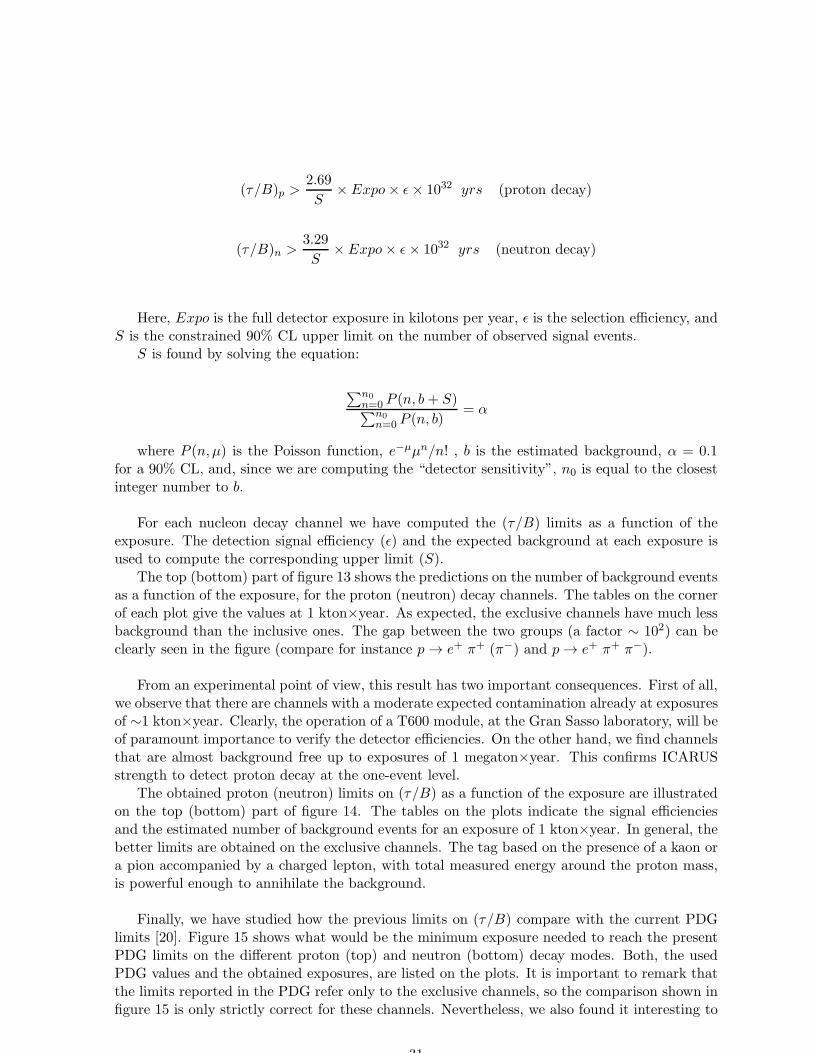
ICARUS profits from its very good particle identification capabilities to tag the kaon and itsdecay products. Applying the cuts listed in table 11, a very good efficiency of 97% is reachedfor a negligible background. One topological cut (ask for the presence of only one kaon in theevent) and one kinematic cut on the total energy are sufficient to obtain the quoted result.
Cuts p → νK+ νe CC νe CC νµ CC νµ CC ν NC ν NC
One Kaon 97% 0.310 0.059 0.921 0.214 0.370 0.104
No π0 97% 0.161 0.030 0.462 0.107 0.197 0.051
No electrons 97% 0 0 0.455 0.107 0.197 0.051
No muons 97% 0 0 0 0 0.197 0.051
No charged pions 97% 0 0 0 0 0.109 0.022
Etotal < 0.8 GeV 97% 0 0 0 0 0 0
Table 11: Cuts for the p → νK+ channel. Survival fraction of signal (first column) and backgroundevents through event selections applied in succession (normalized to an exposure of 1 kton × year).
5.3 Sensitivity to nucleon decay
To calculate partial lifetime lower limits, (τ/B), we use the following formulae:
30
(τ/B)p >2.69
S× Expo× ǫ× 1032 yrs (proton decay)
(τ/B)n >3.29
S× Expo× ǫ× 1032 yrs (neutron decay)
Here, Expo is the full detector exposure in kilotons per year, ǫ is the selection efficiency, andS is the constrained 90% CL upper limit on the number of observed signal events.
S is found by solving the equation:
∑n0n=0 P (n, b+ S)∑n0
n=0 P (n, b)= α
where P (n, µ) is the Poisson function, e−µµn/n! , b is the estimated background, α = 0.1for a 90% CL, and, since we are computing the “detector sensitivity”, n0 is equal to the closestinteger number to b.
For each nucleon decay channel we have computed the (τ/B) limits as a function of theexposure. The detection signal efficiency (ǫ) and the expected background at each exposure isused to compute the corresponding upper limit (S).
The top (bottom) part of figure 13 shows the predictions on the number of background eventsas a function of the exposure, for the proton (neutron) decay channels. The tables on the cornerof each plot give the values at 1 kton×year. As expected, the exclusive channels have much lessbackground than the inclusive ones. The gap between the two groups (a factor ∼ 102) can beclearly seen in the figure (compare for instance p → e+ π+ (π−) and p → e+ π+ π−).
From an experimental point of view, this result has two important consequences. First of all,we observe that there are channels with a moderate expected contamination already at exposuresof ∼1 kton×year. Clearly, the operation of a T600 module, at the Gran Sasso laboratory, will beof paramount importance to verify the detector efficiencies. On the other hand, we find channelsthat are almost background free up to exposures of 1 megaton×year. This confirms ICARUSstrength to detect proton decay at the one-event level.
The obtained proton (neutron) limits on (τ/B) as a function of the exposure are illustratedon the top (bottom) part of figure 14. The tables on the plots indicate the signal efficienciesand the estimated number of background events for an exposure of 1 kton×year. In general, thebetter limits are obtained on the exclusive channels. The tag based on the presence of a kaon ora pion accompanied by a charged lepton, with total measured energy around the proton mass,is powerful enough to annihilate the background.
Finally, we have studied how the previous limits on (τ/B) compare with the current PDGlimits [20]. Figure 15 shows what would be the minimum exposure needed to reach the presentPDG limits on the different proton (top) and neutron (bottom) decay modes. Both, the usedPDG values and the obtained exposures, are listed on the plots. It is important to remark thatthe limits reported in the PDG refer only to the exclusive channels, so the comparison shown infigure 15 is only strictly correct for these channels. Nevertheless, we also found it interesting to
31
show, how the ICARUS inclusive limits compare with the PDG exclusive ones. The modest massprovided by a T600 module is clearly insufficient to improve existing limits for a vast majorityof the reported decay channels. However, we observe that two years of running will suffice toincrease the sensitivity in channels like, for example, p → π+ ν and n → e− K+.
The Super-Kamiokande collaboration has recently presented preliminary results coming from70 kt× year detector exposure [35]. In particular for the p→e+π0 mode the proton lifetime hasbeen found to be higher than 4.4×1033 years, while for p→ νK+ the new bound is 1.9×1033 yearsat 90% c.l. The current results show that while a background-free search can be extended formodes like p→e+π0 and p→ µ+π0, non-zero background is already expected for the p → νK+
search. In a water Cherenkov detector the kaon is below threshold for light emission and low-background signatures can be obtained only at the expense of low efficiency cuts. In particulardetection of low-energy gamma rays (6.3 MeV) is crucial to background reduction for this mode.This requirement calls for a large photo-cathode coverage in a future detector based on thistechnique. Thus only a third of the planned half a megaton UNO detector [36] is going tobe dedicated for p→ νK+ search. Consequently a potential for sensitivity improvement forthe most favored SUSY modes is limited with water Cherenkov technique and a liquid argondetector may provide a unique opportunity to either discover a nucleon decay signal or to ruleout a large class of theoretical models [38, 39].
6 Supernova neutrinos
6.1 Characteristics of a supernova collapse
For the first few seconds, the gravitational core collapse of a single star emits an intense burstof neutrinos whose luminosity rivals the total optical emissions of the observable universe. Thedetection of 20 νe events from SN1987A (12 in Kamiokande [40] and 8 in IMB [41]) mosteconomically constrained the properties of neutrino mixing, neutrino masses, neutrino magneticmoment, neutrino decay, etc. Those 20 events, however, could not identify any of the dynamicalcharacteristics of the supernova mechanism that are stamped up in its neutrino signatures:shock break-out, convection, accretion, explosion, core cooling, and transparency. Nor was itpossible that any νµ or ντ be detected, despite the prediction that these neutrino species andtheir anti-particles carry away the bulk of the neutron star binding energy.
Since then, new experiments have started taking data. For example, the collection ofhundreds to thousands of events is anticipated by the dedicated LVD experiment. Suchinformation will resolve the many outstanding questions in supernova modeling, as well asmeasure or constrain the properties of all three generations of neutrinos more tightly thancan now be done in a laboratory. The contribution of ICARUS can provide pieces of the puzzlenot duplicated by other experiments.
In order to examine the response of ICARUS to a supernova collapse in our Local Groupof galaxies, we employ here a generic but detailed model of neutrino emission that reflects thelatest calculations in Type II supernova theory. This baseline model of luminosities and spectrafor each of the neutrino species incorporates various generic features of the dynamics of stellarcollapse, but is not tied to any particular model. This patchwork model has been presented inRef. [42] specifically for the purpose of studying and comparing the response and sensitivity ofvarious neutrino detectors. In Figure 16 we reproduce from Ref. [42] the structure of the νe, νe,and “νµ” luminosity curves for the first second of emission, where “νµ” denotes the muon and tauneutrinos and their antiparticles collectively; Figure 17 shows the same for the first 50 seconds.The total energy radiated by this model is 3 × 1053erg, which corresponds to 2.8 × 1057 νe,
32

ICARUS Proton Decay: Expected Backgrounds
1
10
10 2
10 3
1 10 102
103
p → e+ π0
p → e+ (π0)
p → K+ ν–
p → µ- π+ K+
p → e+ π+ π-
p → e+ π+ (π-)
p → e+ (π+ π-)
p → π+ ν–
p → µ+ π0
p → µ+ (π0)
Exposure (kTons × year)
Exp
ecte
d B
ackg
roun
ds (
# ev
ents
)
Channel # Bkg. events
( 1kTon × year )
p → e+ π0 0.002p → e+ (π0) 2.099
p → K+ ν–
0.001p → µ- π+ K+ 0.001p → e+ π+ π- 0.025
p → e+ π+ (π-) 1.257p → e+ (π+ π-) 5.945
p → π+ ν–
0.552p → µ+ π0 0.015
p → µ+ (π0) 5.829
ICARUS Neutron Decay: Expected Backgrounds
1
10
10 2
10 3
1 10 102
103
n → e- K+
n → e+ π-
n → e+ (π-)
n → µ- π+
n → µ- (π+)
n → π0 ν–
Exposure (kTons × year)
Exp
ecte
d B
ackg
roun
ds (
# ev
ents
)
Channel # Bkg. events
( 1kTon × year )
n → e- K+ 0.002n → e+ π- 0.007
n → e+ (π-) 4.999n → µ- π+ 0.019
n → µ- (π+) 4.034n → π0 ν
–0.505
Figure 13: Estimated number of background events as a function of the exposure for the different proton(top) and neutron (bottom) decay channels. The tables in the plots give the precise values for an exposureof 1 kton×year.
33
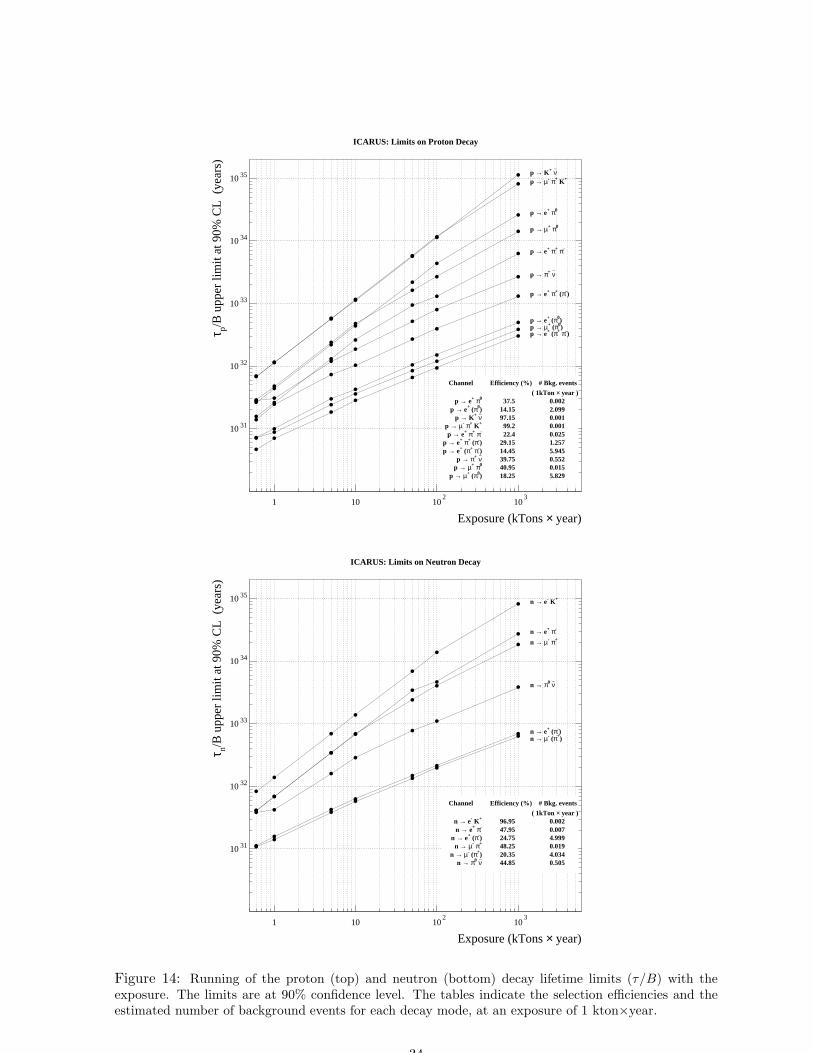
ICARUS: Limits on Proton Decay
10 31
10 32
10 33
10 34
10 35
1 10 102
103
p → e+ π0
p → e+ (π0)
p → K+ ν–
p → µ- π+ K+
p → e+ π+ π-
p → e+ π+ (π-)
p → e+ (π+ π-)
p → π+ ν–
p → µ+ π0
p → µ+ (π0)
Exposure (kTons × year)
τ p/B
upp
er li
mit
at 9
0% C
L (
year
s)
Channel Efficiency (%) # Bkg. events
( 1kTon × year )p → e+ π0 37.5 0.002
p → e+ (π0) 14.15 2.099p → K+ ν
–97.15 0.001
p → µ- π+ K+ 99.2 0.001p → e+ π+ π- 22.4 0.025
p → e+ π+ (π-) 29.15 1.257p → e+ (π+ π-) 14.45 5.945
p → π+ ν–
39.75 0.552p → µ+ π0 40.95 0.015
p → µ+ (π0) 18.25 5.829
ICARUS: Limits on Neutron Decay
10 31
10 32
10 33
10 34
10 35
1 10 102
103
n → e- K+
n → e+ π-
n → e+ (π-)
n → µ- π+
n → µ- (π+)
n → π0 ν–
Exposure (kTons × year)
τ n/B
upp
er li
mit
at 9
0% C
L (
year
s)
Channel Efficiency (%) # Bkg. events
( 1kTon × year )n → e- K+ 96.95 0.002n → e+ π- 47.95 0.007
n → e+ (π-) 24.75 4.999n → µ- π+ 48.25 0.019
n → µ- (π+) 20.35 4.034n → π0 ν
–44.85 0.505
Figure 14: Running of the proton (top) and neutron (bottom) decay lifetime limits (τ/B) with theexposure. The limits are at 90% confidence level. The tables indicate the selection efficiencies and theestimated number of background events for each decay mode, at an exposure of 1 kton×year.
34
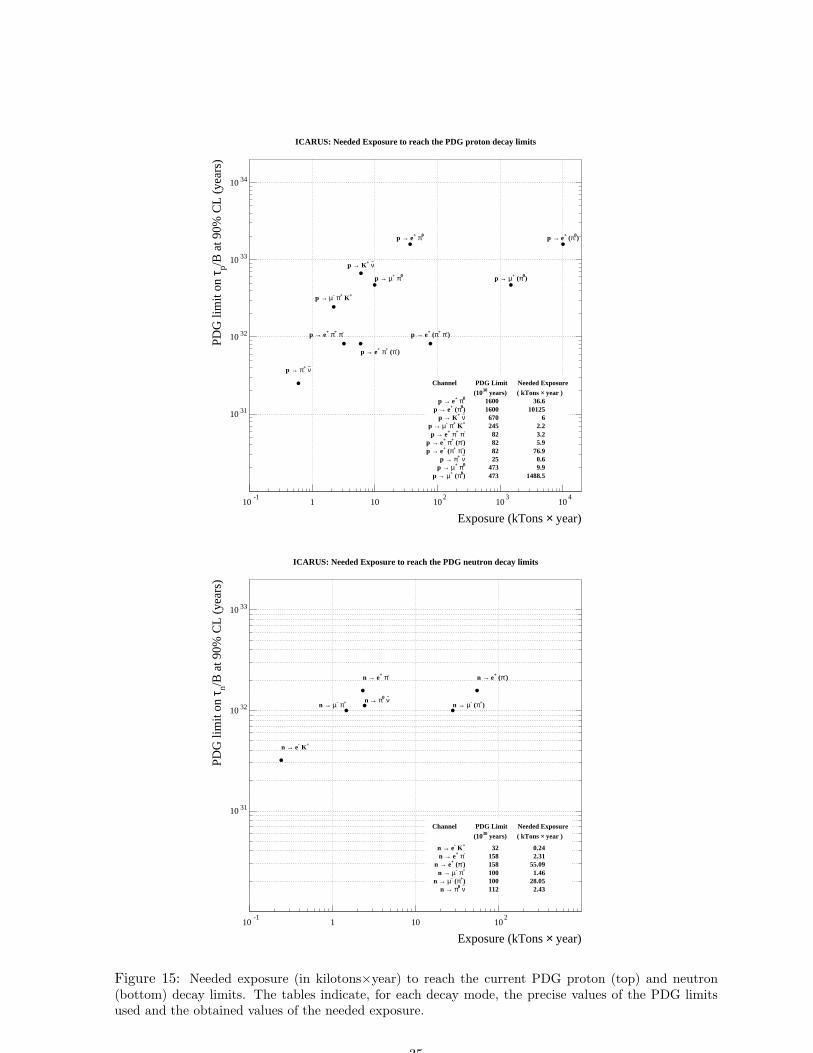
ICARUS: Needed Exposure to reach the PDG proton decay limits
10 31
10 32
10 33
10 34
10-1
1 10 102
103
104
p → e+ π0 p → e+ (π0)
p → K+ ν–
p → µ- π+ K+
p → e+ π+ π-
p → e+ π+ (π-)
p → e+ (π+ π-)
p → π+ ν–
p → µ+ π0 p → µ+ (π0)
Exposure (kTons × year)
PDG
lim
it on
τp/
B a
t 90%
CL
(ye
ars)
Channel PDG Limit Needed Exposure
(1030 years) ( kTons × year )p → e+ π0 1600 36.6
p → e+ (π0) 1600 10125p → K+ ν
–670 6
p → µ- π+ K+ 245 2.2p → e+ π+ π- 82 3.2
p → e+ π+ (π-) 82 5.9p → e+ (π+ π-) 82 76.9
p → π+ ν–
25 0.6p → µ+ π0 473 9.9
p → µ+ (π0) 473 1488.5
ICARUS: Needed Exposure to reach the PDG neutron decay limits
10 31
10 32
10 33
10-1
1 10 102
n → e- K+
n → e+ π- n → e+ (π-)
n → µ- π+ n → µ- (π+)n → π0 ν
–
Exposure (kTons × year)
PDG
lim
it on
τn/
B a
t 90%
CL
(ye
ars)
Channel PDG Limit Needed Exposure
(1030 years) ( kTons × year )
n → e- K+ 32 0.24n → e+ π- 158 2.31
n → e+ (π-) 158 55.09n → µ- π+ 100 1.46
n → µ- (π+) 100 28.05n → π0 ν
–112 2.43
Figure 15: Needed exposure (in kilotons×year) to reach the current PDG proton (top) and neutron(bottom) decay limits. The tables indicate, for each decay mode, the precise values of the PDG limitsused and the obtained values of the needed exposure.
35
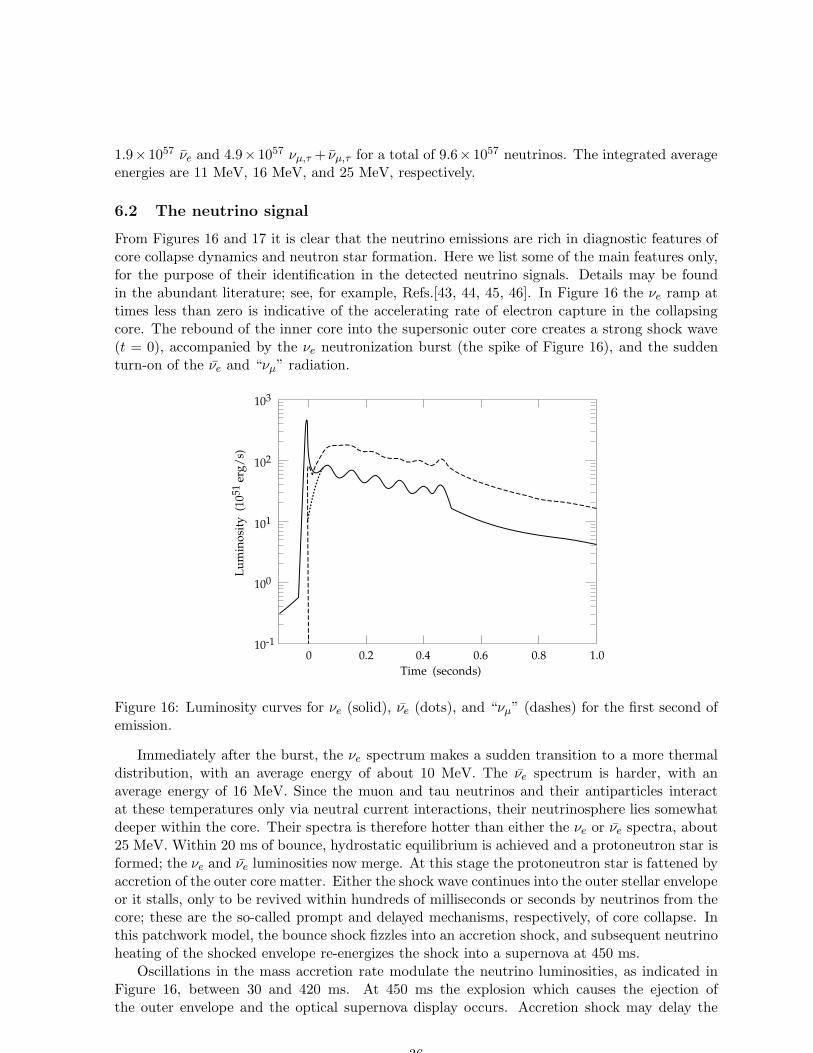
1.9×1057 νe and 4.9×1057 νµ,τ + νµ,τ for a total of 9.6×1057 neutrinos. The integrated averageenergies are 11 MeV, 16 MeV, and 25 MeV, respectively.
6.2 The neutrino signal
From Figures 16 and 17 it is clear that the neutrino emissions are rich in diagnostic features ofcore collapse dynamics and neutron star formation. Here we list some of the main features only,for the purpose of their identification in the detected neutrino signals. Details may be foundin the abundant literature; see, for example, Refs.[43, 44, 45, 46]. In Figure 16 the νe ramp attimes less than zero is indicative of the accelerating rate of electron capture in the collapsingcore. The rebound of the inner core into the supersonic outer core creates a strong shock wave(t = 0), accompanied by the νe neutronization burst (the spike of Figure 16), and the suddenturn-on of the νe and “νµ” radiation.
103
102
101
100
10-1
0 0.2 0.4 0.6 0.8 1.0
Time (seconds)
Lu
min
osi
ty (
1051
erg
/s)
Figure 16: Luminosity curves for νe (solid), νe (dots), and “νµ” (dashes) for the first second ofemission.
Immediately after the burst, the νe spectrum makes a sudden transition to a more thermaldistribution, with an average energy of about 10 MeV. The νe spectrum is harder, with anaverage energy of 16 MeV. Since the muon and tau neutrinos and their antiparticles interactat these temperatures only via neutral current interactions, their neutrinosphere lies somewhatdeeper within the core. Their spectra is therefore hotter than either the νe or νe spectra, about25 MeV. Within 20 ms of bounce, hydrostatic equilibrium is achieved and a protoneutron star isformed; the νe and νe luminosities now merge. At this stage the protoneutron star is fattened byaccretion of the outer core matter. Either the shock wave continues into the outer stellar envelopeor it stalls, only to be revived within hundreds of milliseconds or seconds by neutrinos from thecore; these are the so-called prompt and delayed mechanisms, respectively, of core collapse. Inthis patchwork model, the bounce shock fizzles into an accretion shock, and subsequent neutrinoheating of the shocked envelope re-energizes the shock into a supernova at 450 ms.
Oscillations in the mass accretion rate modulate the neutrino luminosities, as indicated inFigure 16, between 30 and 420 ms. At 450 ms the explosion which causes the ejection ofthe outer envelope and the optical supernova display occurs. Accretion shock may delay the
36
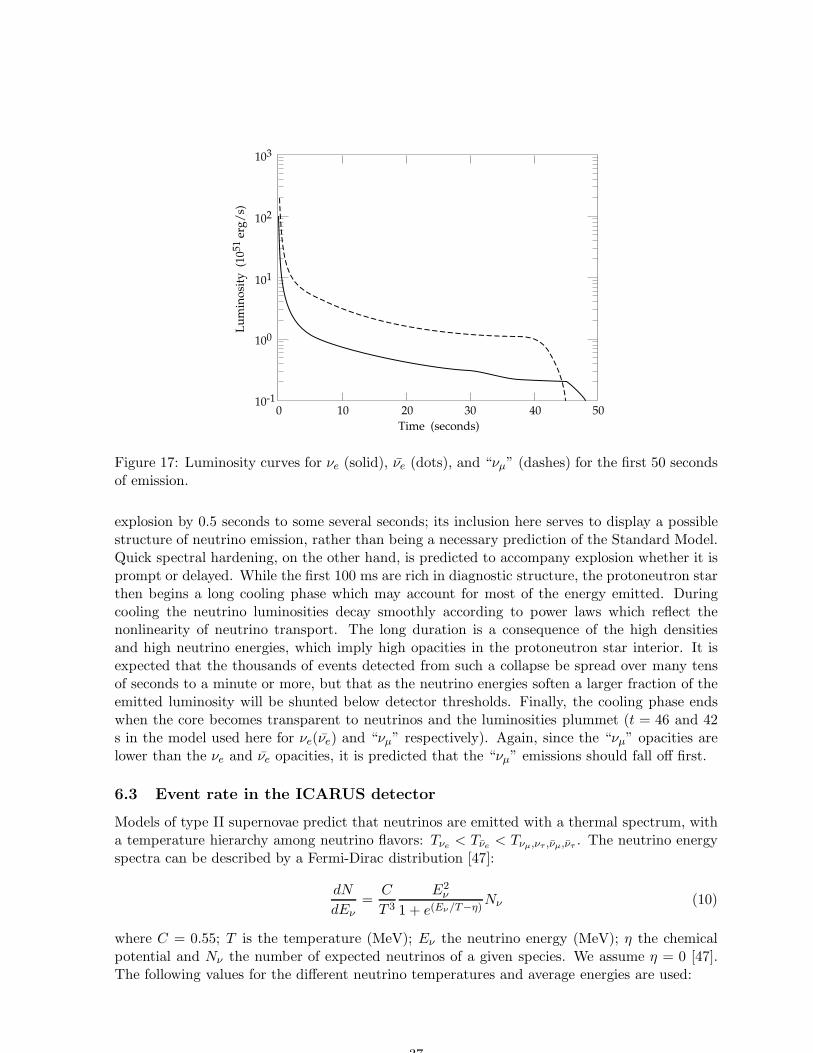
0 10
Time (seconds)
20 30 40 50
103
102
101
100
10-1
Lu
min
osi
ty (
1051
erg
/s)
Figure 17: Luminosity curves for νe (solid), νe (dots), and “νµ” (dashes) for the first 50 secondsof emission.
explosion by 0.5 seconds to some several seconds; its inclusion here serves to display a possiblestructure of neutrino emission, rather than being a necessary prediction of the Standard Model.Quick spectral hardening, on the other hand, is predicted to accompany explosion whether it isprompt or delayed. While the first 100 ms are rich in diagnostic structure, the protoneutron starthen begins a long cooling phase which may account for most of the energy emitted. Duringcooling the neutrino luminosities decay smoothly according to power laws which reflect thenonlinearity of neutrino transport. The long duration is a consequence of the high densitiesand high neutrino energies, which imply high opacities in the protoneutron star interior. It isexpected that the thousands of events detected from such a collapse be spread over many tensof seconds to a minute or more, but that as the neutrino energies soften a larger fraction of theemitted luminosity will be shunted below detector thresholds. Finally, the cooling phase endswhen the core becomes transparent to neutrinos and the luminosities plummet (t = 46 and 42s in the model used here for νe(νe) and “νµ” respectively). Again, since the “νµ” opacities arelower than the νe and νe opacities, it is predicted that the “νµ” emissions should fall off first.
6.3 Event rate in the ICARUS detector
Models of type II supernovae predict that neutrinos are emitted with a thermal spectrum, witha temperature hierarchy among neutrino flavors: Tνe < Tνe < Tνµ,ντ ,νµ,ντ . The neutrino energyspectra can be described by a Fermi-Dirac distribution [47]:
dN
dEν=
C
T 3
E2ν
1 + e(Eν/T−η)Nν (10)
where C = 0.55; T is the temperature (MeV); Eν the neutrino energy (MeV); η the chemicalpotential and Nν the number of expected neutrinos of a given species. We assume η = 0 [47].The following values for the different neutrino temperatures and average energies are used:
37
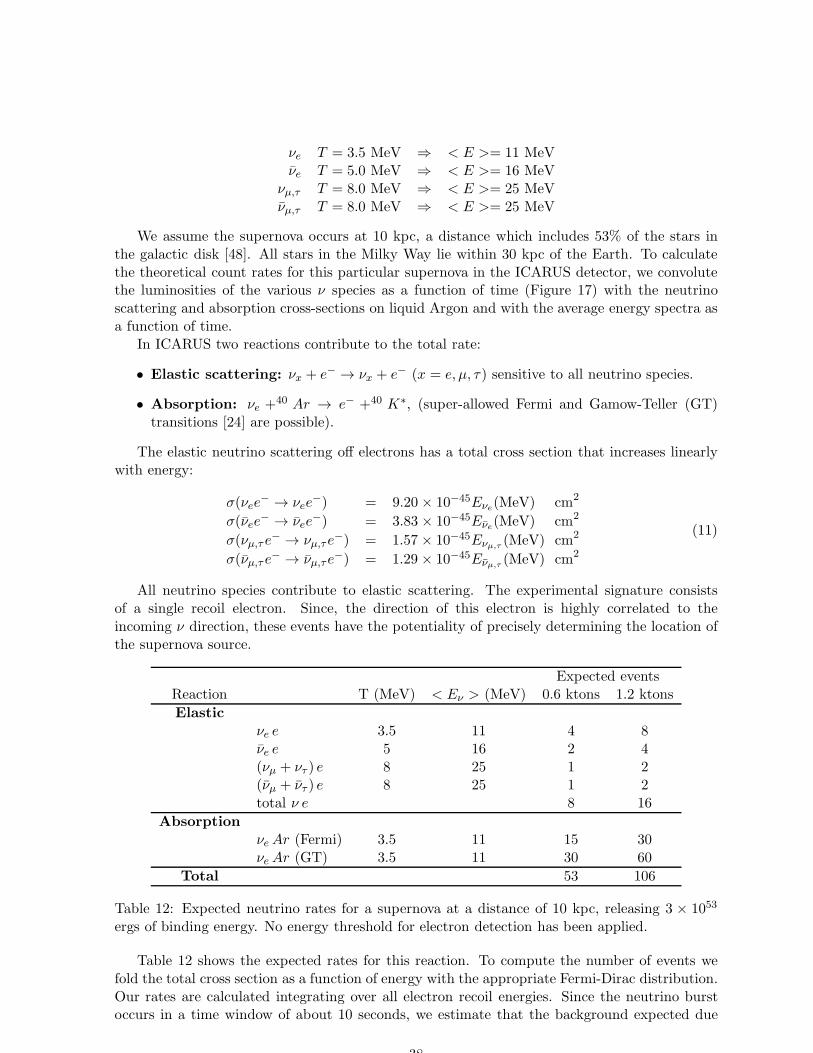
νe T = 3.5 MeV ⇒ < E >= 11 MeVνe T = 5.0 MeV ⇒ < E >= 16 MeV
νµ,τ T = 8.0 MeV ⇒ < E >= 25 MeVνµ,τ T = 8.0 MeV ⇒ < E >= 25 MeV
We assume the supernova occurs at 10 kpc, a distance which includes 53% of the stars inthe galactic disk [48]. All stars in the Milky Way lie within 30 kpc of the Earth. To calculatethe theoretical count rates for this particular supernova in the ICARUS detector, we convolutethe luminosities of the various ν species as a function of time (Figure 17) with the neutrinoscattering and absorption cross-sections on liquid Argon and with the average energy spectra asa function of time.
In ICARUS two reactions contribute to the total rate:
• Elastic scattering: νx + e− → νx + e− (x = e, µ, τ) sensitive to all neutrino species.
• Absorption: νe +40 Ar → e− +40 K∗, (super-allowed Fermi and Gamow-Teller (GT)
transitions [24] are possible).
The elastic neutrino scattering off electrons has a total cross section that increases linearlywith energy:
σ(νee− → νee
−) = 9.20 × 10−45Eνe(MeV) cm2
σ(νee− → νee
−) = 3.83 × 10−45Eνe(MeV) cm2
σ(νµ,τ e− → νµ,τe
−) = 1.57 × 10−45Eνµ,τ (MeV) cm2
σ(νµ,τ e− → νµ,τe
−) = 1.29 × 10−45Eνµ,τ (MeV) cm2
(11)
All neutrino species contribute to elastic scattering. The experimental signature consistsof a single recoil electron. Since, the direction of this electron is highly correlated to theincoming ν direction, these events have the potentiality of precisely determining the location ofthe supernova source.
Expected eventsReaction T (MeV) < Eν > (MeV) 0.6 ktons 1.2 ktons
Elasticνe e 3.5 11 4 8νe e 5 16 2 4(νµ + ντ ) e 8 25 1 2(νµ + ντ ) e 8 25 1 2total ν e 8 16
AbsorptionνeAr (Fermi) 3.5 11 15 30νeAr (GT) 3.5 11 30 60
Total 53 106
Table 12: Expected neutrino rates for a supernova at a distance of 10 kpc, releasing 3 × 1053
ergs of binding energy. No energy threshold for electron detection has been applied.
Table 12 shows the expected rates for this reaction. To compute the number of events wefold the total cross section as a function of energy with the appropriate Fermi-Dirac distribution.Our rates are calculated integrating over all electron recoil energies. Since the neutrino burstoccurs in a time window of about 10 seconds, we estimate that the background expected due
38
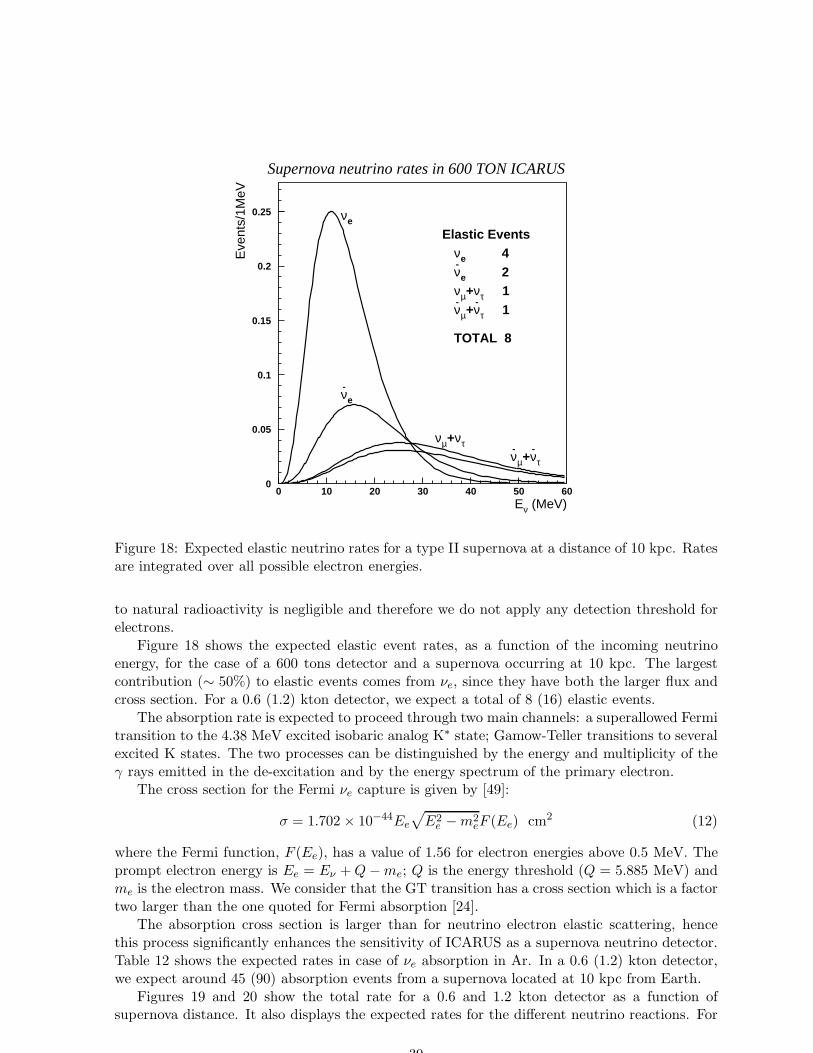
Supernova neutrino rates in 600 TON ICARUS
0
0.05
0.1
0.15
0.2
0.25
0 10 20 30 40 50 60
νe
ν-e
νµ+ντν-µ+ν
-τ
Elastic Eventsνe 4ν-e 2
νµ+ντ 1ν-µ+ν
-τ 1
TOTAL 8
Eν (MeV)
Eve
nts/
1MeV
Figure 18: Expected elastic neutrino rates for a type II supernova at a distance of 10 kpc. Ratesare integrated over all possible electron energies.
to natural radioactivity is negligible and therefore we do not apply any detection threshold forelectrons.
Figure 18 shows the expected elastic event rates, as a function of the incoming neutrinoenergy, for the case of a 600 tons detector and a supernova occurring at 10 kpc. The largestcontribution (∼ 50%) to elastic events comes from νe, since they have both the larger flux andcross section. For a 0.6 (1.2) kton detector, we expect a total of 8 (16) elastic events.
The absorption rate is expected to proceed through two main channels: a superallowed Fermitransition to the 4.38 MeV excited isobaric analog K∗ state; Gamow-Teller transitions to severalexcited K states. The two processes can be distinguished by the energy and multiplicity of theγ rays emitted in the de-excitation and by the energy spectrum of the primary electron.
The cross section for the Fermi νe capture is given by [49]:
σ = 1.702 × 10−44Ee
√
E2e −m2
eF (Ee) cm2 (12)
where the Fermi function, F (Ee), has a value of 1.56 for electron energies above 0.5 MeV. Theprompt electron energy is Ee = Eν +Q−me; Q is the energy threshold (Q = 5.885 MeV) andme is the electron mass. We consider that the GT transition has a cross section which is a factortwo larger than the one quoted for Fermi absorption [24].
The absorption cross section is larger than for neutrino electron elastic scattering, hencethis process significantly enhances the sensitivity of ICARUS as a supernova neutrino detector.Table 12 shows the expected rates in case of νe absorption in Ar. In a 0.6 (1.2) kton detector,we expect around 45 (90) absorption events from a supernova located at 10 kpc from Earth.
Figures 19 and 20 show the total rate for a 0.6 and 1.2 kton detector as a function ofsupernova distance. It also displays the expected rates for the different neutrino reactions. For
39
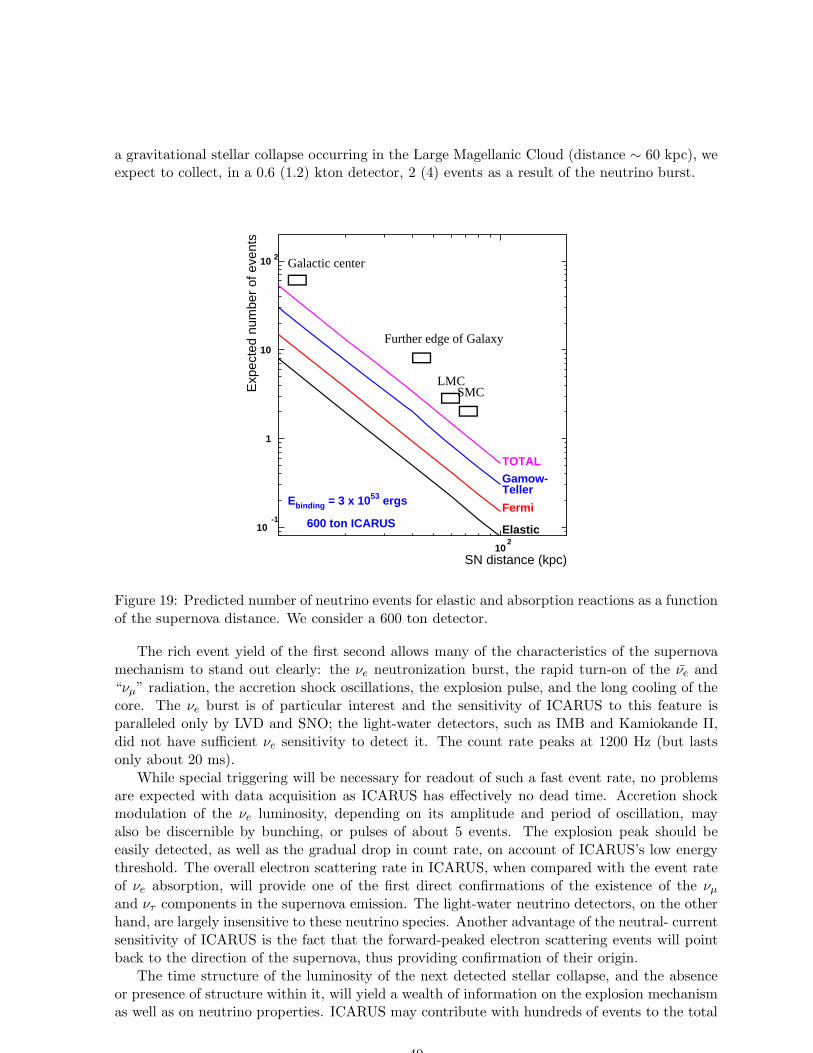
a gravitational stellar collapse occurring in the Large Magellanic Cloud (distance ∼ 60 kpc), weexpect to collect, in a 0.6 (1.2) kton detector, 2 (4) events as a result of the neutrino burst.
10-1
1
10
10 2
102
Elastic
Fermi
Gamow-Teller
TOTAL
Ebinding = 3 x 1053 ergs
600 ton ICARUS
Galactic center
Further edge of Galaxy
LMCSMC
→
→→→
SN distance (kpc)
Exp
ecte
d nu
mbe
r of
eve
nts
Figure 19: Predicted number of neutrino events for elastic and absorption reactions as a functionof the supernova distance. We consider a 600 ton detector.
The rich event yield of the first second allows many of the characteristics of the supernovamechanism to stand out clearly: the νe neutronization burst, the rapid turn-on of the νe and“νµ” radiation, the accretion shock oscillations, the explosion pulse, and the long cooling of thecore. The νe burst is of particular interest and the sensitivity of ICARUS to this feature isparalleled only by LVD and SNO; the light-water detectors, such as IMB and Kamiokande II,did not have sufficient νe sensitivity to detect it. The count rate peaks at 1200 Hz (but lastsonly about 20 ms).
While special triggering will be necessary for readout of such a fast event rate, no problemsare expected with data acquisition as ICARUS has effectively no dead time. Accretion shockmodulation of the νe luminosity, depending on its amplitude and period of oscillation, mayalso be discernible by bunching, or pulses of about 5 events. The explosion peak should beeasily detected, as well as the gradual drop in count rate, on account of ICARUS’s low energythreshold. The overall electron scattering rate in ICARUS, when compared with the event rateof νe absorption, will provide one of the first direct confirmations of the existence of the νµand ντ components in the supernova emission. The light-water neutrino detectors, on the otherhand, are largely insensitive to these neutrino species. Another advantage of the neutral- currentsensitivity of ICARUS is the fact that the forward-peaked electron scattering events will pointback to the direction of the supernova, thus providing confirmation of their origin.
The time structure of the luminosity of the next detected stellar collapse, and the absenceor presence of structure within it, will yield a wealth of information on the explosion mechanismas well as on neutrino properties. ICARUS may contribute with hundreds of events to the total
40
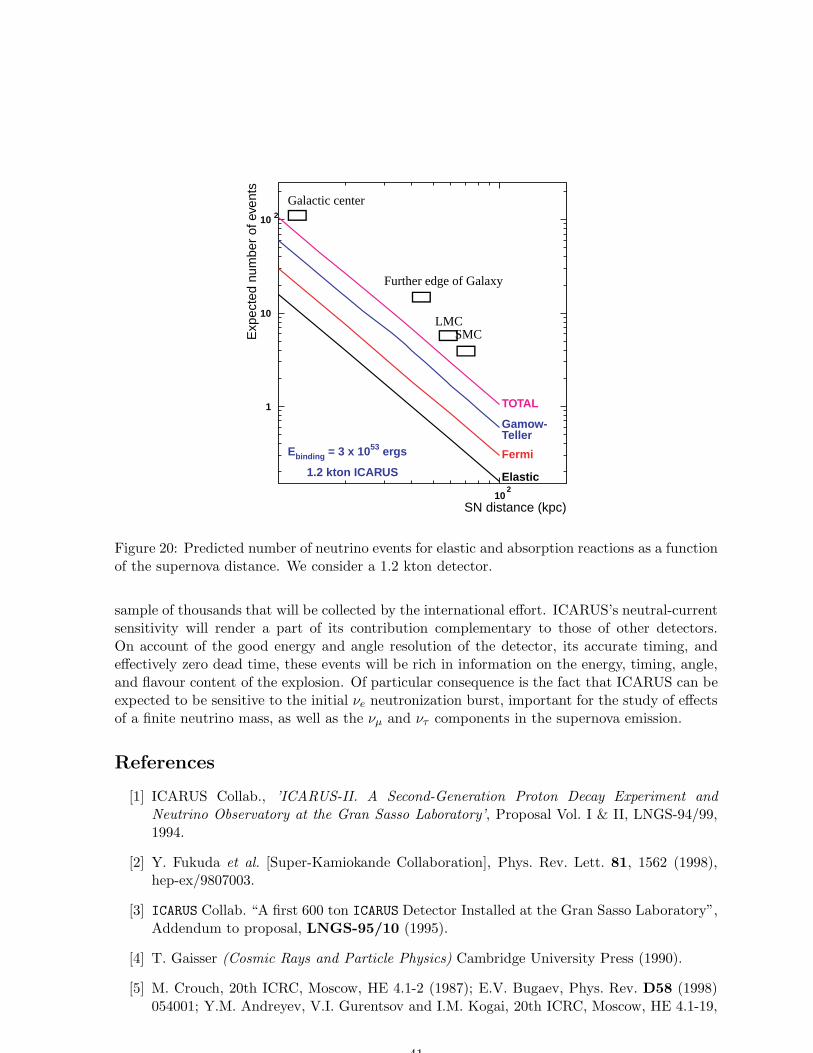
1
10
10 2
102
Elastic
Fermi
Gamow-Teller
TOTAL
Ebinding = 3 x 1053 ergs
1.2 kton ICARUS
Galactic center
Further edge of Galaxy
LMCSMC
→
→ →
→
SN distance (kpc)
Exp
ecte
d nu
mbe
r of
eve
nts
Figure 20: Predicted number of neutrino events for elastic and absorption reactions as a functionof the supernova distance. We consider a 1.2 kton detector.
sample of thousands that will be collected by the international effort. ICARUS’s neutral-currentsensitivity will render a part of its contribution complementary to those of other detectors.On account of the good energy and angle resolution of the detector, its accurate timing, andeffectively zero dead time, these events will be rich in information on the energy, timing, angle,and flavour content of the explosion. Of particular consequence is the fact that ICARUS can beexpected to be sensitive to the initial νe neutronization burst, important for the study of effectsof a finite neutrino mass, as well as the νµ and ντ components in the supernova emission.
References
[1] ICARUS Collab., ’ICARUS-II. A Second-Generation Proton Decay Experiment andNeutrino Observatory at the Gran Sasso Laboratory’, Proposal Vol. I & II, LNGS-94/99,1994.
[2] Y. Fukuda et al. [Super-Kamiokande Collaboration], Phys. Rev. Lett. 81, 1562 (1998),hep-ex/9807003.
[3] ICARUS Collab. “A first 600 ton ICARUS Detector Installed at the Gran Sasso Laboratory”,Addendum to proposal, LNGS-95/10 (1995).
[4] T. Gaisser (Cosmic Rays and Particle Physics) Cambridge University Press (1990).
[5] M. Crouch, 20th ICRC, Moscow, HE 4.1-2 (1987); E.V. Bugaev, Phys. Rev. D58 (1998)054001; Y.M. Andreyev, V.I. Gurentsov and I.M. Kogai, 20th ICRC, Moscow, HE 4.1-19,
41
(1987); P.H. Barrett et al., Rev. Mod. Phys. 24 (1952) 133; L. M.Bollinger, Phys. Rev. 79(1950) 207A; M. Aglietta et al., Nucl. Phys. B (Proc. Suppl.) 14B (1990) 193.
[6] M. Aglietta et al, Phys. Rev. D58 (1998) 092005.
[7] M. Ambrosio et al., Phys. Rev. D52 (1995) 3793.
[8] A. Ferrari, T. Rancati and P.R. Sala, Proc. 3rd workshop on “Simulating AcceleratorRadiation Environment”, SARE-3, KEK-Tsukuba, May 7–9 1997, H. Hirayama ed., KEKreport Proceedings 97-5, p. 165 (1997)
[9] A. Fasso et al., “Electron-photon transport in FLUKA: status” and “FLUKA: Status andPerspectives for Hadronic Applications”, in Proc. of MC2000 (Lisbon, Oct 2000). See alsohttp://www.cern.ch/fluka.
[10] Yu. D. Kotov and V. M. Logunov, 11th ICRC, Budapest, MU-50 (1969).
[11] F. Arneodo et al., ICARUS Collab., ICARUS-TM/2000-06, submitted to Elsevier Preprint.
[12] M. Ambrosio et al., Phys. Rev. D56 (1997) 1407; M. Ambrosio et al., Phys. Rev. D56(1997) 1418;
[13] F. Arneodo et al. [ICARUS and NOE Collab.], “ICANOE: Imaging and calorimetricneutrino oscillation experiment,” LNGS-P21/99, INFN/AE-99-17, CERN/SPSC 99-25,SPSC/P314; see also A. Rubbia [ICARUS collaboration], hep-ex/0001052. Updatedinformation can be found at http://pcnometh4.cern.ch.
[14] S. Fukuda et al. [Super-Kamiokande Collaboration], Phys. Rev. Lett. 85, 3999 (2000)[hep-ex/0009001].
[15] M. Ambrosio et al., Phys. Lett. B434 (1998) 451.
[16] Y. Fukuda et al., Phys. Rev. Lett. 82 (1999) 2644.
[17] P. Lipari and M. Lusignoli, Phys. Rev. D 58 (1998) 073005 [hep-ph/9803440].
[18] ICARUS Collaboration, The ICARUS 50 l LAr TPC in the CERN ν Beam, Proceedings of36th Workshop On New Detectors, Erice, Italy / 1-7 Nov. 1997 , World Scientific (1999)3.
[19] F. Arneodo et al. (ICARUS Collab.) Nucl.Instrum. Meth. A449 (2000) 42.
[20] C.Caso et al., “Review of particle physics”, Eur. Phys. J. C 15 (2000).
[21] V. Agrawal et al., Phys. Rev. D53 (1996) 1314.
[22] M. Ambrosio et al., Astroparticle Physics 9(1998) 105.
[23] ICARUS Collaboration, Study of solar neutrinos with the 600 t liquid argon ICARUSdetector, Nucl. Instr. and Methods A455 (2000) 376.
[24] W. E. Ormand, P. M. Pizzochero, P. F. Bortignon and R. A. Broglia, Phys. Lett. B 345(1995) 343 [nucl-th/9405007].
[25] J. N. Bahcall, S. Basu and M. H. Pinsonneault, Phys. Lett. B 433 (1998) 1 [astro-ph/9805135].
42
[26] J.N. Bahcall, Neutrino Astrophysics, Cambridge University Press (1989).
[27] W. Trinder et al., Phys. Lett. B415 (1997) 211.
[28] W. Liu et al., Z. Phys. A359 (1997) 1.
[29] ICARUS Collaboration, On atmospheric 39Ar and 42Ar abundance, Nucl. Instr. andMethods A356 (1994) 256.
[30] V.D. Ashitkov et al., Nucl.Phys. Proc.Suppl. 70 (1999) 233.
[31] A. Somigliana, Misure di contaminazioni radioattive bassissime in materiali perschermature con particolare riferimento a piombo antico e moderno, Degree thesis,Universita degli Studi di Milano (1989/90) in Italian.
[32] F. Arneodo et al., Neutron background measurements in the ICARUS area at theunderground Gran Sasso Laboratory, Il Nuovo Cimento A8 (1999) 819.
[33] A. Esposito, Misure di radioattivita nei campioni di materiale da utilizzare per struttureinterne del LNGS dell’INFN, LNF Report LNF-86/60 (1986) in italian.
[34] J.N. Bahcall et al., Phys. Lett. B 477 (2000) 401, J.N. Bahcall et al., Phys. Rev. D 62(2000) 9304.
[35] M. Shiozawa (Super-Kamiokande Collaboration), ICHEP 2000 - XXXth Int. Conf. onHEP, Osaka, Japan, July 27-Aug 2, 2000; Proceed. submitted to World ScientificK.S. Ganezer (Super-Kamiokande Collaboration), DPF 2000 - Meeting of the Divisionof Particles and Fields of the APS, August 9-12, 2000 Columbus, Ohio, USA; Proceed.submitted to Int. Journal of Modern Physics A
[36] C. K. Jung, Feasibility of a next generation underground water Cherenkov detector: UNO,NNN99 at Stony Brook, hep-ex/0005046.
[37] A.Bueno et al., Nucleon Decay studies in a large Liquid Argon detector, NNN99 at StonyBrook, AIP Conference Proceedings Vol.533 (2000).
[38] K.S. Babu, J.C. Pati and F. Wilczek, Nucl. Phys. B566 (2000) 33 and hep-ph/9812538.
[39] R. Dermisek, A. Mafi and S. Raby, hep-ph/0007213.
[40] K. Hirata et al., Phys. Rev. D38 (1988) 448; Phys. Rev. Lett. 58 (1987) 1490.
[41] R. Bionta et al., Phys. Rev. Lett. 58 (1987) 1494.
[42] A. Burrows, D. Klein, and R. Gandhi, Phys. Rev. D45 (1992) 3361.
[43] A. Burrows, Ann. Rev. Nucl. Part. Sci. 40 (1990) 181.
[44] R. Mayle, J. R. Wilson, and D. N. Schramm, Ap. J. 318 (1987) 288.
[45] S. Woosley, J. Wilson, and R. Mayle, Ap. J. 302 (1986) 19.
[46] H. A. Bethe, Rev. Mod. Phys. 62 (1990) 801.
[47] K. Langanke, P. Vogel and E. Kolbe, Phys. Rev. Lett. 76 (1996) 2629 [nucl-th/9511032].
[48] J. N. Bahcall and R. M. Soneira, Ap. J. Supp. 44 (1980) 73.
[49] R. S. Raghavan, Phys. Rev. D 34 (1986) 2088.
43