lo5: simulation of transit signal priority strategies for brt operations
TRANSCRIPT

Anna Matías Alemán
January 15, 2013
Simulation of Transit Signal Priority
Strategies for BRT Operations
Outline
Motivation
Background
Objectives
Methodology
Evaluation Approach
Boston Case Study
Next Steps
3

Why TSP?
A technique to provide priority to public transport services
through traffic lights
A means to improve performance of public transportation
systems at the operational level
A strategy aiming at reducing travel times and improving bus
service reliability
When properly designed for BRTs it can complement their
other features such as exclusive bus lanes, off-vehicle fare
collection, all-door boarding, etc., and potentially contribute
to improved system performance
4
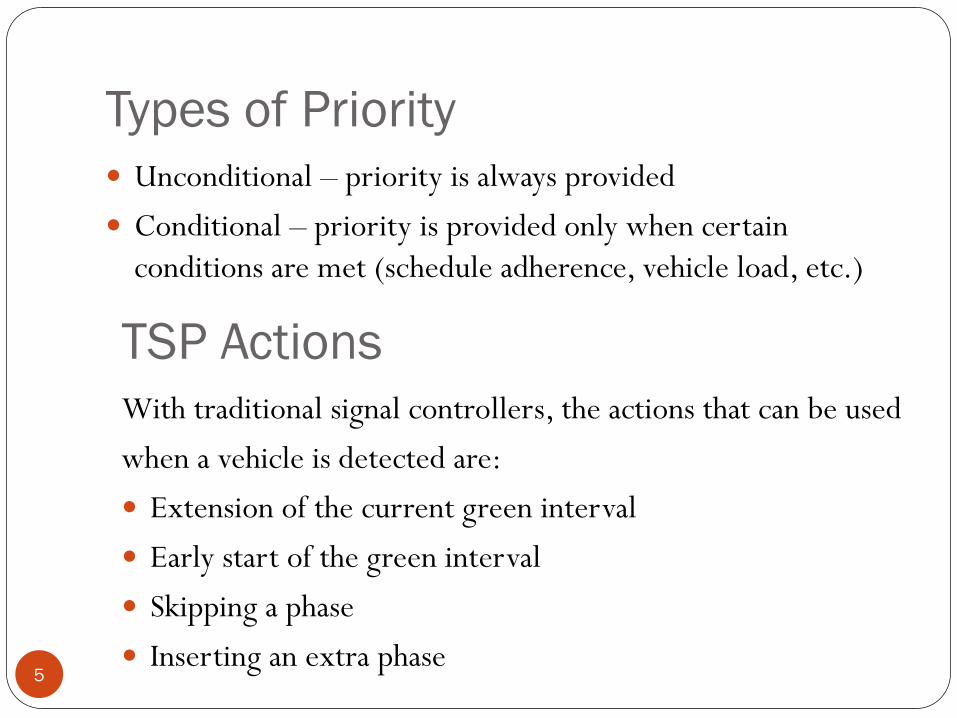
Types of Priority
Unconditional – priority is always provided
Conditional – priority is provided only when certain
conditions are met (schedule adherence, vehicle load, etc.)
5
TSP Actions
With traditional signal controllers, the actions that can be used
when a vehicle is detected are:
Extension of the current green interval
Early start of the green interval
Skipping a phase
Inserting an extra phase
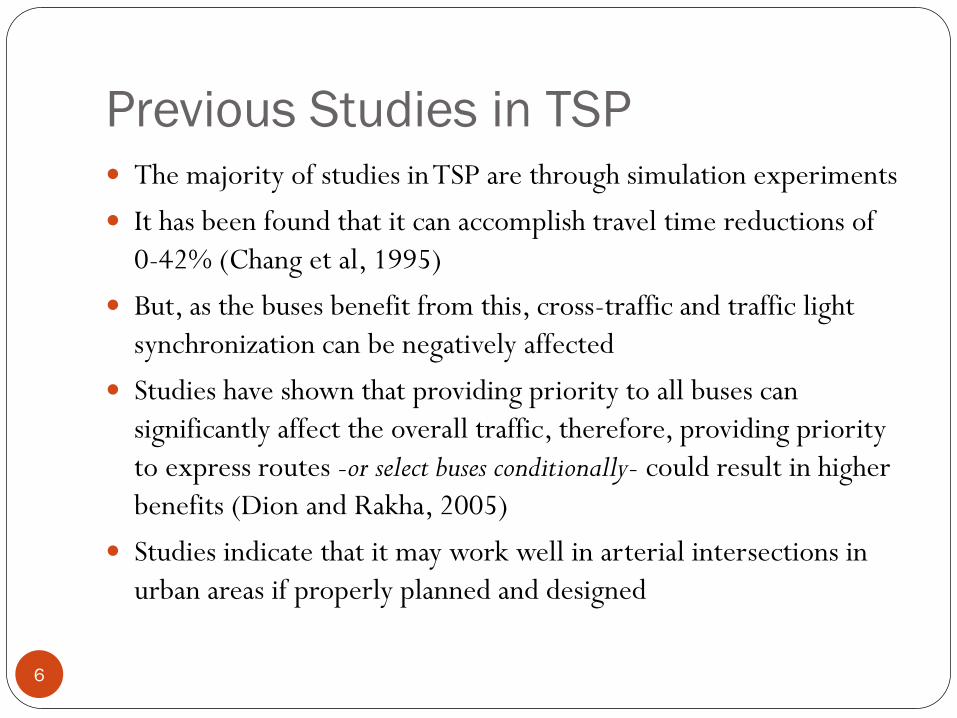
Previous Studies in TSP The majority of studies in TSP are through simulation experiments
It has been found that it can accomplish travel time reductions of
0-42% (Chang et al, 1995)
But, as the buses benefit from this, cross-traffic and traffic light
synchronization can be negatively affected
Studies have shown that providing priority to all buses can
significantly affect the overall traffic, therefore, providing priority
to express routes -or select buses conditionally- could result in higher
benefits (Dion and Rakha, 2005)
Studies indicate that it may work well in arterial intersections in
urban areas if properly planned and designed
6
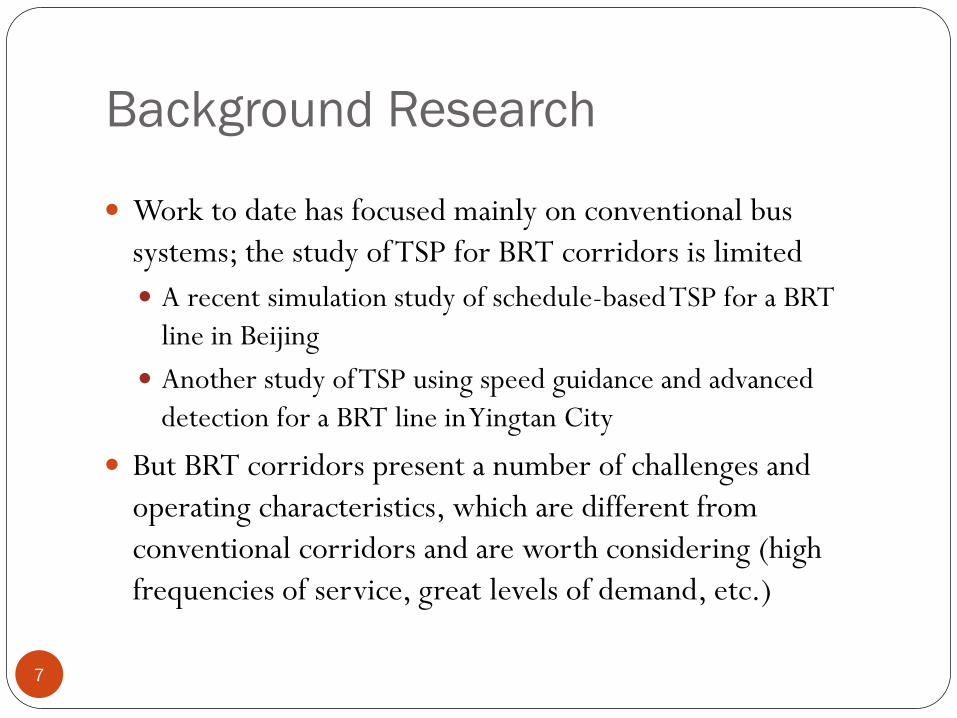
Background Research
Work to date has focused mainly on conventional bus
systems; the study of TSP for BRT corridors is limited
A recent simulation study of schedule-based TSP for a BRT
line in Beijing
Another study of TSP using speed guidance and advanced
detection for a BRT line in Yingtan City
But BRT corridors present a number of challenges and
operating characteristics, which are different from
conventional corridors and are worth considering (high
frequencies of service, great levels of demand, etc.)
7

Research Objectives
The objective of the proposed research activity is to study how TSP can benefit BRT systems and can best be incorporated into their operations both in the U.S. and in developing countries. The main tasks include the following:
review literature and experience with TSP with both conventional and BRT systems, and document the main conclusions and lessons learned;
determine how TSP can best be implemented in BRT corridors with different characteristics in terms of demand levels, frequency of service, etc.;
evaluate TSP strategies that consider different conditions (schedule, headways, loading, etc.) in a BRT context; and
develop guidelines for implementation of signal priority strategies in BRT corridors, based on their characteristics. 8
Data Sources
9
Automated Passenger Counting Records (APC)
Automatic Vehicle Location Records (AVL)
Signal Timing Plans
Traffic count studies/O-D Matrix from Planning Model
Vehicle Specifications
Data Preparation
10
Traffic Data
Road network – coded or from a geographic file
Traffic Flows – turning movements inputted from traffic counts
or O/D matrix generated with Cube Analyst
Signal Timing Plans
Data Preparation
11
Transit Data
Transit Routes delineated with defined route physical stop
Average Departing headways and standard deviation calculated
from AVL Records
Average Arrival rates and Alighting Percentages per stop
calculated from APC Records
Vehicle type defined with capacity and dwell time parameters
Average Initial load calculated for the segment of the route to
be simulated, if necessary

Dwell Time Model
12
Passengers are not really modeled in the simulation, but rather their effect on dwell times, which will be a function of the number of passenger boardings and alightings, using parameters that account for crowding and boarding and alighting times per passenger.
Dwell time model:
T=ɣ + αA + βB if there is no crowding
T=ɣ + αA + βB’’ + (β +CF) B’’’ if there is crowding
These parameters are defined by vehicle class to define the dead time component and the service time component of the dwell time. Therefore, the vehicle class will have a defined seating capacity, total capacity, dead time, alighting time, boarding time, and crowding factor.
Actions Evaluated
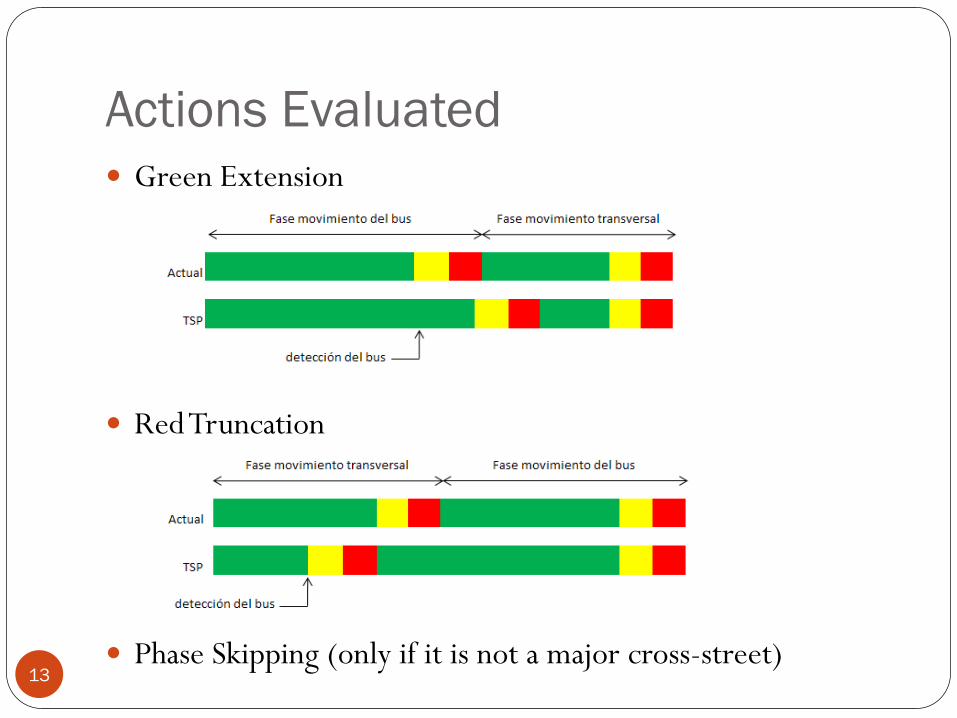
Green Extension
Red Truncation
Phase Skipping (only if it is not a major cross-street) 13

Conditional Priorities Evaluated
14
Schedule deviation (a bus must be running late) on all intersections -Headway limitation: 2 cycles & Lateness Treshold: 1min
Combined schedule deviation and minimum passenger load on all intersections (a bus must be late and have the requisite number of passengers to be eligible for priority)
Schedule deviation on all intersections with the minimum passenger load constraint only on critical intersections (cross-streets with high volumes or high-frequency bus routes)
Schedule deviation on all intersections except on critical intersections (no priority will be provided in cross-streets with high volumes or high-frequency bus routes)
*Will be evaluated in current conditions and other projections
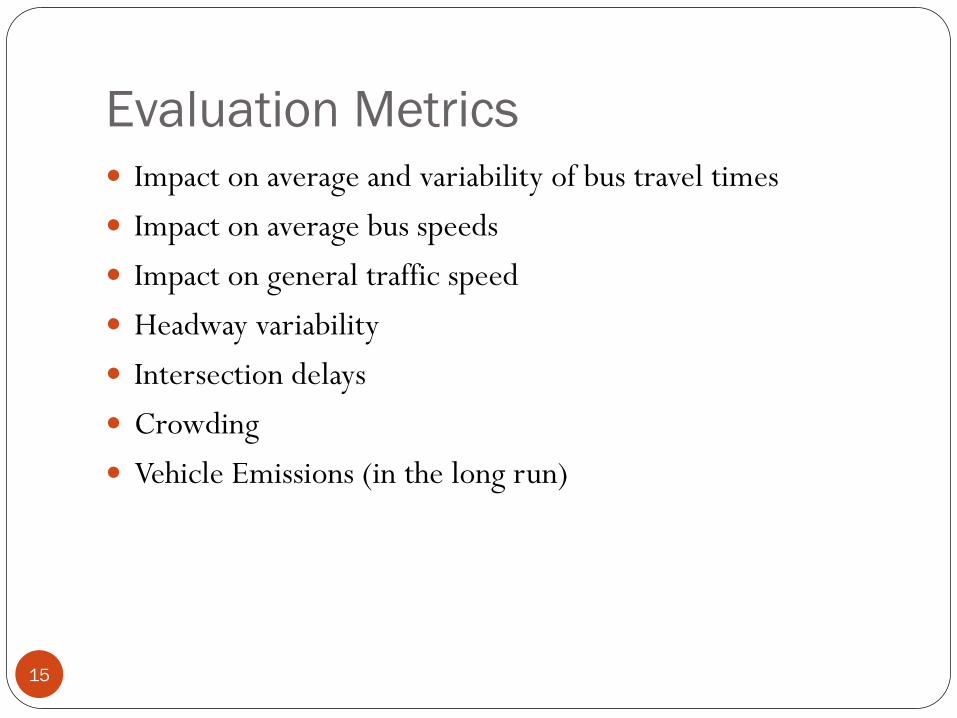
Evaluation Metrics
Impact on average and variability of bus travel times
Impact on average bus speeds
Impact on general traffic speed
Headway variability
Intersection delays
Crowding
Vehicle Emissions (in the long run)
15
The cities
16
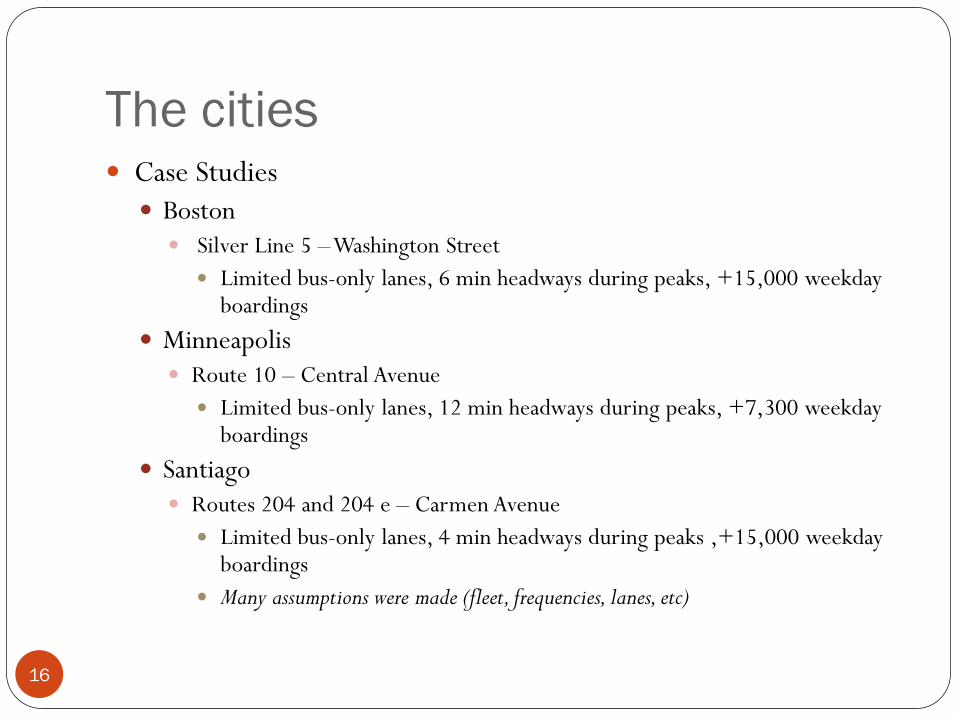
Case Studies
Boston Silver Line 5 – Washington Street
Limited bus-only lanes, 6 min headways during peaks, +15,000 weekday boardings
Minneapolis Route 10 – Central Avenue
Limited bus-only lanes, 12 min headways during peaks, +7,300 weekday boardings
Santiago Routes 204 and 204 e – Carmen Avenue
Limited bus-only lanes, 4 min headways during peaks ,+15,000 weekday boardings
Many assumptions were made (fleet, frequencies, lanes, etc)

Boston
• Silver Line 5 - Washington Street
17
Boston Case Study – SL5
18
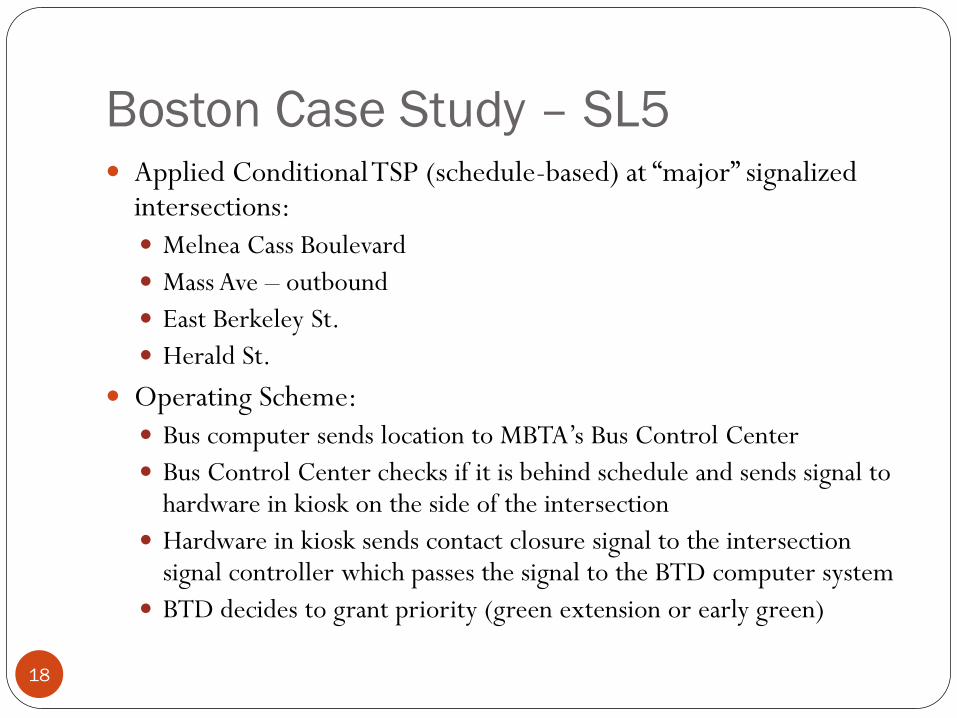
Applied Conditional TSP (schedule-based) at “major” signalized intersections:
Melnea Cass Boulevard
Mass Ave – outbound
East Berkeley St.
Herald St.
Operating Scheme:
Bus computer sends location to MBTA’s Bus Control Center
Bus Control Center checks if it is behind schedule and sends signal to hardware in kiosk on the side of the intersection
Hardware in kiosk sends contact closure signal to the intersection signal controller which passes the signal to the BTD computer system
BTD decides to grant priority (green extension or early green)
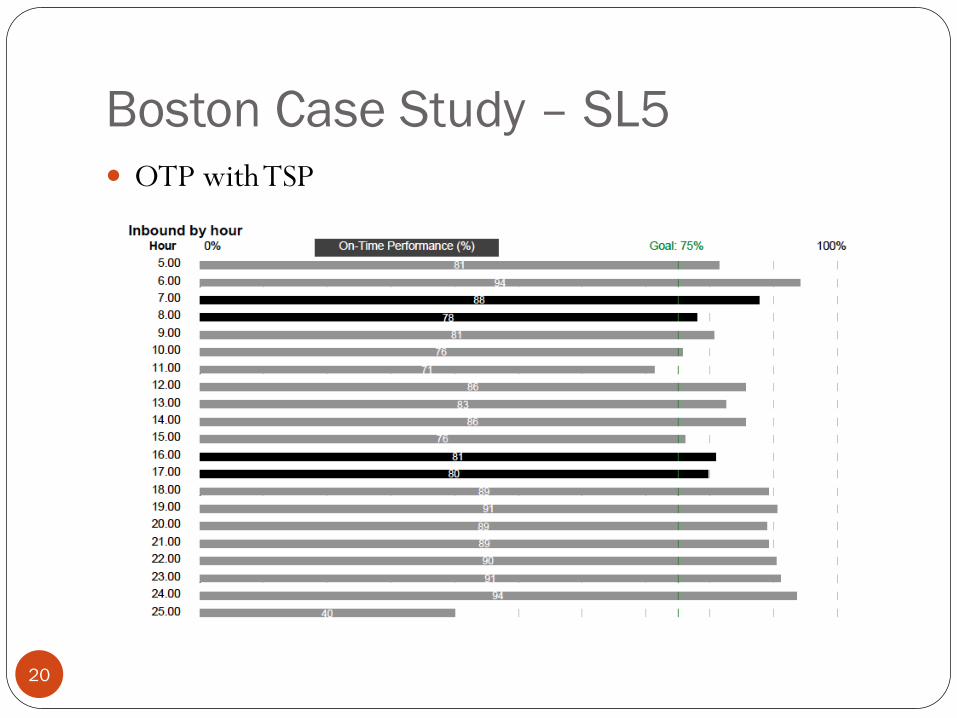
Boston Case Study – SL5
19
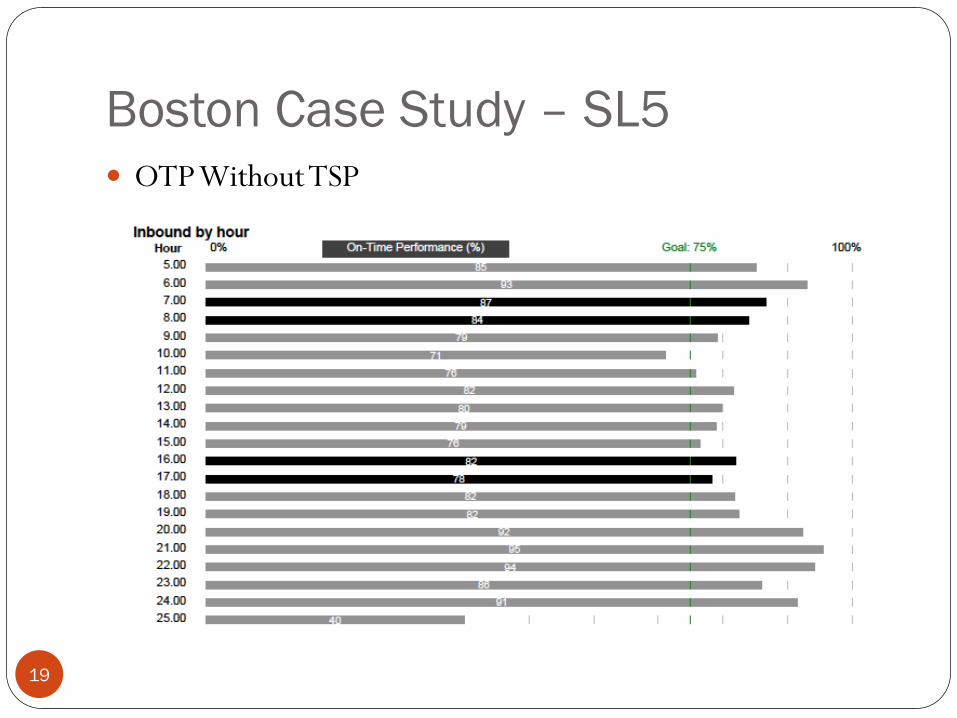
OTP Without TSP
Boston Case Study – SL5
20
OTP with TSP

Next Steps
21
Finish gathering then inputs for the corridors
Evaluate the effects of the different strategies on each
corridor
Project the scenarios to higher levels of demand and
frequency (and visualize the effects of having more than one
request per cycle)
Generate conclusions depending on corridor characteristics

Thank you!
Questions? Suggestions?