load pattern and the deployment of renewables in taiwan within the times framework
TRANSCRIPT
Load pattern and the deployment of renewables in Taiwan
within the TIMES frameworkPei-Ling Wen, Ching-Wei Kuo, Tzu-Yar Liu, Ming-Lung Hung
Abu Dhabi, June 1, 2015ETSAP workshop

Copyright 2015 ITRI 工業技術研究院
Outline
1. Introduction
2. Methodology
3. Scenario Assumptions
4. Scenario Results
5. Conclusions
2
Copyright 2015 ITRI 工業技術研究院
Introduction (1)
3
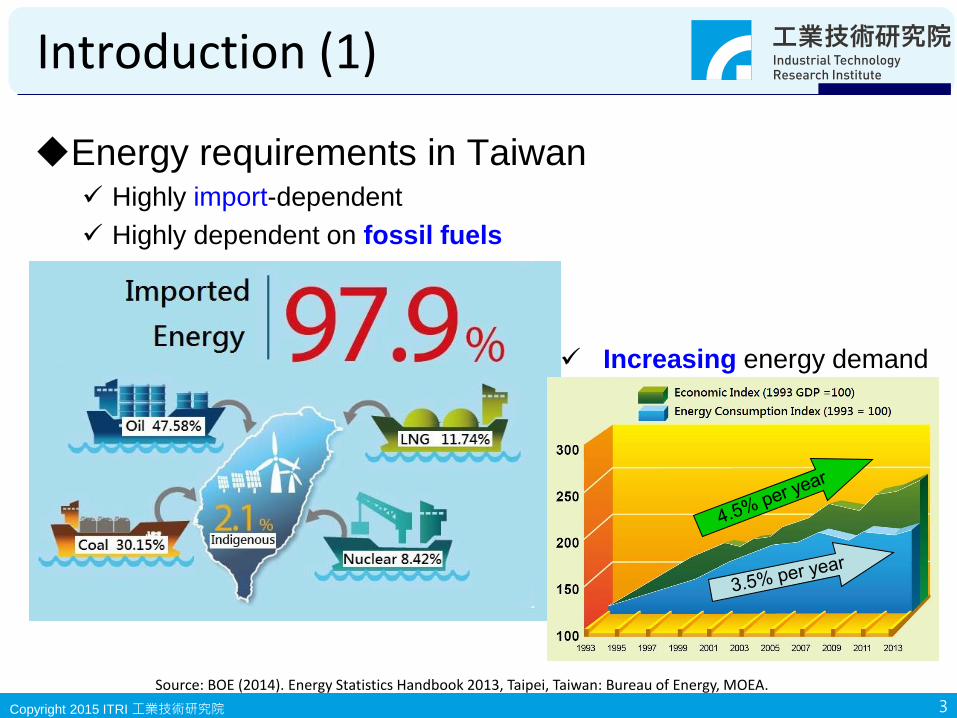
Source: BOE (2014). Energy Statistics Handbook 2013, Taipei, Taiwan: Bureau of Energy, MOEA.
Energy requirements in Taiwan Highly import-dependent
Highly dependent on fossil fuels
Increasing energy demand

Copyright 2015 ITRI 工業技術研究院
Introduction (2)Taiwan’s Sustainable Energy Policy aims to harmonize
environmental protection, economic growth and security of energy supply.
4
Source: BOE (2012), Framework of Taiwan's Sustainable Energy Policy. Taiwan: Bureau of Energy, MOEA.

Copyright 2015 ITRI 工業技術研究院
Introduction (3)Motivation
To improve the reliability of Taiwan TIMES Model• To simulate the pattern of electricity consumption behavior and ,• To investigate renewable energy power curve.
Within the fine time-resolution modeling, we simulated• The effect of RE intermittency on the deployment of RE.• The effect of energy conservation policy on the deployment of RE
5
Intermittence of wind power in TaiwanMonthly Hourly
Source: Taipower (2014)

Copyright 2015 ITRI 工業技術研究院
Methodology (1)
Taiwan TIMES Model (The Integrated MARKAL-EFOM System)
2 sectors:– Residential sector
– Service sector
Technology databases:– Consumer behavior: pattern of electricity consumption for cooling (with time-slice
setting)
– Power intermittency: pattern of renewable power generation (with time-slice setting)
– Equipment efficiency: conservation measures for air conditioning
Coverage:– Period of 2010-2030
Data Sources:– Ministry of Economic Affairs, Taiwan
– TaiPower (Taiwan’s state-own power enterprise)
– Taiwan Green Productivity Foundation (TGPF)
6

Copyright 2015 ITRI 工業技術研究院
Methodology (2)Features of Taiwan TIMES Model
The Industrial Technology Research Institute (ITRI) established the Taiwan MARKAL model since 1993 with funding support from the Bureau of Energy.
In order to enhance analysis capabilities, TIMES model was introduced by ITRI in 2007and the Taiwan TIMES model localized database has completed by 2010.
Currently the Taiwan TIMES model database is categorized by 3 major technologies: conversion technology (63 items), processing technology (75 items), and demand technology (256 items)
7

Copyright 2015 ITRI 工業技術研究院
Scenario Assumptions
8
Source:1 TaiSEND (2014), 2Council for Economic Planning and Development (2013), 3IEA (2013), 4EIA (2013).
Social-economic assumptions
Parameters of cooling technology• According to Energy Label (EL), Energy Efficiency Rating (ER), Minimum Energy
Performance Standards (MEPS), and Cooling Seasonal Performance Factor (CSPF) for air conditioning, proposed by Taiwanese government.
Driver Assumption
GDP1 Annual average GDP growth of 2.80% (2010-2030).
Industrial Structure1Share of primary sector of GDP is about 1.01%, secondary increases little and tertiary sector decreases to a share of 59.71% in 2030.
Population2 Annual growth rate is 0.04%.
Household2 Mean size of household decreases; annual growth rate of household is 1.23% from 2010 to 2030.
Energy Carrier Prices3,4
Based on Word Energy Outlook 2013 (IEA) and American Energy Outlook 2013 (EIA).

Copyright 2015 ITRI 工業技術研究院
Scenario Description (1)
9
Scenario Description
Without time slices
CASE1 Without energy efficiency policies of air conditioning for residential and service sectors
Introducing the renewable energy technological database
CASE2 With energy efficiency policies of air conditioning for residential and service sectors
Introducing the renewable energy technological database
With time slices (totally 24 time divisions)
CASE3 Without energy efficiency policies of air conditioning for residential and service sectors
Introducing the renewable energy technological database
CASE4 With energy efficiency policies of air conditioning for residential and service sectors
Introducing the renewable energy technological database
NOT considering energy
conservation measures
Considering energy
conservation measures
NOT considering the
renewable intermittencyCASE 1 CASE 2
Considering the
renewable intermittencyCASE 3 CASE 4

Copyright 2015 ITRI 工業技術研究院
Scenario Description(2)
Time-slice setting in the Taiwan TIMES Model
• The time-slice databases of electricity consumption and
renewable power generation has been established.
SM refers to June to September.
WD refers to Weekdays.
WE refers to Weekend.
D01 refers to 7:01 to 11:00.D02 refers to 11:01 to 13:00.D03 refers to 13:01 to 15:00.D04 refers to 15:01 to 18:00.D05 refers to 18:01 to 22:00.D06 refers to 22:01 to 7:00.

Copyright 2015 ITRI 工業技術研究院
Scenario Description(3)
Focus on cooling energy service demand (ESD)
– Example: Scheme for cooling ESD for residential sector
Vacancy rate
Growth rate of population
Housing stock Floor area
Cooling capacity
Operating hours
Energy service demand for
residential sector
Copyright 2015 ITRI 工業技術研究院
Scenario Results (1)
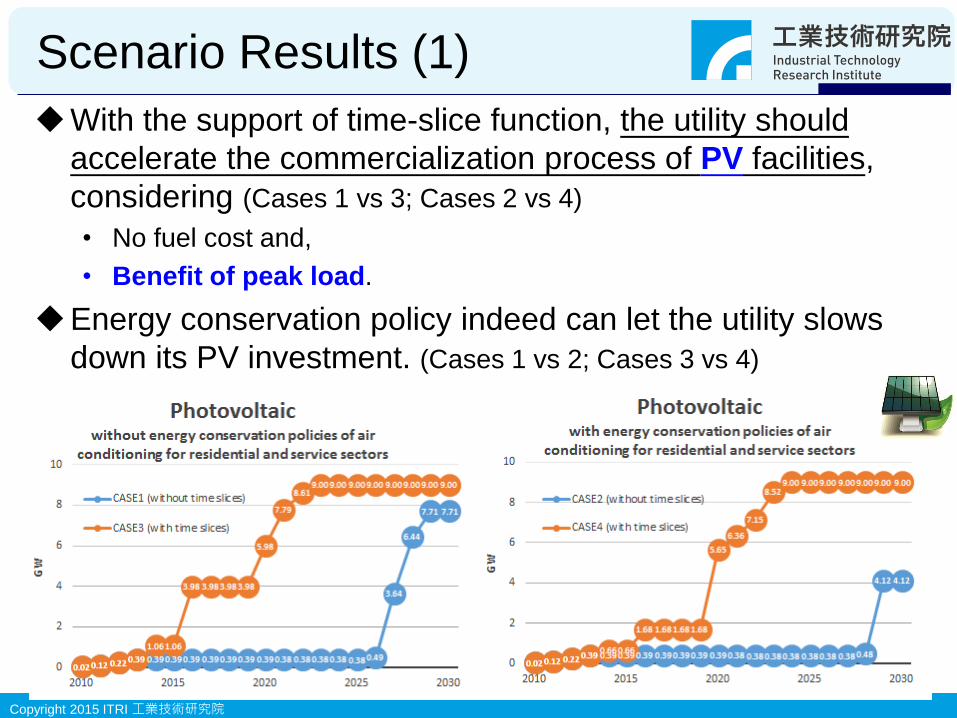
With the support of time-slice function, the utility should
accelerate the commercialization process of PV facilities,
considering (Cases 1 vs 3; Cases 2 vs 4)
• No fuel cost and,
• Benefit of peak load.
Energy conservation policy indeed can let the utility slows
down its PV investment. (Cases 1 vs 2; Cases 3 vs 4)

Copyright 2015 ITRI 工業技術研究院
Scenario Results (2)
With the support of time-slice function, the utility might
choose to postpone the investments of offshore wind
power systems. (Cases 1 vs 3; Cases 2 vs 4)
• The offshore projects suffer from high capital and O&M costs and
• Wind power generation can not match peak demand.
Energy conservation policy indeed can let the utility slows
down its investments of offshore wind farms. (Cases 1 vs 2;
Cases 3 vs 4)

Copyright 2015 ITRI 工業技術研究院
Conclusions
The contributions of this research are the pattern databases
of electricity consumption and renewable power generation
in Taiwan.
With this precious databases in the Taiwan TIMES Model,
the implications of our simulations show that
• Considering renewable intermittency would be helpful for a sound
national energy system planning.
• Energy conservation policy would delay the investments of
renewable energy.
Future research
To find or establish the off-shore power pattern.
• There are no offshore farms in Taiwan till now. This study simulated
the power pattern of offshore wind power according to the historical
record of onshore power.
14

Copyright 2015 ITRI 工業技術研究院
Pei-Ling Wen
Green Energy & Environment Research Laboratories
Industrial Technology Research Institute
E-mail: [email protected].
15