loan financing to higher education: experiences of bank financing
TRANSCRIPT
Loan Financing to Higher Education: Experiences of Bank Financing In A Less Developed Region
1
CMDR Monograph Series No. - 56
Loan Financing to Higher Education: Experiences ofBank Financing In A Less Developed Region
Prof. Sailabala Debi
CENTRE FOR MULTI-DISCIPLINARY DEVELOPMENT RESEARCHDr. B. R. Ambedkar nagar, Near Yalakkishetter Colony, Dharwad-580
004 (Karnataka, India)Phone : 0836-2460453, 2460472
Website : www.cmdr.ac.in
Study Completed Under
Canara Bank Endowment
2
CMDR Monograph Series No. - 56
CMDR Monograph Series No-56
All rights reserved. This publication may be used with proper citation and dueacknowledgement to the author(s) and the Centre For Multi-DisciplinaryDevelopment Research (CMDR), Dharwad
© Centre For Multi-Disciplinary Development Research (CMDR), Dharwad
First Published : December 2010
Loan Financing to Higher Education: Experiences of Bank Financing In A Less Developed Region
3
Loan Financing to Higher Education: Experiences of BankFinancing In A Less Developed Region
Prof. Sailabala Debi
Introduction
Education is widely accepted as a basic human right. The goal of achieving UEE isnow at the fore front of international policy agenda particularly in the context ofGlobalisation and MDG. Government of India and all the state governments havealso taken up this agenda seriously and striving hard to achieve the goal. But onecannot ignore the role of higher education in general and technical higher educationin particular to meet the competing challenges of Globalisation. Even within theeducation sector, relative priority assigned to higher education has been on the decline.It is to be realized that higher education institutions play an important role in settingthe academic standard for primary and secondary education. They are also responsiblefor not only providing the specialized human capital in order to corner the gains fromglobalisation, but also for training the manpower inside the country, provide policyadvice and so forth. Education is necessary for the development but higher educationis essential for sustainable development. The influence of higher education on socioeconomic indicators is shown below:
Corre lation between GER (54) HEA (34)
HDI 0.603 0.552
GDI 0.635 0.552
GEI 0.606 0.654
LEB 0.526 0.541
IMR -0.461 -0.461
TFR -0.567 -0.475
Poverty international -0.566 -0.299
Source: Tilak (2003)
Table :1: Higher Education and Development
AND
GER= gross enro lment ratio , HEA = h igher e
(% of people with higher educa ti on),
Figures in the bracket are the number of countries .
1. Former Professor and Director, CMDR.The author is thankful to Mr Atal B.Das and E.Mahesh for providing the statistical assistance . Theauthor is responsible for the opinions expressed here.
4
CMDR Monograph Series No. - 56
The correlation values show that all the indicators are significantly related to highereducation in terms of gross enrolment ratio and the higher education attainment. Thisshows the importance of higher education in influencing social and economicdevelopment.
The resources allocated to achieve the goals of education are found to be always fallshort of the need. Education is considered as an important tool to enable the studentswith the right professional qualifications to get employment before they complete aparticular course. These professional courses are expensive which many parents cannotafford. With expensive professional education becoming mandatory for entry into theassured job market, student loan seems to be the most effective way to help the studentsto go for expensive technical/professional higher education. Moreover, students arelikely to be in a position to repay these loans over a period of time with the highsalaries they would get immediately on qualification. Now student loans are one ofthe fastest-growing retail banking products. Almost all the public and private sectorbanks are offering student loans at attractive rates of interest to meritorious and needystudents for studying in India as well as abroad.
In respect of funding pattern in the education sector by the government, it is observedthat primary education is given the major share of resources by the government toachieve the goal of UEE within the stipulated time. The balance of resources earmarkedfor education is shared between secondary and higher education. In view of the recentdeclaration of Universalisation of Secondary Education, the share of resources nextto primary level goes to secondary education and the resources allocated to highereducation is the lowest within the education sector.
It is also observed that Government hardly spends less than one percent of the GNPon higher education. In 1950-51, 0.19 per cent of GNP was spent on higher educationand it declined to 0.4 percent of GNP in 2004-05. This is largely attributed to theintroduction of structural adjustment policies in the beginning of 1991 which includedmacroeconomic stabilization and adjustments where in a fiscal squeeze is experiencedin almost all the sectors and the social sector is the worst affected sector particularlyeducation and health. Since both primary and secondary education are prioritised inthe budgetary allocation, higher education is the worst affected ones by the shrinkingof budgetary allocation. On the one hand the demand for higher education has increasedand on the other hand the allocation of resources was cut significantly. Thus there is amismatch between the demand for higher education and the growth of governmentbudget particularly after 1990s. This is not only a case in India but also in many otherdeveloping countries. According to UNESCO, during 1990s, 70 (63%) out of 111countries reduced their share of public spending on higher education and 82 percentof them (34 out of 41) are only from developing countries. Sanyal and Martin, (2006)observed that some developing countries who has given the attention to the basic
Loan Financing to Higher Education: Experiences of Bank Financing In A Less Developed Region
5
education during past decade could focus on higher education, however, the majorityof them had reduced their share in higher education. As the number of gross enrollmentexpanded massively, the funding per student from the government had decreasedmassively as well. Thus the situation is happened in all over the world whereas itbeing worse in developing and transitional countries. Thus in the overall context of(a) growing budget constraints in education, and (b) growing evidence in favour ofpriority for lower levels of education as against higher education, several influentialreports and renowned academicians argued2 strongly for reducing public subsidiesfor higher education. For example the World Bank as a promoter of an integratedworld economy outlines its approach on financing higher education as: (i) to recoverthe public cost of higher education and reallocating government expenditure towardsprimary level with higher social returns; (ii) to promote education loans through thedevelopment of a credit market with selective scholarships, especially in highereducation; and (iii) to decentralise the management of public education and encouragethe expansion of non-government and community supported schools. Even theapproach paper to the 10th Five-year Plan and 10th Plan document states that, "sincebudget resources are limited, and such resources as are available, need to be allocatedto expanding primary education, it is important to recognise that the universities mustmake greater efforts to supplement resources from the government" (Government ofIndia, 2001, 2002-2007). The overall thrust is therefore, to recover the public cost ofhigher education through exploration of alternative sources of financing. Accordinglyattempts to find alternative methods of funding higher education have began in severaldeveloping countries. Among the various alternatives suggested, a system of financinghigher education through student loans has been advocated as an innovative policythat promises reductions in the financial burden of higher education on governmentfunds, and also improvements in equity in higher education, by reducing the regressiveeffects of public financing of higher education, and improving access to highereducation (Tilak 1992).
There are many studies on student loans but not many research based analytical studiesavailable in this area. In this background, the present study makes an attempt to examinethe student loans through Banks to finance the higher education.
The issues raised in this respect are: What is the socio - economic background of the students taken loan? What is the repayment pattern of the loans? Is it a burden on the student or on the parents? Is the return to education of the loan holders higher? Does it meet specific manpower needs? Does the government further reduce the expenditure on higher education/
subsidy as a result of loan financing to higher education?2 George Psacharopoulos (1973) showed that the return to primary education is more than that of higher educa-tion, arguing in favour of reducing the extent of subsidisation as one climbs up the education ladder.
6
CMDR Monograph Series No. - 56
The present study seeks to examine the above issues with the help of an empiricalstudy on bank loan financing for higher education in a less developed state i.e. Orissa.The paper is organized as follows: The first section presents the introduction describingthe importance of higher education and the need for alternate funding. In the secondsection, some of the works related to student loans are discussed. The third sectionpresents the study design including the methods of sampling and data analysis. Thegrowth of higher education in India and the financing of higher education in India arepresented in the fourth section. In the fifth section, loan financing to higher educationin India is discussed. The Sixth Section presents the growth of higher education inOrissa and the financing of higher education in Orissa. In the seventh section theresults of the empirical study conducted in Orissa on Bank loan finance for highereducation are presented. The last section presents the main findings and concludingobservations.
2. A brief Review of Literature
Recently, there are an increasing number of countries that have been implementedinnovative financing to overcome the deficit in public budget for higher education.There are two general types of financing that utilized by governments around theworld: direct financing and indirect financing. Direct financing is the transfer ofresource directly to higher education institutions to support operational cost, capitalinvestments, research, and specific purposes. On the other hand, indirect financing isthe government finance support to student or their families through tax benefits, loansubsidies for academic and living expenses, grants and scholarships. There is anothersource of financing for higher education i.e. Private sector financing. This again issub divided into private for profit and private not for profit financing. The financingby the households, Charitable trusts, Community etc. is included under not for profitcategory while the for profit financing category are corporate bodies, foreignuniversities etc.
Loan financing to education has emerged as one of the most popular alternativessources of financing and this scheme is currently in operation in more than 80 countriesaround the globe. In view of the rising costs of higher education (both tuition fee andmaintenance cost), a number of countries in the developing and developed worldhave established student loan programmes for providing the opportunity to the studentsof lower income class to go for higher education. This has become more popularsources of financing higher education mainly because (i) steep hike of cost of highereducation, (ii) fast increasing demand for higher education, (iii) entry of private sectoron a large scale.
Loan Financing to Higher Education: Experiences of Bank Financing In A Less Developed Region
7
More recently, commercial banking sector is an emerging source of student loan incountries, such as, India and China. No evidence exists on the nature and extent ofother sources of student loan in any country. It was observed in China that the schemedoes not act very equitably, since the chances of receiving a loan are lower for veryneedy students and differ amongst students of similar economic status depending onthe educational institution. Since banks shoulder most of the default risk, they tend todiscriminate against the more default-prone students - the poorer students and thoseenrolled in institutions of lower standing. It may also be noted that China fulfils bothbudgetary and social objectives of student loan scheme. In addition, since localgovernments provide the interest subsidy for local institutions, poorer localgovernments are less able to supply interest rate subsidies to local universities (Shenand Li,2003).
Chung (2003) states that the allocation of student loans in Hong Kong has been mainlybased on considerations of equity, efficiency and adequacy. The students from lesswell-off families receive greater financial assistance. The loan entitlement variesaccording to a formula, which takes each applicant's family financial situation intoconsideration. The goal of the system is to ensure that no qualified student is deprivedof higher education because of lack of funds which fulfils the social objectves. Second,the maximum amount of a loan is adjusted so as to correspond to the general livingneeds of a student through regular surveys of student expenses and the compilation ofa Student Price Index. The allocation of financial assistance has also been used toencourage development in areas of study required by society. At different stages, variousgrants and loans in Hong Kong have been targeted at students in teacher training,information technology, financial services and creative media. Moreover, thedevelopment of the government student loans scheme has not reduced the government'sfinancial commitment to higher education.
There are six government-supported loan schemes for higher education in the Republicof Korea, covering about 16 per cent of student enrolment. Overall, student loans inthe Republic of Korea are highly subsidized and have not been used as a tool tosupport cost recovery in higher education (Kim and Lee,2003). Student loans havenever operated on a large scale in the Philippines; their impact on higher educationfinance has been minimal and their performance record poor. Current experimentationwith government funded but university-based loans schemes is also operated on asmall scale with questionable success. No clear plans are afoot to develop any nationallybased scheme of broad coverage and sizeable impact in the foreseeable future(Kitaevetal, 2003). However, the loan scheme in Philippines aims at targeting thepoor students and the students pursuing priority courses.
8
CMDR Monograph Series No. - 56
Literature on student loan does include theoretical studies with a focus on alternativeways of designing and evaluation of student loans from the view points of efficiencyand equity. For instance, Garcia-Penalora and Walder (2000) have examined theefficiency and equity implications of four instruments of financing higher education,viz. traditional tax subsidy schemes, a pure loan scheme, a system of income contingentloan and a graduate tax system. Using traditional tax-subsidy scheme as a bench markscheme, the authors show that when the outcome of education process is certain, thethree alternative systems are identical in self-financing of education by students.However, in the presence of uncertainty of outcome of education process, the threesystems differed in repayment of cost of education.
Empirical studies on student loan in different countries provide with details of theobjectives, design and implementation of alternative programmes or schemes. Forinstance, Johnstone (2002) presents an excellent review of student loan programmesin select Central America, European and African countries, such as, U.S.A, Sweden,Germany, Netherlands, U.K, South Africa and Kenya. Most recently, the experienceof student loan schemes in Asian countries is elaborated in Shen and Li (2003) forChina, Kim and Lee (2003) for republic of Korea, Ziderman (2003) for Thailand,Chung (2003) for Hongkong and Kitaevetal (2003) for Philippines.
The most important and common objectives of student loan are equity and access forthe poor and cost-sharing has an implicit budgetary objective in regard to publicfunding replacement in higher education. That is, reduction in public expenditure onhigher education and reallocation of education expenditure from higher to lower levelsof education (UNESCO 2003). Notwithstanding the importance for budgetaryobjectives, however, the above studies do not offer a supporting or confrontingempirical evidence on achieving the budgetary objectives.
Ziderman(2003) states that the Thai loans scheme, which began operating in 1996, isaimed at disadvantaged students, enrolled in upper secondary general and vocationalschooling as well as tertiary education, in both the public and the private sector. Whilethe scheme is aimed at the needy student, targeting is not effective. The family incomeceiling set for loan eligibility is three times the income officially designated as definingpoverty. Loan budget allocation to educational institutions is only very loosely tied tothe social profile of the student population at a given institution (in the case ofuniversities, allocation criteria are not based at all on student poverty within theuniversity or related to need). The Thai loans scheme receives a considerably higherlevel of government subsidy than the loans schemes in the other case study countries.
Salmi and Hauptman (2006) argue that need-based grants and merit-based scholarshipscan be an important means to promote greater access, equity, and quality and can be
Loan Financing to Higher Education: Experiences of Bank Financing In A Less Developed Region
9
used to increase cost sharing regardless of whether the grants and scholarships arefunded by government or through cross subsides from other wealthier student. Inhigher education systems across the world, the trend toward increased cost sharing inpublic universities and the growth of private institutions have led to the creation ofmany ways to assist students in paying ever more of their own education and relatedexpenses.
In the Indian context, Tilak (1999) argues that, from the view point of the governments,student loan are expected, among others, to do away with budgetary allocations forand eventually, withdraw from financing higher education or make higher educationself-financing by non-government sources. However, Tilak underlines that thisargument is based on several unrealistic assumptions, such as existence of well-developed capital markets and to their access for poor students, recovery of loans inspecified periods; students are the main/sole beneficiaries of higher education andexistence of strong or perfect links between education and employment. In the absenceof these assumptions, Tilak concludes that student loan "may indeed be a deterrent tothe growth of higher education".
In view of the experiences of India and other countries, student loans cannot be viewedas an efficient solution to the problem of finances in the short, medium and long term.Also it would not be a perfect substitute for budgetary subsidy to help the poor deservingstudents in higher education (Narayana,2001)
Tilak(2007) the loan scheme is not equity oriented and there is no evidence ofpreferential treatment for the socio-economically weaker sections. Even though banksoffer one percent lower interest rates than the normal rate, but the student loan wouldwork as a 'negative dowry' (Robbins Committee, 1963, p.211) particularly in thecountries like India where dowry is a social phenomenon. After reviewing the strengthsand weaknesses of the student loan scheme, Tilak (2007) suggested that student loancan be used in a very limited way for limited purposes but not for the whole highereducation system in India. In the context of unequal socio economic background ofIndian population, a sound taxation system can be allowed as an in-built mechanismof recovery of public investment made in higher education involved in the system ofstudent loans.
The limited number of studies reviewed showed different results and so far no seriousresearch based study has come out in respect of student loan financing particularlybank loan for educational finance. The present study makes an attempt to fill this gapin a limited way. But the study will be an eye opener to many of the issues which canbe taken up as further research.
10
CMDR Monograph Series No. - 56
3.The Study Design
Both the secondary and primary data were used in the study. The secondary datapertaining to different indicators of higher education were collected and analysed.The indicators include number of universities and colleges of higher education,enrolment in higher education, budgetary allocation and expenditure pattern for highereducation in different years for India and the study state i.e.Orissa.
In order to know the socio-economic impact of bank loan, its determinants and therate of interest, mode of repayment etc we used primary data collected from the studentsalready taken loan from banks particularly, State Bank of India in the district of Cuttackwhich is economically, educationally and commercially a developed district of thestate. We took 60 beneficiaries availing bank loan for the purpose of pursuing theirhigher education. The list of beneficiaries was collected from the records of the Bankand they were selected randomly. We contacted the selected beneficiaries to providethe required information. The beneficiaries are from different branches of facultylike, B.Tech, M.Tech, MBA, MBBS and MCA etc. The information like their socio-economic background, educational qualification and their parent's education,occupation, residential status and mode of repayment of loan etc were collected fromthe bank records (from the forms submitted for the sanction of the loan). The primarydata was collected through a questionnaire designed for the purpose. Besides manyof the issues were captured though discussions with bank managers of different banks.Simple and cross tabular method were used to analyse the data of the socio economicand educational variables of the students taken loan. In order to examine the effect ofsocio-economic determinants of loan, a simple linear regression model was used asfollows:
LOAN=F(FATH_OCC, FAM_INCOME, INT_RATE)
LOAN= α + FATH_OCC + 1 FAM_INCOME+ 2 INT_RATE +U
Where the dependent variable is loan taken by the student
FATH_OCC is taken as Service and others as dummy
i.e. 1, If the occupation is service, otherwise 0
FAM_INCOME is the family income.
INT_RATE is the rate of interest
α, and U are the intercept, coefficient and error term respectively.
Loan Financing to Higher Education: Experiences of Bank Financing In A Less Developed Region
11
The returns to education were estimated through Mincerian earning function as follows:
Log of earnings = f(years of education, years of education square)
By using this model we have estimated the returns to education of the students takenloan and compared it with that of students not taken loan. We collected the datapurposively from 60 employed engineers and doctors in different types of jobs atBhubaneswar. The number of students with loan and without loan was 30 in eachcategory. Even though the sample size was very small, it provided some indication ofreturns to education financed through bank loan.
4. Brief Profile of Higher Education in India
4.1 Growth of Higher Education
Since independence, the number of colleges and universities has registered a significanthike. From 1950-51 to 2004-05 (Table 2), while the number of universities hasincreased at an annual compound growth rate of 4.9 per cent, the number of collegeshas gone up from 578 to 17,625 showing a growth rate of 6.7 % per annum. Duringthis period, enrolment in higher education has registered a steep hike, from around0.174 million to 10.48 million. The gross enrolment ratio in higher education was 1per cent in 1950-51 and it increased to 10 per cent in 2004-05. The number of teachershas also gone up from around 24,000 in 1950-51 to 4,72,000 in 2004-05 (SelectedEducational Statistics 2006-07). As on March 31, 2006, the country had 20 centraluniversities, 217 state universities, 102 deemed to be universities, 10 privateuniversities, 13 institutions of national importance and five institutions establishedunder the State Legislature Act (UGC 2006). Thus, the Indian higher education systemis the largest in the world in terms of the number of institutions. The number ofinstitutions in India is more than four times the total number of institutions both in theUS and Europe.
12
CMDR Monograph Series No. - 56
Enrolment Teachers
(in thousands) (in thousands)
1950-51 28 578 174 24 1
1960-61 45 1819 557 62 2
1970-71 93 3227 1956 190 3.9
1980-81 123 4738 2752 244 5.4
1990-91 184 5748 4925 271 4.3
2000-01 266 11146 8399 395 8.97
2004-05 348 17625 10481 472 9.97
G R (%) 4.9 6.7Notes: *Universities include central, state, private and deemed to be universities as also institutions of
national importance established both by the central and state governments.
Table 2: All-India Growth of Institutions, Enrolment and Teachers at Higher
Education Level, 1950-51 to 2004-05
Year Universitie Colleges
GER in Higher
education (%)
4.2. Financing of Higher Education in India
Before discussing the loan financing to higher education, the pattern of publicexpenditure to higher education merits discussion particularly during the fiscalstringency after 1990s at the national as well as at the state levels.
The main sources of finance of Indian Higher education is the government and theprivate that includes household, firms, community, charitable trusts etc. The longterm trends in financing show that higher education is increasingly becoming a statefunded activity with about three-quarters of the total expenditure being borne by thegovernment. However, on account of several factors including the new economicpolicies adopted since the 1990s, state funding to education in general and highereducation in particular, has been declining in real terms. Further, the mushroom growthof private institutions, particularly in areas of management, engineering, computers,etc, have raised the issues of access, equity, quality and regulation.
Public Expenditure on Higher Education
With the shrinking of government budget and other fiscal problems that both centraland state governments are facing, the financing trends have not been favourable tohigher education since the 1990s. The public expenditure on higher education increasedfrom Rs 23,120 million in 1990-91 to 95,620 million in 2004-05 (see Table 3) atcurrent prices with an annual growth rate of 12.3 per cent. To get a realistic picture,one may have to look at trends in public expenditure adjusted for inflation. Afteradjusting public expenditure both on higher and technical education for inflation with
Loan Financing to Higher Education: Experiences of Bank Financing In A Less Developed Region
13
national income deflators, the annual growth rate turns out to be just 5.4 per cent and5.2 per cent respectively (see Table 3).
Current Prices Constant Prices* Current Prices Constant Prices*
1990-91 23120 31400 1990-91 7530 10230
1991-92 24440 29170 1991-92 8090 9660
1992-93 27000 29640 1992-93 9070 9960
1993-94 31040 31040 1993-94 10180 10180
1994-95 35250 32170 1994-95 11890 10850
1995-96 38710 32390 1995-96 12900 10800
1996-97 42880 33430 1996-97 14500 11310
1997-98 48590 35500 1997-98 16230 11850
1998-99 61170 41370 1998-99 20730 14020
1999-2000 82480 53710 1999-2000 24590 16010
2000-01 91950 57880 2000-01 25280 15910
2001-02 80880 49230 2001-02 25600 15590
2002-03 88600 51790 2002-03 28210 16490
2003-04 93810 53250 2003-04 31390 17820
2004-05 95620 51520 2004-05 33870 18250
(1990-91 to
2004-05) 12.3 5.4
(1990-91 to
2004-05) 12.1 5.2
*National income deflations were used to convert current expenditure into constant expenditure and
refer to the year 1993-94.
Sources: 1) Analyses of Budgeted Expenditure on Education, MHRD, various years.
2) Government of India, Selected Educational Statistics, various years.
Growth Rate (%)
Table 3: Budget Expenditure on Higher and Technical Education
Year
Budget Expenditure (Revenue) (Rs. million)
Year
Budget Expenditure (Revenue) (Rs. million)
General Higher Education Technical Education
The public expenditure by central government on higher education is around 20 percent of the total expenditure since 1990-91 with a few exceptions in the present decade,wherein it increased to a little over 25 per cent. Much of the central governmentexpenditure on higher education is routed through the University Grants Commission(UGC). It is interesting to note that the disbursement of funds by the UGC is unevenand the bulk of it goes to the central universities and their affiliated colleges and to afew deemed to be universities. Since 1990-91, the central and state governments arefinancing the public technical education almost in equal proportions. Much of thecentral government expenditure (a little over 40 per cent) goes to Indian Institutes ofTechnology (IITs). Further, Indian Institutes of Management (IIMs), Indian Instituteof Science (IISc), National Institutes of Technology (NITs), and All India Council forTechnical Education (AICTE) - each gets around10 per cent of the total centralgovernment grants.
14
CMDR Monograph Series No. - 56
Proportion of GNP to Higher Education
One can not only judge the allocation of expenditure per se to higher education butalso the proportion of expenditure on higher education to GNP/GDP. In the context ofthe intra-sectoral allocation of resources, it was observed that the constitutionalcommitment of providing universal elementary education is non- negotiable. Thesecondary education as a preparatory as well as terminal education cannot be ignored.In the context of globalisation and increased competition, the higher education cannotbe overlooked either. Having regard to these realities, a consensus of a sort is graduallyemerging to allocate at least 3 per cent of GNP to elementary education, 1.5 per centto secondary education and the remaining 1.5 per cent to higher and technical education(CABE 2005). With this background, now let us examine the priority accorded todifferent levels of education. Since 1990s, the priority given to higher and technicaleducation has declined despite their growing importance in facing the new globalchallenges. The proportion of GNP allocated to higher education has sharply declinedfrom 0.46 per cent in 1990-91 to 0.34 per cent in 2004-05. The allocation to technicaleducation declined from 0.15 per cent to 0.12 per cent as a proportion of GNP duringthe same period (see Table 4). The allocations to higher and technical education puttogether hardly constitute less than 1 percent (0.6 per cent of GNP) in 1990-91 andfurther declined to 0.46 per cent by 2004-05.
Higher Technical
Hig her &
Technical Higher Technical
Higher &
Technical
1990-91 0.46 0.15 0.6 1 1.58 0.51 2.09
1991-92 0.42 0.14 0.5 6 1.43 0.48 1.91
1992-93 0.41 0.14 0.5 5 1.42 0.48 1.9
1993-94 0.4 0.13 0.5 4 1.42 0.47 1.89
1994-95 0.39 0.13 0.5 2 1.4 0.47 1.87
1995-96 0.37 0.12 0.4 9 1.35 0.45 1.8
1996-97 0.35 0.12 0.4 7 1.3 0.44 1.74
1997-98 0.35 0.12 0.4 7 1.31 0.44 1.75
1998-99 0.39 0.13 0.5 2 1.39 0.47 1.86
1999-00 0.47 0.14 0.6 1 1.61 0.48 2.09
2000-01 0.49 0.13 0.6 2 1.79 0.49 2.29
2001-02 0.39 0.12 0.5 2 1.31 0.41 1.72
2002-03 0.4 0.13 0.5 2 1.31 0.42 1.72
2003-04 0.37 0.13 0.5 1.22 0.41 1.63
2004-05 0.34 0.12 0.4 3 1.18 0.42 1.6
Source: Government of India, Analysis of Budg eted Expenditure, various years.
Table 4: Public Expenditure on Higher and Technical Education as Percentage
of GNP and Budget
Year
As Percentage of GNP A s Percentage of Budget
Loan Financing to Higher Education: Experiences of Bank Financing In A Less Developed Region
15
It is therefore quite clear that under the deep waves of globalisation and competition,important economic rationale for government funding especially for higher educationis neglected. As Tilak(2003) has very rightly pointed out that the overall decline inpublic expenditure on higher education is attributed to (a) decline in resource capacityof the government, (b) neo liberal policies introduced in the beginning of 1990s and(c) a strong but a wrong assumption that higher education does not matter fordevelopment.
This adverse impact of economic reforms reflects upon various revenue diversificationmeasures such as hike in student fees, entry of private sector into higher education,student loan programmes operated by commercial banks etc. One of the importantrevenue diversification measures adopted in the Indian higher education system isstudent loans. The student loan scheme has been in operation in India since 1963. Inthe next section we briefly present current model of student loan scheme and growthof student loan by commercial banks in India.
5. Loan Financing to Higher Education by Banks
5.1 Nature and Scope of Student Loan Scheme
Of late, educational loan is very popular among students because of its simple andappealing logic, despite its inherent weaknesses. It is argued that in order to safeguardthe poor students from the rising costs of higher education (both tuition fee andmaintenance cost), a number of countries in the developing and developed worldhave established student loan programmes. Student loans are currently in operation inmore than 80 countries around the globe. However, cost recovery cannot beimplemented equitably without scholarship programmes that should guaranteenecessary financial support to academically qualified poor students (Salmi, 1992;Tilak, 1997). Further, imperfection in capital markets related to the lack of collateralsecurity for education investments restricts the ability of poor students to borrow foreducation. In India, there was an interest free National Loan Scholarship programmesfinanced by the central government to help the poor and meritorious students in highereducation. The recovery rate of this scheme was either extremely low or nil and thescheme is no more in operation.
Following the wave of changes around the world, the present Educational Loan Schemethrough banks has become more popular. Government of India in consultation withRBI and Indian Bankers' Association framed a comprehensive loan scheme in 2001and revised it in 2004-05. At present all the public sector banks and other privatebanks have introduced different types of attractive student loan schemes. The schemecovers a wide range of courses in higher studies from post-matric to higher studies,

16
CMDR Monograph Series No. - 56
both in India and abroad. However, to bring in uniformity and enlarge the scope ofstudent loan scheme of all commercial banks, a model student loan scheme has beenadopted by all commercial banks.
Student loans cover tuition fees, hostel fees, library charges, administrative charges,travel expenses, purchase of books/equipment /uniform etc. The amount of educationalloans varies with different banks. Generally, the maximum limit granted is up to Rs10 lakhs for studying inside the country and a maximum of Rs 20 lakhs for studyingabroad. Loans are given on interest rates ranging from 10.5 to 15 percent per annum.Some banks also give a choice between fixed and floating interest rates. Some bankscharge interest on a daily or monthly basis reducing the balance which works in favourof the borrower. Management students are among the top choices for most banks.Technology students from the country's premier institutions, medical and engineeringcollege students can get student loans from banks on priority basis.
Eligible criteria
To be eligible for a student loan the applicant should be a resident and must havesecured admission into a professional/technical course through a selection process.For studies inside the country banks lend up to Rs 4 lakhs without providing anysecurity or margin. For a higher loan amount of say up to Rs 7.5 lakhs can be availedagainst a third party guarantee. The third party guarantee can come from a personstanding guarantee for the full amount. This loan comes with a five percent margin(what this means is that five percent is deducted from the amount sanctioned as loan).Margins vary from 5 per cent to 15 per cent for loans above Rs.4 lakhs. Interest rate ischarged according to the Prime Lending Rate (PLR) for loans up to Rs.4 lakhs andwith one per cent addition to PLR for loans exceeding Rs.4 lakhs. This rate is onepercent less for the girl students.
To study abroad, a higher loan amount of Rs 7 lakhs and above are usually sanctionedagainst fixed deposits, NSC certificates, or property worth the loan amount. Here, themargin amount is 15 percent. Further, a loan below Rs 4 lakhs is charged at 10.5percent rate of interest, the interest on a loan over Rs 4 lakhs is usually charged onepercent higher. The Reserve Bank of India (RBI) prescribes the specifics (amount,rate, repayment period) of education loans and the government provides a two percentsubsidy on these loans to banks.
Documents required for a student loan:
Completed education loan application form Original mark sheets of last qualifyingexamination Proof of admission, scholarship , studentship etc Prospectus of the institute
Loan Financing to Higher Education: Experiences of Bank Financing In A Less Developed Region
17
containing schedule of expenses for the specified course Passport size photographsBorrower's bank account statement for the last six months In case the borrower in anincome tax payee, income tax assessment order of last two years brief statement ofassets and liabilities, and of the co-borrower, if any Proof of income (salary slips,Form 16 etc), if any Copies of foreign exchange permit, if applicable.
Repayment
Ideally, a loan from a bank located close to place of study should be taken unless it isconcerned with overseas studies. This facilitates easier access to funds. For courseswhere employment prospects are less (as per the bank's own evaluation), loans aresanctioned on the basis of the parents' income. The Indian Banks' Association (IBA)has recently formed a working group to address the issue of student loans and therising rate of default. The group has submitted its findings to the Reserve Bank ofIndia and the main suggestion is to make it mandatory for parents or guardians, of thestudent availing the loan, to be co borrowers , thereby making them liable forrepayment. Loans are usually repaid through equated monthly installments (EMIs). Itgenerally commences after one year of the completion of course or six months aftersecuring the job. The time period can vary depending on the policies of the bank. Onan average period of repayment of the loan for a student is spread over 10-11 years.
Tax implications
Under Section 80(e) of the existing Income Tax Act, a person can exempt the amountpaid against the interest of an education loan - either for self, spouse or children - foreight years from the year he starts to repay the loan or for the duration the loan is ineffect, whichever is lesser. The yearly limit for deduction is Rs 40,000 (for both theprincipal and interest) since 2005 and it was Rs 25000 earlier. The student loansegment is being viewed as a vast untapped potential. Almost every prominent bankin the country has a student loan scheme in some form. Banks are increasing theflexibility of this loan in terms of payback period to attract more students. Therefore,it makes sense for students perusing professional courses to opt for a student loan.
5.2. Growth of Student Loan
Education is one of the 18 sectors3 under priority sector lending by the commercialbanks. Published data on educational sector leading by commercial banks is limited
3 The other seventeen priority sectors are: i) Agriculture, ii) Small Scale Industries, iii) Micro and Small Enterprises, iv)Setting up of Industrial Estate, v) Small Road and Water Transport, vi) Operators, Retail trade, vii) Small business, viii)Professional and Self employed persons, ix) Micro Credit, x)Consumption, xi) State Sponsored Corporations/Organisationsfor on-lending to other priority sector, xii) State sponsored organisation for SC/ST for purchase and supply of inputs andmarketing of outputs, xiii) Housing loans, xiv) Funds provided to RRBs, xv) Advances to self-help groups, xvi) Advances tosoftware industries, xvii) Advances to food and agro- processing sectors.
18
CMDR Monograph Series No. - 56
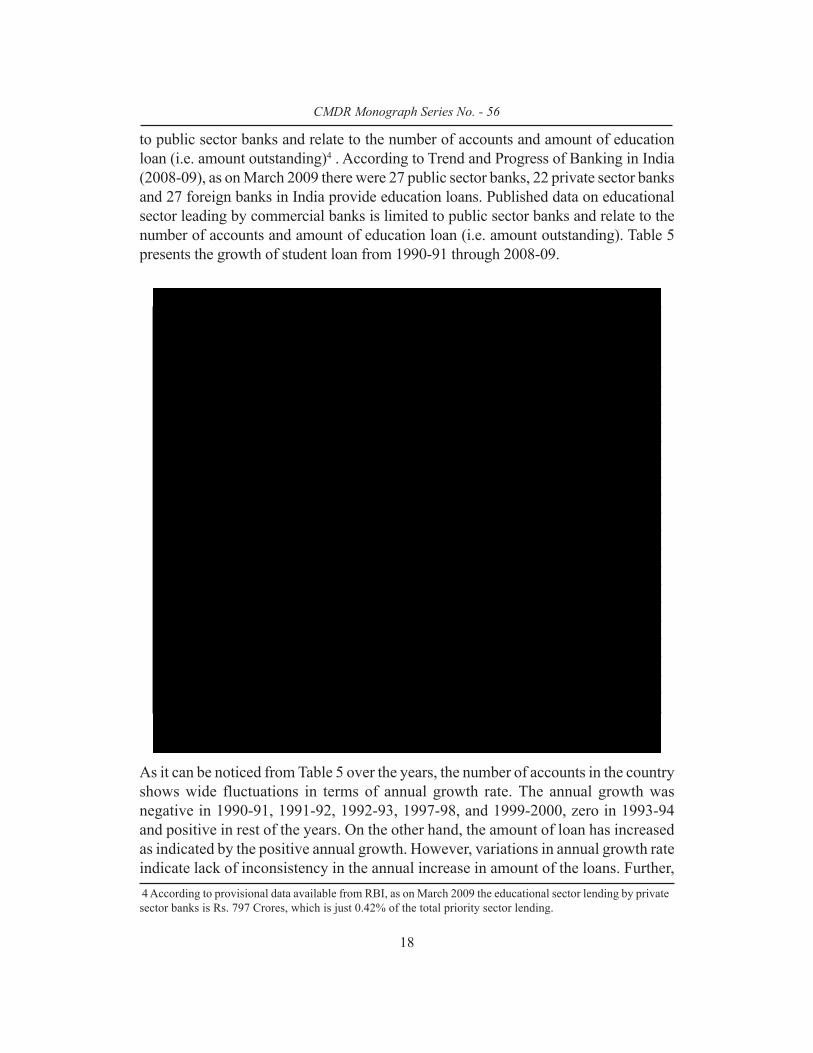
to public sector banks and relate to the number of accounts and amount of educationloan (i.e. amount outstanding)4 . According to Trend and Progress of Banking in India(2008-09), as on March 2009 there were 27 public sector banks, 22 private sector banksand 27 foreign banks in India provide education loans. Published data on educationalsector leading by commercial banks is limited to public sector banks and relate to thenumber of accounts and amount of education loan (i.e. amount outstanding). Table 5presents the growth of student loan from 1990-91 through 2008-09.
Number nual Growth Rs. nual Growth
1990-91 70 -2.78 77 14.93 - -
1991-92 69 -1.43 106 37.66 44692 0.24
1992-93 66 -4.35 117 10.38 48384 0.24
1993-94 66 0 132 12.82 52945 0.25
1994-95 70 6.06 158 19.7 60802 0.26
1995-96 74 5.71 183 15.82 69606 0.26
1996-97 114 54.05 280 53.01 78719 0.36
1997-98 82 -28 .07 329 17.5 90738 0.36
1998-99 137 67.07 450 36.78 104094 0.43
1999-00 80 -41 .61 543 20.67 127478 0.43
2000-01 112 40 1028 89.32 149116 0.69
2001-02 157 40.18 1527 48.54 171485 0.89
2002-03 239 52.23 2870 87.95 200169 1.43
2003-04 347 45.19 4179 45.61 244456 1.71
2004-05 470 35.45 6398 53.1 307046 2.08
2005-06 641 36.38 10804 68.87 409748 2.64
2006-07 1002 56.32 14012 29.69 521376 2.69
2007-08 1298 29.54 19844 41.62 610450 3.25
2008-09P 1580 21.73 26913 35.62 720083 3.74
P Provisional
Source: Various issues of the Economic Survey of the Government of India
Percentage of
Student Loan
to Total Priority Sector
Table - 5: Growth of Student Loan in India Financial
Year
(April through
Number of Accounts
(in '000)
Amount Outstanding (in Rs. Crores) at
current priceTotal Priority
Sector Lending (Rs. Crores)
As it can be noticed from Table 5 over the years, the number of accounts in the countryshows wide fluctuations in terms of annual growth rate. The annual growth wasnegative in 1990-91, 1991-92, 1992-93, 1997-98, and 1999-2000, zero in 1993-94and positive in rest of the years. On the other hand, the amount of loan has increasedas indicated by the positive annual growth. However, variations in annual growth rateindicate lack of inconsistency in the annual increase in amount of the loans. Further,
4 According to provisional data available from RBI, as on March 2009 the educational sector lending by privatesector banks is Rs. 797 Crores, which is just 0.42% of the total priority sector lending.
Loan Financing to Higher Education: Experiences of Bank Financing In A Less Developed Region
19
of the total priority sector lending by public sector banks, student loan has remainedless than one percent throughout the period until 2001-02. Nonetheless, after 2001-02, there has been a considerable improvement in student loans.
6. Student Loans by Banks in Orissa: A Case Study
Before discussing the student loans in higher education in Orissa, it is necessary tohave a brief idea about the status of higher education in the state of Orissa.
6.1 Growth of Higher Education in Orissa
Orissaa is considered as one of the backward states of the country with highestproportion of its population living below poverty line. The demographic compositionof the state makes the state to become more backward as about 40 percent of itspopulation constitutes SC and ST. The female literacy rate among the ST populationin some of the ST pockets is still below 10 per cent. In the context of wide socioeconomic and political disparities it would be interesting to examine the status ofhigher education in the state.
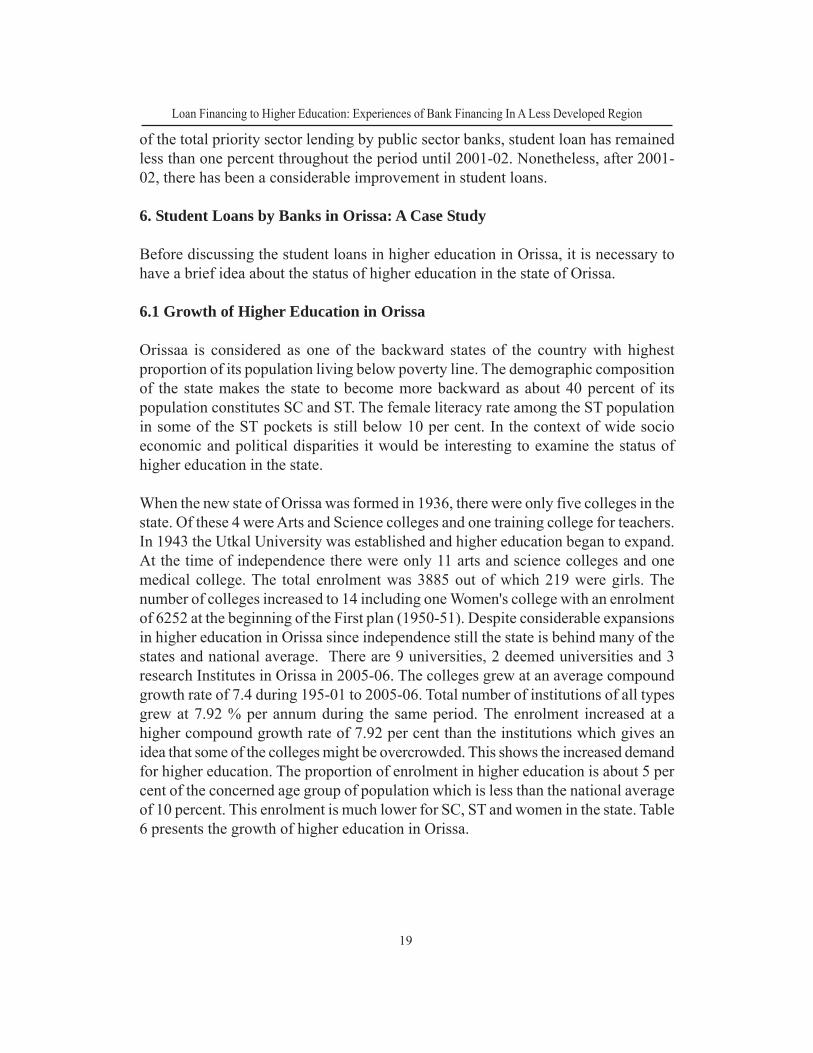
When the new state of Orissa was formed in 1936, there were only five colleges in thestate. Of these 4 were Arts and Science colleges and one training college for teachers.In 1943 the Utkal University was established and higher education began to expand.At the time of independence there were only 11 arts and science colleges and onemedical college. The total enrolment was 3885 out of which 219 were girls. Thenumber of colleges increased to 14 including one Women's college with an enrolmentof 6252 at the beginning of the First plan (1950-51). Despite considerable expansionsin higher education in Orissa since independence still the state is behind many of thestates and national average. There are 9 universities, 2 deemed universities and 3research Institutes in Orissa in 2005-06. The colleges grew at an average compoundgrowth rate of 7.4 during 195-01 to 2005-06. Total number of institutions of all typesgrew at 7.92 % per annum during the same period. The enrolment increased at ahigher compound growth rate of 7.92 per cent than the institutions which gives anidea that some of the colleges might be overcrowded. This shows the increased demandfor higher education. The proportion of enrolment in higher education is about 5 percent of the concerned age group of population which is less than the national averageof 10 percent. This enrolment is much lower for SC, ST and women in the state. Table6 presents the growth of higher education in Orissa.
20
CMDR Monograph Series No. - 56
1950-51 1 0 0 14 0 15 6252 298
1986-87 5 0 0 367 79 451 103118 9570
1999-2000 5 0 0 567 78 650 300720 17175
2001-02 8 0 0 567 132 707 341761 18436
2002-03 8 1 0 567 201 776 340796 19111
2003-04 8 1 0 567 204 779 348706 19534
2004-05 9 2 0 700 236 945 367187 20454
2005-06 9 2 3 702 218 929 413269 21134
CGR(%) 4.08 7.38 5.80 7.79 7.92 8.06
Source: Selected Educational Statistics, MHRD,Various years
Total
institutions
Enrolment in
Higher
Education
Number
of
Teachers
Table- 6: Growth of Higher Education (Degree level & above) in Orissa
YEAR Universities
Deemed
Universities
Research
Institutions
Arts, Science
& Commerce
Colleges
other
instituions
(ENG)etc
6.2. Financing of Higher Education in Orissa
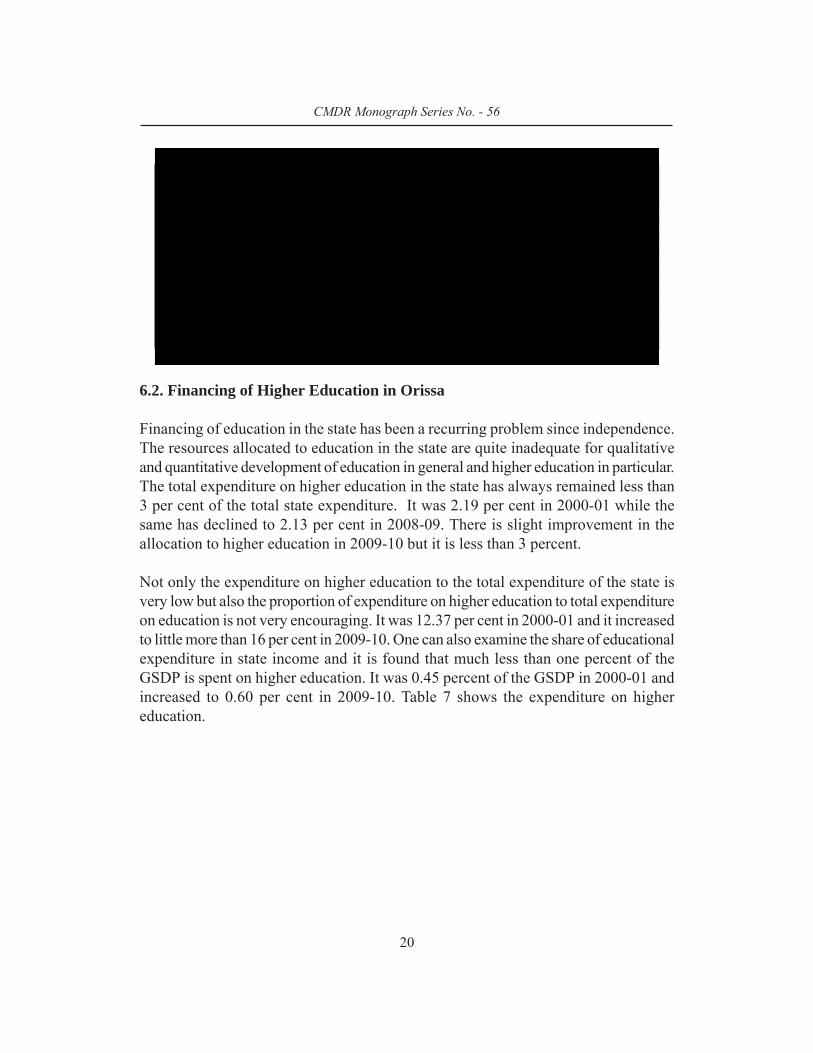
Financing of education in the state has been a recurring problem since independence.The resources allocated to education in the state are quite inadequate for qualitativeand quantitative development of education in general and higher education in particular.The total expenditure on higher education in the state has always remained less than3 per cent of the total state expenditure. It was 2.19 per cent in 2000-01 while thesame has declined to 2.13 per cent in 2008-09. There is slight improvement in theallocation to higher education in 2009-10 but it is less than 3 percent.
Not only the expenditure on higher education to the total expenditure of the state isvery low but also the proportion of expenditure on higher education to total expenditureon education is not very encouraging. It was 12.37 per cent in 2000-01 and it increasedto little more than 16 per cent in 2009-10. One can also examine the share of educationalexpenditure in state income and it is found that much less than one percent of theGSDP is spent on higher education. It was 0.45 percent of the GSDP in 2000-01 andincreased to 0.60 per cent in 2009-10. Table 7 shows the expenditure on highereducation.
Loan Financing to Higher Education: Experiences of Bank Financing In A Less Developed Region
21
year total expenditure on higher education as % to Total
Expend iture
total expenditure on higher education a s % of total
expenditure on education
% of exp on hig her education to GSDP
2000-01 2.19 12.37 0.45
2001-02 2.99 18.75 0.74
2002-03 2.45 14.68 0.54
2003-04 2.25 14.29 0.43
2004-05 2.3 15.18 0.43
2005-06 2.35 15.29 0.44
2006-07 2.45 17.8 0.46
2007-08 2.45 16.18 0.48
2008-09 2.13 14.42 0.46
2009-10(p) 2.9 16.14 0.6
Table 7 : Public Expen diture on Higher Education and State Income
S ource: B udget document, Gov ernment o f Orissa, Various years,
p =provisional estimate
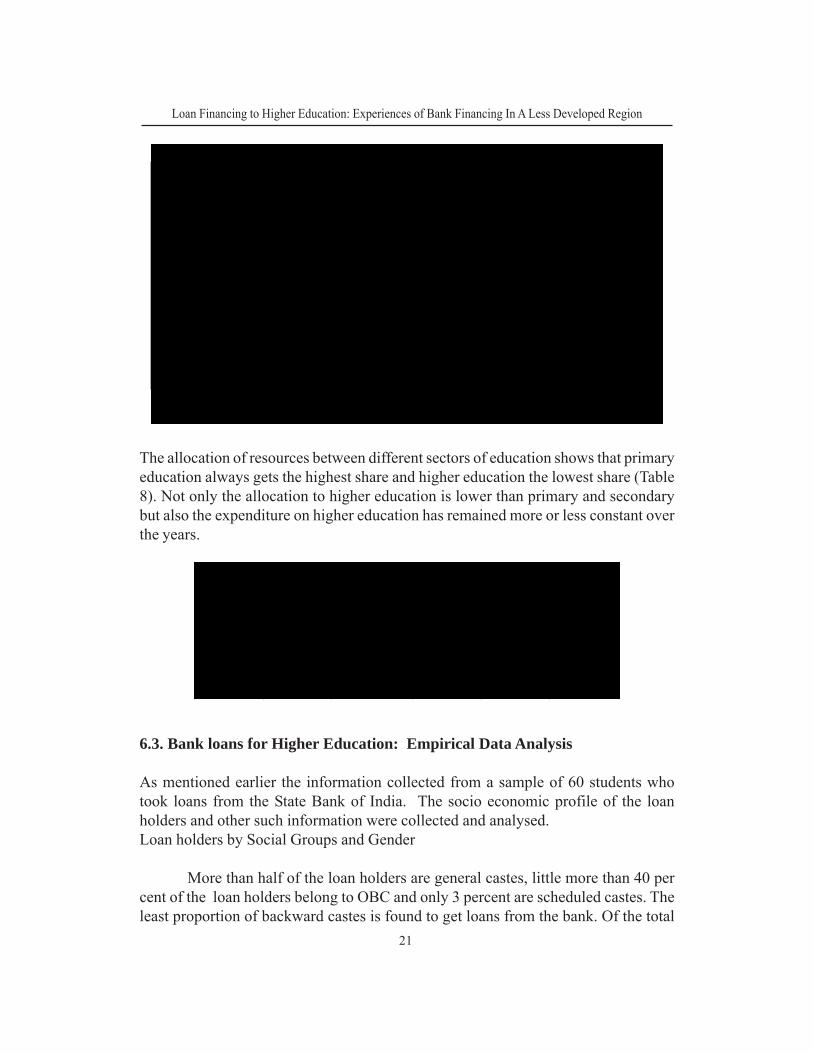
The allocation of resources between different sectors of education shows that primaryeducation always gets the highest share and higher education the lowest share (Table8). Not only the allocation to higher education is lower than primary and secondarybut also the expenditure on higher education has remained more or less constant overthe years.
Year Primary Secondary Higher Others Total
2002-03 58.33 25.9 14.67 1.1 100
2003-04 58.69 25.49 14.3 1.52 100
2004-05 57.61 26.15 15.83 0.41 100
2005-06 55.61 28.29 15.31 0.79 100
2006-07 56.76 26.54 15.61 1.09 100
Table 8: Intra Sectoral Expenditure on Education
6.3. Bank loans for Higher Education: Empirical Data Analysis
As mentioned earlier the information collected from a sample of 60 students whotook loans from the State Bank of India. The socio economic profile of the loanholders and other such information were collected and analysed.Loan holders by Social Groups and Gender
More than half of the loan holders are general castes, little more than 40 percent of the loan holders belong to OBC and only 3 percent are scheduled castes. Theleast proportion of backward castes is found to get loans from the bank. Of the total
22
CMDR Monograph Series No. - 56
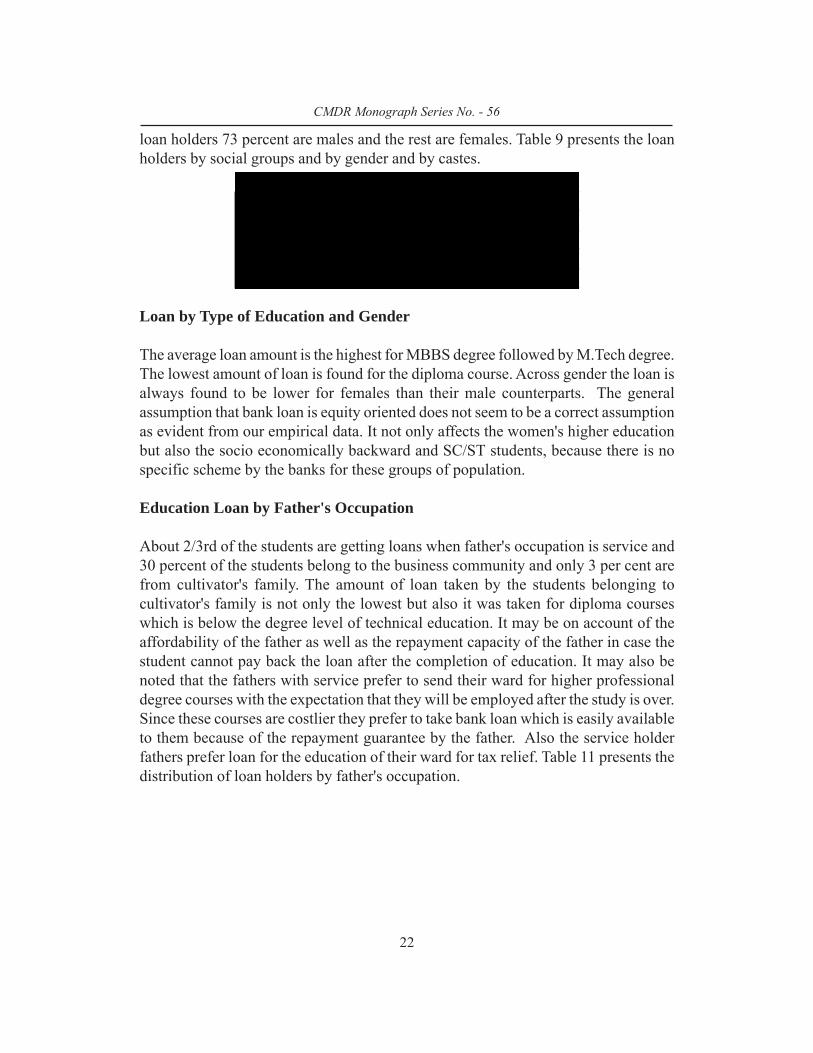
loan holders 73 percent are males and the rest are females. Table 9 presents the loanholders by social groups and by gender and by castes.
General OBC SC Total
Male 59.1 36.4 4.5 73.33
Female 37.5 62.5 ‐ 26.67
Total 53.3 43.3 3.3 100
Table 9: Loan Holders by Caste and Gender
Gender
Caste category
Loan by Type of Education and Gender
The average loan amount is the highest for MBBS degree followed by M.Tech degree.The lowest amount of loan is found for the diploma course. Across gender the loan isalways found to be lower for females than their male counterparts. The generalassumption that bank loan is equity oriented does not seem to be a correct assumptionas evident from our empirical data. It not only affects the women's higher educationbut also the socio economically backward and SC/ST students, because there is nospecific scheme by the banks for these groups of population.
Education Loan by Father's Occupation
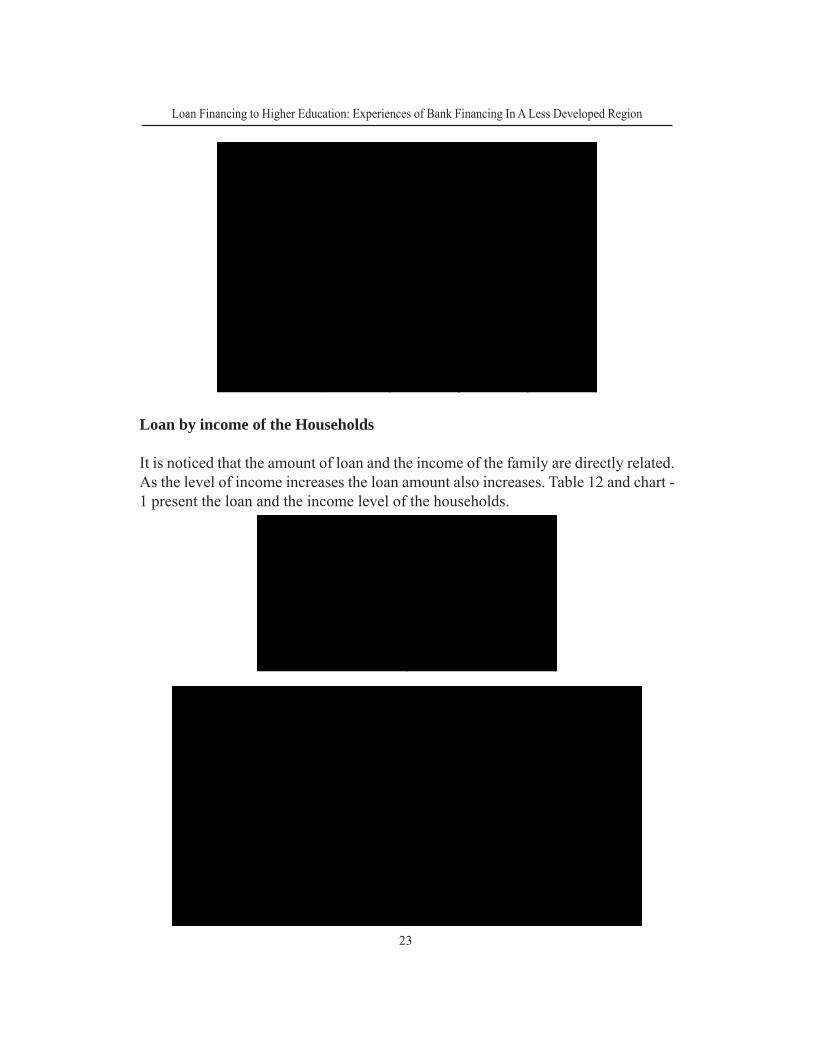
About 2/3rd of the students are getting loans when father's occupation is service and30 percent of the students belong to the business community and only 3 per cent arefrom cultivator's family. The amount of loan taken by the students belonging tocultivator's family is not only the lowest but also it was taken for diploma courseswhich is below the degree level of technical education. It may be on account of theaffordability of the father as well as the repayment capacity of the father in case thestudent cannot pay back the loan after the completion of education. It may also benoted that the fathers with service prefer to send their ward for higher professionaldegree courses with the expectation that they will be employed after the study is over.Since these courses are costlier they prefer to take bank loan which is easily availableto them because of the repayment guarantee by the father. Also the service holderfathers prefer loan for the education of their ward for tax relief. Table 11 presents thedistribution of loan holders by father's occupation.
Loan Financing to Higher Education: Experiences of Bank Financing In A Less Developed Region
23
Service Business Cultivation
B TECH 66.67 33.33 0 50
BDS 100 0 0 6.67
DIPLOMA 50 0 50 6.67
M TECH 100 0 0 6.66
MBA 50 50 0 13.33
MBBS 66.67 33.33 0 10
MCA 50 50 0 6.67
Total 66.67 30 3.33 100
Table 11: Education loan by Father's Occupation
Type of
education for
which the loan
was taken
Occupation of Father Total
Loan by income of the Households
It is noticed that the amount of loan and the income of the family are directly related.As the level of income increases the loan amount also increases. Table 12 and chart -1 present the loan and the income level of the households.
<=50000 150000
150000‐350000 257742.1
350001‐500000 294110.8
>500000 388000
Table 12: Loan by level of Income of the
Households
Level of Income of
family in Rs Av. Amount of loan(Rs)
050000
100000150000
200000250000
300000350000
400000450000
150000‐350000 >500000
Loan amount
Income group
Chart‐1: Av. Amount of loan(Rs) by Income group
24
CMDR Monograph Series No. - 56
Loan by Collateral and defaulters of loan
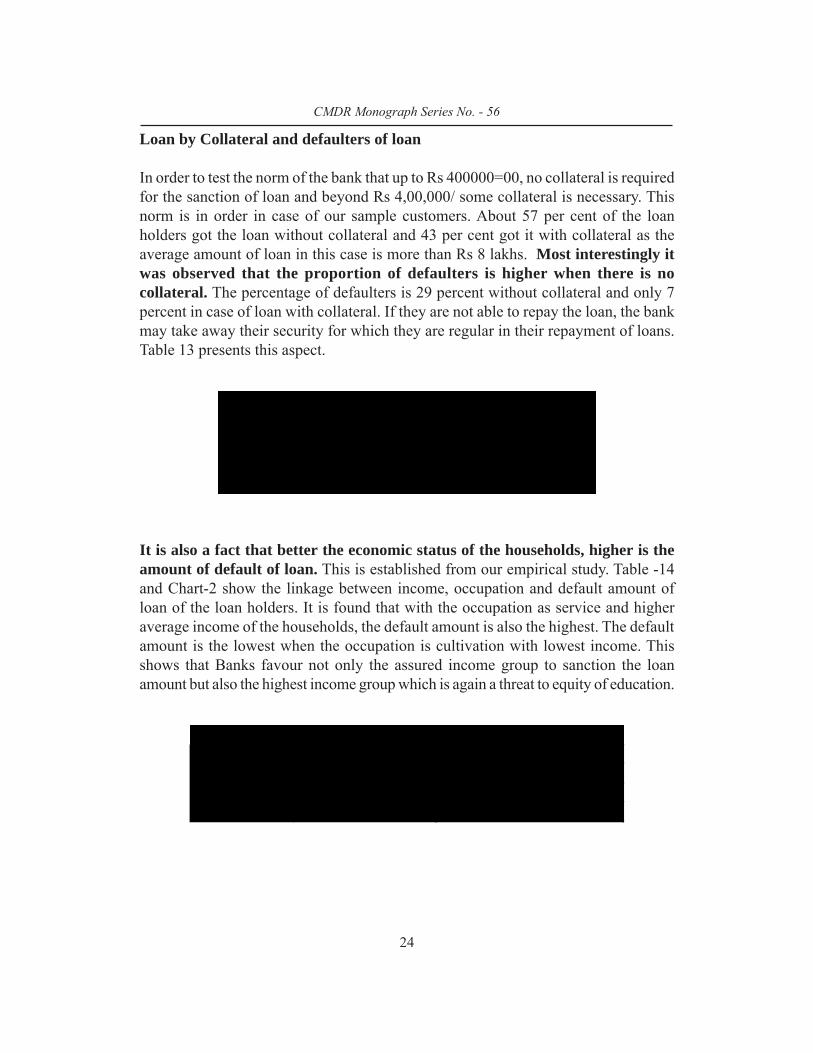
In order to test the norm of the bank that up to Rs 400000=00, no collateral is requiredfor the sanction of loan and beyond Rs 4,00,000/ some collateral is necessary. Thisnorm is in order in case of our sample customers. About 57 per cent of the loanholders got the loan without collateral and 43 per cent got it with collateral as theaverage amount of loan in this case is more than Rs 8 lakhs. Most interestingly itwas observed that the proportion of defaulters is higher when there is nocollateral. The percentage of defaulters is 29 percent without collateral and only 7percent in case of loan with collateral. If they are not able to repay the loan, the bankmay take away their security for which they are regular in their repayment of loans.Table 13 presents this aspect.
Collateral
% of Loan
holders
Average loan
in Rs
% of
defaulters
No collateral 57 349078.06 29
With collateral 43 884694.46 7
Table 13: Loan holders with and without Collateral
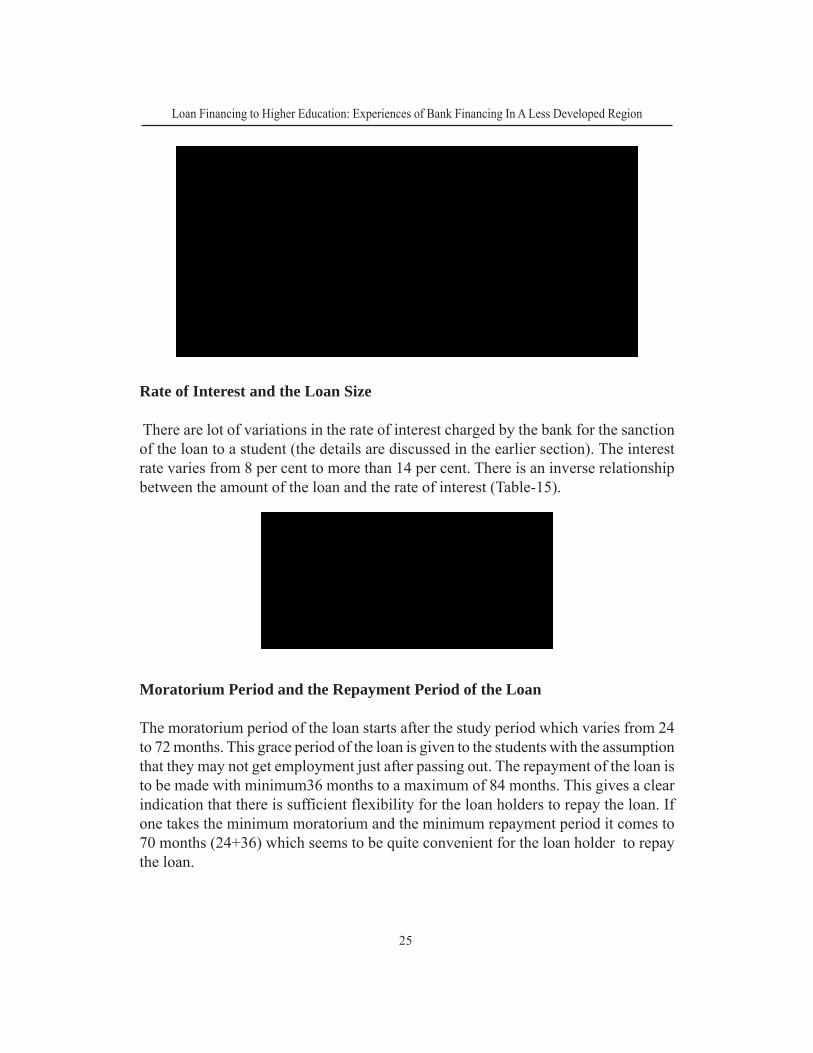
It is also a fact that better the economic status of the households, higher is theamount of default of loan. This is established from our empirical study. Table -14and Chart-2 show the linkage between income, occupation and default amount ofloan of the loan holders. It is found that with the occupation as service and higheraverage income of the households, the default amount is also the highest. The defaultamount is the lowest when the occupation is cultivation with lowest income. Thisshows that Banks favour not only the assured income group to sanction the loanamount but also the highest income group which is again a threat to equity of education.
Occupation Average Income(Rs) Av. Amount of Default (Rs)
Service 205971 17759
Business 150000 5250
Cultivation 114500 7287
Table-14: Default amount by Income and Occupation of Father
Loan Financing to Higher Education: Experiences of Bank Financing In A Less Developed Region
25
0
50000
100000
150000
200000
250000
Service Business Cultivation
Chart-2: Default amount of Loan by Income and occupational status
Average Income Av.Amount of Default
Rate of Interest and the Loan Size
There are lot of variations in the rate of interest charged by the bank for the sanctionof the loan to a student (the details are discussed in the earlier section). The interestrate varies from 8 per cent to more than 14 per cent. There is an inverse relationshipbetween the amount of the loan and the rate of interest (Table-15).
>=8 and <=10 6376828
>=10 and <=12 2014527
>=12 and <=15 1288000
Table ‐ 15: Rate of Interest (%) and the
amount of loan in Rs.
Rate of Int.(%) Amount of loan in Rs
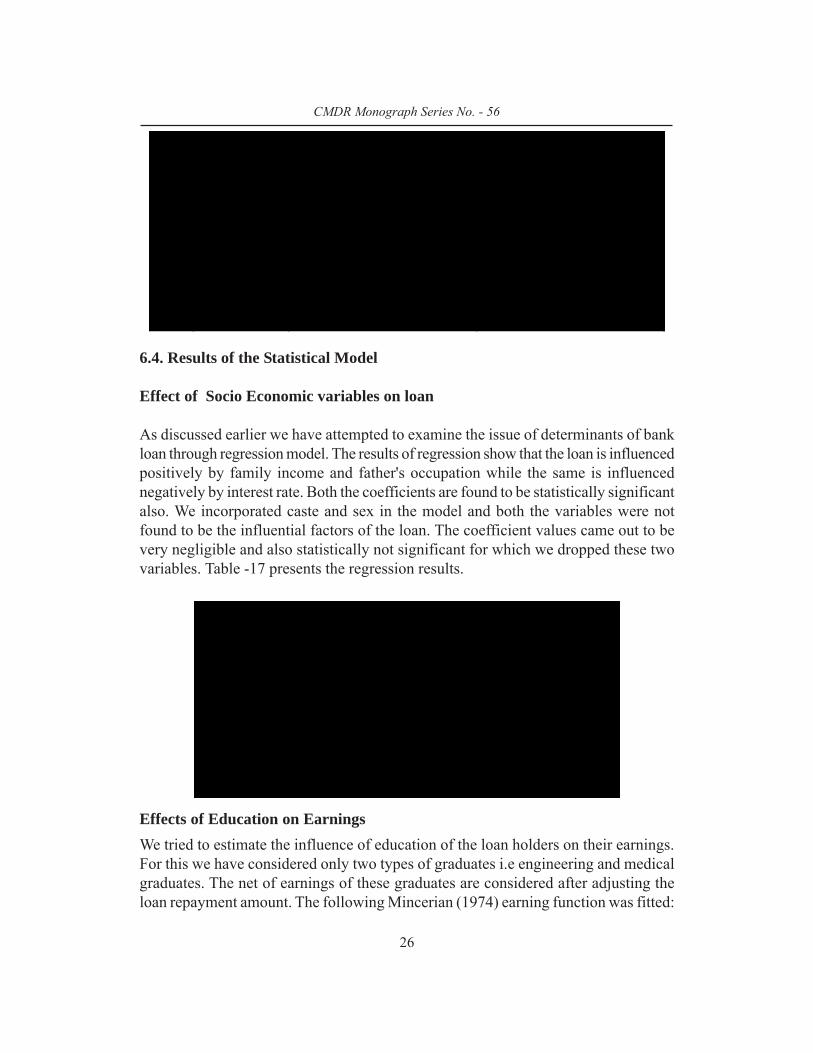
Moratorium Period and the Repayment Period of the Loan
The moratorium period of the loan starts after the study period which varies from 24to 72 months. This grace period of the loan is given to the students with the assumptionthat they may not get employment just after passing out. The repayment of the loan isto be made with minimum36 months to a maximum of 84 months. This gives a clearindication that there is sufficient flexibility for the loan holders to repay the loan. Ifone takes the minimum moratorium and the minimum repayment period it comes to70 months (24+36) which seems to be quite convenient for the loan holder to repaythe loan.
26
CMDR Monograph Series No. - 56
Sl. No. Course Moratorium Period (in months)Repayment Instalments (in
months)1 B.Tech 48‐60 60‐84
2 BDS 70‐72 80‐84
3 Diploma 36‐48 60
4 M Tech 24‐36 84
5 MBA 24‐36 48‐84
6 MBBS 60‐72 60‐84
7 MCA 36 36
Table 16: Moratorium Period and the number of Instalments fixed by Bank by Course
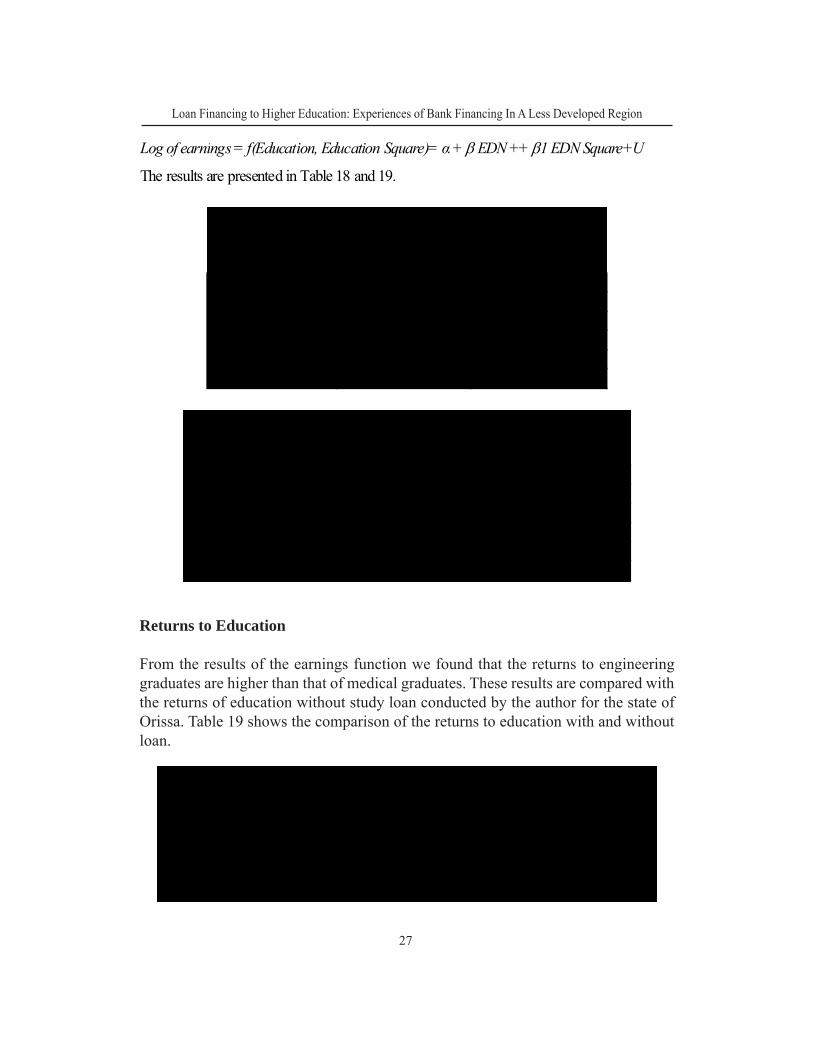
6.4. Results of the Statistical Model
Effect of Socio Economic variables on loan
As discussed earlier we have attempted to examine the issue of determinants of bankloan through regression model. The results of regression show that the loan is influencedpositively by family income and father's occupation while the same is influencednegatively by interest rate. Both the coefficients are found to be statistically significantalso. We incorporated caste and sex in the model and both the variables were notfound to be the influential factors of the loan. The coefficient values came out to bevery negligible and also statistically not significant for which we dropped these twovariables. Table -17 presents the regression results.
VARIABLES B ‐Coefficient t
CONSTANT 25648.2 8.858
FAMILY_ INCOME 67541.23 5.639*
FATH_OCC 23451.6 4.444*
INT_RATE ‐14471.5 ‐2.634**
Adjusted R square 0.522
Table 17: Regression Results of the Effect of Socio Economic
Variables on Student Loan
*and ** significant at 1 % and 5 % level respectively
Dependent variable: Loan amount
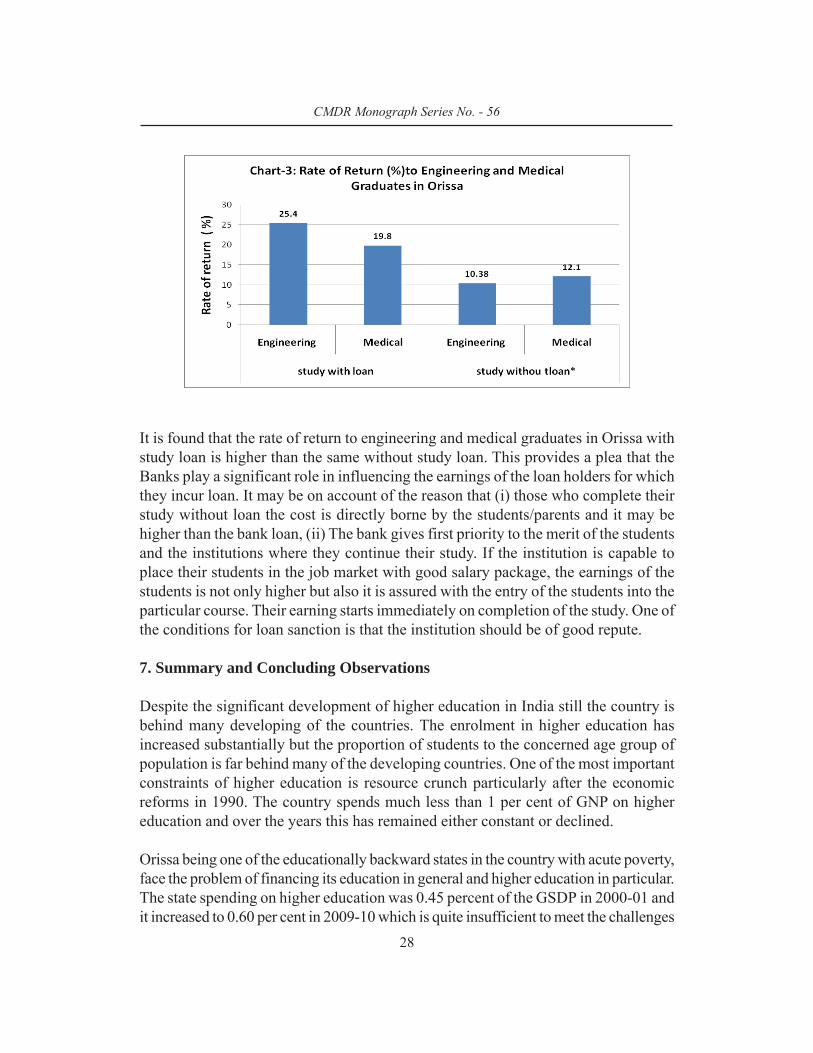
Effects of Education on Earnings
We tried to estimate the influence of education of the loan holders on their earnings.For this we have considered only two types of graduates i.e engineering and medicalgraduates. The net of earnings of these graduates are considered after adjusting theloan repayment amount. The following Mincerian (1974) earning function was fitted:
Loan Financing to Higher Education: Experiences of Bank Financing In A Less Developed Region
27
Log of earnings = f(Education, Education Square)= α + EDN ++ 1 EDN Square+U
The results are presented in Table 18 and 19.
Dependent variable: Log of earnings of the loan holders
VARIABLES B ‐Coefficient t
CONSTANT 14352.9 9.554*
Education 0.254 3.989*
Education square ‐0.0012 5.577*
Adjusted R square 0.576
N 30
Table 18: Regression Results of the effect of education on
earnings of Engineering Graduates
VARIABLES B ‐Coefficient t
CONSTANT 1123.98 9.554
Education 0.198 2.987*
Education square ‐0.0003 ‐3.764*
Adjusted R square 0.511
N 30
Table 19: Regression Results of the effect of education on earnings of
Medical Graduates
Dependent variable: Log of earnings of the loan holders (Medical Graduates)
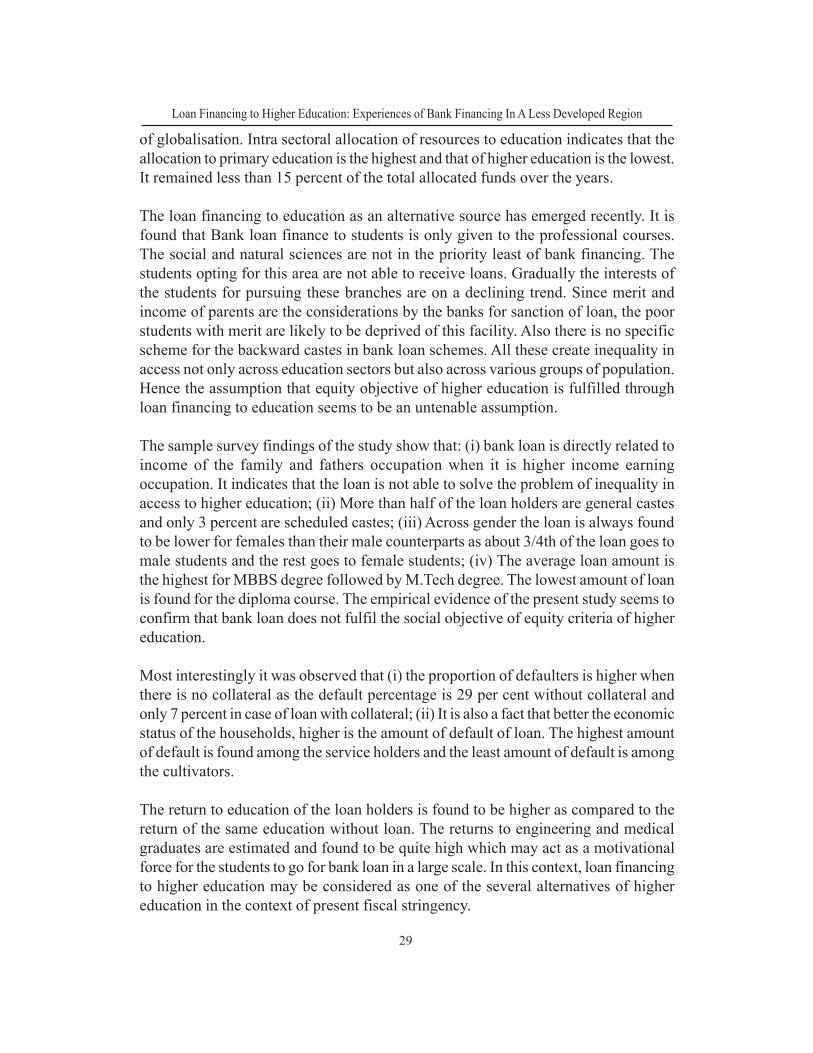
Returns to Education
From the results of the earnings function we found that the returns to engineeringgraduates are higher than that of medical graduates. These results are compared withthe returns of education without study loan conducted by the author for the state ofOrissa. Table 19 shows the comparison of the returns to education with and withoutloan.
Studies for Orissa type of education Rate of return (%)
Engineering 25.4
Medical 19.8
Engineering 10.38
Medical 12.1
Table 20: Rate of Return to Engineering and Medical Graduates in Orissa
study with loan
study without loan*
*the study was conducted by the author
28
CMDR Monograph Series No. - 56
It is found that the rate of return to engineering and medical graduates in Orissa withstudy loan is higher than the same without study loan. This provides a plea that theBanks play a significant role in influencing the earnings of the loan holders for whichthey incur loan. It may be on account of the reason that (i) those who complete theirstudy without loan the cost is directly borne by the students/parents and it may behigher than the bank loan, (ii) The bank gives first priority to the merit of the studentsand the institutions where they continue their study. If the institution is capable toplace their students in the job market with good salary package, the earnings of thestudents is not only higher but also it is assured with the entry of the students into theparticular course. Their earning starts immediately on completion of the study. One ofthe conditions for loan sanction is that the institution should be of good repute.
7. Summary and Concluding Observations
Despite the significant development of higher education in India still the country isbehind many developing of the countries. The enrolment in higher education hasincreased substantially but the proportion of students to the concerned age group ofpopulation is far behind many of the developing countries. One of the most importantconstraints of higher education is resource crunch particularly after the economicreforms in 1990. The country spends much less than 1 per cent of GNP on highereducation and over the years this has remained either constant or declined.
Orissa being one of the educationally backward states in the country with acute poverty,face the problem of financing its education in general and higher education in particular.The state spending on higher education was 0.45 percent of the GSDP in 2000-01 andit increased to 0.60 per cent in 2009-10 which is quite insufficient to meet the challenges
Loan Financing to Higher Education: Experiences of Bank Financing In A Less Developed Region
29
of globalisation. Intra sectoral allocation of resources to education indicates that theallocation to primary education is the highest and that of higher education is the lowest.It remained less than 15 percent of the total allocated funds over the years.
The loan financing to education as an alternative source has emerged recently. It isfound that Bank loan finance to students is only given to the professional courses.The social and natural sciences are not in the priority least of bank financing. Thestudents opting for this area are not able to receive loans. Gradually the interests ofthe students for pursuing these branches are on a declining trend. Since merit andincome of parents are the considerations by the banks for sanction of loan, the poorstudents with merit are likely to be deprived of this facility. Also there is no specificscheme for the backward castes in bank loan schemes. All these create inequality inaccess not only across education sectors but also across various groups of population.Hence the assumption that equity objective of higher education is fulfilled throughloan financing to education seems to be an untenable assumption.
The sample survey findings of the study show that: (i) bank loan is directly related toincome of the family and fathers occupation when it is higher income earningoccupation. It indicates that the loan is not able to solve the problem of inequality inaccess to higher education; (ii) More than half of the loan holders are general castesand only 3 percent are scheduled castes; (iii) Across gender the loan is always foundto be lower for females than their male counterparts as about 3/4th of the loan goes tomale students and the rest goes to female students; (iv) The average loan amount isthe highest for MBBS degree followed by M.Tech degree. The lowest amount of loanis found for the diploma course. The empirical evidence of the present study seems toconfirm that bank loan does not fulfil the social objective of equity criteria of highereducation.
Most interestingly it was observed that (i) the proportion of defaulters is higher whenthere is no collateral as the default percentage is 29 per cent without collateral andonly 7 percent in case of loan with collateral; (ii) It is also a fact that better the economicstatus of the households, higher is the amount of default of loan. The highest amountof default is found among the service holders and the least amount of default is amongthe cultivators.
The return to education of the loan holders is found to be higher as compared to thereturn of the same education without loan. The returns to engineering and medicalgraduates are estimated and found to be quite high which may act as a motivationalforce for the students to go for bank loan in a large scale. In this context, loan financingto higher education may be considered as one of the several alternatives of highereducation in the context of present fiscal stringency.
30
CMDR Monograph Series No. - 56
The following recommendations are suggested on the basis of the findings of thepresent study:
(i) Equity criteria
In order to fulfil the social objectives of equity in education, loan schemes need to beaimed at designing the scheme for the poor and needy students at lower interest ratewith some amount of subsidy form the amount of the loan. Thus a discriminatoryinterest rate needs to be devised by the bank.
(ii) Manpower need
Loans schemes may aim specifically at providing support for students who are willingto study in fields of national manpower priority or to work in areas of social importance(doctors or teachers servicing remote rural areas). Loans schemes may either bedeveloped specially for these groups or advantageous repayment conditions may beoffered within the context of a general, non-subsidized loan programme.
(iii) Interest of state universities
In principle, loans for students enrolled in private universities, ultimately aimed atfacilitating the growth of the private universities. This not only reduces the importanceof state universities but also act as a de motivating force to withdraw the best studentsfrom these universities. Hence the non subsidized loans with other incentives forprivate universities may be sufficient to attract students to these universities.
(iv) Evaluation of the efficacy of the loan schemes
It may be suggested that there need to be some process of evaluation for the loansschemes as there can be no standard approach to evaluating the efficacy of individualloans schemes. A given student loan scheme need to be evaluated in the context of thecentral objective(s) that it is designed to achieve.
(v) Cross subsidisation for higher education through the loan may beencouraged by the bank.
To conclude, it may be said that the bank loans as one of the alternative sources offinance to higher education should be designed in such a way that the public spending/subsidy on higher education need not be crowded out by the loan financing of highereducation. It needs to work as supplement rather than as a substitute to governmentfinancing to higher education in the context of a less developed region characterisedby wide regional/social disparities.
Loan Financing to Higher Education: Experiences of Bank Financing In A Less Developed Region
31
References
Buchori, M. and Malik, A. (2004). Asian Universities: Historical Perspectives andContemporary Challenges, chapter The Evolution of Higher Education in Indonesia,pages 249-277. The Johns Hopkins University Press.
Bray, Mark (1986b): 'Student Loans for Higher Education: The Hong Kong Experiencein International Perspective'. Higher Education, Vol.23, Nos.3-4, pp.343-354.
Bray, Mark (1991): 'Hong Kong', in Woodhall, Maureen, Student Loans in HigherEducation: Asia. Educational Forum Series No.2, Paris: UNESCO InternationalInstitute for Educational Planning, pp.46-50.
Chung, Y.P.(2003) The student loans scheme in Hong Kong. Bangkok: IIEP; UNESCOBangkok.
Duke, C. And Jenny Williams (ed.) (1998). Negotiating Access to Higher Education:The Discourse of Selectivity and Equity. Higher Education, 36(1):117-118.
Dundar, H. and Lewis, D. R. (1999). Equity, quality and efficiency effects of reformin Turkish higher education. Higher Education olicy, 4(5):1-24.
Espinoza, O. (2007). Creating (in) equalities in access to higher education in thecontext of structural adjustment and post-adjustment policies: the case of chile. HigherEducation.
James, R. (2007). Social equity in a mass, globalised higher education environment:the unresolved issue of widening access to university.
Johnstone, D. B. (2003). Cost Sharing in Higher Education: Tuition, FinancialAssistance, and Accessibility in a Comparative Perspective. Czech SociologicalReview, 39(3):351-374.
Johnstone, D.B. No date. Student loans in international perspective:promises andfailures, myths and partial truths. Buffalo: Center for Comparative and Global Studiesin Education. (Available at http://www.gse.buffalo.edu/fas/Johnston/index.htm.)
Kim, A.; Lee, Y. 2003. Student loans schemes in the Republic of Korea: review andecommendations. Bangkok: IIEP; UNESCO,Bangkok.
32
CMDR Monograph Series No. - 56
Kitaev, I.; Nadurata, T.; Resurrection, V.; Bernal, F. 2003. Student loans in thePhilippines: lessons from the past. Bangkok: IIEP;UNESCO Bangkok.
Kapur, D. and Mehta, P. B. (2004). Indian Higher Education Reform: From Half-Baked Socialism to Half-Baked Capitalism.
Kariwo, M. T. (2007). Widening Access in Higher Education in Zimbabwe. HigherEducation Policy, 20(1):45-59.
Lee, M. N. N. (2004). Global Trend, national Policies, and Intitutional Responses:Restructuring Higher Education in Malaysia. Educational Research for Policy andPractice, pages 31-46.17
Mincer,J (1974) Schooling, Experiences and Earnings, (NBER), Newyork.
Mohamad Fahmi(2007) Equity on Access of Low SES Group in the Massification ofHigher Education in Indonesia, Working Paper in Economics and DevelopmentStudies,NO.200709, Center for Economics and Development Studies, Department ofEconomics, Padjadjaran University, Indonesia, 7th October.
Narayana,M.R(2005) Sudent Loans by Commercial Banks-A Way to Reduce StateGovernment Financial support to Higher Education, Journal of Devloping Areas,38(2),Spring, 171-87.
Psacharopoulos, G., Tan, J.-P., and Jimenez, E. (1986). Financing Education inDeveloping Countries. The World Bank.
Psacharopoulos, G. (1991). Higher Education in Developing Countries: The Scenarioof the Future. Higher Education, 21(1):3-9.
Salmi, J. and Hauptman, A. M. (2006). Innovations in tertiary education financing : acomparative evaluation of allocation mechanisms.
Sanyal, B. C. and Martin, M. (2006). Higher Education in the World 2006: TheFinancing of Universities, chapter Financing Higher Education: InternationalPerspectives, pages IIEP; UNESCO Bangkok.
Shen, H. (2004) "The most urgent problem in student loans scheme in China:repayment." In: Harvard China Review, Spring, 93-97.
Loan Financing to Higher Education: Experiences of Bank Financing In A Less Developed Region
33
Stevenson, D. L. and Baker, D. P. (1992). Shadow education and allocation in formalschooling:
Transtition in University in Japan. American Journal of Sociology, 97(6):1639-1657.
Tilak, J.B.G(1992) Student Loans in Financing Higher Education in India, HigherEducation,23(4)(June):389-404.
_________(1999)Student Loans as the Answer to lack of Resources for HigherEducation, Economic and Political Weekly, 34(1-2)(January2-15):19.
_________(2007)Student loans and Financing of Higher Education in India, Journalof educational Planning and Administration,21(3) (July) 231-256.
The Task Force on Higher Education and Society (2000). Higher Education inDeveloping Countries: Peril and Promise. World Bank.
UNESCO (2003). Higher education in Asia and the Pacific 1998-2003. Technicalreport, UNESCO Asia and Pacific Regional Bureau for Education, Paris.
Varghese, N. V. (2004). Private Higher Education, chapter Patterns of ownership andoperation of private higher education institutions, pages 35-61. IIEP,UNESCO.18
Welch, A. R. (2006). Blurred Vision?: Public and Private Higher Education inIndonesia. Higher Education.
World Bank (2005). PROJECT INFORMATION DOCUMENT (PID): AppraisalStage. Technical Report AB1414, World Bank.
Ziderman, A. and Albrecht, D. (1994). Financing Universities in DevelopmentCountries. Routledge.Ziderman, A. and Albrecht, D. (1994). Financing Universitiesin Development Countries. Rout-ledge.
Ziderman, A. (1999) (July). The student loans scheme in Thailand: a review andrecommendations for efficient and equitable functioning of the scheme. Reportprepared for UNESCO Bangkok, as part of the Asian Development Bank LoanProgramme, in the framework of the Education
Management and Finance Study (Project TA 2997896-THA). Bangkok: UNESCO.
34
CMDR Monograph Series No. - 56
_______( 2002) "Financing student loans in Thailand: revolving fund or open-endedcommitment?" In: Economics of Education Review, 21(4), 367-380.
Ziderman, A( 2002) "Alternative objectives of national student loans schemes:implications for design, evaluation and policy." In: The Welsh ,Journal of Education,11(1), 37-47. Reprinted in: Peking University Journal of Education, April, 2004 (inChinese).
Ziderman, A ( 2003) Student loans in Thailand: are they effective , equitable,sustainable? Bangkok: IIEP; UNESCO Bangkok.
_____(2006) Student Loans in Thailand: From Social Targeting to Cost Sharing. Inter-national Higher Education, (42).
_____(2006) Policy options for student loan schemes: Lessons From five Asian CaseStudies, UNESCO,Bangkok

Loan Financing to Higher Education: Experiences of Bank Financing In A Less Developed Region
35

36
CMDR Monograph Series No. - 56

Loan Financing to Higher Education: Experiences of Bank Financing In A Less Developed Region
37
