local calibration of mepdg rutting model …docs.trb.org/prp/10-0710.pdf · hoegh, khazanovich,...
TRANSCRIPT

Hoegh, Khazanovich, Jensen
0
LOCAL CALIBRATION OF MEPDG RUTTING MODEL FOR MNROAD TEST
SECTIONS
Kyle Hoegh
Research Assistant
University of Minnesota
Department of Civil Engineering
500 Pillsbury Drive S.E.
Minneapolis, MN 55455
Phone: 612-626-4098
Fax: 612-626-7750
E-mail: [email protected]
Lev Khazanovich
Associate Professor
University of Minnesota
Department of Civil Engineering
500 Pillsbury Drive S.E.
Minneapolis, MN 55455
Phone: 612-624-4764
Fax: 612-626-7750
E-mail: [email protected]
Maureen Jensen
Manager, Road Research
Minnesota Department of Transportation
Office of Materials and Road Research
1400 Gervais Avenue
Maplewood, MN 55109
Phone: 651-366-5507
Fax: 651-779-5616
E-Mail: [email protected]
Paper submitted 31 July 2009
in consideration for
Transportation Research Board 89th Annual Meeting, January 10-14, 2010
Words: 4156
Figures: 10
Tables: 2
Photographs: 0
Total Word Count: 7156
TRB 2010 Annual Meeting CD-ROM Paper revised from original submittal.
Hoegh, Khazanovich, Jensen
1
LOCAL CALIBRATION OF MEPDG RUTTING MODEL FOR MNROAD TEST
SECTIONS
ABSTRACT
The AASHTO interim Mechanistic-Empirical Pavement Design Guide (MEPDG) was
recently introduced in the United States. Many State agencies have conducted validation
and local calibration of the MEPDG performance prediction models. In this study, time
history rutting performance data for pavement sections at the Minnesota Department of
Transportation (Mn/DOT) full-scale pavement research facility (MnROAD) have been
used for an evaluation and local calibration of the MEPDG rutting model. A detailed
comparison of the predicted total rutting, asphalt layer rutting, and measured rutting is
presented. The paper discusses why a conventional MEPDG model calibration was not
found to feasible and recommends a modification of the rutting model. It was found that
the locally calibrated model greatly improved the MEPDG rutting prediction for various
pavement designs in MnROAD conditions.
TRB 2010 Annual Meeting CD-ROM Paper revised from original submittal.
Hoegh, Khazanovich, Jensen
2
INTRODUCTION
Rutting is an important distress that is often evaluated to determine rehabilitation and
reconstruction needs in hot mix asphalt (HMA) pavements (1). A rut is a depression in
the wheel path of an HMA pavement, caused by consolidation of the pavement layers
and/or uplift in the pavement adjacent to the rut in the form of shoving. HMA pavements
tend to rut when exposed to hot summer days due to a decrease in asphalt binder
stiffness. Minimizing HMA pavement rutting is important in preventing accidents caused
by hydroplaning (2). The Minnesota Department of Transportation considers 0.5 inch the
level of rutting at which problems become severe (3). The MnROAD database contains
comprehensive performance data for rutting.
In this paper an evaluation and calibration of the rutting performance prediction
capabilities of the recently introduced AASHTO interim Mechanistic-Empirical
Pavement Design Guide Manual of Practice (MEPDG) was conducted for 12 mainline
hot mix asphalt pavement test sections at the Minnesota Department of Transportation
(Mn/DOT) full-scale pavement research facility (MnROAD) (4).
The MEPDG and related software provide capabilities for the analysis and performance
prediction of different types of flexible and rigid pavements. The MEPDG uses
mechanistic-empirical numerical models to analyze input data for traffic, climate,
materials and proposed structure. The models estimate damage accumulation over
service life. Performance predictions are made in terms of pavement distresses. The
MEPDG models were calibrated using the national pavement performance database (4).
After the MEPDG was introduced, verification and local calibrations have been
conducted throughout the United States by various agencies (5, 6, 7, 8, 9, 10). The
research in this study was conducted as part of the Mn/DOT and Local Road Research
Boart-sponsored Local calibration of the MEPDG for Minnesota conditions titled,
“Implementation of The MEPDG for New and Rehabilitated Pavement Structures for
Design of Concrete and Asphalt Pavements in Minnesota (10).” The research approach
for this paper involved the following steps:
• Identify pavement sections with known performance data.
• Obtain the MEPDG inputs that closely represent the asphalt MnROAD sections.
• Run the MEPDG software for flexible test sections to obtain predicted rutting.
• Compare predicted and measured rutting for asphalt test sections.
• Recalibrate rutting model of the MEPDG by adjusting the parameters to reduce
error between predicted and measured performance.
Details and results of the recalibration process for the MEPDG rutting model are
presented below.
TRB 2010 Annual Meeting CD-ROM Paper revised from original submittal.
Hoegh, Khazanovich, Jensen
3
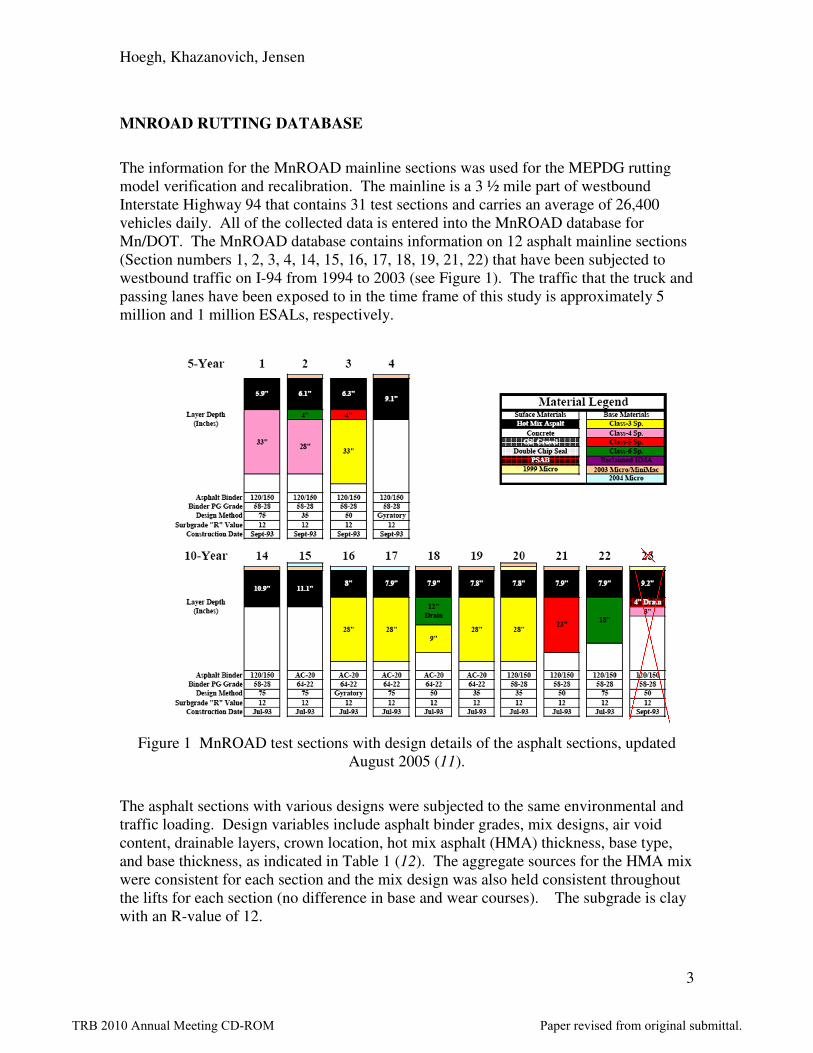
MNROAD RUTTING DATABASE
The information for the MnROAD mainline sections was used for the MEPDG rutting
model verification and recalibration. The mainline is a 3 ½ mile part of westbound
Interstate Highway 94 that contains 31 test sections and carries an average of 26,400
vehicles daily. All of the collected data is entered into the MnROAD database for
Mn/DOT. The MnROAD database contains information on 12 asphalt mainline sections
(Section numbers 1, 2, 3, 4, 14, 15, 16, 17, 18, 19, 21, 22) that have been subjected to
westbound traffic on I-94 from 1994 to 2003 (see Figure 1). The traffic that the truck and
passing lanes have been exposed to in the time frame of this study is approximately 5
million and 1 million ESALs, respectively.
Figure 1 MnROAD test sections with design details of the asphalt sections, updated
August 2005 (11).
The asphalt sections with various designs were subjected to the same environmental and
traffic loading. Design variables include asphalt binder grades, mix designs, air void
content, drainable layers, crown location, hot mix asphalt (HMA) thickness, base type,
and base thickness, as indicated in Table 1 (12). The aggregate sources for the HMA mix
were consistent for each section and the mix design was also held consistent throughout
the lifts for each section (no difference in base and wear courses). The subgrade is clay
with an R-value of 12.
TRB 2010 Annual Meeting CD-ROM Paper revised from original submittal.

Hoegh, Khazanovich, Jensen
4
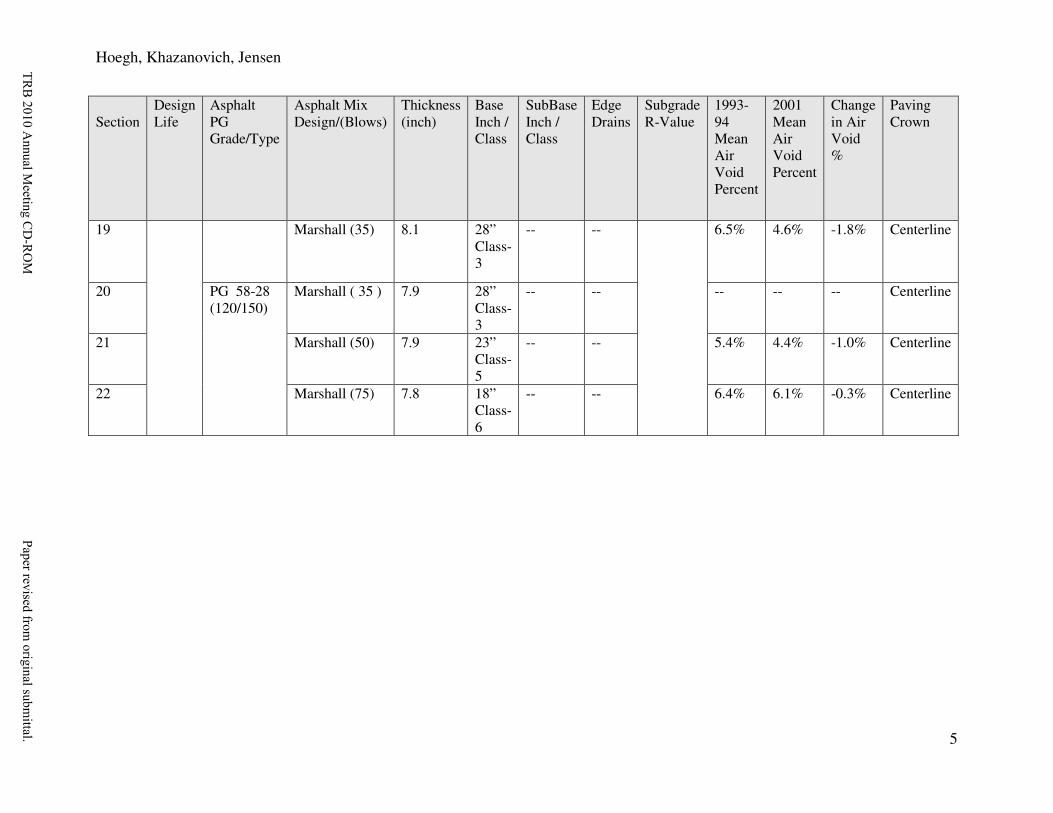
Table 1 Design parameters of the measured and predicted rutting sections (MnROAD 2008).
Section
Design
Life
Asphalt
PG
Grade/Type
Asphalt Mix
Design/(Blows)
Thickness
(inch)
Base
Inch /
Class
SubBase
Inch /
Class
Edge
Drains
Subgrade
R-Value
1993-
94
Mean
Air
Void
Percent
2001
Mean
Air
Void
Percent
Change
in Air
Void
%
Paving
Crown
1 5
Year
PG 58-28
(120/150)
Marshall (75) 5.9 33”
Class-
4
-- -- Clay
R-12
6.8% 5.7% -1.1% Quarter
2 Marshall (35) 6.2 4”
Class-
6
28”
Class-4
-- 4.5% 4.0% -0.5% Quarter
3 Marshall (50) 6.2 4”
Class-
5
33”
Class-3
-- 7.2% 4.6% -2.6% Quarter
4 Marshall (75) 9.1 -- -- -- 7.2% 6.0% -1.2% Quarter
14 10
Year
Marshall (75) 11.4 -- -- -- 6.0% 6.1% 0.1% Quarter
15 PG 64-22
(20)
Marshall (75) 11.4 -- -- -- 7.3% 7.1% -0.2% Quarter
16 Gyratory 8.2 28”
Class-
3
-- -- 7.8% 7.6% -0.2% Centerline
17 Marshall (75) 8.2 28”
Class-
3
-- -- 7.7% 6.4% -1.3% Centerline
18 Marshall (50) 8.1 10”
Class-
6
9”
Class-3
Yes 5.8% 5.3% -0.5% Centerline
TRB
2010 Annual M
eeting CD
-RO
MPaper revised from
original submittal.
Hoegh, Khazanovich, Jensen
5
Section
Design
Life
Asphalt
PG
Grade/Type
Asphalt Mix
Design/(Blows)
Thickness
(inch)
Base
Inch /
Class
SubBase
Inch /
Class
Edge
Drains
Subgrade
R-Value
1993-
94
Mean
Air
Void
Percent
2001
Mean
Air
Void
Percent
Change
in Air
Void
%
Paving
Crown
19 Marshall (35) 8.1 28”
Class-
3
-- -- 6.5% 4.6% -1.8% Centerline
20 PG 58-28
(120/150)
Marshall ( 35 ) 7.9 28”
Class-
3
-- -- -- -- -- Centerline
21 Marshall (50) 7.9 23”
Class-
5
-- -- 5.4% 4.4% -1.0% Centerline
22 Marshall (75) 7.8 18”
Class-
6
-- -- 6.4% 6.1% -0.3% Centerline
TRB
2010 Annual M
eeting CD
-RO
MPaper revised from
original submittal.

Hoegh, Khazanovich, Jensen
6
MnROAD rutting measurements were made approximately 3 times per year in the right
and left wheel path in both the truck and passing lanes for each section throughout the
period MnROAD has been open to traffic. Over 1300 truck and passing lane rutting
measurements from the MnROAD database were analyzed. An average of the right and
left wheel path rutting was used for the analysis. It is important to note that Section 20
failed and was rehabilitated with MicroSurfacing (1 Layer - 6 foot rut box filling) in both
lanes, July 1999, and was thus excluded from the analysis.
During the time period the rutting data for this study was collected (1994-2003),
MnROAD used 4 different methods to measure rutting over the life of the project. These
methods included measuring manually with a straightedge, using a PaveTech van
equipped with ultrasonic sensors, using a Pathways vehicle with laser sensors and 3-point
analysis, and using a newer Pathways vehicle with laser sensors and 5-point analysis.
Since the straightedge method was the only method used for the entire period, this
method was chosen to keep the collection method consistent from year to year. In this
method the rutting was measured by MnROAD staff manually using a 6-foot straightedge
with drill bits inserted underneath. By placing the six-foot straightedge on the rut, the
maximum rut depth at the specific location can be found. Figure 2 demonstrates this type
of rut depth measurement. The database used for this study was gathered by taking the
average of multiple rut depth measurements in the section. Two measurements were
taken for each section from 1994 to 1996, then 10 measurements were taken for each
section from 1997 to 2003 (3).
Figure 2 Straightedge method for measuring rut depth (3).
TRB 2010 Annual Meeting CD-ROM Paper revised from original submittal.
Hoegh, Khazanovich, Jensen
7
Measurements of the total rutting do not reveal the level of rutting in the individual layers
of the pavement system. To address this limitation, MnROAD personnel performed
several forensic studies which involved trenching of the flexible MnROAD sections.
Trenches were cut for two-thirds of the asphalt pavement sections in the mainline in
1998, while the remaining 6 sections were trenched in 2001. Detailed information on
these studies can be found in Mulvaney and Worel (3). Both studies indicated that the
majority of rutting only occurred in the upper lifts of the hot mix asphalt, with the
granular base and subgrade mostly unaffected for the sections evaluated in this study.
The forensic evaluation provided useful additional information for MEPDG calibration.
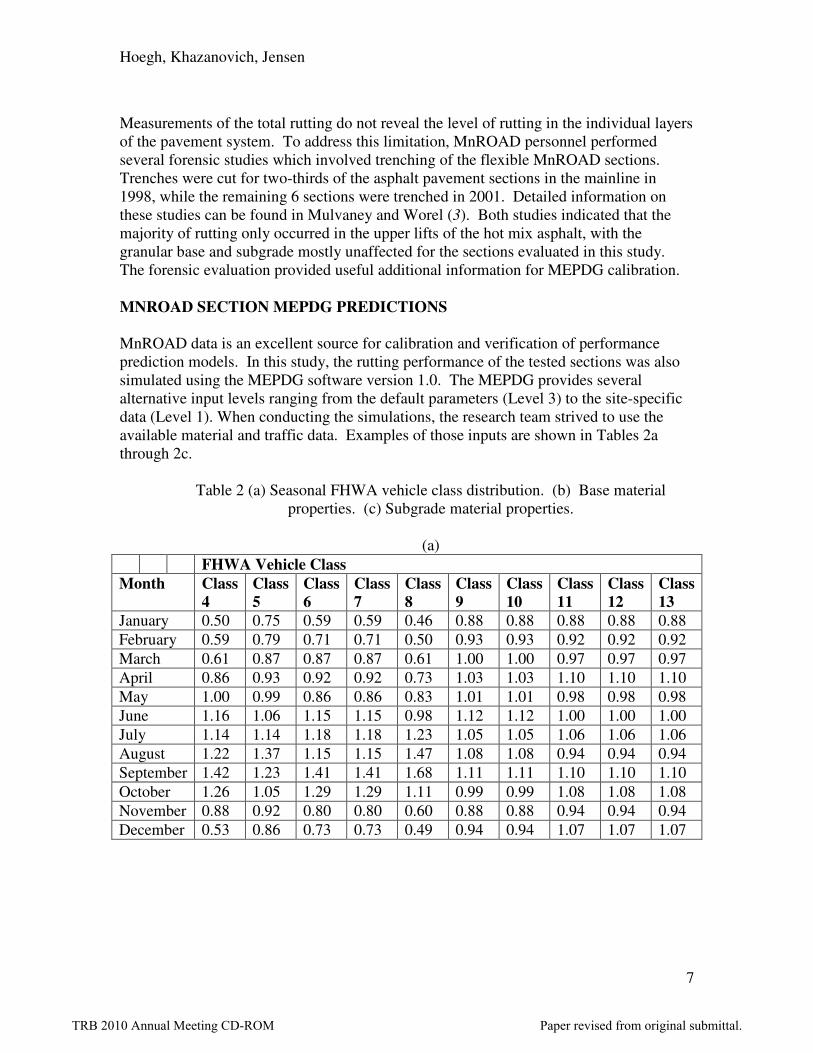
MNROAD SECTION MEPDG PREDICTIONS
MnROAD data is an excellent source for calibration and verification of performance
prediction models. In this study, the rutting performance of the tested sections was also
simulated using the MEPDG software version 1.0. The MEPDG provides several
alternative input levels ranging from the default parameters (Level 3) to the site-specific
data (Level 1). When conducting the simulations, the research team strived to use the
available material and traffic data. Examples of those inputs are shown in Tables 2a
through 2c.
Table 2 (a) Seasonal FHWA vehicle class distribution. (b) Base material
properties. (c) Subgrade material properties.
(a)
FHWA Vehicle Class
Month Class
4
Class
5
Class
6
Class
7
Class
8
Class
9
Class
10
Class
11
Class
12
Class
13
January 0.50 0.75 0.59 0.59 0.46 0.88 0.88 0.88 0.88 0.88
February 0.59 0.79 0.71 0.71 0.50 0.93 0.93 0.92 0.92 0.92
March 0.61 0.87 0.87 0.87 0.61 1.00 1.00 0.97 0.97 0.97
April 0.86 0.93 0.92 0.92 0.73 1.03 1.03 1.10 1.10 1.10
May 1.00 0.99 0.86 0.86 0.83 1.01 1.01 0.98 0.98 0.98
June 1.16 1.06 1.15 1.15 0.98 1.12 1.12 1.00 1.00 1.00
July 1.14 1.14 1.18 1.18 1.23 1.05 1.05 1.06 1.06 1.06
August 1.22 1.37 1.15 1.15 1.47 1.08 1.08 0.94 0.94 0.94
September 1.42 1.23 1.41 1.41 1.68 1.11 1.11 1.10 1.10 1.10
October 1.26 1.05 1.29 1.29 1.11 0.99 0.99 1.08 1.08 1.08
November 0.88 0.92 0.80 0.80 0.60 0.88 0.88 0.94 0.94 0.94
December 0.53 0.86 0.73 0.73 0.49 0.94 0.94 1.07 1.07 1.07
TRB 2010 Annual Meeting CD-ROM Paper revised from original submittal.

Hoegh, Khazanovich, Jensen
8
(b)
Gradation and Plasticity Index
Plasticity Index, PI: 1
Liquid Limit (LL) 6
Compacted Layer No
Passing #200 sieve (%): 7.5
Passing #40 22.5
Passing #4 sieve (%): 77.5
D10(in) 0.00359
D20(in) 0.1992
D30(in) 0.5682
D60(in) 1.815
D90(in) 10.9
(c)
Subgrade Resilient Modulus
at optimum moisture content
13,000 psi
Sieve Percent Passing
#200 7.5
#80 20.8
#40 22.5
#10 62.5
#4 77.5
3/8" 87.5
1/2" 92.5
3/4" 95
1" 97.5
1 ½" 100
However, properties of the asphalt layer were characterized using Level 3 based on the
asphalt binder grade. In the process of the MEPDG version 1.0 software validation, a
bug in the MEPDG software was found. A significant difference was found between the
rutting predictions from level 2 and level 3 inputs, respectively, for the same flexible
pavement and site conditions (see figure 3). The binder behavior predictions from level 2
inputs (see figure 2a) were found to be inconsistent with the input information due to a
bug in the MEPDG software which did not affect level 3 analyses. Based on this
analysis, for the purpose of this study the asphalt mix characterization was limited to
level 3 inputs (see figure 4b). It should be noted that this bug in the MEPDG software
can be easily fixed (El-Basyouny, M., personal communication), so use of levels 1 and 2
can improve the accuracy of the predictions in the future studies (13).
TRB 2010 Annual Meeting CD-ROM Paper revised from original submittal.

Hoegh, Khazanovich, Jensen
9
0
0.05
0.1
0.15
0.2
0.25
0.3
0 2 4 6 8 10 12
Ru
ttin
g (
in)
Years
Level 3
Level 2
Figure 3 Example case were the rutting vs. time was significantly different for level 2 and
level 3 analysis.
TRB 2010 Annual Meeting CD-ROM Paper revised from original submittal.

Hoegh, Khazanovich, Jensen
10
(a)
(b)
Figure 4 (a) Level 2 input parameters for asphalt binder (same as Level 1) (b) Level 3
input parameters for asphalt binder.
TRB 2010 Annual Meeting CD-ROM Paper revised from original submittal.
Hoegh, Khazanovich, Jensen
11
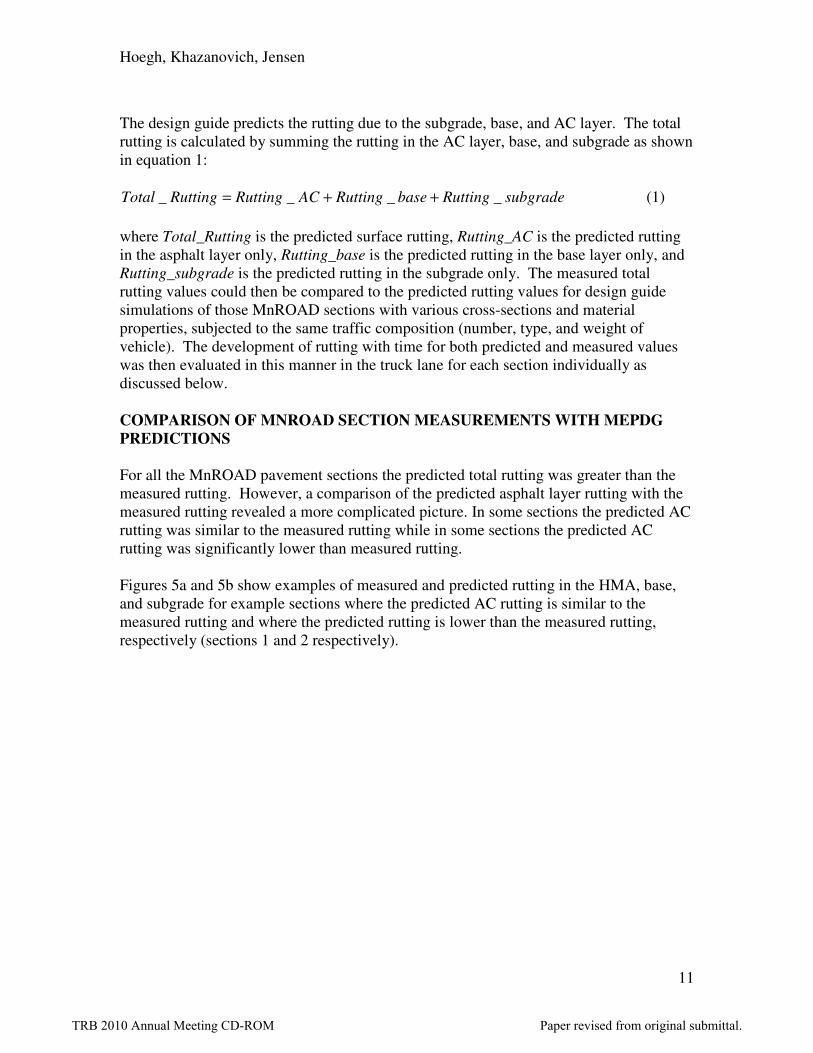
The design guide predicts the rutting due to the subgrade, base, and AC layer. The total
rutting is calculated by summing the rutting in the AC layer, base, and subgrade as shown
in equation 1:
subgradeRuttingbaseRuttingACRuttingRuttingTotal ____ ++= (1)
where Total_Rutting is the predicted surface rutting, Rutting_AC is the predicted rutting
in the asphalt layer only, Rutting_base is the predicted rutting in the base layer only, and
Rutting_subgrade is the predicted rutting in the subgrade only. The measured total
rutting values could then be compared to the predicted rutting values for design guide
simulations of those MnROAD sections with various cross-sections and material
properties, subjected to the same traffic composition (number, type, and weight of
vehicle). The development of rutting with time for both predicted and measured values
was then evaluated in this manner in the truck lane for each section individually as
discussed below.
COMPARISON OF MNROAD SECTION MEASUREMENTS WITH MEPDG
PREDICTIONS
For all the MnROAD pavement sections the predicted total rutting was greater than the
measured rutting. However, a comparison of the predicted asphalt layer rutting with the
measured rutting revealed a more complicated picture. In some sections the predicted AC
rutting was similar to the measured rutting while in some sections the predicted AC
rutting was significantly lower than measured rutting.
Figures 5a and 5b show examples of measured and predicted rutting in the HMA, base,
and subgrade for example sections where the predicted AC rutting is similar to the
measured rutting and where the predicted rutting is lower than the measured rutting,
respectively (sections 1 and 2 respectively).
TRB 2010 Annual Meeting CD-ROM Paper revised from original submittal.

Hoegh, Khazanovich, Jensen
12
0
0.1
0.2
0.3
0.4
0.5
0.6
0.7
0.8
0 2 4 6 8 10 12
Ru
ttin
g (
in)
Pavement Age (years)
Predicted Total Rutting
Measured Total Rutting
Predicted AC Rutting
Predicted Subgrade Rutting
similar measured total
rutting and predicted
AC rutting
(a)
0
0.1
0.2
0.3
0.4
0.5
0.6
0.7
0 2 4 6 8 10 12
Ru
ttin
g (
in)
Pavement Age (years)
Predicted Total Rutting
Measured Total Rutting
Predicted AC Rutting
Predicted Base Rutting
Predicted Subgrade Rutting
(b)
Figure 5 (a) Measured and predicted rutting over the pavement age for section 1. (b)
Measured and predicted rutting over the pavement age for section 2.
TRB 2010 Annual Meeting CD-ROM Paper revised from original submittal.

Hoegh, Khazanovich, Jensen
13
It can be observed in Figure 5a that the predicted HMA rutting is similar to the total
measured rutting for the entire 10 year period. Since the MnROAD forensic studies
showed that most of the measured rutting occurred in the HMA layer, the MEPDG
rutting model is fairly accurate in predicting rutting in the HMA layer, but the MEPDG
subgrade and base rutting models grossly overestimate rutting for the sections where the
AC rutting is similar to the measured rutting. Therefore, the base and subgrade rutting
model for these sections should be excluded from rutting prediction.
However, the previous observations do not hold true for most of the sections. For most
sections, use of only the predicted rutting in the asphalt layer would greatly under-predict
the rutting as shown in Figure 5b. However, use of the MEPDG total rutting model
described in equation 1 would cause gross over-prediction, especially at early age.
Therefore, to avoid under-prediction of the rutting model it is important to account for the
base and subgrade. At the same time, the base and subgrade rutting model should be
modified to avoid over-prediction of rutting, especially during early pavement ages.
Unfortunately, there is not a distinguishable design characteristic between the sections
where the AC rutting predictions are similar to the measured total rutting and the sections
where the AC rutting predictions are significantly lower than the measured total rutting.
As would be expected, sections with differing design parameters showed different
performance trends. However, some sections with very similar design parameters also
show the different performance trends discussed above when looking at the predicted
versus measured rutting (e.g. sections 1 and 2). Further investigation of the base and
subgrade rutting prediction at early pavement age identified a consistently unrealistic
high rutting prediction for the first month of pavement life. As can be observed from
Figure 5b after the first month of a pavement life, section 2 exhibited subgrade rutting of
0.08 inches. However, the predicted rutting after 10 years of pavement life in the
subgrade was 0.18 inches. The cumulative number of heavy trucks after one month and
ten years was 31,000 and 4.7 million, respectively. In the simulation, it was assumed that
the pavement was opened to traffic in August. Although the pavement received less than
1% of heavy truck traffic in the first month of the life of the pavement, it was predicted to
accumulate almost 50% of the subgrade rutting, making it the highest monthly rutting
accumulation during the pavement life. Furthermore, all subsequent rutting accumulation
in August was negligible. Similar observations were made in the base layer predictions.
Therefore it can be concluded that the first month subgrade and base rutting predictions
are unrealistic and should be excluded during analysis.
The MEPDG simulations were made using the nationally calibrated model. Therefore,
the MEPDG manual of practice recognizes a need for the local calibration (4). The
MEPDG software provides an option for modification of the coefficients of the
performance models to account for local conditions. However, because of the
observations presented above, a calibration of the rutting model which involves only an
adjustment of the calibration parameters was not feasible. The following modification of
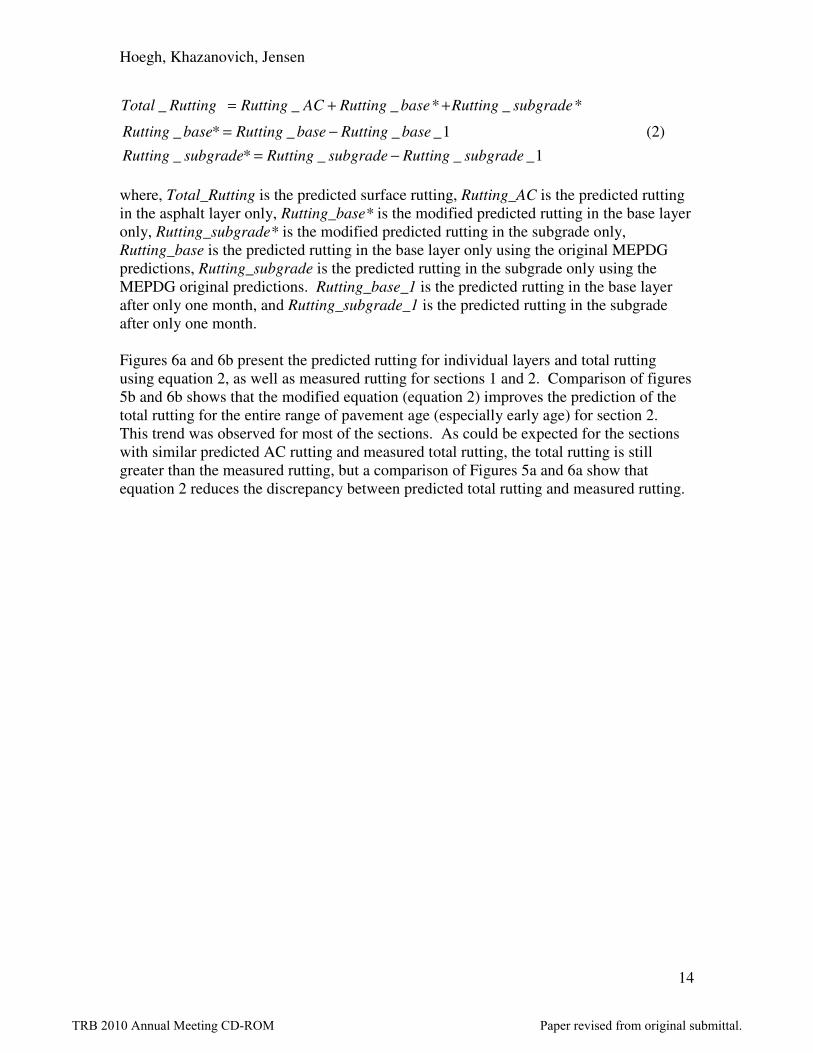
the MEPDG rutting model is proposed in this study:
TRB 2010 Annual Meeting CD-ROM Paper revised from original submittal.
Hoegh, Khazanovich, Jensen
14
1___*_
1___*_
*_*___
subgradeRuttingsubgradeRuttingsubgradeRutting
baseRuttingbaseRuttingbaseRutting
subgradeRuttingbaseRuttingACRuttingRuttingTotal
−=
−=
++=
(2)
where, Total_Rutting is the predicted surface rutting, Rutting_AC is the predicted rutting
in the asphalt layer only, Rutting_base* is the modified predicted rutting in the base layer
only, Rutting_subgrade* is the modified predicted rutting in the subgrade only,
Rutting_base is the predicted rutting in the base layer only using the original MEPDG
predictions, Rutting_subgrade is the predicted rutting in the subgrade only using the
MEPDG original predictions. Rutting_base_1 is the predicted rutting in the base layer
after only one month, and Rutting_subgrade_1 is the predicted rutting in the subgrade
after only one month.
Figures 6a and 6b present the predicted rutting for individual layers and total rutting
using equation 2, as well as measured rutting for sections 1 and 2. Comparison of figures
5b and 6b shows that the modified equation (equation 2) improves the prediction of the
total rutting for the entire range of pavement age (especially early age) for section 2.
This trend was observed for most of the sections. As could be expected for the sections
with similar predicted AC rutting and measured total rutting, the total rutting is still
greater than the measured rutting, but a comparison of Figures 5a and 6a show that
equation 2 reduces the discrepancy between predicted total rutting and measured rutting.
TRB 2010 Annual Meeting CD-ROM Paper revised from original submittal.

Hoegh, Khazanovich, Jensen
15
0
0.1
0.2
0.3
0.4
0.5
0.6
0 2 4 6 8 10 12
Ru
ttin
g (
in)
Pavement Age (years)
Predicted Total Rutting
Measured Total Rutting
Predicted AC Rutting
Predicted Subgrade Rutting
(a)
(b)
Figure 6 (a) Section 1 predicted rutting using equation 2. (b) Section 2 predicted and
measured rutting versus pavement age using equation 2.
TRB 2010 Annual Meeting CD-ROM Paper revised from original submittal.

Hoegh, Khazanovich, Jensen
16
To further illustrate predictive improvement of equation 2 versus equation 1, consider
measured and predicted total rutting after 10 years of pavement life. Figures 7a and 7b
show the comparison of measured versus predicted rutting after 10 years of pavement
exposure using equations 1 and 2, respectively. It can be observed that the rutting
predictions using equation 2 are less biased than the predictions using equation 1.
Moreover, equation 1 greatly over-predicted the rutting (> 75% difference) for 4 sections
(sections 1, 3, 16, 17), and over-predicted rutting for all other sections except sections 19
and 21. Equation 2 only slightly under-predicts rutting for sections 19 and 21, fairly
accurately predicts rutting for the remaining sections in group B, and over-predicts the
rutting in group A to a lesser extent than equation 1. The advantages of the modified
equation are even more obvious for prediction after five years (see figure 8). Equation 1
over-predicted rutting for all of the sections (generally greatly over-predicted), while
equation 2 provided much better correspondence with the measured values. Figure 9
shows the measured versus equation 2 predicted rutting levels after 5 and 10 years of
traffic. It can be observed that equation 2 provides a reasonable estimate of the total
rutting in the truck lane for the MnROAD sections evaluated in this study.
TRB 2010 Annual Meeting CD-ROM Paper revised from original submittal.

Hoegh, Khazanovich, Jensen
17
0.0
0.1
0.2
0.3
0.4
0.5
0.6
0.7
0.8
0.9
1.0
0.0 0.2 0.4 0.6 0.8 1.0
Me
asu
red
Ru
ttin
g (
in)
Predicted Rutting (in)
(a)
0.0
0.1
0.2
0.3
0.4
0.5
0.6
0.7
0.8
0.9
1.0
0.0 0.2 0.4 0.6 0.8 1.0
Me
asu
red
Ru
ttin
g (
in)
Predicted Rutting (in)
(b)
Figure 7 (a) Measured versus predicted rutting after 10 years without subtraction of the
initial base and subgrade rutting jump (using equation 1). (b) 10 year total rutting after
the correction for the initial subgrade and base rutting (using equation 2).
TRB 2010 Annual Meeting CD-ROM Paper revised from original submittal.

Hoegh, Khazanovich, Jensen
18
0.0
0.2
0.4
0.6
0.8
1.0
1.2
0.0 0.5 1.0 1.5
Me
asu
red
Ru
ttin
g (in
)
Predicted Rutting (in)
Equation 1 Rutting
after 5 years
Equation 2 rutting
after 5 years
Figure 8 Total rutting predictions from equations 1 and 2 vs measured rutting after 5
years.
0.0
0.1
0.2
0.3
0.4
0.5
0.6
0.7
0.8
0.9
1.0
0.0 0.1 0.2 0.3 0.4 0.5 0.6 0.7 0.8 0.9 1.0
Me
asu
red
Ru
ttin
g (
in)
Predicted Rutting (in)
Figure 9 Predicted versus measured total rutting after five and 10 years (using equation
2).
TRB 2010 Annual Meeting CD-ROM Paper revised from original submittal.

Hoegh, Khazanovich, Jensen
19
As discussed earlier, the rutting was measured in the passing lane as well as the truck
lane. This gives information about the effect of a different traffic mixes on rutting during
the same time period and the same climate. Figure 10 presents the comparison between
measured and predicted rutting using equation 2 for both passing lane and truck lanes
after 5 and 10 years in service. It can be observed that a reasonably good correspondence
is achieved between measured and predicted rutting despite a wide range of design
features, different traffic mixes, and different pavement ages. This suggests that the
modified rutting model provided by equation 2 is an improvement over the original
rutting model for Minnesota conditions.
0.0
0.1
0.2
0.3
0.4
0.5
0.6
0.7
0.8
0.9
1.0
0.0 0.2 0.4 0.6 0.8 1.0
Me
asu
red
Ru
ttin
g (
in)
Predicted Rutting (in)
Figure 10 Truck and passing lane predicted and measured rutting after 5 and 10 years
(using equation 2).
RECCOMENDATIONS FOR MINNESOTA CONDITIONS
Based on the results of this analysis, the following procedure is recommended for rutting
prediction:
1. Run the MEPDG version 1.0 software. Determine the rutting in each layer at the
end of the design period, and rutting in the base and subgrade layers for the first
month for the 50% reliability level.
2. Using equation 2, determine the total rutting at the end of the design period at the
50% reliability level.
3. Using the output from the design guide, find the rutting corresponding to the
specified reliability.
TRB 2010 Annual Meeting CD-ROM Paper revised from original submittal.

Hoegh, Khazanovich, Jensen
20
CONCLUSIONS
As specified in the manual of practice there is a need for MEPDG model calibration
based on local conditions. The time history rutting performance data available for 12
pavement test sections at the Minnesota Department of Transportation (Mn/DOT) full-
scale pavement research facility (MnROAD) allowed for a comprehensive evaluation and
calibration of the rutting performance capabilities of the MEPDG for local conditions.
The comparison of the predicted and measured rutting showed the need for a
recalibration of the MEPDG rutting model that did not involve an adjustment of the
calibration parameters as is typically recommended. This was due to the presence of two
groups of predicted rutting behavior with no distinguishable design characteristics
between them. However, forensics showed that the granular base and subgrade was
mostly unaffected for the sections evaluated in this study. Further investigation of the
subgrade and base models showed unrealistically high rutting predictions in the first
month of pavement life. A modified MEPDG model was created to account for the
forensic and predictive evaluations for the local conditions.
The locally calibrated rutting predictions were found to be less biased than the
predictions using the nationally calibrated rutting model. After applying the modified
model for comparison with data collected at a different time, and for data collected in the
passing lane it was concluded that a reasonably good correspondence is achieved. Thus a
procedure to apply the modified rutting model was developed and recommended for use
to improve the rutting prediction over the nationally calibrated model for conditions
similar to those at MnROAD.
ACKNOWLEDGEMENTS
The authors acknowledge the contributions of Dr. Mihai Marasteanu, Raul Velasquez,
and Aishwarya Vijaykumar for their work on the research project “Implementation of the
MEPDG for New and Rehabilitated Pavement Structures for Design of Concrete and
Asphalt Pavements in Minnesota.” that was the basis of this paper. The authors would
also like to acknowledge the work of Ben Worel and Tim Clyne in creating the
MnROAD rutting database that was used in this study.
TRB 2010 Annual Meeting CD-ROM Paper revised from original submittal.
Hoegh, Khazanovich, Jensen
21
REFERENCES
1. A. Shalaby and A. Reggin. Maximum-Likelihood Classification of Pavement
Surface Condition Data in Urban Road Networks. Transportation Research Board
Annual Meeting 2006 Paper #06-0904.
http://pubsindex.trb.org/document/view/default.asp?lbid=776588. Accessed July
2006.
2. Y. Huang. Pavement Analysis and Design. Second Edition. Pearson Prentice
Hall. Upper Saddle River, NJ. 2004
3. Mulvaney, R. and B. Worel. MnROAD Mainline Rutting Forensic Investigation.
Commercially Unpublished Report to the Office of Materials and Road Research.
Minnesota Department of Transportation, 2002.
4. AASHTO. Mechanistic-Empirical Pavement Design Guide, Interim Edition: A
Manual of Practice. American Association of State Highway and Transportation
Officials (AASHTO), Washington, DC., 2008.
5. Kannekanti, V. and Harvey, J. Sensitivity Analysis of 2002 Design Guide Distress
Prediction Models for Jointed Plain Concrete Pavement. DOI 10.3141/1947-09
Journal Transportation Research Record: Journal of the Transportation Research
Board Volume 1947 / 2006.
6. J. Li, S.T. Muench, J. P. Mahoney, N. Sivaneswaran, and L. M. Pierce.
Calibration of NCHRP 1-37A Software for the Washington State Department of
Transportation: Rigid Pavement Portion. DOI 10.3141/1949-05 Journal
Transportation Research Record: Journal of the Transportation Research Board.
Volume 1949 / 2006.
7. S. Schram and M. Abdelrahman. Improving Prediction Accuracy in Mechanistic-
Empirical Pavement Design Guide. DOI 10.3141/1947-06. Journal Transportation
Research Record: Journal of the Transportation Research Board. Volume 1947 /
2006.
8. R. L. Carvalho, C. W. Schwartz. Comparisons of Flexible Pavement Designs:
AASHTO Empirical Versus NCHRP Project 1-37A Mechanistic-Empirica.l
Journal Transportation Research Record: Journal of the Transportation Research
Board. Transportation Research Board of the National Academies. ISSN 0361-
1981. Volume 1947 / 2006.
9. N.R. Muthadi and Y. R. Kim. Local Calibration of Mechanistic-Empirical
Pavement Design Guide for Flexible Pavement Design. DOI 10.3141/2087-14.
Journal Transportation Research Record: Journal of the Transportation Research
Board. Volume 2087 / 2008.
10. Velasquez, R. et al. Implementation of the MEPDG for New and Rehabilitated
Pavement Structures for Design of Concrete and Asphalt Pavements in
Minnesota. University of Minnesota – Twin Cities. Mn/DOT Report No. MN/RC
2009-06. January 2009.
11. MnROAD Mainline and Low Volume Test Road Main Page. Minnesota Road
Research Project, Minnesota Department of Transportation.
http://www.mrr.dot.state.mn.us/research/section_info/trackml_lv.asp. Accessed
July 2006.
TRB 2010 Annual Meeting CD-ROM Paper revised from original submittal.

Hoegh, Khazanovich, Jensen
22
12. Tompkins, D. and L. Khazanovich. MnROAD Lessons Learned. Report MN-RC-
2007-16. Minnesota Department of Transportation. Saint Paul, MN, USA.
January 2007.
13. Assistant Professor Research, School of Sustainable Engineering and the Built
Environment, Civil Engineering, Arizona State University. July 2009.
TRB 2010 Annual Meeting CD-ROM Paper revised from original submittal.