local domestic chickens: their potential and
TRANSCRIPT

i
LOCAL DOMESTIC CHICKENS: THEIR POTENTIAL AND IMPROVEMENT
By
Kwaku Adomako (BSc.)
A Thesis submitted to the Department of Animal Science, Kwame Nkrumah
University of Science and Technology in Partial Fulfillment of the Requirements
for the Degree of
DOCTOR OF PHILOSOPHY
Department of Animal Science
Faculty of Agriculture
College of Agriculture and Renewable Natural Resources
September, 2009

ii
DECLARATION
I hereby declare that this submission is my own work towards the Doctor of Philosophy
(PhD) and that, to the best of my knowledge, it contains no material previously
published by another person nor material which has been accepted for the award of any
other degree of the University, except where due acknowledgment has been made in the
text.
………………………….…... ………………… ………………
Student Name & ID Signature Date
Certified by:
…………………………… …………………………. ………………
Supervisor (s) Signature Date
Certified by:
…………………………….. ……………………… ……………….
Head of Department Signature Date

iii
ABSTRACT
This study was conducted to assess the potential of indigenous chickens and improve
their performance in traits of economic importance by incorporating in them the naked
neck and frizzle genes, and also genes from a commercial layer (exotic breed) through
crossbreeding (local naked neck/frizzle males × commercial females).
Study One
A survey was conducted to assess the current performance of local chickens in the
Ashanti Region of Ghana. One-hundred and thirty five (135) local chicken keepers from
Bosomtwe Atwima-Kwanwoma, Ejisu-Juaben and Asante-Akim South Districts were
interviewed. All the keepers practised the extensive system of production with flock
sizes averaging 22 in the ratio of 4: 6: 12 for cocks, hens and chicks respectively. A
small amount of feed supplement was given either everyday or occasionally. Mortality
of chicks (between day-old and six weeks) and total mortality (annual mortality for the
entire flock) were 50% and 65% respectively. The average weights of cocks, hens and
eggs were 1.55kg, 1.13kg and 42.80g respectively. The clutch size per bird ranged from
9-13. The major challenges faced by the keepers included diseases, predation, lack of
funds to increase stock and construct structures, small sizes of birds and eggs, low
numbers of eggs laid and poor fertility of eggs. Local birds provide immense benefits
for keepers but their productivity is significantly hindered by genetic and management
problems.
Study Two
Another survey was conducted to evaluate the potential of indigenous naked neck
(Nana) and frizzle (Ff) birds within the indigenous chicken population in the Ashanti

iv
Region of Ghana. The study involved ninety (90) interviewees who were local chicken
keepers in Bosomtwe Atwima-Kwanwoma, Ejisu-Juaben and Asante-Akim South
Districts. Average body weight of Nana cocks did not differ significantly (P>0.05) from
Ff & nana/ff (normal feathered) ones while Nana hens were significantly (P>0.05)
heavier than Ff birds, but nana/ff birds did not differ significantly (P>0.05) from the
two genotypes. Nana layers were significantly superior (P<0.05) in egg size, number of
eggs per clutch and number of eggs per bird per year to Ff layers which were
significantly better than nana/ff layers. However, clutches of eggs per year did not show
any significant difference (P>0.05) among the three genotypes. Eggs from Ff layers had
a significantly higher (P<0.05) hatchability compared to those from Nana & nana/ff
layers. Eggs from Nana layers were significantly better (P>0.05) in Haugh unit and egg
shell thickness compared to those from Ff & nana/ff layers and eggs from Ff layers
were significantly better (P>0.05) in Haugh unit compared to those from nana/ff layers.
Mortality was significantly lower (P>0.05) in Nana birds followed by Ff & nana/ff birds
respectively. The carcass of Nana birds had a significantly higher (P>0.05) dressing
percentage than that of Ff and nana/ff birds. Naked neck and frizzle genes improve the
productivity of local birds but the naked neck gene appears to be more effective than the
frizzle gene.
Study Three
The first mating in Experiment Three was between four indigenous naked neck males
and thirty-six Lohmann commercial females in a ratio of 1: 9. This produced offspring
in the proportion of 48.7% Nana to 51.3% nana in the F1 generation. Nana birds were
significantly better (P<0.05) in body weight, body weight gain, number of eggs per

v
clutch, hen-housed and hen-day rates of lay, egg size, Haugh unit, shell thickness,
survivability and carcass yield, than their nana counterparts. However, age at first egg
and egg size to body weight ratio were significantly better in the nana birds compared
to the Nana ones. In the second mating, ten males and one hundred females of F1 Nana
birds were selected and mated inter se in a ratio of 1:10. This produced 16.8% NaNa,
54.5% Nana and 28.7% nana offspring in the F2 generation. It was observed that Nana
and NaNa birds were significantly higher (P<0.05) in body weight, body weight gain,
number of eggs per clutch, hen-housed and hen-day rates of lay, egg size, Haugh unit,
shell thickness, survivability and carcass yield, compared to their nana counterparts.
However, chick survivability was significantly better (P<0.05) in the nana birds
compared to Nana and NaNa ones. Using birds that show the naked neck phenotype in
local chicken production will enhance productive and reproductive performances
significantly.
Study Four
Five local frizzle males were mated to forty Lohmann commercial females in a ratio of
1:8. This produced almost equal numbers of offspring, that is 50.2% Ff and 49.8% ff in
the F1 generation. The Ff birds were significantly superior (P<0.05) to their ff
counterparts in terms of body weight, number of eggs per clutch, hen-housed and hen-
day rates of lay, Haugh unit and carcass yield. However, survivability was significantly
better (P<0.05) in the ff birds compared to the Ff birds. The second mating was made
between ten males and one-hundred females of F1 Ff birds. It was done inter se in a
ratio of 1:10. This produced offspring in the proportion of 22.4% FF, 51.5% Ff and
26.1% ff in the F2 generation. The F2 Ff and FF birds were significantly higher (P<0.05)
vi
than their ff counterparts in number of eggs per clutch, hen-housed and hen-day rates of
lay, Haugh unit, shell thickness, survivability and carcass yield. However, body weight,
body weight gain, egg size and chick mortality did not differ significantly between the
frizzles and the ff genotypes. Using frizzle (FF, Ff) hybrids in local chicken production
will increase productivity markedly, though to a lesser extent than the naked necks
(NaNa, Nana).
Study Five
In a comparative study involving all the five genotypes (NaNa, Nana, FF, Ff and
nana/ff) reared under intensive, semi-intensive and extensive management systems, it
was observed that the NaNa and Nana birds performed better (P<0.05) than their FF
and Ff counterparts in body weight, body weight gain, number of eggs per clutch, hen-
housed and hen-day rates of lay, egg size, Haugh unit, shell thickness, carcass yield and
economics of production. It was also economically most profitable to rear all the
genotypes (NaNa, Nana, FF, Ff & nana/ff) under the semi-intensive system followed by
the extensive and the intensive systems respectively. Aside genetic improvements,
rearing local birds under the semi-intensive system will improve profitability
significantly.

vii
TABLE OF CONTENT
Chapter Page
DECLARATION…………………………………………………………………. ii
ABSTRACT…………………………………………………………………...….. iii
TABLE OF CONTENTS…………………………………………………………. vii
LIST OF TABLES……………………………………….……………………….. xvi
LIST OF FIGURES……………………….……………………………………… xxi
ACKNOWLEDGMENT…………..…………………………………………….. xxiii
1.0 INTRODUCTION……………………………………………………………. 1
2.0 REVIEW OF THE LITERATURE…………………………………………. 4
2.1.0 Local Chickens and their Production………………………………..………. 4
2.1.1 Origin………………………….…………………………………………...... 4
2.1.2 Potential of Local Chickens…………………………………………………. 5
2.1.3 Feeding Management………………………….…………………..………. 6
2.1.4 Housing……….…………………………………...…………………………. 8
2.1.5 Health and Disease Control………………...………………….…………… 9
2.1.6 Economic Importance of Keeping Local Birds………………………..…….. 10
2.1.7 Performance of Local Chickens……………...……………………………… 11
2.1.7.1 Broodiness in Local Birds…………………………...…….………………. 15
2.1.7.2 Mortality under the Local System………………………………………… 17
2.1.8 Systems of Production of Local Birds………………….……..….……….. 18
2.1.9 The Way Forward in Local Chicken production………………………….… 20
2.2.0 Crossbreeding of Local Birds………………………………. ……....…… 22
2.3.0 Mutant Genes in Chickens…………………………………………………… 23
2.3.1The Naked Neck Gene and its Effects on the Performance of Chickens….. 24
2.3.2 The Frizzling Gene and its Effects on the Performance of Chickens……….. 32

viii
3.0 MATERIALS AND METHODS…………………………………….……… 37
3.0.1 Introduction……………………….………………………………………… 37
3.1 STUDY ONE………………………………….….…………………………. 38
3.1.1 Study Areas and Duration………………………………………………....... 38
3.1.2 Data Collection…………………………...…………………..……………... 38
3.1.2.1 Weights of Birds and Eggs……………………………..………………….. 39
3.1.2.2 Profitability of Production……………………..…………….…………… 39
3.1.2.3 Health of Birds………………………………………………….…………. 39
3.1.2.4 Mortality………………………………………………..…………………. 39
3.1.3 Analysis of Data…….………………………...….…………………………. 40
3.2 STUDY TWO…………………………………….………………………….. 41
3.2.1 Study Areas and Duration……………………………………….………….. 41
3.2.2 Data Collection……………………………………….……………………… 41
3.2.2.1 Weights of Birds and Eggs…………………………………………..……. 42
3.2.2.2 Mortality………………………………..………………………………...... 42
3.2.2.3 Egg Quality Parameters……………………...………..…………………… 42
3.2.2.4 Carcass Parameters……………………..………..………………………… 43
3.2.3 Analysis of Data…………………………………………………………….. 44
3.3 STUDY THREE……………….……………………………………………. 45
3.3.1 Location and Duration of Experiment………………………………………. 45
3.3.2 Experimental Birds………………………………...………………………… 45
3.3.2.1 Management ……………………………...……………………………….. 46
3.3.2.2 Incubation…………………………….…………………………………… 46
3.3.2.3 Chick Rearing…………….……………………………………………….. 47
3.3.2.4 Parent Stock for the Second Generation Birds…………….……………… 47
3.3.2.5 Mating Involving Indigenous Naked Necked and Commercial Layer…… 48
3.3.2.6 Selection and Training of Chicken Keepers……..………………….…... 49

ix
3.3.2.7 Chicks Transfer and Rearing at the Villages……………..………………... 49
3.3.3 Data Collection……………...……………………………………………….. 50
3.3.3.1 First Parent Stock………………………………………………………….. 50
3.3.3.1.1 Fertility and Hatchability……………………………………..………..... 51
3.3.3.2 F1 Generation Birds……………………………………..……………… 51
3.3.3.2.1 Weights of Birds and Eggs, and Body Weight Gain………………… 51
3.3.3.2.2 Body Length, Body Width and Shank Length…………………….…… 52
3.3.3.2.3 Egg Production……………………………………………………….…. 52
3.3.3.2.4 Egg and Body Weight Ratio………………………………………….…. 53
3.3.3.2.5 Mortality……………………………………………………………….… 53
3.3.3.2.6 Egg Quality Analysis………………………………………………….… 53
3.3.3.2.7 Carcass Analysis………………………………………………………… 53
3.3.3.4 Performance of Second Filial Generation (F2) Birds…………………….. 54
3.3.4 Statistical Analysis………………………………………………………….. 54
3.4 STUDY FOUR……………………………..………………………………… 56
3.4.1. Experimental Birds……………..…………..…………………..………..….. 56
3.4.2. Second Parental Generation (P2)…………..…………………..………..….. 57
3.4.3 Mating…………………………………..……..………………………….. 57
3.4.4. Transfer of Chicks and Rearing at the Villages……………..…………....... 58
3.4.5 Egg Quality Analysis………………………………………………….….… 58
3.4.6 Carcass Analysis…………………………………………………………… 58
3.4.7 Second Filial Generation (F2)Birds………………………………..….…… 58
3.4.8 Statistical Analysis………………………………………………………….. 58
3.5 STUDY FIVE………………………………………………………………. 61
3.5.1 Location and Duration of Experiment………………………………………. 61
3.5.2 Experimental birds…………………………………………………………… 61
3.5.3 Rearing of Birds under the Various Management Systems………..………... 61

x
3.5.3.1 Intensive System………………………………..……………………….… 61
3.5.3.2 Semi-intensive System…………………………………..………………… 63
3.5.3.3 Extensive System………………………………………………………….. 64
3.5.4 Data Collection………………………..…………………..…………………. 64
3.5.4.1 Profit Margin………………………………………………………………. 65
3.5.5 Statistical Analysis……………………………………………………….….. 65
4.0 CHAPTER FOUR: RESULTS……………………………………….……… 66
4.1 STUDY ONE……………………………………………………….…………. 66
4.1.1 Number of years in local chicken production……………………………… 66
4.1.2 Management…………………………………………………..……………… 66
4.1.2.1 Flock Sizes……………………………………………………….………… 66
4.1.2.2 Management System……………………………………………………… 66
4.1.2.3 Types of Feed Supplements………………………………………………. 68
4.1.2.4 Health of Birds……………………………………………………………. 68
4.1.2.4.1 Survivability of Chicks and Total Mortality……………………………. 68
4.1.2.4.2 Disease Control………………………………………………………….. 68
4.1.3 Performance…………………………………………………………………. 69
4.1.3.1 Weight of Birds and Eggs…………………………………………………. 69
4.1.3.2 Number of Layers and their Performance…………………………………. 70
4.1.3.3 Economics of Production……………………………………………….…. 70
4.1.4 Reasons for Keeping Local Birds…………………………………………… 71
4.1.6 Challenges in Local Chicken Production and Suggested Solutions………… 71
4.1.6.1 Challenges…………………………………………………………………. 71
4.1.6.2 Solutions …………………………………….……………………………. 72
4.2 STUDY TWO…………………………………………………………………. 73
4.2.1 Percentage of Naked Neck (Nana), Frizzle (Ff) and
Normal Feathered (nana/ff) Birds…………………………………………… 73

xi
4.2.2 Average Weights of Cocks, Hens and Chicks………………………….…… 73
4.2.3 Laying Performance…………………………………………………………. 74
4.2.3.1 Effect of District on Laying Performance…………………………………. 74
4.2.4 Egg Quality ……………………………………………….…………………. 75
4.2.5 Mortality and carcass parameters……………………………..……………. 76
4.3.0 STUDY THREE: MATINGS INVOLVING NAKED NECK BIRDS……… 78 4.3.2 First Parental Generation (P1)……………………...……………………….. 78
4.3.2 First Filial Generation (F1) Naked Necks (Nana) and Normals (nana)……. 79
4.3.2.1 Plumage Colour………………………………………………………..….. 79
4.3.2.2 Body Weight and Body Weight Gain (Day-old to 20th Week)…………... 81
4.3.2.3 Body Measurements………………………………………………………. 83
4.3.2.4 Laying Performance ……….……………………………………………… 84
4.3.2.4.1 The Effect of Environment (Village) on Laying Performance………….. 84
4.3.2.4.2 Sire Effects on Laying Performance…………………………………….. 85
4.3.2.5 Egg Quality Parameters …………………………………………………… 86
4.3.2.6 Some Carcass Parameters ………….……………………………………… 86
4.3.2.7 Mortality……………………………………….…………………………... 87
4.3.3.0 Matings Involving Naked Necks (Nana × Nana)…………………………. 87
4.3.3.1 The Second Generation Parents (P2)………………………………………. 87
4.3.4.0 Second Filial Generation (F2) Birds – Naked Necks (NaNa, Nana)
and Normals (nana)………………………………………………………. 89
4.3.4.1 Plumage Colour…………………………………………………………… 89
4.3.4.2 Body Weight and Body Weight Gain (Day-old to Week 20)…………….. 90
4.3.4.3 Body Measurements…………….…………………………………………. 94
4.3.4.4 Laying Performance…………………..…………………………………… 95
4.3.4.4.1 Effect of Village on Laying Performance………………………..……… 95
4.3.4.5 Egg Quality Parameters……………………………………….…………… 96

xii
4.3.4.6: Some Carcass Parameters…………………………………….…………… 97
4.3.4.7 Mortality…………………………………………….…………………….. 97
4.4 STUDY FOUR: MATINGS INVOLVING FRIZZLES (Ff × ff)……………… 98
4.4.1 First Parental Generation (P1)………………………………………………. 98
4.4.2 First Filial Generation (F1) Frizzles (Ff) and Normals (ff)…………………. 99
4.4.2.1 Plumage Colour……………………………………………………………. 99
4.4.2.2 Body Weight and Body Weight Gain (Day-old to 20th Week)………….. 100
4.4.2.3 Body Measurements………………………………………………………. 102
4.4.2.4 Egg Laying Performance…………………………………………………... 102
4.4.2.4.1 The Effect of Environment (Village) on Laying Performance…………... 103
4.4.2.4.2 The Effect of Sire on Laying Performance……………………………… 103
4.4.2.5 Egg Quality Parameters……………………………………………………. 104
4.4.2.6 Carcass Parameters………………………………………………………… 105
4.4.2.7 Mortality…………………………………………………………………… 105
4.4.3 Matings Involving Frizzles (Ff × Ff)………………………………………… 106
4.4.3.1 Second Parental Generation (P2)………………………………………….. 106
4.4.4.0 Second Filial Generation Birds – Frizzles (FF, Ff) and Normals (ff)……… 107
4.4.4.1 Plumage Colour……………………………………………………………. 107
4.4.4.2 Body Weight and Body Weight Gain (Day-old to Week 20)……….……. 108
4.4.4.3 Body Measurements………………………………………………….……. 111
4.4.4.4 Egg Laying Performance..………………………………………………..... 111
4.4.4.4.1 The Effect of Village on Laying Performance…………………………... 112
4.4.4.5 Egg Quality Parameters……………………………….…………………… 112
4.4.4.6 Some Carcass Parameters ……………………………….………………… 113
4.4.4.7 Mortality……………………….………………………………………….. 114
4.5 STUDY FIVE: F2 Naked Necks (Nana, Nana), Frizzles (Ff, Ff) and Normals (Nana/Ff) Reared Under Three Different Management Systems (Intensive, Semi-Intensive & Extensive)……………………………. 115

xiii
4.5.1 Introduction…………………………………………………………………. 115
4.5.2 Body Weight and Weight Gain……………………………………………… 115
4.5.2.1 The Effect of Management System on Body Weight and Body Weight
Gain………………………………………………………………………… 118
4.5.3 Body Measurements………………………………………………………… 119
4.5.3.1 The Effect of Management System on Body Measurements………...…… 119
4.5.4 Egg Laying Performance………………………..………………………….. 120
4.5.4.1 The Effect of Management System on Laying Performance………..……. 121
4.5.5 Egg Quality Parameters………………..……………………………………. 122
4.5.5.1 The Effect of Management System on Some Egg Quality Parameters…… 122
4.5.6 Some Carcass Parameters…………………………………………...……….. 123
4.5.6.1 The Effect of Management System on Some Carcass
Parameters of F2 Birds…………………………………………………….. 124
4.5.7 Mortality (Effects of Phenotype and Management system)…………………. 125
4.5.8 Economics of Production………………………………………….………… 125
4.5.8.1 The Effect of Management System on Economics of Production….…….. 126
5.0 CHAPTER FIVE: DISCUSSION……………………………………….…… 128
5.1 STUDY ONE………………………………………………….………………. 128
5.1.1 Number of years in Local Chicken production……………………………. 128
5.1.2 Management……………………………………………………..…………... 128
5.1.2.1 Flock Size…………………………………………………….……………. 128
5.1.2.2 Management System…………………………………………………….… 129
5.1.2.3 Types of Feed Supplements…………………………………….………….. 130
5.1.2.4 Health of Birds……………………………………………….……………. 131
5.1.2.4.1 Survivability of Chicks and Total Mortality……………………….……. 131
5.1.2.4.2 Disease Control…………………………………….……………………. 132
5.1.3 Performance ……………………………….………………………………... 133

xiv
5.1.3.1 Weight of Birds and Eggs…………………………………………………. 133
5.1.3.2 Number of Layers and their Performance…………………………………. 134
5.1.3.3 Economics of Production………………………………………………….. 136
5.1.4 Reasons for Keeping Birds………………………………………………….. 138
5.1.5 Challenges in Local Chicken Production and their Suggested Solutions ….. 140
5.1.5.1 Challenges……….………………………………………………………… 140
5.1.5.2 Solutions………………………..………………………………………….. 142
5.2 STUDY TWO…………………………………………….……………………. 143
5.2.1 Percentages of Nana, Ff & nana/ff Birds in Local Birds………….. ……... 143
5.2.2 Average Weights of Birds and Eggs ……………………………..………….. 144
5.2.3 Egg Laying Performance…………………………………………………….. 145
5.2.4 Egg Quality Performance……………………………………………………. 147
5.2.5 Carcass Parameters………………………………………………………….. 148
5.2.6 Mortality…………………………………………………………………….. 150
5.3 STUDY THREE, FOUR AND FIVE …………………………………………. 151
5.3.1 Parental Generations (P1&2) ………………………………………………… 151
5.3.2 First and Second Generation (F1 & F2) Birds………………………………. 154
5.3.2.1 Plumage Colour………………………………...………………………….. 154
5.3.2.2 Body Weight and Body Weight Gain…………………………………….. 155
5.3.2.2.1 Effect of Management System on Body Weight and Weight Gain…….. 158
5.3.2.3 Body Measurements…………………………………...…………………… 158
5.3.2.3.1 Effect of Management System on Body Measurements…………...……. 159
5.3.2.4 Laying Performance …………………………………………..…………… 160
5.3.2.4.1 Effect of Village and Sire on Laying Performance……………….……... 163
5.3.2.4.2 Effect of Management System on Laying Performance………….……… 164
5.3.2.5 Egg Quality Performance …………………………………….…………… 165
5.3.2.5.1 Effect of Management System on Egg Quality……………….………… 167

xv
5.3.2.6 Some Carcass Parameters…………………………………….……………. 169
5.3.2.7 Mortality…………………………………………………………………… 170
5.3.2.7.1 Effect of Management System on Mortality…………………………….. 172
5.3.2.8 Economics of Production………………………………………………….. 172
5.3.2.8.1 Effect of Phenotype……………………………………………………... 172
5.3.2.8.2 Effect of Management System…………………………………………… 172
5.4.0 Contributions of the Various Studies in Achieving the Main Objective….. 174
6.0 CHAPTER SIX: SUMMARY, CONCLUSION
AND RECOMMENDATIONS……………………………………………… 176
6.1 Summary and Conclusion………………………………….………………… 176
6. 1.1 Study One………………………………………..…………………………. 176
6.1.2 Study Two…………………………………………………….……………… 176
6.1.3 Study Three……………………………………………….………………… 177
6.1.4 Study Four…………………………………………………..……………… 177
6.1.5 Study Five………………………………………………….………………. 178
6.2 Recommendations……………………………….…………………………….. 179
REFERENCES…………………………………………………………………… 180
APPENDIX 1: Questionnaire for the Surveys………………………….…….. 196
APPENDIX 2: Analysis of Variance (ANOVA) Tables……………………… 200
APPENDIX 3: Climatic Conditions of the KNUST Experimental Station…… 245

xvi
LIST OF TABLES
Table Page
Table 2.1: The amount of nutrients provided by 100g (edible portions)
of Chicken meat and eggs……………………………………………… ………. 11
Table 2.2: Performance of Village Chickens in Some African Countries…………………. 14
Table 3.2: Composition of the Local Mash………………………..………………………. 63
Table 4.1.1: Performance of Local Chickens in the Ashanti Region of Ghana…………… 67
Table 4.1.2: Rankings of Various Methods Used for Preventing/Controlling Diseases….. 69
Table 4.1.3 Ranking of Reasons for Keeping Local Birds………………………………… 71
Table 4.1.4: Rankings of Various Challenges Facing Local Chicken Production in
Ghana…………………………………….…………………………………... .72
Table 4.1.5: Rankings of Suggested Solutions to the Various Challenges……………….... 72
Table 4.2.1: Percentages of Naked Neck (Nana), Frizzle (Ff) and Normal Feathered
(nana/ff) Birds and their Performances in Body Weight………………………. 73
Table 4.2.2a: Egg Laying Performance of Indigenous Naked neck (Nana),
Frizzle (Ff) and Normal feathered (nana/ff) Birds …………………………. 74
Table 4.2.2b: The Effect of District on Egg Laying Performance of Indigenous
Naked neck, Frizzle and Normal Feathered Birds…………………………75
Table 4.2.3: Egg Quality and Survivability Performances of Indigenous Naked neck
(Nana), Frizzle (Ff) and Normal feathered (nana/ff) Birds…………………..76
Table 4.2.4: A Comparison of Carcass Parameters of Indigenous Nana (Naked neck),
Ff (Frizzle) and nana/ff (Normal feathered) Birds…………………………..77
Table 4.3.1a: Some Characteristics of the Four Indigenous Nana (Naked neck)
Males used in the First Mating……………………………………………… 78
Table 4.3.1b: Characteristics of the Commercial Lohmann Females used in the First
Mating………………………………………………………………………79
Table 4.3.1c: Egg Quality Characteristics of the Commercial Lohmann
Females used in the First Mating……………………………….……...........79

xvii
Table 4.3.2.2a: Body Weight and Body Weight Gain of F1 Nana (Naked neck) and
nana (Normal feathered) Chicks (Day-old to week 6)……………………. 81
Table 4.3.2.2b: Body Weight and Body Weight Gain (Week 7 to Week 13) of F1
Nana (Naked neck) and nana (Normal feathered) Birds……………….... 82
Table 4.3.2.2c: Body Weight and Body Weight Gain (Week 14 to week 20)
of F1 Nana and nana Birds………………………………………..…… 82
Table 4.3.2.3: Body Measurements of F1 Nana & nana Birds……………………….…… 84
Table 4.3.2.4a: The Effect of the Naked Neck Gene on Laying Performance……………. 84
Table 4.3.2.4b: The Effect of Village on Laying Performance…………………………....85
Table 4.3.2.4c: The Effect of Sire on Laying Performance……………………………… 86
Table 4.3.2.5: The Effect of Naked Neck (Nana) Gene on Egg Quality
Parameters………………………………………………………………….. 86
Table 4.3.2.6: The Effect of the Naked Neck Gene on Some Carcass Parameters………... 87
Table 4.3.2.7: The Effect of Naked Neck Gene on Survivability of F1 Birds………….. 87
Table 4.3.3.1a: Productive and Reproductive Characteristics of the Second Parental
Generation (P2)………………………………………………………….. 89
Table 4.3.3.1b: Egg Quality Characteristics of the Second Parental Generation………….. 89
Table 4.3.4.2a: A Comparison of the Body Weight and Body Weight Gain of NaNa,
Nana and nana F2 Chicks (Day-old to Week 6)………………………… 91
Table 4.3.4.2b: Body Weight and Body Weight Gain of NaNa, Nana & nana F2
Birds (Weeks 7 to 14)…………………………………………………… 92
Table 4.3.4.2c: Body Weight and Body Weight Gain of NaNa, Nana & nana F2
Birds (Weeks 15 to 20)…………………………………………………… 93
Table 4.3.4.3: Body Measurements of NaNa, Nana and nana F2 Birds…………………. 95
Table 4.3.4.4a: Laying Performance of NaNa, Nana and nana F2 Birds………………… 95
Table 4.3.4.5b: Effect of Village on Laying Performance………………………………… 96
Table 4.3.4.5: Egg Quality Parameters of NaNa, Nana and nana F2 Birds………………. 96
Table 4.3.4.6: Some Carcass Parameters of NaNa, Nana and nana F2 Birds……………. 97
Table 4.3.4.7: Mortality of NaNa, Nana and nana F2 Birds…………………………….. 97

xviii
Table 4.4.1a: Characteristics of the Indigenous Heterozygous Frizzle (Ff) Males used
in the First Matings …………………………………………………………. 98
Table 4.4.1b: Characteristics of the Lohmann Commercial Lohmann
Females used in the First Matings with Frizzles…………………………… 98
Table 4.4.1c: Egg Quality Characteristics of the Eggs from the Commercial
Lohmann Females used in the First Mating………………………………… 99
Table 4.4.2.2a: Body Weight and Body Weight Gain of F1 Ff & ff Chicks (0-6 wks)……. 100
Table 4.4.2.2b: Body Weight and Body Weight Gain (Week 7 to Week 13)
of F1 Ff & ff Birds………………………………………………………… 101
Table 4.4.2.2c: Comparing the Body Weight and Body Weight Gain
(Week 14 to week 20) of F1 Ff and ff Birds………………………….….. 101
Table 4.4.2.3: Body Measurements of Ff & ff F1 Birds…………………………………… 102
Table 4.4.2.4a: Laying Performance of F1 Ff & ff Birds…………………………………... 102
Table 4.4.2.4b: The Effect of Village on Laying Performance of F1 Birds……………… 103
Table 4.4.2.4c: The Effect of Sire on Laying Performance of F1 Birds…………………. 104
Table 4.4.2.5: Egg Quality Measurements of F1 Ff and ff Birds…………………………... 104
Table 4.4.2.6: Some Carcass Parameters of F1 Ff and ff Birds…………………………… 105
Table 4.4.2.7: Mortality of F1 Ff and ff Birds…………………………………………… 105
Table 4.4.3a: Productive and Reproductive Characteristics of P2 Birds………………… 106
Table 4.4.3b: Egg Quality Characteristics of the Second Generation Parents (P2)……… 107
Table 4.4.4.2a: Body Weight and Body Weight Gain (Day-old to Week 6) of FF, Ff
& ff F2 Birds………………………………………………………………. 108
Table 4.4.4.2b: Body Weight and Body Weight Gain (Week 7 to Week 14) of
Homozygous Frizzle (FF), Heterozygous Frizzle (Ff) and the Normal
Feathered (ff) F2 Birds…………………………………………………….. 109
Table 4.4.4.2c: Effect of Genotype on the Weekly Body Weight and
Weekly Weight Gain of F2 FF, Ff & ff Birds (Week 15 to Week 20)……. 110
Table 4.4.4.3: Body Measurements of Homozygous Frizzle, Heterozygous Frizzle
and Normal Feathered F2 Birds……………………………………………. 111

xix
Table 4.4.4.4a: Laying Performance of F2 FF, Ff & ff Birds……………………............... 112
Table 4.3.4.5b: Effect of Village on Laying Performance of F2 Birds (FF, Ff & ff)……… 112
Table 4.4.4.5: Egg Quality Performance of F2 FF, Ff & ff Birds………………………… 113
Table 4.4.4.7: Comparison of Some Carcass Parameters of Homozygous Frizzle
(FF), Heterozygous Frizzle (Ff) and the Normal Feathered (ff) F2 Birds…. 114
Table 4.4.4.7: The Effect of Genotype on the Mortality of the F2 Birds………………… 114
Table 4.5.2a1: Body Weight and Body Weight Gain (Week 7 to week 14)
F2 Naked necks (NaNa, Nana) and Frizzles (FF, Ff)…………………….. 116
Table 4.5.2a2: Body Weight and Body Weight Gain (Week 15 to week 20) of
NaNa, Nana, FF & Ff Birds………………………………………………... 116
Table 4.5.2b1: The Effect of Management System on Body Weight and Body
Weight Gain (Week 7 to week 14) of F2 Birds…………………………… 118
Table 4.5.2b2: The Effect of Management System on the Growth
(Week 15 to week 20) of F2 Birds……………………………………….. 119
Table 4.5.3a: Body Measurements of Homozygous Naked Neck, Heterozygous
Naked Neck, Homozygous Frizzle and Heterozygous Frizzle F2 Birds…… 119
Table 4.5.3b: The Effect of Management System on Body Measurements of
F2 Birds…………………………………………………………………… 120
Table 4.5.4a: Egg Laying Performance of F2 Naked Necks (NaNa, Nana)
and Frizzles (FF, Ff)………………………………………………………… 121
Table 4.5.4b: The Effect of Management System on Egg Laying Performance of F2
Birds……………………………………………………………………….....121
Table 4.5.5a: Comparison of Some Egg Quality Parameters of F2
Naked Necks (NaNa, Nana) and Frizzles (FF, Ff)…………………………. 122
Table 4.5.5b: Effect of Management System on Egg Quality Parameters of F2 Birds….. 123
Table 4.5.6a: Some Carcass Parameters of F2 Naked Neck (NaNa, Nana) and
Frizzle (FF, Ff) Birds………………………………………………………. 123
Table 4.5.6b: Effect of Management System on Carcass Parameters of F2 Birds………. 124
Table 4.5.7: The Effects of Phenotype and Management System on Mortality of F2

xx
Birds………………………………………………………………………….. 125
Table 4.5.8a: Economics of Production of NaNa, Nana, FF, Ff and nana/ff F2 Birds…... 125
Table 4.5.8b: The Effect of Management System on Economics of Production of
F2 Birds……………………………………………………………………… 127

xxi
LIST OF FIGURES
Figure Page
Fig. 3.1.1: Map of Ashanti Region, Showing the Study Areas………………… 40
Fig. 3.5.1: Structures used under this system, the locally prepared Mash
and birds being fed…………………………………………………… 64
Fig. 4.1.1: A Bar Chart Showing Weights of Body and Eggs of Local Birds…. 70
Fig. 4.3.1: F1 Heterozygous Naked necks (Nana) and Normals….................. 80
Figure 4.3.2a: A Bar Chart Showing Six-week Body Weight of Heterozygous
Naked neck and Normal feathered Birds………………………… 81
Fig.4.3.2b: Comparative Growth Curves of F1 Nana and nana Birds…………… 83
Fig. 4.3.2c: Comparison of the 20wk Body Weights of Nana & nana
Offspring of Four Naked neck Sires…………………………….. 83
Fig. 4.3.3: Heterozygous Naked neck Males and Females Used in
the Second Mating…………………………………………………… 88
Fig.4.3.4: Characteristics of the F2 Homozygous Naked Necks……………….….. 90
Fig.4.3.5a: A Bar Chart Showing Six-week Body Weights of Homozygous
Naked neck, Heterozygous Naked neck and Normal feathered F2 Birds……… 91
Fig.4.3.5b: Comparative Body Weight at Twenty Weeks of Age of F2
NaNa, Nana and nana………………………………………………. 94
Fig. 4.4.1: Heterozygous Frizzle and Normal Feathered F1 Birds…………….. 99
Fig.4.4.2: The F2 Generation Homozygous Frizzles (FF)……………………......... 107
Fig.4.4.3: A Graph Showing the Growth Curves of Homozygous Frizzle,
Heterozygous Frizzle and Normal feathered F2 Birds………………..…. 110
Fig.4.5.1: A Bar Chart Showing the 20wks Body Weight of Homozygous
Naked neck, Heterozygous Naked neck, Homozygous Frizzle and
Heterozygous Frizzle F2 Birds………………………………………...... 117
Fig.4.5.2: Various F2 Phenotypes reared Under three Management Systems… 117

xxii
Fig.4.5.3: A Bar Showing the Annual Profit Made from Rearing Five Different F2
Genotypes (NaNa, Nana, FF, Ff, nana/ff)……………………………….126
Fig.4.5.4: A Bar Chart Showing the Annual Profit Made from Rearing F2 Chickens
Under Intensive, Semi-intensive and Extensive Systems……………….127

xxiii
ACKNOWLEDGMENT
My foremost gratitude and indebtedness goes to the Maker of the universe, the
Almighty Jehovah. He is the one who gave me the strength and wisdom, due to His
abundant mercy and loving kindness, to complete this work.
The first person I would like to acknowledge and express my sincere appreciation to, is
my supervisor, Dr. Oscar Simon Olympio who did not only supervise my work but was
also like a father to me for the past four years. He was always there for me concerning
this research work and beyond. I pray and hope that God will reward him abundantly.
I would like to thank the Kwame Nkrumah University of Science and Technology
(KNUST), Kumasi for giving me a scholarship to undertake this PhD programme.
Akate Farms and Trading Company Limited donated the Lohmann commercial layers
which were used in this research and I would like to thank them very much.
My appreciation also goes my colleague, Mr. Julius Kofi Hagan for his suggestions and
cooperation which contributed to the success of this work. I want to acknowledge the
current Head of the Department of Animal Science, KNUST, Dr. E.L.K. Osafo and the
immediate past one, Prof. Armstrong Donkoh, and all senior members, senior staff and
labourers at the Department of Animal Science who helped in diverse ways to make this
work a success.

xxiv
I am also indebted to my wife, Abigail; my son, Kyrian and my daughter, Kyria for
their support and cooperation during the study. My parents, Mr. and Mrs. Opoku-
Mensah and my siblings, Kofi, Yaa, Akua, Afia and Yaw have also been a great source
of encouragement to me for which I would like to acknowledge. I have so many loyal
friends who have always been there for me in times of need, especially Mr. and Mrs.
Anokye who were always concerned about the success of this work, and I thank them
very much.

1
CHAPTER ONE
1.0 INTRODUCTION
Ghana has a population of 23.8 million and 31.4% of this number survives below the
poverty line. About 70% of those below the poverty line live in villages, with little or no
education (UN/DESA, 2009). These eke out a living through subsistence agriculture
and petty trading, however, the benefits derived from these activities are sometimes not
enough to feed an entire family. Eating low-protein diets to survive becomes their best
option and this leads to malnutrition among the children. Malnutrition plays a major
role in the deaths of over five million children annually in Africa (WHO, 2000). In
Ghana, thirty six percent (36%) of children less than five years old are stunted and fifty
four percent (54%) of mortality among children below five years is caused by
malnutrition (Poel et al., 2007).
In Ghana, the total poultry population is estimated to be over 33 million with 60-80% of
this being rural scavenging chickens (LPIU, 2006; Gyening, 2006). Rural poultry
production is an important agricultural activity of almost all rural communities in
Africa, providing scarce animal protein in the form of meat and eggs as well as being a
reliable source of petty cash. Village chickens also fulfill a number of other functions
for which it is difficult to assign any monetary value. These include the fact that rural
chickens play an active role in pest control and are used for traditional ceremonies and
festivals. They are also used for rituals, honouring guests, and alerting owners of the
presence of dangerous animals and the provision of aesthetic value (VSD, 1998).

2
Among small livestock, chickens are preferred for the generation of food and income.
The preference has been attributed to the shorter growing cycle of chickens (Global
Plan, 1992) that makes it possible for the benefits, in the form of meat and eggs, to be
reaped in less than six months. One egg weighing 55g meets 50% of the daily protein
requirement of children between the ages of 1 to 5 (Ponapa, 1982). Therefore, if all the
children in the villages of Ghana have access to one or two eggs daily, malnutrition
among the children in these villages will be reduced markedly.
The contribution of rural poultry to the national economy of developing countries and
the nutritional status and income levels of many smallholder farmers and landless
communities has been very significant; contributing 1.37% of Gross Domestic Products
(GDP) in Bangladesh (Creevey, 1991). This opportunity seems unexplored in Ghana
since no intensive research has been done to improve the production of local chickens to
the benefit of the people living in rural areas. The few studies that have been carried out
on indigenous chickens in Ghana were baseline surveys (van Veluw, 1987; Awuni,
2002; Osei-Amponsah et al., 2007). It was only the studies of Dankwa et al. (2005) that
looked into the effect of using live maggots as a feed supplement on the performance of
scavenging indigenous layers.
In spite of the many problems involved in poultry keeping, almost all poor households
in the villages keep poultry; and poultry production is therefore considered an excellent
tool in poverty alleviation due to its quick turn over and low investment. Thus, if
production could be improved, village poultry production would create an opportunity

3
for the development of the poor segments of society (Quisumbing et al., 1995; 1998;
Todd, 1998; Permin et al., 2000; Gueye,).
The main objective of this study therefore, was to assess the productive potential of
indigenous chickens and to determine the magnitude of improvement that can be
obtained by mating them with commercial hybrid layers. The specific objectives of the
study were to:
1. assess the current performance of local chickens in the Ashanti Region of
Ghana.
2. determine the potentials of frizzle and naked neck birds among indigenous
chickens in the Ashanti Region of Ghana.
3. produce homozygous and heterozygous naked neck birds which perform better
in traits of economic importance by mating local naked neck males with
commercial layers.
4. compare the productive and reproductive performance of homozygous and
heterozygous naked neck birds with that of their normal feathered counterparts.
5. produce dual-purpose (meat and eggs) homozygous and heterozygous frizzle
birds as a result of a mating between indigenous frizzle males and commercial
layers.
6. compare the performance of homozygous and heterozygous frizzle birds with
that of their normal feathered counterparts in traits of economic importance.
7. compare the productivity and profitability of rearing birds under intensive, semi-
intensive and extensive management systems.

4
CHAPTER TWO
2.0 LITERATURE REVIEW
2.1 LOCAL CHICKENS AND THEIR PRODUCTION
2.1.1 Origin
The progenitor of the local fowl is generally considered to be the Red Jungle Fowl
(Gallus ferrugineus or bankiva), though there are three other wild species, all oriental.
This species is a native of India, a part of China, the adjacent islands and the Philippines
(FAO, 1998; Dalby, 2003; Anonymous, 2007). Its habitats are divers, as it can be found
in lofty forests and in the dense thickets, as well as in bamboo jungles and on when
cultivated lands. This wild species closely resembles the breed of poultry fanciers, the
Black-breasted Game, but the crow of the wild cock is not as loud or prolonged as that
of the tamed one (MacDonald and Blench, 2000). In Africa, chickens were first
discovered in Egypt, where they were reared as foreign pets and game cocks. However,
in the year 650BC they became common and economically important. They then spread
from there to Sub-Saharan Africa during the first millennium AD (Dalby, 2003).
Characteristics such as naked neck, frizzled feathers and also single, pea, rose and
walnut combs were common within flocks of local birds (Anonymous, 2007). The
naked neck mutation originated in Transylvania, Romania and spread across Europe
centuries ago; and the frizzle feathered chicken was first described by Western
explorers in Fiji during the seventeenth century (FAO, 2000). These naked neck and
frizzle birds were introduced to Africa and the rest of the world by sailors and traders.
Local chickens of today resulted from centuries of cross-breeding with exotic breeds

5
and random breeding within flocks of local birds. As a result, it is not possible to
standardize the characteristics and performance of indigenous chickens (FAO, 1998).
The indigenous fowls have been variously referred to as the African chicken, local
chicken, native chicken, family poultry, village chicken, bush chicken or runner
chicken; however, distinct local varieties have been reported in Egypt, Cameroon,
Burkina Faso, Morocco and Sudan (Guèye, 1998).
2.1.2 Potential of Local Chickens
More than 70% of the family poultry population in Africa is made up of the indigenous
chicken types kept in low-input low-output production systems (Kitalyi, 1999). Family
poultry is well integrated into most village farming systems, producing 40 to 70 percent
of the national meat and egg supply in most tropical countries (Horst, 1988; FAO,
2000). Indigenous chickens possess unique adaptive traits that permit them to survive
and reproduce under harsh climatic, nutritional and management conditions typically
associated with low input–output production systems (Mwacharo et al., 2007). Local
birds are kept by rural smallholders, landless farmers and industrial labourers, because
of their scavenging adaptability, production ability and low maintenance cost (Kitalyi,
1998).
Local birds are adapted for survival under scavenging free-range conditions due to their
evolvement from the same conditions. However, there still is a considerable and largely
unexploited potential for increased production from local birds through improved
management (FAO, 2000). According to Horst (1988) products from local poultry
stocks are widely preferred because of pigmentation, leanness, and availability for
6
special dishes. He observed that despite the important role played by local poultry, there
is a paucity of information on its genetic make-up with respect to performance, its
comparative evaluation with imported lines under similar management conditions and
its adaptability and resistance to local diseases.
Local chickens are beneficial to rural people because they are available, adaptable,
inexpensive to keep, and have tasty meat and eggs. Improving the genetic potential of
local birds will result in faster multiplication of birds, increase in body weight, and
improved egg weight and taste. It will also result in more eggs for hatching, sale and
consumption, and more income (Mburu and Ondwasi, 2005). Adaptability of local
chickens to unfavourable conditions is usually high (Mukherjee, 1990).
2.1.3 Feeding Management
Birds need enough feed to grow and lay eggs. They find their own feed if allowed to
move freely; but extra feed should be given in the form of kitchen leftovers including
fruit and vegetable waste, cereal grains and by-products, green leaves, fish meal, tubers
and roots, insects, termites and worms, and brewers waste. Provision of adequate clean
water and feeding of birds in a clean dry place must be ensured (Mburu and Ondwasi,
2005).
The growth potential of local chickens is not fully exploited under free-range
(scavenging) conditions due to inadequate feed supply. Feeding management
contributes about 30% of their growth potential (Gondwe and Wollny, 2005). They

7
concluded that, growth of local chickens can be enhanced through improved
management under free-ranging conditions.
Feed resources are a major input in poultry production systems. They are estimated to
account for 60 percent of total production costs in the commercial poultry sector
(Renkema, 1992). Rising poultry feed costs and particularly those of premixes have led
to the use of home made rations, where concentrates of commercial feed is mixed with
other ingredients (Kitalyi, 1999). Ingredients commonly used in home made rations are
oyster shells, fishmeal, bone meal, blood meal and oil seed cakes. Other ingredients are
cereal grains, cereal by-products and kitchen waste (Fanuel, 1997; Kitalyi, 1998).
In village chicken production systems, it is difficult to estimate the economic and/or
physical value of feed input because there are no direct methods of estimating the
scavenged feed resource which constitutes most of the feed input. In Sri Lanka , the
village chicken feed was partitioned into household refuse, 72%; grass shoots, 13%;
small metazoans, 8%; and paddy rice, 7% (Roberts and Gunaratne, 1992). Forages also
form part of the scavenged feed resource (Soukossi, 1992).
The scavenging feed resource base depends on household food status (Gondwe and
Wollny, 2005). The nature of the area available for scavenging influences strongly the
feed intake pattern of the chickens when these have free access to both energy- and
protein-rich supplements (Samnang, 1998).

8
2.1.4 Housing
Housing in modern poultry is an important input, accounting for a major component of
the initial capital investment. In modern poultry enterprises, the structures are
constructed and designed in consideration of bird welfare and efficiency of production
(Bhagwat, 1996; Weaver, 1996). According to Huchzermeyer (1976), there are three
types of traditional poultry houses in Africa, namely saddle roofed houses, round
thatched huts, boxes and basket types. However, birds sometimes roost in the family
house, kitchen or on tree branches (Kitalyi, 1999).
Housing in rural poultry is at a rudimentary stage, and field surveys have shown cases
where no housing or shelter is provided (Huchzermeyer, 1973; Kuit et al., 1986; Atunbi
and Sonaiya, 1994; Yongolo, 1996). The traditional poultry housing structures are small
in size and, therefore, difficult for a person to go into most of them to clean up. Such
houses would definitely not provide a healthy environment (Kitalyi, 1999).
Research on the economic efficiency of housing in rural poultry in Africa is scanty.
However, published reports suggest that where housing is provided to village chickens,
the houses are made with locally available materials such as wood, mud bricks,
sugarcane stems, bamboo and cereal stovers (Atunbi and Sonaiya, 1994; Huchzermeyer
1973; Yongolo, 1996). In an evaluation of the economic efficiency of the local
materials for housing laying hens, Atunbi and Sonaiya (1994) reported that cane cages
were cheaper than wooden cages.

9
Free-ranging local chickens are known for their ability to survive under various types of
shelter, including makeshift chicken houses, kitchens and even roosting on trees
(Andrews 1990; Musharaf 1990; Yongolo 1996). According to Mwalusanya et al.
(2004), 95.2% local chicken keepers allow their birds to scavenge during the day and
are provided with simple housing at night. Proper chicken housing should keep the
birds, especially young chickens, secured from wild animals and hawks, be spacious,
well lit and airy, have perches, be easy to clean and maintain (Mburu and Ondwasi,
2005).
2.1.5 Health and Disease Control
Newcastle disease is the most devastating disease of village chickens in Africa
(Melewas, 1989; Minga et al., 1989; Bell et al., 1990; Bourzat and Saunders, 1990;
Chaheuf, 1990; Awan et al., 1994; Chrysostome et al., 1995). Other diseases such as
Gumboro, coccidiosis, fowl pox, fowl typhoid, fowl cholera, infectious coryza, chronic
respiratory disease (CRD) and both internal and external parasites have also been
reported (Melewas, 1989; Yongolo, 1996).
A study of ectoparasites of domestic fowls in Nigeria showed that infestation of lice,
Menacanthus straminen, was the major problem in rural poultry (Zaria et al., 1993).
Studies on the incidence of worms in village chickens in some African countries
revealed that worm species such as Ascaridia galli, Prosthogonium spp., Strongyloids
avium, Heterakis gallinarum, Raillietina spp, Davainea progglottina, Tetrameres
americana, and species of Trichuridae and Raillietinidae were common in village
10
chickens (Tona, 1995). According to Mukherjee (1990), resistance of local birds to
prevailing diseases such as Newcastle, fowl pox and coccidiosis is low resulting in
generally high juvenile, and occasionally high adult mortality rates.
Cleaning the chicken house frequently to maintain hygiene; vaccinating chickens
against Newcastle disease, fowl typhoid and fowl pox, deworming growers to control
internal parasites and dusting the birds to control external parasites, help in protecting
local birds against sickness (Mburu and Ondwasi, 2005).
2.1.6 Economic Importance of Keeping Local Birds Various scholars and rural development agencies have recognized the importance of
rural poultry in the economies of developing countries and its role in improving the
nutritional status and incomes of many small farmers and landless communities in the
last two decades (FAO, 1982, 1987; Bembridge, 1988; Mokotjo, 1990; Creevey, 1991).
However, rural poultry does not rate highly in the mainstream national economies
because of the lack of measurable indicators of its contribution to macroeconomic
indices such as gross domestic product (GDP).
A survey conducted in northern Ghana by van Veluw (1987) revealed that the main
function of village chickens from the farmer's perspective is the provision of meat and
eggs for home consumption. The village chicken provides readily harvestable animal
protein to rural households and, in some parts of Africa, is raised to meet the obligation
of hospitality to honoured guests (Chale and Carloni, 1982). Village chickens are more
11
widely distributed in rural areas of Ghana than the other livestock species (van Veluw,
1987) and can therefore provide a cheap source of food and easy cash to the family
(Mburu and Ondwasi, 2005).
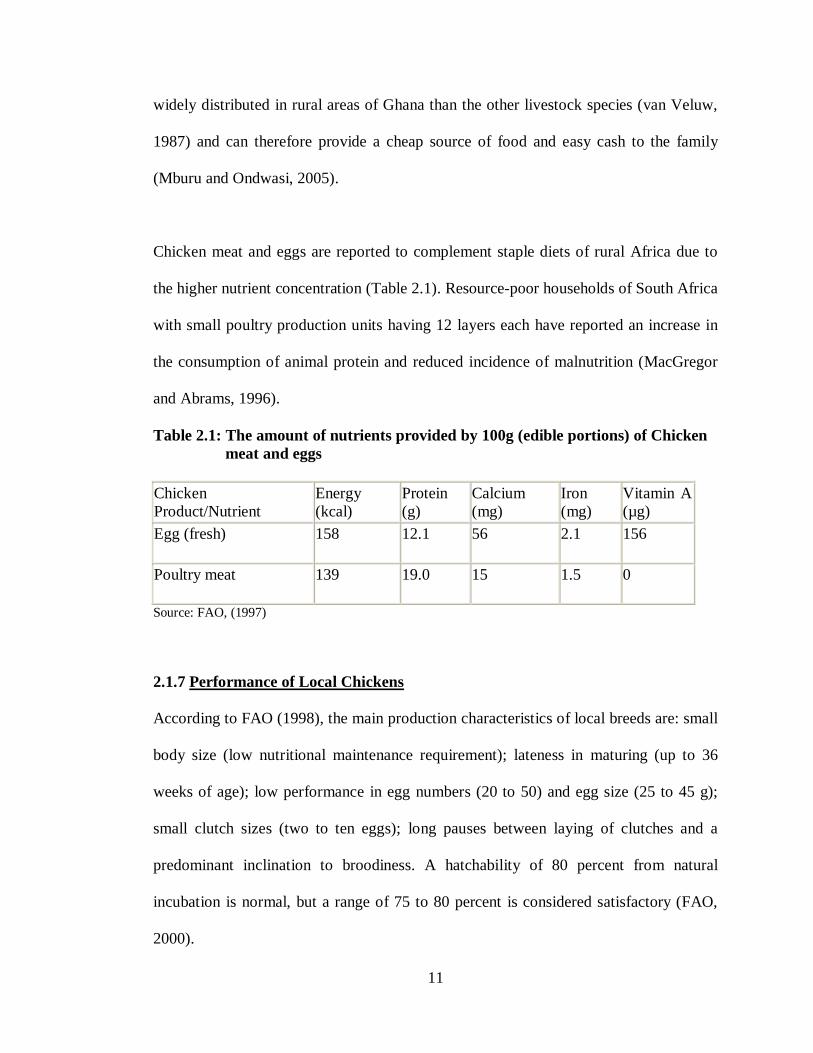
Chicken meat and eggs are reported to complement staple diets of rural Africa due to
the higher nutrient concentration (Table 2.1). Resource-poor households of South Africa
with small poultry production units having 12 layers each have reported an increase in
the consumption of animal protein and reduced incidence of malnutrition (MacGregor
and Abrams, 1996).
Table 2.1: The amount of nutrients provided by 100g (edible portions) of Chicken meat and eggs Chicken Product/Nutrient
Energy (kcal)
Protein (g)
Calcium (mg)
Iron (mg)
Vitamin A (µg)
Egg (fresh) 158 12.1 56 2.1 156
Poultry meat 139 19.0 15 1.5 0
Source: FAO, (1997)
2.1.7 Performance of Local Chickens
According to FAO (1998), the main production characteristics of local breeds are: small
body size (low nutritional maintenance requirement); lateness in maturing (up to 36
weeks of age); low performance in egg numbers (20 to 50) and egg size (25 to 45 g);
small clutch sizes (two to ten eggs); long pauses between laying of clutches and a
predominant inclination to broodiness. A hatchability of 80 percent from natural
incubation is normal, but a range of 75 to 80 percent is considered satisfactory (FAO,
2000).

12
Flock size varies between 20 and 50 birds with ages between day-old to about three
years and each farmer keeps about one or two adult males and three or four adult
females in their flock for breeding purposes as reported in Malaysia (Ramlah, 2005).
According to Mwalusanya et al. (2004), the mean flock size for a village chicken is
16.2, with a range of 2 to 58. However, flock sizes in local poultry production systems
are highly variable; ranges of 3 to 97 and 6 to 130 have been reported in Nigeria and
Malawi respectively (Sonaiya et al., 1999; Kitalyi 1998).
Ramlah (2005) reported that in Malaysia, local hens laid eggs in clutches of about 8-16
eggs per clutch before sitting on the eggs for hatching. He continued that chicks were
normally brooded by the broody hen or brooded in a box or cage and then the brood
was left to roam for food following the mother hen for about 40-60 days until they
could look after themselves. It was further reported that, the survival rate of these chicks
was low compared to chicks that were kept under the semi-intensive system. According
to Mwalusanya et al. (2004), the mean clutch size, egg weight and hatchability were
11.8, 44.1 g and 83.6%, respectively whilst mean chick survival rate to 10 weeks of age
was 59.7%. They continued that the mean live weights for cocks and hens were 1.95 kg
and 1.35kg, respectively; and the mean growth rates to the age of 10 weeks were 4.6
g/day and 5.4 g/day, while from 10 to 14 weeks of age the rates were 8.4 g/day and 10.2
g/day for female and male birds, respectively. It was further stated that, the age at first
lay ranged between 6 and 8 months, and the average hen had three laying cycles per
year. Furthermore, only small amounts of supplementary feeds were occasionally given
and minimal health care was provided.

13
Local chickens perform very well when extra feed, proper housing and disease-free
environment are provided (Mburu and Ondwasi, 2005). The major constraints to the
production of local chickens are outbreaks of Newcastle disease among chickens in the
months of September to December every year, predators that feed on pigeons, chickens
and ducks, and poor housing and prolonged weaning periods for chickens and ducks as
reported in Malawi (Gondwe et al., 2005). The low productivity of local chickens is
partly due to poor management practices, in particular the lack of proper health care,
poor nutrition and poor housing (Mwalusanya et al., 2004).
The performance of local chickens and their price trends are associated with status of
food security in rural households (Gondwe et al., 2005). The productivity of local
chickens is low with regard to egg production, egg weight, growth rate and chick
survival rate. Chicken housing, feeding, and health care are below standard (INFPD,
1999). Table 2.2 shows the variations in the performance of village chicken in some
African countries.

14
Table 2.2: Performance of Village Chickens in Some African Countries
Source : Kitalyi (1998) In rural smallholder extensive systems, meat production cannot be separated from egg
or chick production, and thus a highly broody (with consequent low egg production),
low body-weight (low-feed requirement) hen is best suited under these conditions.
Surplus cockerels, whatever their weight, are usually sold for meat at three to four
months of age and there is little control in reproduction as they brood their own chicks
for continuous regeneration of the flock (Kitalyi, 1998). The egg brooding (incubation)
and chick rearing activity increase the length of the reproductive cycle from 58 days to
about 74 days (Horst, 1999). Thus, most hens can produce chicks about four to five
times per year.
Reference Country Clutches Per year
Eggs Per Clutch
Egg Weight (g)
Hatcha- bility (%)
Matured Body Weight (kg)
Mortality
Cock Hen Chick Mature Shanawany and Banerjee (1991)
Ethiopia - - 44 - 49 39 - 42 - - - 1.1-1.7
Bourzat and Saunders (1990)
Burkina Faso
2.7 – 3.0 12 - 18 30 - 40 60 - 90 - - - -
Minga et al., (1989)
United Republic of Tanzania
- 6 - 20 41 50 - 100 1.2 2.2 >80 -
Van Veluw (1987)
Ghana 2.5 10 - 72 - - 50 50
Wilson et al., (1987)
Mali 2.1 8.8 34.4 69.1 1.6 1.02 56 -
Wilson (1979)
Sudan 4.5 10.87 40.6 90 2.1 1.31 - -

15
With four to five reproductive cycles per year, only about nine replacement pullets out
of 40 or 50 may be obtained (FAO, 1998). Fertility and hatchability are also high in
local birds since they generally adapt well to unfavourable management conditions, and
resistance to prevailing diseases is usually assumed to be high, although juvenile and
sometimes adult mortality rates can be high in extensive production systems (FAO,
2000).
2.1.7.1 Broodiness in Local Birds Broodiness is a common characteristic of the native chicken, and a hen incubates 4 or 5
clutches of eggs in every year (Islam, 2006). Signs of broodiness are that the hen stops
laying, remains sitting on her eggs, ruffles her feathers, spreads her wings and makes a
distinctive clucking sound. Brooding may be induced with dummy eggs or even stones
(FAO, 2000). The hen does not start to incubate her eggs until the whole clutch is laid.
The physiology of a hen changes after the whole clutch has been laid. She will remain
on them, with her wings slightly spread to keep them warm, for about 21 days. She
makes muttering, growling sounds if disturbed, and may even peck or otherwise try to
defend her nest. She will only leave the nest once a day to eat, drink and defecate (FAO,
1998). Broodiness, caused by the effect of the hormone prolactin (Prl), is a hindrance to
high egg production (Pampin and Ruiz, 1998).
Incubation behavior in chickens is not controlled by a major gene (or genes) on the Z
sex chromosome, and there must, therefore, be major autosomal genes contributing to
the expression of the behavior. If a broody gene does exist on the Z chromosome, it is
one of at least three genes including two dominant autosomal genes, one causing and

16
the other one inhibiting incubation behavior, with probably equal influence (Rumanov,
2001).
Zadworny et al. (1988) found that plasma levels of Prolactin (Prl) increased before
incubation and were maintained at high levels during incubation but decreased rapidly
at the onset of the hatching of the young. It was observed that during incubation, plasma
levels of Prl appeared to be associated with time spent on the nest. Lea et al. (1981)
observed that the concentration of plasma protein increased while that of LH fell
successively during the days before the onset of incubation, which resulted from the
increase in plasma Prl.
Broodiness does occur under low concentrations of Prl. However, elevated levels of Prl
during broodiness appear to be maintained by a stimulus associated with the nest itself
or some other aspect(s) of the environment (Zadworny et al., 1985). Plasma Prl
decreased and plasma LH increased in hens deprived of their nest: these changes were
reversed when the hens re-nested. Secretion of Prl in broody hens is facilitated by the
presence of chicks and increased concentration of plasma Prl maintains incubation
behavior (Sharp et al., 1988).
Lea et al. (1981) found that hens spent progressively more time in the nest during the 5
days before the onset of incubation so that by the first day of incubation they were
spending more than 90% of their time in this way. Li and Lee (1995) found that 48% of
birds in floor pens showed broodiness versus 3.2% of caged birds. Nixey (1973)

17
observed that about 56% of the birds laying in the warmer environment (19.5 and
12.5oC) showed signs of broodiness, while only 27% of the birds in the colder
environment (7.1 o and 3.1o C) showed it. The flocks in the colder environment laid on
average, 86.9 vs. 77.6 % eggs per hen in flocks in the warmer environment. Most of this
difference was accounted for by increased broodiness.
2.1.7.2 Mortality under the Scavenging System of Producing Birds
Abdelqaer et al. (2005) reported that in Cameroon, 40% of the flock of local birds under
the local management system was lost before reaching 6 months of age, and mortality
from diseases, predators, parasites, and cold stress for chicks accounted for 49 %, 31.6
%, 10 %, and 9.4% of the total loss, respectively. It was added that the most frequent
outbreak of diseases, as perceived by the keepers, was in this order of occurrence:
Newcastle Disease (51 %), Infectious Bronchitis (21 %), Fowl Typhoid (18 %) and
other diseases (10 %); the main predators were foxes (25% of the cases), and wild cats
(11.5%).
Wirsiy and Fonba (2005) observed that, under the Tanzanian local system of producing
chickens, disease outbreaks were common and often erased stocks of chicken from an
entire household. According to them, poultry disease epidemics were also common
during the transitional periods (end of rainy season and start of dry season). Mortality
for exotic birds under scavenging conditions were higher than that of local birds
indicating that, exotic chickens were subjected to considerable hazard of diseases,
parasites and predators under scavenging condition (Samnang, 1998; Demeke, 2003)

18
Local chicken contributes significantly to the nutritional and economic functions in
rural communities, however, mortality due to diseases and predation constrain these
functions markedly. It has been estimated in Malaysia that, the mean annual financial
loss per flock of sixty birds due to mortality, was 42 US dollars (Abdelqader et al.,
2005). Experience has shown that vaccination of local fowls against major poultry
diseases like Newcastle disease, infectious bronchitis and Gumboro can prevent these
losses due to disease outbreaks (Wirsiy and Fonba, 2005).
2.1.8 Systems of Production of Local Birds
There are three poultry management systems: intensive, semi-intensive and extensive or
scavenging (Kitalyi, 1999). Under the intensive system, birds are fully confined either
in houses or cages. Capital outlay is highest and the birds are totally dependent on their
owners for all their feed requirements; production however is highest. There are three
types of intensive systems namely: deep litter, slatted floor and battery cage systems. In
the semi-intensive or ‘run’ system the birds are confined in an enclosed area outside
during the day and housed at night. Feed and water are provided in the enclosed to
avoid wastage by rain, wind and wild animals (FAO, 2002). There are two types of
extensive systems: free-range and backyard. Under the free-range extensive system, the
birds are not confined and can scavenge for food over a wide area. Rudimentary shelters
may be provided, and these may or may not be used. The birds may roost outside,
usually on trees, and nest in the bush. The flock has birds of different species and
varying ages. In the backyard extensive system, birds are housed at night but allowed
free-range scavenging during the day. They are usually fed a handful of grains in the

19
morning and evening to supplement scavenging. The mentioned management systems
frequently overlap. Thus, free-range is sometimes coupled with feed supplementation,
backyard with night confinement but without feeding, and poultry cages in confined
spaces (Branckaert and Guèye, 1999).
The intensive system is normally based on specialized breeds and is found mainly in
urban and peri-urban areas, constituting less than 30 % of the total poultry population in
Africa. The extensive or scavenging system is based on indigenous chickens and is
mostly found in the villages (Kitalyi, 1999). According to Ramlah (2005), free-range
and semi-intensive systems of keeping local chicken are still the most popular and
viable production systems for rural households with little inputs; rarely would one find
village fowl being kept under the intensive system such as the deep litter or caged
system. Thus, intensive systems of rearing indigenous chickens commercially is
uncommon, a notable rare exception being in Malaysia, where the industry has
developed in response to the heavy demand for indigenous chickens in urban areas
(Supramaniam, 1988).
The traditional system of keeping the village fowl has been the backyard system
whereby the birds are let loose to scavenge for food, with housing provided at night, in
both the semi-intensive and free-range systems (Ramlah, 2005). However, the
effectiveness of the semi-intensive system is hampered by poor infrastructure (Yongolo,
1996).

20
2.1.9 The Way Forward in Local Chicken Production There is tremendous potential for improving and increasing the productivity of the local
poultry through small holder schemes. The success, however, depends on improving the
genetic potential and management of local poultry (Mukherjee, 1990). The major
constraints to production are poor housing, poor disease control, extremely high rearing
mortalities, and a lack of well-organised vaccination programmes and poultry extension
services (FAO, 1998).
According to Mukherjee (1990), the potential significance of local poultry for future
breeding strategy is still unidentified. However, Horst (1988) noted that the genetic
resource base of the indigenous chickens in the tropics is rich and should form the basis
for genetic improvement and diversification to produce a breed adapted to the tropics.
The low-input and low-out production of village chicken flocks could be improved
through improved management and disease control to reduce the large number of bird
losses (Kitalyi, 1998). The critical management objective for scavenging free-range
systems is to reduce the high mortality in both growing and adult age groups, of about
60 to 70 percent mortality. This high mortality means that a large proportion of eggs
laid by the hen need to be used for reproduction to maintain flock size, instead of being
used as a source of income or food. It also means that many birds that die could instead
be sold or consumed as meat (FAO, 1998).

21
Mortality can be significantly reduced through increasing farmer awareness of health
needs, through the provision of vaccine (especially for Newcastle Disease) and through
improving the nutrition of growing stock (for example, by providing a local mash to
supplement scavenging). These are the most important improvements to management
activities that will enable the farmer to best exploit the existing potential of local breeds
under scavenging free-range system (FAO, 1998).
The performance of local breeds will increase slightly under cage or deep litter
management ( Oluyemi et. al., 1979) but, because the genetic potential for egg
production (or meat production) of local breeds is lower than that of commercial
hybrids, the same investment in intensive management will achieve a much higher
production result by using commercial hybrids.
According to Kitalyi (1998), improved poultry housing resulted in lower chick mortality
(19%) relative to that observed in Ethiopia (66%) and Tanzania (33%), where no
housing improvements were made. Osei- Amponsah et al. (2007) found that, the
productivity of local chickens in Ghana could be improved if regular feeding is done. If
balanced feed, good health-care supplies, and day-old chicks of hybrid varieties were
locally available, then intensive poultry management could be an option. If these were
not available, raising local breeds under scavenging free-range systems was still the best
choice (FAO, 1998). Kitalyi (1999) suggested that specialized high yielding breeds are
necessary for improvement of local poultry but it should be preceded by improvements
in housing, feeding and disease control. There seems to be a possibility for laying birds

22
to adapt to diets with lower crude protein levels which will make possible, production
based on "home grown" crops even in Northern part of Europe (Sorensen, 2003).
2.2 Crossbreeding of Local Birds The village fowls, normally found in the rural and suburban areas of Africa, are no
longer a pure breed but rather the result of crossbreeding with various exotic stocks
introduced Africa (Ramlah, 2005). In village chicken production, uncontrolled mating is
practised, which is often modulated by indigenous breeding practices (Gondwe and
Wollny, 2005). The production performance of the first filial generation (F1) of local
birds crossed with improved breed is superior to the local ones and manifest heterosis
(Oluyemi, 1979; Isika et al., 2005). According to Oluyemi (1976) upgrading can
transform local chicks closer to the improved breeds than the direct importation of the
improved genotype. Local fowls perform lower than their crossbreds and growth rate is
not positively influenced by dietary manipulations. Crossbreds benefit more from
increasing dietary crude protein (200 g/kg – 240 g/kg) with age to the extent of their
growth potential (Isika et al., 2005). Crossbreeding indigenous chickens with exotic
breeds improves growth traits, which include traits like live weights, daily gains and
feed intake (Omeje and Nwosu, 1988; Asiedu and Weever, 1993).
Crossbreeding of the indigenous chickens with an exotic breed tends to improve the egg
size of the crossbred progeny due to the positive genetic correlation between body size
and egg size. Indigenous chicken crossbreds tolerate higher environmental temperatures
than broilers. According to Katule (1992), in a cross between indigenous and exotic

23
strain of chickens, the F1 generation had better growth rate than any of the parental
breeds, indicating existence of heterosis for this trait. However, breeds that attain sexual
maturity early end up laying lighter eggs than late maturers (Oni et al., 1991). Fayeye et
al. (2005) reported that Fulani-ecotype, a local crossbred in Nigeria was found
significantly better in shell thickness, yolk index and Haugh unit than Yaffa and ISA
Brown layers (Oguike and Onykweodiri, 1999). According to Isikwenu et al. (1999)
yolk index and haugh unit are the best indicators of internal egg quality; and the higher
the yolk index (Ayorinde 1987) and haugh unit the more desirable the egg. Cheong and
Chung (1985) developed two-way White Leghorn crossbreds that preformed better than
both parents in hen-day and hen-housed egg production with 3.78 and 6.16 percent
heterosis, respectively. They also had similar results in survival rate, age at sexual
maturity, and body weight. In Egypt, the White Mamourah breed was developed by
crossing Alexandria males and inbred Dokki-4 females, and then backcrossing the F1
females to Alexandria males. The crossbred birds were superior in economic traits such
as body weight, breast width, and feed conversion ratio (Abdel-Gawad et al., 1980).
2.3.0 Mutant Genes in Chickens
According to FAO (1998), seven mutants that are common among local birds in the
tropics and are found to be potentially useful are: Na - naked neck; Dw - dwarf; K -
slow feathering; Fa - Fayoumi ; F - frizzle ; H - silky; and Fm - fibro-melanosis. The
use of these genes to improve productivity in small holder poultry breeding programmes
has been researched in various tropical countries, including Indonesia, Malaysia,

24
Thailand, Bangladesh, Bolivia, India, Cameroon and Nigeria (Horst, 1988; Mukherjee,
1990; Barrio et al., 1991; Mathur, 2003; FAO, 1998; Njenga, 2005; Cahaner, 2007).
It has been found that, the use of single or combined dominant genes for feather
restriction (Na) and feathering structure (F), as well as the sex-linked recessive gene for
reduced body size (dw), has positive effect on productivity of birds in the tropics (Horst,
1989; Haaren-Kiso et al., 1995). Research into the effects of these genes on economic
factors has been undertaken in most African and Asian countries (Khadijah, 1988;
Mathur and Horst, 1989).
2.3.1 The Naked Neck Gene and its Effects on the Performance of Chickens
The naked neck gene in chickens is caused by an autosomal gene which exhibits
incomplete dominance (Davenport, 1914; Warren, 1933). The naked neck gene was
assigned the symbol Na by Hertwig (1933). It is incompletely dominant with the
heterozygous (Nana) birds showing an isolated tuft of feathers on the ventral side of the
neck above the crop, while the homozygous (NaNa) birds either lack this tuft or it is
reduced to just a few pinfeathers or small feathers (Crawford, 1976). The resulting bare
skin becomes reddish, particularly in males as they approach sexual maturity (Hutt,
1949; Somes 1990). The apteria of birds carry scattered down and semiplume feathers
but that of the naked neck birds contain no feathers. The feather tracts themselves are
either absent or reduced in area so that birds have greatly reduced feather cover (Horst,
1982; 1987; Merat, 1990). Anonymous (2005) stated that naked neck birds are happy to
free range or be confined in runs and are not known as being particularly good fliers;

25
they however need protection in extremely cold temperatures because of their lack of
feathers but can cope remarkably well in very hot climates; they are easy to tame, very
placid and calm.
According to Bordas et al. (1978), the feather coverage of naked neck birds is reduced
by 20 - 30% and 30 - 40% respectively in the heterozygote (Nana) and homozygote
(NaNa). This reduction in feather coverage facilitates better heat dissipation and
improves thermoregulation resulting in better relative heat tolerance in hot climates. At
a temperature of 30oC or higher, homozygous or heterozygous naked neck birds were
heavier than their normal feathered counterparts and their feed efficiency was at least
equal (Merat, 1986). In studies involving fast growing naked neck and normal
feathered birds, a higher growth rate and meat yield were exhibited by the naked neck
birds compared to their normally feathered counterparts when reared at high or
moderate ambient temperatures (Merat, 1986; Cahaner et al., 1993; Eberhart and
Washburn, 1993). Mahrous et al. (2008) reported that under moderate temperature, the
naked neck (Nanaff) and naked neck frizzled (NanaFf) genotypes had significantly
heavier body weight compared to their normal feathered (nanaff) counterparts. They
added that, the presence of the Na gene in a single state or interacted with F gene,
significantly improved feed conversion ratio compared to their nanaff sibs.
Under constant heat stress the heterozygous naked neck (Nana) layers have significantly
higher egg number, egg weight, egg mass, body weight and productivity index than the
normal feathered (Somes, 1988; Hareen-Kiso, 1991; Mathur, 2003). However,

26
according to Mathur (2003) under natural conditions there were large differences in the
performance of naked neck birds in terms of egg number, egg weight, egg mass, body
weight and productivity index at different locations (Turkey, Egypt, Cuba, Burundi,
Bolivia and Malaysia).
The reduction of plumage (20 - 40%) gives 1.5 - 3.0% more carcass yields to the naked
neck genotypes than their normal feathered counterparts regardless of the temperature.
Due to the higher proportion of muscle in the pectoral region of naked neck birds, there
is 1.8-7.1 percent more meat in them than normal feathered birds when their carcasses
are dressed (Merat 1986). Fathi et al. (2008) reported that the naked neck genotypes
(NaNa or Nana) exhibited higher relative weight of dressed carcass, drumstick and
breast muscles compared to normally feathered individuals (nana) and that the
proportion of abdominal fat was decreased in both naked neck genotypes compared
with normally feathered ones. Intramuscular and subcutaneous fat in naked neck birds
is low due to the utilization of a larger fraction of energy for thermoregulation (Merat,
1990). N’Dri et al. (2005) observed that slow growing homozygous and heterozygous
naked neck birds under fluctuating temperature, tended to reach the weight of 2 kg 3.3
days sooner than normally feathered birds and that carcass yield of Na birds was higher
than that of normally feathered birds (81.6 % vs. 80.0 %). Singh et al. (1996) reported
that heterozygous naked neck broilers gained about 3% more weight than their normally
feathered counterparts under commercial conditions during the spring and summer
months, and that this advantage was almost tripled at high ambient temperature of about
32°C.

27
Rauen et al. (1986) reported that egg numbers were not significantly affected by the
naked neck gene at moderate temperatures; however, naked neck hens had a better
laying rate at high temperatures. Adult body weight of naked neck hens was slightly
higher than full plumage ones at temperatures above 30oC, nevertheless, the situation
was reversed at temperatures below 20oC. They added that, although the ratio of egg
weight to body weight was increased by the Na gene at any temperature, the increase of
mean egg weight in NaNa and Nana genotypes compared with nana was lower at
moderate temperature than at high temperature where it reaches 3 - 4g for the naked
neck homozygote. In a study under temperate and subtropical conditions in Taiwan and
France, Chen et al. (2008) reported that the naked neck genotype had a negative effect
on body weight and a positive effect on feed intake, feed efficiency, clutch length and
egg weight. Above 30oC feed efficiency was superior for naked neck females compared
to their normal feathered counterparts. Fraga and Lam (1987) found better egg shell
strength for the Na/na genotype. Rauen et al. (1986) observed that the advantage of the
Na gene at high temperature for egg production mainly involved persistency of laying,
and was more marked in medium-sized than in light strains.
At temperatures of 18oC and 30oC, Hammade et al. (1987) obtained at successive ages a
larger semen volume and a higher number of spermatozoa per ejaculate for NaNa than
for nana males, with intermediate values for heterozygotes without any genotype –
temperature interaction. Ladjali et al. (2005) studied the abnormalities in embryos of
naked neck and normal feathered hens and found that the naked neck females showed a

28
much lower proportion of abnormal embryos than normally feathered females whatever
the temperature.
An increase of embryonic mortality (up to 10% in pure strains) was associated with the
NaNa and Nana genotypes (Crawford, 1977, 1978; Horst, 1982; Rauen, 1985 and
Merat, 1986). Post embryonic chick mortality was not different for naked neck and fully
feathered chicks except when exposed to heat stress above 40oC, in which case the
mortality of fully feathered chicks was slightly higher than their naked neck
counterparts (Merat, 1990). Adult mortality did not differ between the naked neck and
normal feathered birds at 20oC; however, at 30oC or more, mortality for heterozygous
naked neck layers was lower than their fully feathered counterparts (Rauen et al., 1986).
There was less frequent cannibalism among naked neck birds and this may have a
relation to survival rate (Barrio et al., 1987).
Naked neck birds are superior to normal feathered birds for growth, feed efficiency,
carcass traits, viability, immunocompetence, blood biochemical parameters and
mortality (Barrio et al., 1991). Haushi et al. (2002) studied the naked neck and the
normal feathered phenotypes for general immunocompetence by assessing antibody
response to SRBC (Sheep Red Blood Cell), haemolytic complement level in the serum,
in-vivo cell mediated immune (CMI) response to Concanavalin-A (Con-A) and a
phagocytic index at 10 - 12 weeks of age. They found that the naked neck gene did not
seem to influence the antibody response to SRBC, CMI to Con-A or the phagocytic
index; however, a significantly higher (P<0.05) haemolytic complement level in serum

29
was observed in birds carrying a copy of the Na gene as compared to the normally
feathered birds. Mahrous et al. (2008) studied the immunocompetence of naked neck
and naked neck-frizzle genotypes and reported that, total antibody titer against Sheep
Red Blood Cells (SRBCs) and Cutenous Basophilic Hypersensitivity (CBH) increased
significantly within Na- and Na-F- genotypes compared to nanaff genotypes; likewise,
naked neck and naked neck-frizzled birds had significantly higher carbon clearance
index (lower carbon particles in their blood circulation) compared to normally feathered
counterparts. They concluded that the naked neck gene in a single state or in
combination with the frizzle gene significantly increased immune response of chickens
under moderate temperature; therefore, introducing the naked neck (Na) gene in
selection programs for disease-resistance must be advisable, particularly in unfavorable
environments.
The naked neck gene has a higher resistance to coccidiosis-causing protozoa- E. tanella
and E. necatrix (Barrio et al., 1991; Banga Mboko, 1996). Naked neck broilers are
superior to their normal feathered counterparts in both winter and summer in terms of
growth rate, feed efficiency, dressing percentage and liveability, however the difference
is higher in summer than in winter (Singh et al., 1998). According to Sharifi (2006), the
use of the naked neck gene (Na) in the homozygous form under high temperatures
results in a distinct improvement of survival ratio of hens, growth and components of
reproduction like number of eggs, egg weight, shell quality, proportion of settable eggs,
fertility, number of chicks hatched and chick weight as compared to their normal
feathered counterparts. He added however that, due to an increase in embryonic

30
mortality as a result of the naked neck gene, the naked necks (NaNa) were inferior to
the normal hens (nana) for hatchability when the embryos were homozygous for the
Na-gene. He noted, on the other hand that, if the embryos were heterozygous
descending from a nana x NaNa mating plan, NaNa hens were superior to nana hens in
hatchability. It was further stated that, under temperate conditions, the growth rate of
NaNa hens was reduced compared to nana hens; but in the components of reproduction
performance, differences were not significant (P>0.05) between both genotypes; an
exception was found only in hatchability and consequently in the complex trait of
number of chicks hatched.
The annual egg production of indigenous naked neck birds is 50 - 55 eggs per hen
(Akhtar-Uz-Zaman, 2002). According to Njenga (2005), among the indigenous birds of
Kenya (naked neck, frizzle, dwarf and normal feathered) the naked neck was superior in
terms of body weight, egg weight, eggshell thickness, growth rate up to 5 weeks and
survivabilty (low mortality). However, fertility was lowest for naked neck. Moreki and
Masupu (2003) reported that under scavenging conditions the naked neck genotype was
superior in egg production and hatchability. Desai et al. (1961) reported 106, 68 and 86
eggs per bird per year for Bare-neck (naked neck), large Baladi and Betwil (indigenous
chickens in Sudan) respectively. However, Mohammed et al. (2005) did not find any
significant difference in hen-day egg production, hen-housed egg production and egg
shell thickness when they studied the three phenotypes mentioned ealier; the naked neck
was only superior in live weight. Additionally, the studies of Singh et al. (1996) in India
did not show any significant difference between the indigenous naked neck and other

31
ecotypes in terms of age at sexual maturity, 40-week body weight, annual egg
production, clutch size, fertility and hatchability except egg size, which was
significantly heavier within the naked neck ecotype compared to other ecotypes.
Indigenous naked neck birds are able to protect themselves and their chicks from
predators because of their alertness and fighting characteristics. They can thrive well
under adverse environment, poor housing, management and nutrition with variable
temperature and relative humidity. Due to their fewer feathers, they save protein that
may be used for meat tissues (Horst, 1987; Merat, 1990). The reduction in their protein
requirement results in a reduced incidence of feather pecking and cannibalism (Merat,
1990). Akhtar-Uz-Zaman ( 2002) noted that the reduction in feather coverage of naked
neck birds enabled them to receive more solar radiation, which might facilitate greater
vitamin D synthesis and in turn, contributes to better shell quality. It was added that,
naked neck birds interact well when crossed with other stocks and this resulted in better
performing progeny. The 40 percent less feather coverage in naked neck birds reduced
considerably the need for dietary nutrition to supply protein input for feather
production. This makes them suitable for village chicken production since protein is a
limiting factor in many scavengers feed resource bases (FAO, 2002).
Báldy et al. (1954) conducted a study aimed at making the native Hungarian naked neck
bird uniform in colour and body shape, improving egg production together with body
weight and meat quality. This work resulted in a good dual-purpose (meat and egg)
Hungarian naked neck chicken breed, which was propagated all over the country and

32
abroad. Singh et al. (1996) noted that, the naked neck gene had positive effects on
growth, feed efficiency, body composition and meat yield in broilers and also egg
laying, egg quality traits, reproduction and liveability in broiler breeding and laying
birds. They concluded that, the future use of this genotype at high ambient
temperatures, either for meat or egg production would be very encouraging.
According to Merat (1986), there was a considerable opportunity to utilize the genetic
variability that existed among random mated indigenous stock, in particular, the naked
neck genotype. The naked neck gene can be used to develop stocks that are better able
to survive under tropical conditions and to produce increased quantities of egg (Akhtar-
Uz-Zaman, 2002). Among the indigenous genotypes, the naked neck is superior in egg
production, egg size and body weight in an environment where the average temperature
is about 30oC (Yoshimura et al., 1997). Mathur (2003) concluded that the naked neck
genotype was more suitable for the tropical climatic conditions and their superiority was
greater with increasing heat stress.
2.3.2 The Frizzling Gene and its Effects on the Performance of Chickens The frizzling phenotype is caused by a single autosomal incompletely dominant gene, F
(Hutt, 1930; Landauer and Dunn, 1930). The effects of the frizzle gene are greatly
restricted by an autosomal recessive modifying gene, mf. In unmodified homozygous
frizzled birds, the rachises of all feathers are extremely recurved with barbs also being
extremely curled. These feathers are easily broken and therefore the birds appear quite
bare. The modifying gene lessens the extreme aspects of the homozygotes so that they

33
appear less woolly. Unmodified heterozygous have the feather shafts and barbs
recurved, to a much less extent than the homozygotes, and the rectrices and remiges are
much less affected. However, when the modifier gene is present heterozygous birds are
almost indistinguishable from the normal feathered phenotypes (Landauer, 1933; Hutt,
1936; Somes, 1990). According to Anonymous (2005) the chicks appear to be normally
feathered when they are hatched but the wing feathers soon start to grow and turn
outwards. The frizzling gene is a feather structure gene (Horst, 1988) that causes a
reduction in tropical heat stress by improving the bird's ability for convection, resulting
in improved feed conversion and better performance (Merat, 1990). Benedict et al.
(1932) found a considerable increase in energy metabolism for frizzled birds, implying
that they will respond differently from normal feathered birds to high temperatures.
The frizzle gene has favourable effects on production traits such as egg number, egg
weight, egg mass, body weight and productivity index but less pronounced than the
naked neck gene (Somes, 1988; Mathur, 2003). Mahrous et al. (2008) reported that
under moderate temperatures the frizzled (nanaFf) and the naked neck frizzled (NanaFf)
genotypes had significantly heavier (P<0.05) body weights compared to their normally
feathered (nanaff) counterparts. However, according to Mathur (2003) under natural
conditions there are large differences in the performance of frizzle birds in terms of egg
number, egg weight, egg mass, body weight and productivity index at different
locations (Turkey, Egypt, Cuba, Burundi, Bolivia and Malaysia).

34
In a study to evaluate the general immunocompetence of the frizzle and normal
feathered phenotypes by assessing antibody response to SRBC (Sheep Red Blood Cell),
haemolytic complement level in the serum, in-vivo cell mediated immune (CMI)
response to Concanavalin-A (Con-A) and a phagocytic index at 10-12 weeks of age,
Haushi et al. (2002) found that the frizzle gene does not seem to influence the antibody
response to SRBC, CMI to Con-A or the phagocytic index. However, Mahrous et al.
(2008) studied the immunocompetence of frizzle and naked neck-frizzle genotypes and
reported that total antibody titre against sheep red blood cells (SRBCs) increased
significantly in F- and Na-F- genotypes compared to nanaff genotype; likewise, frizzled
and naked neck-frizzled birds had significantly higher carbon clearance index (lower
carbon particles in their blood circulation) compared to their normally feathered
counterparts.
The basal metabolism of frizzle birds is accelerated leading to increased production of
both thyroid and adrenal gland hormones. Food intake, oxygen consumption, heart rate
and volume of circulating blood are increased, resulting in enlargement of heart, spleen,
gizzard and alimentary canal in frizzled birds (Benedict et al., 1932; Boas and
Landauer, 1933, 1934; Landauer and Aberle, 1935; Landauer and Upham, 1936). The
effect of this gene on production has been shown to be favourable by an increase in egg
number and egg mass, alongside a reduction in mortality under hot conditions (Horst,
1987).

35
Under high ambient temperatures, the frizzle gene in heterozygous form (Ff) has
positive effect on survival rate, laying performance and fertility while under moderate
temperatures the frizzle gene in heterozygous form has no significant impact on survival
rate, growth and the components of reproductive performance (Sharifi, 2006).
According to him, the survival ratio of hens and components of reproductive
performance such as number of eggs, egg weight, shell quality, proportion of settable
eggs, fertility, hatchability, number of chicks and chick weight clearly improve if the F-
gene is present in homozygous form (FF). Furthermore, under temperate conditions, the
effect of the homozygous F-gene on reproductive performance is inconsistent. While
survival ratio of hens, egg shell quality, fertility, egg weight and weight of chicks
improve by the presence of the F-gene, number of eggs and number of chicks are
distinctly reduced. The reason for the depressive effect of the homozygous F-gene on
laying intensity consists in the delay in age at first egg which occurs under moderate
and high temperatures. This deficiency gains a considerable dimension when the frizzle
gene is combined with the dwarfism gene (FFdw-) especially under temperate
conditions, adding up to a triple interaction (Sharifi, 2006).
Missohou et al. (2003) studied frizzle, sex- linked dwarfism, normal feathered and
combined frizzle and sex- linked dwarfism birds under Senegalese conditions and found
that, the interaction between the two genes is only positive for growth traits and egg
number. They noted that, neither of the two genes significantly influenced egg quality.
The frizzle phenotype has the highest chick weight within the first week of life among
indigenous phenotypes such as the naked neck, dwarf and normal feathered birds

36
(Njenga, 2005). According to Mukherjee (1990), frizzling and silky feathering
structures are exceptions to the normal feather structure within indigenous fowls.
Among indigenous chickens, the frizzle is normally pecked (Njenga, 2005).

37
CHAPTER THREE
3.0 MATERIALS AND METHODS
3.0.1 Introduction
Five studies were conducted. The first two were field surveys and the last three were
experiments. To improve local birds, it is imperative to have a good knowledge about
their current performance. Therefore the first survey (Study one) dealt the current
performance of local chickens in terms of their productive and reproductive traits,
profitability and the major challenges hindering their productivity. The second survey
(Study two) focused on the potential of naked neck and frizzle genes within the
population of local chickens. In the first of the three experiments conducted (Study
Three), there were two matings. The first one was between indigenous naked neck
males (Nana) and Lohmann commercial layers (nana). The second was an inter se
mating of the first generation heterozygous naked neck birds (Nana). Productive and
reproductive performance of the parental generations were studied. There were also
comparative studies between first generation birds (heterozygous naked neck (Nana)
birds and normal feathered (nana) ones), and also between second generation birds
(NaNa (homozygous naked neck), Nana & nana). The second experiment (Study four)
was conducted in a similar way as the first. The only exception was that the matings
involved frizzles instead of naked necks. In the third experiment (Study five), all the
five genotypes (NaNa, Nana, FF (homozygous frizzle), Ff (heterozygous frizzle) and
nana/ff (normal feathered)) from the two previous experiments were studied under three
management systems (Intensive, semi-intensive & extensive). However, comparative
studies in terms of productive and reproductive performances were conducted between
naked neck (NaNa, Nana) and frizzle (FF, Ff) phenotypes since all the other

38
comparisons have already been made. The effect of a management system on the
productive and reproductive performances of the birds were also looked at.
3.1 STUDY ONE: THE CURRENT PERFORMANCE OF INDIGENOUS CHICKENS IN THE ASHANTI REGION OF GHANA 3.1.1 Study Areas and Duration
The study was conducted in the Ashanti Region of Ghana. Three districts, namely:
Asante–Akim South (AAS), Bosomtwe Atwima-Kwanwoma (BAK) and Ejisu-Juaben
(EJ), (Fig. 3.1.1), were selected based on convienience, for the survey. Three
villages/towns were convieniently selected from each district (AAS – Juaso, Yawkwei
and Nkwanta; BAK – Jachie, Kuntananse and Abono; EJ – Kwamo, Ejisu and Kwaso)
and fifteen chicken keepers within each village/town were randomly selected and
interviewed. Therefore, a total of forty- five keepers from each district and a grand total
of one- hundred and thirty five were involved in the study. The study lasted for two
months: from December 20, 2005 to February 16, 2006
3.1.2 Data Collection
The study was done through formal and informal interviews. The formal interviews
were aided by a structured questionnaire (Appendix 1A). The questionnaire used for the
interviews was made up of both pre-coded and open-ended questions. Information
ascertained included flock size, years in chicken keeping, management system, feed
supplementation, weights of birds and eggs, number of eggs per clutch, clutches per
year, average number of eggs per year, hatchability of eggs, survivability of chicks,
total mortality, sales of eggs and birds per year, cost of production, health of birds,

39
purpose of keeping the birds, economics of keeping the birds and various challenges
faced by keepers and their suggested solutions.
3.1.2.1 Weights of Birds
Weights of cocks, hens, chicks and eggs were taken during the survey by the use of
galvanized and electronic weighing scales. Chicks from day-old to five days of age in
all the house holds visited were weighed and the average was taken. Males and females,
six months of age or above were also weighed and the averages were taken as the
weights of cocks and hens respectively.
3.1.2.2 Profitability of Production This was simply calculated by deducting the cost of production per year from the sales
of birds and eggs per year.
3.1.2.3 Health of Birds
To know the health status of the birds, the keepers were asked whether vaccines,
antibiotics or any drugs had ever been given to the birds. Symptoms of diseases that
attack the birds, mortality rate, and other causes of mortality apart from diseases were
also ascertained.
3.1.2.4 Mortality
Survivability of chicks was measured as the average percentage of chicks hatched that
survived beyond six weeks of age; while total mortality was calculated as the average

40
percentage of the flock lost per year. These parameters were calculated with the help of
the keepers.
3.1.3 Analysis of Data Genstat software (2007) was used to estimate the means and their standard deviations.
Microsoft excel was also used for the pictorial presentation of the data.
Fig. 3.1.1: Map of Ashanti Region, Showing the Study Areas

41
3.2 STUDY TWO: THE POTENTIAL OF INDIGENOUS NAKED NECK (NaNa, Nana) AND FRIZZLE (FF, Ff) BIRDS 3.2.1 Study Areas and Duration
The study was conducted in the Ashanti region of Ghana. Three districts, namely:
Asante–Akim South (AAS), Bosomtwe Atwima-Kwanwoma (BAK) and Ejisu-Juaben
(EJ), were convieniently selected for the survey. Three villages/towns were selected
based on convienience from each district (AAS – Juaso, Yawkwei and Nkwanta; BAK
– Jachie, Kuntananse and Abono; EJ – Kwamo, Ejisu and Kwaso) and ten chicken
keepers within each village/town were randomly selected and interviewed. Therefore, a
total of thirty chicken keepers from each district and a grand total of ninety chicken
keepers were involved in the study. The study lasted for two months: from December
20, 2005 to February 16, 2006
3.2.2 Data Collection
The study was done through formal and informal interviews. Participatory Rural
Appraisal (PRA) tools were also employed in some situations. The formal interviews
were aided by a structured questionnaire (Appendix 1B), which had both pre-coded and
open-ended questions. Information ascertained included percentage of frizzle (FF, Ff),
naked neck (NaNa, Nana) and normal feathered birds in the flock. Weights of birds and
eggs, number of eggs per clutch, clutches per year, average number of eggs per year,
hatchability of eggs, egg quality parameters, carcass parameters, chick mortality and
total mortality were measured for each phenotype (naked neck, frizzle and normal
feathered).

42
3.2.2.1 Weights of Birds and Eggs
Day-old chicks of each phenotype (Nana, Ff, nanaff) were not available during the
survey and therefore average weight of chicks within the first five days of life was used
as the weight of chicks for each of the phenotypes. Average weights of males and
females not less than six months of age were taken as the average age of cocks and hens
respectively for each phenotype. All the eggs available for each phenotype were
weighed and the averages were taken as the weight of eggs. These parameters were
assessed with the assistance of the keepers.
3.2.2.2 Mortality
Chick mortality was measured as the percentage of chicks that died within the first six
weeks of life for each phenotype (Nana, Ff, nanaff). Total mortality was calculated as
the percentage of birds that did not survive to the end of their useful lives for each of the
phenotypes.
3.2.2.3 Egg Quality Parameters
Egg quality parameters measured included shell thickness, albumen height, yolk height,
yolk diameter, yolk colour score and Haugh unit. Fifteen eggs from each phenotype
within each district were randomly selected and the various egg quality parameters were
determined at the laboratory of the Department of Physics, KNUST, Kumasi. The eggs
were weighed, broken and gently poured on a plastic plate so as to have the thick
albumen and the yolk at their normal positions. After breaking the eggs for albumen
height, the remaining liquid inside the eggshells was washed out manually, membranes

43
were removed, and the shells were dried at room temperature (21-27°C) for one week
before measuring the shell thickness. To obtain the average value of eggshell thickness,
2 points along the egg equator and 2 points at the egg poles were selected for each
eggshell. Electronic digital balance was used to measure egg weight; micrometer
screw-gauge was used to measure shell thickness; spherometer was used to measure
albumen height and yolk height; straight rule was used to measure yolk diameter and
yolk colour score fan was used to measure yolk colour score. Haugh unit was calculated
from egg weight and albumen height using the formula:
HU= [100Log (HA-/G (30W 0.37-100)) +19]/100 (Panda, 1996)
Where,
HU = Haugh unit
HA = observed albumen height (mm).
G = gravitational constant, 32.2
W = observed weight of egg.
This procedure used in measuring egg quality parameters was repeated in Studies 3, 5
and 5
3.2.2.4 Carcass Parameters
Two cocks which were six months old from each phenotype within each district were
randomly selected. The birds were starved for twelve hours, slaughtered, bled, scalded,
defeathered, eviscerated and then cut into parts. The gizzard and the intestines were
emptied before weighing. The following carcass parameters were measured:
defeathered weight, dressed weight, breast muscle weight, thigh and drum stick weight,
wing weight, intestine weight, gizzard weight and liver weight. These parameters were

44
expressed as a percentage of live weight before slaughter. This was repeated in studies
3, 4 and 5
3.2.3 Analysis of Data
The data were analyzed using the following linear models;
Egg Production Parameters:
Yij = µ + Gi + Dj + E ij
Where Yij = Observation for a given variable
µ = Overall general mean common to all observations
Gi = Genetic effect due to ith genotype (i= 1, 2, 3)
Dj = Environmental effect due to jth district (j = 1, 2, 3)
Eij = Random error effects peculiar to each observation.
Growth Parameters, Egg quality parameters, Carcass Parameters and Mortality: Yi = µ + Gi + E i
Where Yi = Observation for a given variable
µ = Overall general mean common to all observations
Gi = Genetic effect due to jth genotype (i= 1, 2, 3)
Ei = Random error effects peculiar to each observation.
Analysis of variance (ANOVA) was performed by using Genstat Software (2007).

45
3.3 STUDY THREE: MATING COMMERCIAL LAYERS (nana) WITH LOCAL NAKED NECK MALES (Nana), AND COMPARING THE PRODUCTIVE AND REPRODUCTIVE PERFORMANCE OF THE FIRST AND SECOND FILIAL GENERATION (F1 & F2) NAKED NECK BIRDS (NaNa, Nana) WITH THEIR NORMAL FEATHERED (nana) COUNTERPARTS 3.3.1 Location and Duration of Experiment
The experiment was carried out at the Animal Science Department, Kwame Nkrumah
University of Science and Technology (KNUST), Kumasi (Altitude 261.4MSL,
Latitude 06o 41’N and Longitude 01o 33’W), (Meteorological Services Department,
Kumasi); and three selected villages/towns within the Asante-Akim South District of
Ashanti Region, namely, Yawkwei, Juaso and Nkwanta. These villages were selected
based on convienience and availability of reliable chicken keepers. The average
rainfall, temperature and relative humidity of the KNUST experimental station during
the experimental months are presented in Appendix 3
The experiment extended from May, 2006 to December, 2007. This also applies to
studies 4 and 5
3.3.2 Experimental Birds
Thirty-six (36) Lohman brown layers and four (4) indigenous heterozygous naked neck
(Nana) males were used in the initial crossing. The Lohmann layers were received from
Akate Farms Limited, Kumasi at the age of 52 weeks. The local naked neck males were
bought from four different villages/towns/cities within the Asante-Akim South District
and Kumasi Metropolitan Area of Ashanti Region, namely, Yawkwei, Juaso, Nkwanta
and Kumasi (Central Market). The four sires varied in colour, which helped in their
identification. The sires were between nine and fourteen months of age.

46
The indigenous naked neck males were feet-washed with disinfectant to avoid spread of
infections before they were brought to the Animal Science Department, K.N.U.S.T. The
naked neck males were dewormed and vaccinated against Newcastle disease
(Newcavac). All birds were weighed individually. The indigenous naked neck males
were then housed with the Lohman layers in a ratio of 1:9 to ensure natural mating.
3.3.2.1 Management
The birds were kept in a deep litter system for three months. They were fed layer mash
ad-libitum (17.5% CP and 2700 kcal ME/kg) and were also provided with fresh water
ad libitum. Each of the four pens had two laying boxes measuring 30 cm x 30 cm. Eggs
were collected twice daily, labelled and stored for not more than 7 days at room
temperature (21o C to 27o C) before incubation.
The birds were dusted with Malathion poultry dust (Kepro, Netherlands) against lice,
soft ticks and mites. They were also dewormed and given Pen Strip (Kepro,
Netherlands), which is a source of antibiotic and vitamins. This applies to the second
parents and also studies 4 and 5.
3.3.2.2 Incubation
The eggs were selected for artificial incubation by discarding very small eggs or very
large eggs, broken shells, blood stained or dirty eggs. The eggs were incubated and
hatched at the hatchery of Akropong Farms, a commercial hatchery based in Kumasi.

47
The incubation was done weekly for ten consecutive weeks. This applies the generation
of the F2 birds and also study 4.
3.3.2.3 Chick Rearing After hatching, each batch of chicks was brooded in one unit of the brooder house.
Electric bulbs (100watts) were used to provide light and the required heat for the chicks.
The chicks were wing-tagged and weighed individually. Glucose was administered via
the drinking water. Commercial chick mash from AGRICARE Ghana Ltd. (19.5%CP
and 2800Kcal ME /Kg) and fresh drinking water were given ad libitum. The chicks
were vaccinated against Newcastle and gumboro diseases. Coccidiostat, antibiotics and
vitamins were also given through their drinking water during the first month. The
growth rates of chicks were recorded weekly up to the sixth-week. This apply to the F2
birds and also in study 4.
3.3.2.4 Parents for the Second Generation Birds
At the end of the sixth week, twenty (20) heterozygous naked neck males and one-
hundred and twenty (120) heterozygous naked neck females were selected to be mated
inter se to produce the second generation. The males were kept separately from the
females. The birds were fed commercial grower mash from AGRICARE Ghana Ltd.
(15% CP and 2650 kcal ME/Kg) at six weeks of age and layer mash (from AGRICARE
Ghana Ltd) at seventeen weeks of age (17.5% CP and 2700 kcal ME/kg). Feed and
fresh water were given ad libitum. They were vaccinated against fowl pox and
Newcastle (Newcavac) diseases. Deworming and vitamin supplementation was done

48
after every three months via their drinking water. Four weeks after the first egg has
been laid, the males were introduced to the females in a ratio of 1:10; and collection of
eggs for incubation took place two weeks thereafter. Chicks were reared up to six
weeks. After the sixth week, these second filial generation (F2) birds were transferred to
the three villages mentioned in section 3.1. This is also applicable to study 4.
3.3.2.5 Matings Involving Indigenous Naked Neck and Commercial Layers There were two crosses. The first cross was between 36 normal feathered Lohmann
layers (nana) and 4 indigenous heterozygous naked neck males (Nana), producing
offspring that were 48.7% heterozygous naked neck (Nana) and 51.3% normal
feathered birds (nana) in the first filial generation (F1). The second cross was an inter se
mating of the heterozygous naked necks (Nana) from the F1 generation. The second
cross produced offspring that were 16.8% homozygous naked neck (NaNa), 54.5%
heterozygous naked neck (Nana) and 28.7% normal feathered (nana/ff) birds. Both F1
and F2 birds were made up full-sib and half-sib sire families but due to the difficult of
separating these, they were reared together as sire families. The two crosses are
diagrammatically shown below:
First Mating Second Mating
First Parents (P1): Male Female Second Parents (P2): Male Female
(Indigenous) Nana × nana (Lohmann) Nana × Nana (inter se)
(48.7%) Nana (51.3%) nana (F1) (16.8%) NaNa (54.5%) 2Nana (28.7%) nana (F2)

49
3.3.2.6 Selection and Training of Chicken Keepers The chicken keepers used for the study were selected prior to the study. The selection
was done during an earlier survey to assess the performance of local chickens in Ghana.
Six keepers were selected from each of the three villages/town (Yawkwei, Juaso and
Nkwanta). The selection was based on the ability to read and write, reliability and also
interest in keeping local birds. Each keeper made a hen-coop or prepared a place for the
birds and these were inspected prior to the transfer of the birds.
A top-loader weighing scale was given to each keeper. They were trained on simple
poultry management practices such as feeding and giving water under sanitary
conditions, culling, litter changing, maintaining clean coop, recording age at first egg
and counting of the number of eggs per clutch. To quantify the amount of feed given
daily, each keeper was made to use a single container filled to the brim for giving feed
all the time. This section applies also to studies 4 and 5
3.3.2.7 Chick Transfer and Rearing at the Villages
At the end of the sixth week, the chicks were transferred to the villages for rearing
under, semi-intensive system. Each keeper was first given 48 F1 birds, 12 from each of
the four males, and these twelve birds, from each male, were made up of three males
and three females each of heterozygous naked neck and normal feathered birds. For the
second generation birds (F2) each keeper was given the same number of birds (48), 16
from each of the three genotypes (homozygous naked neck, heterozygous naked neck

50
and normal feathered). There were eight males (8) and eight females (8) for each
phenotype.
The keepers kept the birds either in a locally designed hen-coop or in an uncompleted
building that is roofed, in which case the cemented floor was covered with wood
shavings. Each keeper was guided to prepare his own mash to supplement scavenging
feeds. The mash was prepared mainly from milled-maize or milling waste mixed with
smoked fish waste, palm kernel cake and wheat bran. The mash was given to the birds
thrice daily. Fresh water was provided ad libitum either in a plastic bowl or an earthen
ware pot. All the keepers put “prekese” (Tetrapleura tetraptera), which is considered to
have medicinal properties in the water. The section applies to study 4.
3.3.3 Data Collection 3.3.3.1 Performance of the First Parents (P1)
Ages of the indigenous heterozygous naked neck males used as the First Parents (P1)
were estimated with the help of the keepers; and their initial body weights were taken
prior to the mating. Other records taken on them included biweekly body weight,
fertility and hatchability. Records taken on the Lohmann layers used as the First Female
Parents (P1) included initial body weight, biweekly body weight, rate of lay, egg weight
and hatchability. Record on their age was obtained from Akate Farms and Trading
Company Limited. This is repeated for the second parents and also in study 4.

51
3.3.1.1 Fertility and Hatchability
The incubated eggs were candled on the eighteenth day, and fertility was calculated as a
percentage of the number of fertile eggs divided by the number of eggs set. The hatch
was pulled on the twenty-first day and the hatchability calculated as the total number of
chicks hatched divided by total fertile eggs set multiplied by hundred. This is applicable
to the F2 parents and also in study 4.
3.3.3.2 First Filial Generation (F1) Birds
Records on the F1 birds were taken up to sixth week at the Department of Animal
Science, K.N.U.S.T., Kumasi and continued in the villages when the birds were
transferred except those used as parents (P2) in the second mating which remained at the
Department of Animal Science. The records taken included weight of day-old chicks,
weekly body weight and weight gain (this was done up to sexual maturity), shank
length, body length, body width, chick mortality, total mortality, age at first egg, rate of
lay (hen-housed and hen-day), egg weight, clutch size, bi-weekly body weight of layers,
egg and body weight ratio, carcass parameters and egg quality parameters. This applies
also to F2 birds and studies 4 and 5.
3.3.3.2.1 Weights of Birds and Eggs, and Body Weight Gain An electronic digital balance (Shenyang Longteng Electronic Co. Ltd., Taiwan) was
used in weighing chicks and eggs. Chicks were weighed individually. Ten eggs from
heterozygous naked neck layers and normal feathered ones in each sire group from each
village were weighed individually and averages taken. Pullets, cockerels and matured

52
birds were weighed with a top-loader scale. The body weight gain for each week was
calculated by subtracting the previous week’s weight from the current week’s weight.
The weight gain from day-old to sexual maturity was used to study the growth pattern
of each phenotype. The same methodology was appliede in F2 birds and also studies 4
and 5.
3.3.3.2.2 Body Length, Body Width and Shank Length
These were measured when the birds were 20 weeks of age. A measuring tape was used
for the measurements. The shank length (SL) was taken as the length of the tarso-
metatarsus from the hock joint to the metatarsal pad, and the body length (BL) was
between the tip of the Rostrum maxillare (beak) and that of the Cauda (tail, without
feathers). Body width (BW) was measured as the distance between the two shoulders.
Ten birds from each phenotype within each male line from each village, were measured
and the total value obtained was divided by ten to get the average value per bird. This is
applicable to F2 birds and studies 4 and 5.
3.3.3.2.3 Egg Production
The average age at first egg was measured as the ages at which pullets from each
phenotype laid their first eggs. The number of eggs per clutch was estimated by
counting the number of consecutive eggs laid by individual layers before a pause in
laying. All the eggs laid were recorded daily for six months period. Egg production was
calculated in terms of rate of lay i.e. percentage of the total number of eggs produced
divided by the total number of hens alive per day (hen-day), or divided by the total

53
number of hens housed (hen-housed). These methods were applied in F2 birds and
studies 4 and 5.
3.3.3.2.4 Egg and Body Weight Ratio This was determined as the ratio of egg weight to the body weight of the layer. Three
eggs each collected from three layers selected from each phenotype within each sire
group from each village were used in calculating the ratio. This was repeated in the F2
generation and also studies 4 and 5.
3.3.3.2.5 Mortality
Chick mortality and total mortality were estimated. Chick mortality was estimated as
the percentage of chicks that died from day-old till the end of the sixth week. Total
mortality was calculated as the percentage of birds that died between day-old and the
end of the experiment. It was repeated in the F2 and also studies 4 and 5.
3.3.3.2.6 Egg Quality Analysis The egg quality analysis was done twice. In each village, five eggs from each phenotype
within each sire family were selected at random and used for the analysis. This was
repeated in the F2 and in studies 4 and 5.
3.3.3.2.7 Carcass Analysis
The carass parameters were taken only on six-months old males. In each village, two
cocks from each phenotype (Nana and nana) within each sire family (N1-N4) were

54
selected at random and used for the carcass analysis. This was repeated in the F2 and in
studies 4 and 5.
3.3.3.4 Performance of Second Filial Generation (F2) Birds There were three phenotypic groups in the F2 generation, namely, homozygous naked
neck, heterozygous naked neck and the normal feathered birds.
3.3.4 Statistical Analysis
Genstat software (2007) was used to estimate the means and standard deviations of the
performance data on the first and second parental generations.
The data on F1 birds for the comparative studies (between Nana & nana) was analyzed
using the following linear models;
Egg Production Parameters:
Yijkl = µ + Bi + Vj + Gk +Ll + E ijkl
Where Yijkl = Observation for a given variable
µ = Overall general mean common to all observations
Bi = The environmental effect of ith hatch (I = 1, 2, 3, 4, 5)
Vj = Environmental effect due to ith village (j=1, 2, 3)
Gk = Genetic effect due to jth phenotype (k=1, 2)
Ll = Genetic effect due to kth sire (l= 1, 2, 3, 4)
Eijkl = random error effects peculiar to each observation.

55
Growth Parameters, Body Measurements, Egg Quality Parameters, Carcass Parameters
and Mortality:
Yijk = µ + Bi + Sj* + Gk + E ijk
Where Yijk = Observation for a given variable
µ = Overall general mean common to all observations
Bi = Environmental effect due to ith hatch (I = 1, 2, 3, 4, 5)
Sj = Genetic effect due jth sex (j = 1, 2)
Gk = Genetic effect due to jth genotype (k=1, 2)
Eijk = random error effects peculiar to each observation.
Sj* - Not applicable to egg quality and carcass parameters
The data on F2 birds for the comparative studies (between NaNa, Nana & nana) was
analyzed using the following linear models:
Egg Production Parameters:
Yijk = µ + Bi + Vj + Gk + E ijk
Where Yijk = Observation for a given variable
µ = Overall general mean common to all observations
Bi = Environmental effect due ith hatch (i = 1, 2, 3, 4, 5)
Vj = Environmental effect due to ith village (j=1, 2, 3)
Gk = Genetic effect due to jth genotype (k=1, 2, 3)
Eijk= random error effects peculiar to each observation.
Growth Parameters, Body Measurements, Egg Quality Parameters, Carcass Parameters
and Mortality:
Yijk = µ + Bi + Sj + Gk + E ijk

56
Where Yijk = Observation for a given variable
µ = Overall general mean common to all observations
Bi = Environmental effect due to ith hatch (I = 1, 2, 3, 4, 5)
Sj = Genetic effect due jth sex (j = 1, 2)
Gk = Genetic effect due to jth genotype (k=1, 2)
Eijk = random error effects peculiar to each observation.
Sj* - Not applicable to egg quality and carcass parameters
Analysis of variance (ANOVA) was performed using Genstat Software (2007).
3.4 STUDY FOUR: CROSSBREEDING BETWEEN INDIGENOUS FRIZZLE MALES (Ff) AND COMMERCIAL LAYERS (ff), AND COMPARING THE FIRST AND SECOND FILIAL GENERATION BIRDS IN SOME TRAITS OF ECONOMIC IMPORTANCE 3.4.1 Experimental Birds
Five (5) indigenous frizzle males and forty (40) Lohmann layers were used for the
initial mating. The layers were received from Akate Farms and Trading Company
Limited, Kumasi; and the indigenous frizzle males were bought from three different
villages/towns within the Asante-Akim South District of Ashanti, namely, Yawkwei,
Juaso and Nkwanta.
The indigenous frizzle males were feet-washed with disinfectant before they were
brought to the Department of Animal Science, K.N.U.S.T. to avoid spread of infection
in case there any. They were housed separately for two-weeks during which they were
dewormed and then vaccinated with Newcastle Disease Vaccine (Newcavac). All birds

57
were weighed individually. The indigenous frizzle males were then crossed with the
Lohman layers in a ratio of 1:8.
3.4.2 Second Parental Generation (P2)
These parents were selected heterozygous frizzle birds from the F1 generation. They
were reared and mated inter se.
3.4.3 Mating
This mating involved indigenous heterozygous frizzle and commercial layers, and also
F1 heterozygous frizzles in the first and second mating respectively. The offspring in
both F1 and F2 were made of full-sib and half-sib sire families but due to the difficult in
separating these, they were reared together as sire families.The two crosses are
described below:
Mating 1 Mating 2
Male Female Male Female
P1: (Indigenous) Ff × ff (Lohmann) P2: Ff × Ff (inter se)
(50.2%) Ff (49.8%) ff (F1) (22.4%) FF (51.5%) 2Ff (26.1%) ff (F2)

58
3.4.4 Transfer of Chicks and Rearing at the Villages In the F1 generation heterozygous frizzle and normal feathered birds were involved in
the first transfer to the villages. And in the second transfer, F2 homozygous frizzle,
heterozygous frizzle and normal feathered birds were involved.
3.4.5 Egg Quality Analysis
The egg quality analysis was done twice for F1 heterozygous frizzle and normal
feathered birds within each of the five sire families from each of the three villages. In
each village, five eggs from each phenotype within each sire group were selected at
random and used for the analysis.
3.4.6 Carcass Analysis
The carcass parameters were taken only on the males when they were six months old.
In each village, two cocks from each phenotype (Ff and ff) within each sire group (F1-
F5) were selected at random and used for the carcass analysis.
3.4.7 Second Filial Generation (F2) Birds In the F2 generation, data was taken on homozygous frizzle (FF), heterozygous frizzle
(Ff) and normal feathered (ff) birds in each village.
3.4.8 Statistical Analysis
Genstat software (2007) was used to estimate the means and standard deviations of the
performance data on the first and second generation parents.

59
The data on F1 birds for the comparative studies (between Nana & nana) was
analyzed using the following linear models;
Egg Production Parameters:
Yijkl = µ + Bi + Vj + Gk +Ll + E ijkl
Where Yijkl = Observation for a given variable
µ = Overall general mean common to all observations
Bi = The environmental effect of ith hatch (I = 1, 2, 3, 4, 5)
Vj = Environmental effect due to ith village (j=1, 2, 3)
Gk = Genetic effect due to jth phenotype (k=1, 2)
Ll = Genetic effect due to kth sire (l= 1, 2, 3, 4)
Eijkl = random error effects peculiar to each observation.
Growth Parameters, Body Measurements, Egg Quality Parameters, Carcass Parameters
and Mortality:
Yijk = µ + Bi + Sj* + Gk + E ijk
Where Yijk = Observation for a given variable
µ = Overall general mean common to all observations
Bi = Environmental effect due to ith hatch (I = 1, 2, 3, 4, 5)
Sj = Genetic effect due jth sex (j = 1, 2)
Gk = Genetic effect due to jth genotype (k=1, 2)
Eijk = random error effects peculiar to each observation.
Sj* - Not applicable to egg quality and carcass parameters

60
The data on F2 birds for the comparative studies (between NaNa, Nana & nana) was
analyzed using the following linear models:
Egg Production Parameters:
Yijk = µ + Bi + Vj + Gk + E ijk
Where Yijk = Observation for a given variable
µ = Overall general mean common to all observations
Bi = Environmental effect due ith hatch (i = 1, 2, 3, 4, 5)
Vj = Environmental effect due to ith village (j=1, 2, 3)
Gk = Genetic effect due to jth genotype (k=1, 2, 3)
Eijk= random error effects peculiar to each observation.
Growth Parameters, Body Measurements, Egg Quality Parameters, Carcass Parameters
and Mortality:
Yijk = µ + Bi + Sj + Gk + E ijk
Where Yijk = Observation for a given variable
µ = Overall general mean common to all observations
Bi = Environmental effect due to ith hatch (I = 1, 2, 3, 4, 5)
Sj = Genetic effect due jth sex (j = 1, 2)
Gk = Genetic effect due to jth genotype (k=1, 2)
Eijk = random error effects peculiar to each observation.
Sj* - Not applicable to egg quality and carcass parameters
Analysis of variance (ANOVA) was performed using Genstat Software (2007).

61
3.5 STUDY FIVE: COMPARING THE PRODUCTIVE AND REPRODUCTIVE PERFORMANCE AND PROFIT MARGIN OF REARING NAKED NECK (NaNa, Nana), FRIZZLE (FF, Ff) AND NORMAL FEATHERED (nanaff) BIRDS UNDER INTENSIVE, SEMI-INTENSIVE AND EXTENSIVE MANAGEMENT SYSTEMS
3.5.1 Location and Duration of Experiment
Nine keepers were selected in each of the three villages (Yawkwei, Juaso and
Nkwanta). These selected keepers were grouped into three with each group consisting
of three keepers. The first, second and third groups reared their birds under intensive,
semi-intensive and extensive systems respectively.
The experiment started in July, 2006 and ended in December, 2007.
3.5.2 Experimental Birds
The second filial generation birds from experiments three and four were used for this
experiment. The chicks were reared at the Animal Science Department, K.N.U.S.T for
six weeks and then transferred to the various villages to be reared under the various
management systems. There were nine keepers in each of the three villages. Three of
these keepers in each of the three villages reared their birds under one of the three
management systems (Extensive, Semi-intensive & Intensive). Each keeper was given
eighty (80) birds, 16 from each of the five genotypes (NaNa, Nana, FF, Ff & nana/ff).
There were eight males (8) and eight females (8) for each phenotype.

62
3.5.3 Rearing of Birds under the Various Management Systems 3.5.3.1 Intensive System
Almost all the keepers who rear their birds under this system used an uncompleted
building that is roofed to house the birds. The floors were cemented and covered with
wood shavings. Commercial poultry mash for growers (15% CP and 2650 kcal ME/kg)
and layers (17.5% CP and 2700 kcal ME/kg) from AGRICARE Ghana Limited were
used. Feed and water were provided ad libitum. Dewormers and vitamins were given
intermittently.
3.5.3.2 Semi-intensive System
The keepers who reared their birds under this system had a coop outside or inside the
house. Some of the houses were compound houses with gates and others were without
fence and gates. Feed was given to the birds three or four times daily either in the coop
or at the courtyard of the house. The feed was supplemented with green leaves such as
‘kontomire’. Fresh water was given ad libitum via a plastic bowl or earthen ware pot
either in the coop or at the courtyard of the fenced- house. The feed given was a local
mash prepared with available ingredients (see Table 3.1 for the composition of the
Local Mash). An antibiotic was given when the birds were sick. The birds were opened
once or twice a day to scavenge in and around the house with the supervision of the
keeper or any member of the family.
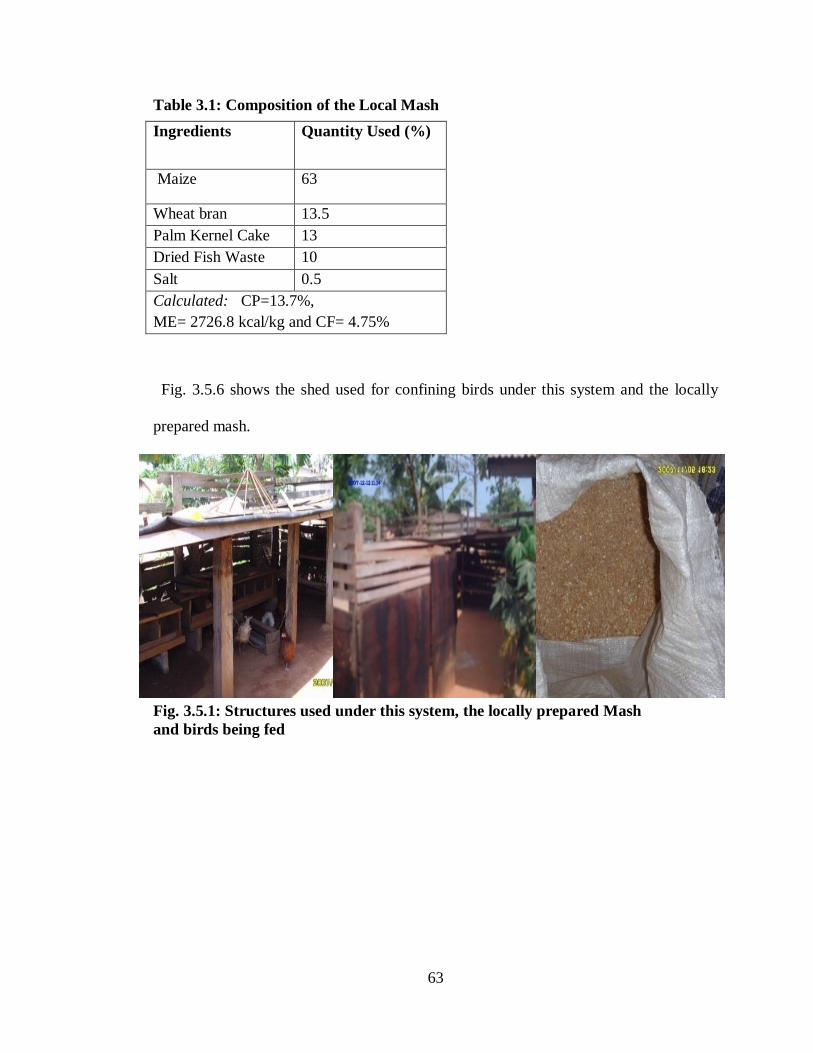
63
Table 3.1: Composition of the Local Mash
Fig. 3.5.6 shows the shed used for confining birds under this system and the locally
prepared mash.
Fig. 3.5.1: Structures used under this system, the locally prepared Mash and birds being fed
Ingredients Quantity Used (%)
Maize 63
Wheat bran 13.5 Palm Kernel Cake 13 Dried Fish Waste 10 Salt 0.5 Calculated: CP=13.7%, ME= 2726.8 kcal/kg and CF= 4.75%

64
3.5.3.3 Extensive System
Birds reared under this system scavenged for their own feed. A little feed (30g per bird
per day), which was either milled corn or milling waste or a mixture of milled corn and
dried fish waste, was given in the morning before the birds went out for scavenging.
Water was provided ad libitum in the courtyard. In the evening, the birds roosted either
in a coop outside the house or in the family kitchen. Anti-biotic was given in case of
sickness.
3.5.4 Data Collection
In addition to productive and reproductive data, the profit margin for rearing the birds
under each of the management systems was also determined.
3.5.4.1 Profit Margin
The profit margins for rearing the birds under each of the management systems were
calculated by computing the cost of rearing under each management system and
subtracting it from the total receipts of meat and eggs sales. The total cost involved the
cost of purchasing feed and drugs.
3.5.5 Statistical Analysis
All data were analyzed using the following linear model:
Yijkl = µ + Bi + Sj*+ Gk+ Ml + E ijkl
Where Yijkl = Observation for a given variable
µ = Overall general mean common to all observations

65
Bi = Environmental effect due to ith hatch (I = 1, 2, 3, 4, 5)
Sj = Genetic effect due jth sex (j = 1, 2)
Gk = Genetic effect due to ith genotype (k=1, 2, 3, 4, 5)
Ml = Environmental effect due to jth management system (l= 1, 2, 3,)
Eijkl = random error effects peculiar to each observation.
Sj* - Not applicable to egg quality and carcass parameters
ANOVA was performed using Genstat Software (2007).

66
CHAPTER FOUR
4.0 RESULTS 4.1 STUDY ONE
4.1.1 Number of Years in Local Chicken Production
On the averagely, the 135 local chicken keepers within Bosomtwe Atwima-Kwanwoma,
Ashanti-Akim South and Ejisu-Juaben districts in the Ashanti Region of Ghana have
been rearing local birds for 24 years (Table 4.1.1). However, 68% of the chicken
keepers interviewed said they were given local birds to own by their grandparents or
parents when they were in basic schools. They would sell their surplus eggs and cocks
and either use the money for schooling or save it for clothes during Christmas.
4.1.2 Management
4.1.2.1 Flock Sizes
The average flock size kept by the chicken keepers was 22.0, in the ratio of 4: 6: 12 for
cocks, hens, and chicks respectively. However, the flock sizes of individual keepers
among the respondents varied greatly (Table 4.1.1).
4.1.2.2 Management System
All the respondents were practicing the extensive system of management where the
birds scavenge throughout the day. A supplementary feed was given to the chicks or to
the whole flock either in the morning or in the evening and it was given everyday or
occasionally. The feed was normally provided in an improvised feeder, or in a small
coop, or on a piece of old roofing sheet or on the kitchen floor.

67
Table 4.1.1: Performance of Local Chickens in the Ashanti Region of Ghana
PARAMETERS AVERAGE
VALUE
RANGE STANDARD
ERROR
Years in chicken production 24.00 4 - 50 6.5720
Flock size 22.00 6 - 60 6.8804
Weight of Birds and Egg
Cock# (kg) 1.55 1.2 - 2.3 1.5212
Hen# (kg) 1.13 0.9 - 1.6 1.848
Chick (g) 35.0 30 - 38.5 2.8692
Egg (g) 42.8 38 - 49 2.9578
Layers and their performance
No. of layers 8.0 2 - 20 3.7937
Clutches/year 2.5 2 - 3
Eggs/Clutch 9 - 13
Eggs/bird/year 20 - 40
Hatchability (%) 77 65 - 100
Health of Birds
Chick Survivability (%) 50 30-90
General Mortality (%) 65 50-100
Economics of Production
Cost of Prod./yr (GH¢) 20* 2-350
Price of Cock# (GH¢) 2.5-5.0
Price of Hen# (GH¢) 1.5-4.0
Price of an Egg (GHp) 7.0-10.0
No. of Birds sold/year 8.05 2-20 5.4132
Profit/year (GH¢) 8.0-30.0 # These are matured ones (>5months of age). * Most of the villagers used maize from their own farms as supplementary feed, so, the quantity and cost was estimated by using market price

68
In the evening, the birds were either kept in a part of the kitchen or in a coop or they
roosted on trees. The coops were wooden or bamboo structures.
4.1.2.3 Types of Feed Supplements
Among the 135 respondents, 90 (66.67%) provided feed supplement while 45 (33.33%)
did not. Among those who provided supplement 54 (60%) offered whole maize as feed
supplement, 22 (24.44%) gave maize bran and 14 (15.56%) supplied milled maize and
waste of dried herrings.
4.1.2.4 Health of Birds
4.1.2.4.1 Survivability of Chicks and Total Mortality
Among the indigenous local fowls, 50% of the chicks hatched died before they reached
cockerel or pullet stage and annually 65% of the entire flock die before the keeper could
reap any benefits in terms of meat or eggs.
4.1.2.4.2 Disease Control
Keepers of local chickens in the Ashanti Region of Ghana have various methods of
preventing or controlling diseases. These methods can be ranked in a descending order
of preference as shown in the Table 4.1.2.

69
Table 4.1.2: Rankings of Various Methods Used for Preventing/Controlling Diseases Method Number % Rank
Using tetracycline and B- complex 122 90.37 1 Use of Ethno-veterinary medication such as ‘prekese’, pawpaw leaves, and back and leaves of mango tree
94 69.63 2
Slaughter the sick one if matured (culling) 68 50.37 3 Doing nothing about it 43 31.85 4
Using veterinary drugs prescribed by the district’s veterinary officer
3 2.22 5
The local chicken keeper will make use of one of these alternatives in an attempt to
prevent/control diseases. Ninety percent (90%) of those interviewed had given
tetracycline or B- complex to their sick birds before. Another alternative was ethno-
veterinary medicines; some put either ‘prekese’ or the bark of mango trees in water for
the birds, and others will rub mango or pawpaw leaves between their palms in water and
give this to them in drinking water. On some occasions, people choose to slaughter their
matured sick birds, or just leave the bird without treatment to either die or survive by
itself. Two percent (2%) of the respondents said they contacted the veterinary officer for
treatment of their sick birds.
4.1.3 Performance
4.1.3.1 Weight of Birds and Eggs
The average weights of local cocks, hens, chicks and eggs were 1.55 kg, 1.13 kg, 35 g
and 42.8 g respectively. The average weights of birds and eggs are shown in Fig. 4.1.2.

70
1550
35 42.8
1130
0
200
400
600
800
1000
1200
1400
1600
1800
Cock Weight Hen Weight Chick Weight Egg Weight
Birds and Egg
Wei
ght i
n G
ram
s
Fig. 4.1.1: A Bar Chart Showing the Body and Egg Weights of Local Birds
4.1.3.2 Number of Layers and their Performance
The number of laying hens kept per chicken keeper in the three districts averaged eight
(8) with a range of 2 to 20 (Table 4.1.1). The number of clutches per year ranged from
two to three. The number of eggs per hen per clutch ranged from 9 to 13, and the
number of eggs per hen per year was between 20 and 40. Percentage of eggs hatched
averaged 77%.
4.1.3.3 Economics of Production The price of a cock ranged between two Ghana cedis and fifty pesewas, and five Ghana
cedis (GH¢2.50 - GH¢5.00); while that of a hen ranged between one and half, and four
Ghana cedis (GH¢1.50 - GH¢4.00). An egg was sold between seven and ten Ghana
pesewas (GHp7.00 - GHp10.00). Anually, each chicken keeper spends between two and
thirty five Ghana cedis (GH¢2.00 - GH¢35.00) on production and sells an average of

71
eight birds. Profit received per year ranged between eight and thirty Ghana cedis
(GH¢8.00-GH¢30.00).
4.1.4 Reasons for Keeping Local Birds
The various reasons why local birds were kept by keepers can be ranked in a
descending order of preference from 1 to 6 as shown in Table 4.1.3:
Table 4.1.3 Ranking of Reasons for Keeping Local Birds
Reason Number Percentage, % Rank
Home Consumption 135 100.00 1
Sell for money 118 87.41 2
Honour Guest 98 72.59 3
Use for rituals 65 48.15 4
Aesthetic value 16 11.85 5
Announce the presence of dangerous animals such as
snakes
2 1.48 6
4.1.6 Challenges in Local Chicken Production and Suggested Solutions
4.1.6.1 Challenges
Local chicken production in Ghana is faced with various challenges and these have
been ranked from 1 to 4 in descending order of intensity and seriousness, in Table 4.1.4.

72
Table 4.1.4: Rankings of Various Challenges Facing Local Chicken Production in Ghana Problem Number % Rank
Diseases, Predators and Theft 130 96.30 1
Lack of Funds for increasing stock and putting up
structures
122 90.37 2
Small sizes of birds and eggs, and smaller numbers of eggs
laid
87 64.44 3
Low fertility of eggs 11 8.15 4
Diseases such as Newcastle disease, coccidiosis and fowl pox; predators such as hawks,
crows, snakes, foxes and dogs, and theft were pertinent problems for all the
respondents. Other problems mentioned were lack of funds to purchase new stock, feed
supplement, and to build bigger coops; small sizes of birds and eggs and low numbers
of eggs laid per bird per year were also mentioned. Eight percent (8%) had problems
with fertility of eggs, however, 3% of the respondents did not have any problems at all.
4.1.6.2 Solutions
The suggested solutions by the respondents to the problems outlined have been ranked
below (Table 4.1.5) in descending order of urgency from 1 to 5:
Table 4.1.5: Ranking of Suggested Solutions to the Challenges Faced by Local Chicken Keepers Solutions Number % Rank
Confining birds to protect them from predators 132 97.78 1
Produce disease resistant breeds 128 94.81 2
Provision of funds to increase production 115 85.19 3
Develop breeds with improved meat and eggs production 98 72.59 4
Availability of a low-cost local concentrate 62 45.93 5

73
4.2 STUDY TWO 4.2.1 Percentage of Naked Neck (Nana), Frizzle (Ff) and Normal Feathered (nana/ff) Birds within the Population of Indigenous Birds in the Asante Akim South, Ejisu Juabeng and Bosomtwe Atwima KwanwomaDistricts The normal feathered birds formed a significantly higher (P<0.05) percentage of the
population of indigenous chickens in the Bosomtwe Atwima-Kwanwoma, Asante-Akim
South and Ejisu-Juaben Districts (Table 4.2.1). However, the percentages of the naked
neck (Nana) and the frizzle (Ff) birds did not vary significantly (P>0.05) from each
other. Only heterozygous forms of the two genes (Nana & Ff) were encountered. The
total incidence of both naked neck (Nana) and frizzle (Ff) birds within the population
of indigenous chickens in the areas surveyed was only 21.6% (Table 4.2.1and Appendix
2).
Table 4.2.1: Percentages of Naked Neck (Nana), Frizzle (Ff) and Normal Feathered (nana/ff) Birds and their Body Weights Parameters/Phenotypes Naked neck
(Nana) Frizzle (Ff) Normal
(nana/ff) LSD SEM
% Phenotype In Flock 13.3a 8.3a 78.4b 1.617 0.7700 Average Weight of Cock (Kg)
1.590 1.520 1.537 0.0739 0.0352
Average Weight of Hen (Kg)
1.300a 1.033b 1.180ab 0.124 0.0589
Average Weight of Chick (g)
33.85a 35.90b 35.12b 0.0353 0.01678
a,b Means different superscripts are significantly different at 5% level of significance; LSD=Least Significant Difference; SEM=Standard Error of the Mean 4.2.2 Average Weights of Cocks, Hens and Chicks The average weight of cocks did not differ significantly (P>0.05) between the naked
neck (Nana), frizzle (Ff) and normal feathered (nana/ff) birds (Table 4.2.1 and
Appendix 2). The differences in the average weights of hens was significant (P<0.05)
with the naked neck (Nana) hens being heavier than the frizzles (Ff). There was no
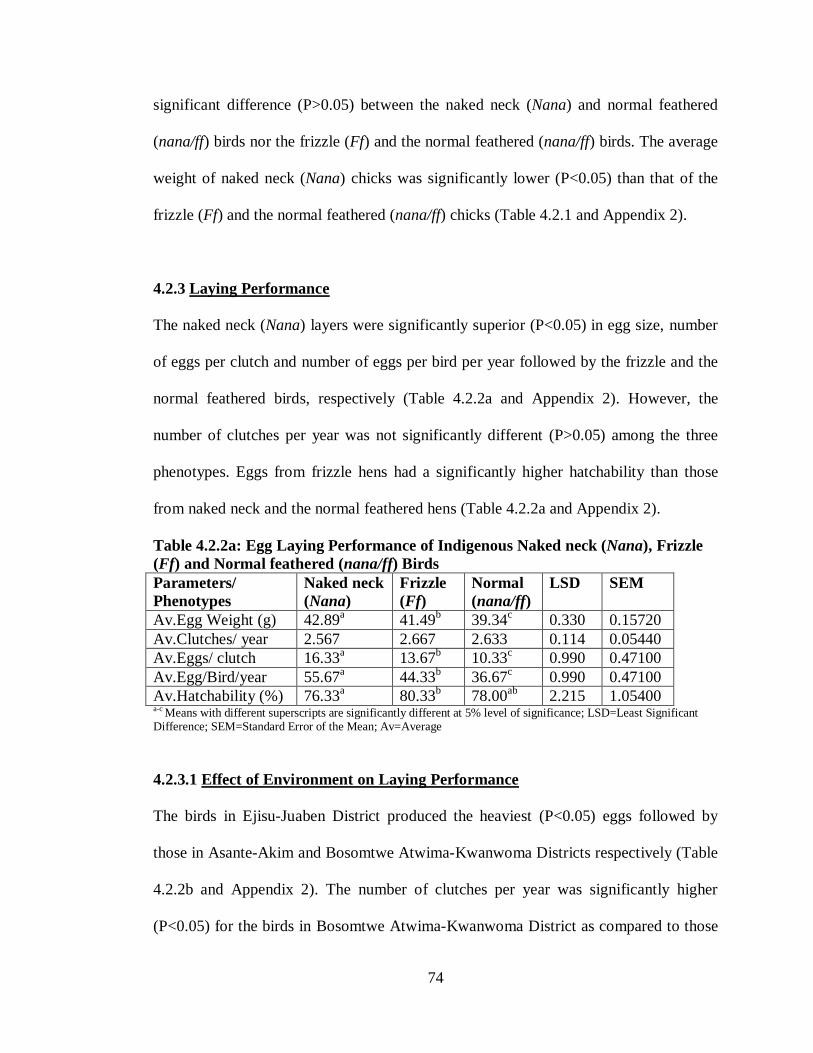
74
significant difference (P>0.05) between the naked neck (Nana) and normal feathered
(nana/ff) birds nor the frizzle (Ff) and the normal feathered (nana/ff) birds. The average
weight of naked neck (Nana) chicks was significantly lower (P<0.05) than that of the
frizzle (Ff) and the normal feathered (nana/ff) chicks (Table 4.2.1 and Appendix 2).
4.2.3 Laying Performance The naked neck (Nana) layers were significantly superior (P<0.05) in egg size, number
of eggs per clutch and number of eggs per bird per year followed by the frizzle and the
normal feathered birds, respectively (Table 4.2.2a and Appendix 2). However, the
number of clutches per year was not significantly different (P>0.05) among the three
phenotypes. Eggs from frizzle hens had a significantly higher hatchability than those
from naked neck and the normal feathered hens (Table 4.2.2a and Appendix 2).
Table 4.2.2a: Egg Laying Performance of Indigenous Naked neck (Nana), Frizzle (Ff) and Normal feathered (nana/ff) Birds Parameters/ Phenotypes
Naked neck (Nana)
Frizzle (Ff)
Normal (nana/ff)
LSD SEM
Av.Egg Weight (g) 42.89a 41.49b 39.34c 0.330 0.15720 Av.Clutches/ year 2.567 2.667 2.633 0.114 0.05440 Av.Eggs/ clutch 16.33a 13.67b 10.33c 0.990 0.47100 Av.Egg/Bird/year 55.67a 44.33b 36.67c 0.990 0.47100 Av.Hatchability (%) 76.33a 80.33b 78.00ab 2.215 1.05400 a-c Means with different superscripts are significantly different at 5% level of significance; LSD=Least Significant Difference; SEM=Standard Error of the Mean; Av=Average
4.2.3.1 Effect of Environment on Laying Performance
The birds in Ejisu-Juaben District produced the heaviest (P<0.05) eggs followed by
those in Asante-Akim and Bosomtwe Atwima-Kwanwoma Districts respectively (Table
4.2.2b and Appendix 2). The number of clutches per year was significantly higher
(P<0.05) for the birds in Bosomtwe Atwima-Kwanwoma District as compared to those

75
in the Ejisu-Juabeng District but the difference between the number of clutches per year
of birds in Bosomtwe Atwima-Kwanwoma and Asante-Akim South districts was not
significant (P>0.05) neither was there any difference (P>0.05) between those from
Ejisu-Juabeng and Asante-Akim South Districts. The number of eggs per clutch and the
number of eggs per bird per year did not differ significantly (P>0.05) among birds from
the three Districts. Hatchability was significantly lower (P<0.05) for eggs laid by layers
from Asante-Akim South district as compared to eggs laid by those from Bosomtwe
Atwima-Kwanwoma and Ejisu-Juabeng Districts (Table 4.2.2b and Appendix 2).
Table 4.2.2b: The Effect of Environment on Egg Laying Performance of Indigenous Naked neck, Frizzle and Normal Feathered Birds. Parameters/Districts Asante-Akim
South Bosomtwe Atwima-Kwanwoma
Ejisu-Juabeng
LSD SEM
Av.Egg Weight (g) 41.07b 40.27c 42.38a 0.330 0.1572 Av.Clutches/ year 2.600ab 2.733a 2.533b 0.114 0.0544 Av.Eggs/ clutch 13.00 13.67 13.67 0.990 0.4710 Av.Egg/Bird/year 45.33 45.00 46.33 0.990 0.4710 Av.Hatchability (%) 76.67a 81.00b 77.00a 2.215 1.0540 a- c Means different superscripts are significantly different at 5% level of significance; LSD=Least Significant Difference; SEM=Standard Error of the Mean; Av=Average 4.2.4 Egg Quality
The eggs laid by naked neck birds were significantly superior (P<0.05) in albumen
height, Haugh Unit and egg shell thickness as compared to those of the frizzle and
normal feathered birds; eggs of the frizzle birds were also significantly superior
(P<0.05) to the normal feathered ones in Haugh unit (Table 4.2.3 and Appendix 2).
Yolk height and yolk diameter were significantly lower (P<0.05) in eggs of normal
feathered birds as compared to that of naked neck and frizzle birds. Yolk colour score
was not significantly different (P>0.05) among eggs laid by birds from the three
phenotypes (Table 4.2.3 and Appendix 2).

76
Table 4.2.3: Egg Quality and Survivability Performances of Indigenous Naked neck (Nana), Frizzle (Ff) and Normal feathered (nana/ff) Birds Parameters/Phenotypes Naked neck
(Nana) Frizzle (Ff)
Normal (nana/ff)
LSD SEM
Av.Albumin Height (mm) 6.150a 5.840b 5.813b 0.0099 0.00471 Av.Haugh Unit (%) 81.33a 78.00b 73.33c 0.990 0.47100 Av.Shell Thickness (mm) 0.3200a 0.3000b 0.3033b 0.0114 0.00544 Av.Yolk height (mm) 16.10a 16.09a 15.40b 0.222 0.10580 Av.Yolk Diameter (mm) 41.00a 39.33a 36.00b 1.144 0.54400 Av.Yolk Colour Score 8.33 7.67 8.33 1.095 0.52100 Av.Chick Mortality (%) 53.67a 50.00b 52.33a 1.144 0.54400 Av.Total Mortality (%) 40.00a 49.33b 52.67c 0.990 0.47100 a – c Means different superscripts are significantly different at 5% level of significance; LSD=Least Significant Difference; SEM=Standard Error of the Mean; Av=Average 4.2.5 Mortality and Carcass Parameters
Frizzle (Ff) chicks (day-old to 6 weeks) had significantly lower (P<0.05) mortality as
compared to naked neck (Nana) and normal feathered (nana/ff) chicks (Table 4.2.3 and
Appendix 2). However, total mortality was significantly lower (P<0.05) in naked neck
birds followed by the frizzles which survived significantly (P<0.05) better than the
normal feathered birds (Table 4.2.3 and Appendix 2).
The carcasses of naked neck (Nana) birds were significantly (P<0.05) superior in
percentage of defeathered weight, dressing percentage and percentage of breast muscle
weight to those of frizzles (Ff) which were significantly (P<0.05) better than those of
normal feathered (nana/ff) birds; however, the differences were not significant (P>0.05)
for breast muscle percentage between the frizzle (Ff) and the normal feathered (nana/ff)
birds (Table 4.2.4 and Appendix 2). Thigh and drumstick percentage and wings
percentage were not significantly different (P>0.05) betweeen the three phenotypes
(Nana, Ff and nana/ff).

77
Table 4.2.4: Carcass Parameters of Indigenous Nana (Naked neck), Ff (Frizzle) and nana/ff (Normal feathered) Birds Parameters/Genotypes Nana Ff nana/ff LSD SEM Live Weight 1.48a 1.36b 1.37b 0.0798 0.0380
Av.Defeathered % (Weight in kg)
93.22a
(1.38) 90.72b
(1.24) 88.09c
(1.21) 0.0140 0.00667
Av.Dressing % (Weight in kg)
70.87a
(1.05) 67.80b
(0.92) 66.68c
(0.91) 0.0128 0.00609
Av.Breast Muscle % (Weight in kg)
16.37a
(0.24) 13.20b
(0.18) 12.86b
(0.18) 0.0128 0.00609
Av.Thigh and Drumstick % (Weight in kg)
23.40 (0.35)
23.41 (0.32)
23.35 (0.32)
0.0128 0.00609
Av.Wings % (Weight in kg)
9.93 (0.15)
9.76 (0.13)
9.98 (0.14)
0.738 0.351
Av.Gizzard % (Weight in kg)
3.207b
(0.047) 3.523a
(0.048) 3.057b
(0.042) 0.0475 0.002261
Av.Intestines % (Weight in kg)
3.190 (0.047)
3.403 (0.046)
3.303 (0.042)
0.0475 0.002261
Av.Heart % (Weight in kg)
1.570b
(0.023) 1.690a
(0.023) 1.557b
(0.021) 0.0099 0.00471
Av.Liver % (Weight in kg)
1.591b
(0.024) 1.693a
(0.023) 1.557b
(0.021) 0.0106 0.00505
a – c Means with different superscripts are significantly different at 5% level of significance; LSD=Least Significant Difference; SEM=Standard Error of the Mean; Av=Average
The Ff (frizzle) birds were significantly higher in the percentages of gizzard, intestine,
heart and liver compared to the Nana (Naked neck) and the nana/ff (Normal feathered)
ones (Table 4.2.4 and Appendix 2).

78
4.3.0 STUDY THREE: MATINGS INVOLVING NAKED NECK BIRDS
4.3.2 First Parental Generation (P1)
Body weight of the indigenous heterozygous naked neck (Nana) males ranged from
1,300 to 1,700g with sire N2 being the heaviest and sire N1 the lightest. Fertility of eggs
from mating involving the four sires ranged between 86.45% (sire N3) and 98.00% (sire
N2) while hatchability ranged from 52.80% (sire N4) to 80.65% (sire N2), (Table
4.3.1a).
Table 4.3.1a: Some Characteristics of the Four Indigenous Nana (Naked neck) Males used in the First Mating Sire Number
Sire Colour
Age (Months)
Av.Weight ±SE (g)
Av.Fertility ±SE (%)
Av.Hatchability ±SE (%)
N1 Red 14 1300 ± 1.49 96.55 ± 1.54 63.90 ± 2.33
N2 Multi 9 1700 ± 1.87 98.00 ± 1.78 80.65 ± 1.92
N3 Barred 12 1500 ± 1.62 86.45 ± 2.46 66.15 ± 2.08
N4 Black 12 1600 ± 1.95 95.00 ± 2.11 52.80 ± 2.53 SD = Standard Error; Av=Average
The Lohmann commercial females used in the first mating were a year old. The average
body weight, average egg size, average egg size to body weight ratio, average fertility
and average hatchability of the eggs from the Lohmann commercial females used in the
first mating are presented in Table 4.3.1b.

79
Table 4.3.1b: Characteristics of the Commercial Lohmann Females used in the First Mating Trait Performance Standard Error Colour Brown -
Age (wks) 52.00 -
Average Weight (g) 1600.00 2.06
Average Egg Size (g) 62.00 1.68
Average Egg Size to Body Wt Ratio 1 : 25.81 2.22
Rate of Lay – Hen day (%) 66.67 2.91
Average Fertility of eggs (%) 94.00 2.14
Average Hatchabiltity of eggs (%) 65.88 2.26
Egg quality characteristics such as albumen height, Haugh unit, shell thickness, yolk
height, and yolk diameter and yolk colour score of the eggs from the Lohmann
commercial females used in the first mating are presented in Table 4.3.1c
Table 4.3.1c: Egg Quality Characteristics of the Commercial Lohmann Females used in the First Mating Trait Performance Standard Error Av.Albumen Height (mm) 7.11 3.02
Av.Haugh Unit (%) 77.00 2.41
Av.Shell Thickness (mm) 0.32 1.75
Av.Yolk Height (mm) 15.00 1.96
Av.Yolk Diameter (mm) 40.00 2.06
Av.Yolk Colour Score 5.00 1.93 Av=Average
4.3.2 First Filial Generation (F1) Naked Necks (Nana) and Normals (nana) 4.3.2.1 Plumage Colour
The F1 birds (Naked necks and Normals) had varying plumage colours; some were
multi-coloured while others had single colours (Fig. 4.3.2.1).

80
Fig. 4.3.1: F1 Heterozygous Naked neck (Nana) and Normal Feathered (nana) Birds The colours included white, black, barred, red, and brown; however, majority of the
females were brown in colour.

81
4.3.2.2 Body Weight and Body Weight Gain (Day-old to 20th Week) Body weight and body weight gain from day-old to the sixth week were significantly
(P<0.05) higher in the naked neck (Nana) chicks as compared to their normal feathered
(nana) counterparts (Table 4.3.2.2a, Fig. 4.3.2.2a and Appendix 2).
Table 4.3.2.2a: Body Weight and Body Weight Gain of F1 Nana (Naked neck) and nana (Normal feathered) Chicks (Day-old to week 6) P’TERS/G’TYPE Nana nana LSD SEM Av. Body Wt at Day-old 43.15b 41.64a 0.3061 0.1444 Av. Body Wt at WK1 60.61b 58.41a 0.0442 0.0209 Av. Body Wt Gain b/n WK0&1 17.47a 16.77b 0.03209 0.01514 Av. Body Wt at WK2 117.02a 111.90b 0.0439 0.0207 Av. Body Wt Gain b/n WK1&2 56.41a 53.49b 0.02935 0.01384 Av. Body Wt at WK3 177.49b 170.69a 0.03165 0.01493 Av. Body Wt Gain b/n WK2&3 60.46b 58.79a 0.3065 0.1446 Av. Body Wt at WK4 249.35a 220.18b 0.00865 0.00408 Av.Body Wt Gain b/n WK3&4 71.86a 49.49b 0.0439 0.0207 Av. Body Wt at WK5 345.57a 312.98b 0.00865 0.00408 Av. Body Wt Gain b/n WK4&5 96.23b 92.82a 0.03296 0.01555 Av. Body Wt at WK6 449.04b 409.67a 0.00865 0.00408 Av.Body Wt Gain b/n WK5&6 103.47b 96.67a 0.01467 0.00692 a, b Means with different superscripts are significantly different at 5% level of significance; P’TERS=PARAMETERS; G’TYPES= GENOTYPES; LSD=Least Significant Difference; and SEM= Standard Error of the Mean; Av=Average; Wt=Weight; WK=Week; b/n = between
Figure 4.3.2a: A Bar Chart Showing Six-week Body Weight of Heterozygous Naked neck and Normal feathered Birds
380390400410420430440450
Nana nana
Body Weight at 6wks (grams)
F1 Nana & nana Birds

82
From weeks 7 to 20, body weight and body weight-gain of F1 Nana birds were
significantly higher than that of F1 nana ones (Tables 4.3.2.2b & c, Figs. 4.3.2.2b & c
and Appendix 2).
Table 4.3.2.2b: Body Weight and Body Weight Gain (Week 7 to Week 13) of F1 Nana (Naked neck) and nana (Normal feathered) Birds P’TERS/P’TYPE Naked neck(Nana) Normal feathered
(nana) LSD SEM
Av.Wt at Wk7 457.40b 421.70a 4.680 2.3800 Av.Wt at Wk8 519.50b 473.60a 5.570 2.8400 Av.Wt Gain b/n Wk7&8 63.82b 52.15a 1.302 0.6630 Av.Wt at Wk9 601.00a 537.20b 5.840 2.9400 Av.Wt Gain b/n Wk8&9 79.89a 64.03b 1.840 0.9370 Av.Wt at Wk10 693.80a 609.90b 7.210 3.6700 Av.Wt Gain b/n Wk9&10 91.83b 73.44a 2.264 1.1530 Av.Wt at Wk11 793.50b 686.30a 9.060 4.6100 Av.Wt Gain b/n Wk10&11 99.83b 76.22a 2.413 1.2290 Av.Wt at Wk12 900.20b 765.60a 11.490 5.8500 Av.Wt Gain b/n Wk11&12 106.96b 82.62a 2.627 1.3380 Av.Wt at Wk13 1013.30b 853.80a 14.070 7.1600 Av.Wt Gain b/n Wk12&13 117.50b 91.18a 2.894 1.4740 a, b Means with different superscripts are significantly different at 5% level of significance; P’TERS=PARAMETERS; P’TYPE=PHENOTYPE; LSD=Least Significant Difference; and SEM= Standard Error of the Mean; Av=Average; b/n=between Table 4.3.2.2c: Body Weight and Body Weight Gain (Week 14 to week 20) of F1 Nana and nana Birds P’TERS/G’TYPE Nana nana LSD SEM Av.Wt at Wk14 1134.50a 949.70b 16.800 8.5600 Av.Wt Gain b/n Wk13&14 121.05a 95.16b 2.896 1.4750 Av.Wt at Wk15 1260.50a 1051.20b 19.220 9.7900 Av.Wt Gain b/n Wk14&15 128.03a 100.38b 3.092 1.575 Av.Wt at Wk16 1394.70a 1154.10b 22.230 11.3200 Av.Wt Gain b/n Wk15&16 134.24a 102.92b 3.350 1.7060 Av.Wt at Wk17 1525.50b 1246.10a 25.000 12.7300 Av.Wt Gain b/n Wk16&17 130.35b 97.69a 3.391 1.7270 Av.Wt at Wk18 1652.00a 1342.30 27.730 141200 Av.Wt Gain b/n Wk17&18 127.00a 94.71 3.452 1.7580 Av.Wt at Wk19 1768.70b 1436.80a 35.550 18.1100 Av.Wt Gain b/n Wk18&19 120.89b 93.85a 3.553 1.8100 Av.Wt at Wk20 1895.80a 1565.40b 31.550 16.0700 Av.Wt Gain b/n Wk19&20 117.76a 94.63b 3.176 1.6170 a, b Means with different superscripts are significantly different at 5% level of significance; P’TERS=PARAMETERS; G’TYPE=GENOTYPE; LSD=Least Significant Difference; and SEM= Standard Error of the Mean; Av=Average; b/n = between

83
4.3.2.3 Body Measurements Body length and body width values were significantly higher (P<0.05) in the naked
neck birds compared to the normal feathered birds. However, shank length did not show
0
500
1000
1500
2000
N1 N2 N3 N4
Body Weight at 20wks (grams)
SireFig. 4.3.2c: Comparison of the 20wk Body Weights of Nana & nana
Offspring of Four Naked neck Sires
Heterozygous Naked neck
Normal feathered
0
200
400
600
800
1000
1200
1400
1600
1800
2000
0 1 2 3 4 5 6 7 8 9 10 11 12 13 14 15 16 17 18 19 20
Bod
y W
eigh
t (gr
ams)
Age (weeks)
Fig.4.3.2b: Comparative Growth Curves of F1 Nana and nana Birds
Nana
nana

84
any significant difference (P>0.05) between the two phenotypes (Table 4.3.2.3 and
Appendix 2).
Table 4.3.2.3: Body Measurements of F1 Nana & nana Birds Parameters/Genotype Nana nana LSD SEM Av.Body Length (cm) 36.04a 34.83b 0.226 0.1153 Av.Body Width (cm) 13.93a 13.42b 0.153 0.07790 Av.Shank Length (cm) 8.38 8.34 0.110 0.05600 a, b Means different superscripts are significantly different at 5% level of significance; LSD=Least Significant Difference; and SEM= Standard Error of the Mean; Av=Average
4.3.2.4 Laying Performance Number of eggs per clutch, egg size, hen-housed and hen-day egg production rates were
significantly (P<0.05) better in the Nana layers compared to the nana ones (Table
4.3.2.5a). However, age at first egg and egg size to body weight ratio were significantly
(P<0.05) superior in nana layers than Nana ones (Table 4.3.2.4a and Appendix 2).
Table 4.3.2.4a: The Effect of the Naked Neck Gene on Laying Performance
a, b Means different superscripts are significantly different at 5% level of significance; LSD=Least Significant Difference; and SEM= Standard Error of the Mean; Av=Average 4.3.2.4.1 The Effect of Environment (Village) on Laying Performance
Eggs per clutch and egg size values were significantly higher (P<0.05) in birds from
Juaso followed by those from Nkwanta and Yawkwei respectively (Table 4.3.2.5b).
Hen-housed and hen-day egg production rates were significantly higher (P<0.05) in
birds that were kept at Yawkwei than in those kept at Nkwanta which were significantly
(P<0.05) better than those reared at Juaso, however, the difference between the hen-
Parameters/ F1 Birds Nana nana LSD SEM Av.Age at first Egg 149.72a 146.61b 0.654 0.3330 Av.Eggs per Clutch 17.66a 15.89b 0.297 0.1510 Av.Egg Size (g) 50.20a 47.11b 0.569 0.2890 Av.Egg Size-Body Wt Ratio 32.30a 30.03b 0.663 0.3370 Rate of Lay (Hen-housed) 59.67b 56.51a 0.483 0.2450 Rate of Lay (Hen-day) 61.27b 58.09a 0.461 0.2350

85
housed rate of lay of birds reared at Nkwanta and Juaso was not significant (P>0.05).
Age at first egg and egg size to body weight ratio did not differ significantly (P>0.05)
between birds kept in the three towns/villages (Table 4.3.2.4b and Appendix 2).
Table 4.3.2.4b: The Effect of Environmental (Village) on Laying Performance Parameters/Village Yawkwei Juaso Nkwanta LSD SEM Av. Age at first Egg 147.98 148.34 148.17 0.801 0.4070 Av. Eggs per Clutch 16.43a 17.01b 16.89c 0.364 0.1849 Av. Egg Size (g) 46.92a 49.90b 49.13c 0.697 0.3540 Av. Egg Size-Body Wt Ratio 31.43 30.92 31.14 0.812 0.4130 Rate of Lay (Hen-housed) 58.96a 57.48b 57.83b 0.591 0.3010 Rate of Lay (Hen-day) 60.68a 58.98b 59.37c 0.565 0.2870 a - c Means different superscripts are significantly different at 5% level of significance; LSD=Least Significant Difference; and SEM= Standard Error of the Mean; Av=Average
4.3.2.4.2 Sire Effects on Laying Performance
Age at first egg delayed significantly (P<0.05) in offspring of sires N1 and N3
compared to offspring of sire N4 but the differences between the values recorded for
offspring of sires N1 and N2, N2 and N3, and N2 and N4 were not significant (P>0.05),
(Table 4.3.2.4c). Number of eggs per clutch was significantly higher in offspring of sire
N2 followed by that of N4, N1 and N3 respectively. Significantly (P<0.05) higher egg
size values were recorded for offspring of sire N4 followed by that of sires N2 and N3,
and those from the offspring of sire N1 were the lightest. Offspring of sires N3 and N4
had a significantly (P<0.05) better egg size to body weight ratio than those of sires N1
and N2. Hen-housed egg production and hen-day egg production rates were
significantly higher in the offspring of sire N4 than those of N2 which was better than
those of N1 and N3, however the difference between the hen-day egg production rates
of the offspring of sires N1 and N3 was not significant (P>0.05) (Table 4.3.2.4c and
Appendix 2).

86
Table 4.3.2.4c: The Effect of Sire on Laying Performance Parameters/ Sires N1 N2 N3 N4 LSD SEM Av.Age at first Egg 148.54a 148.02ab 148.76a 147.33b 0.925 0.4700 Av.Eggs per Clutch 16.53a 17.48b 16.11c 16.98d 0.420 0.2135 Av.Egg Size (g) 47.12a 48.90b 48.53b 50.06c 0.804 0.4090 Av.Egg Size-Body Wt Ratio
31.55a 31.81a 30.57b 30.73b 0.937 0.4760
Rate of Lay (Hen-housed)
57.73a 58.62b 56.96c 59.06d 0.683 0.3470
Rate of Lay (Hen-day) 59.09a 60.01b 58.58a 61.03c 0.652 0.3320 a – c Means different superscripts are significantly different at 5% level of significance; LSD=Least Significant Difference; and SEM= Standard Error of the Mean; Av=Average 4.3.2.5 Egg Quality Parameters Values for albumen height, Haugh unit, shell thickness, yolk height and yolk diameter
were significantly higher (P<0.05) in the eggs from naked neck layers compared to
those from their normal feathered counterparts; however, yolk colour score did not
show any significant (P>0.05) differences (Table 4.3.2.5 and Appendix 2).
Table 4.3.2.5: The Effect of Naked Neck (Nana) Gene on Egg Quality Parameters Parameters/ Genotype Nana nana LSD SEM Av.Albumen Height (mm) 6.69a 6.35b 0.108 0.0551 Av.Haugh Unit (%) 81.62a 78.69b 0.719 0.3660 Av.Shell Thickness (mm) 0.33a 0.31b 0.00581 0.002950 Av.Yolk Height (mm) 15.04a 14.77b 0.154 0.07820 Av.Yolk Diameter (mm) 39.89a 39.25b 0.320 0.1628 Yolk Colour Score 8.41 8.26 0.269 0.1366 a, b Means different superscripts are significantly different at 5% level of significance; P;TERS=PARAMETERS; LSD=Least Significant Difference; and SEM= Standard Error of the Mean; Av=Average
4.3.2.6 Some Carcass Parameters The heterozygous naked neck (Nana) birds had a significantly higher (P<0.05)
defeathered weight, dressed weight, thigh and drumstick weight, breast muscle weight,
weight of wings and gizzards than the normal feathered birds (Table 4.3.2.6 and

87
Appendix 2). However, weights of intestines, heart and liver were not significantly
affected by the phenotypes of the birds (Table 4.3.2.6 and Appendix 2)
Table 4.3.2.6: The Effect of the Naked Neck Gene on Some Carcass Parameters Parameters/Genotype Nana nana LSD SEM Av. Defeathered % 91.40a 86.01b 0.706 0.03590 Av. Dressed Weight % 74.70a 66.88b 0.917 0.04660 Av. Thigh and Drumstick % 23.24a 23.11b 0.117 0.0596 Av. Breast Muscle % 19.01a 16.08b 0.628 0.3190 Av. Weight of Wings % 10.36a 10.22b 0.108 0.05490 Av. Gizzard % 3.77a 3.66b 0.0731 0.03720 Av. Weight of Intestines % 3.71 3.69 0.0369 0.01875 Av. Heart Weight % 1.47 1.48 0.0257 0.01306 Av. Liver Weight % 1.84 1.83 0.0360 0.01832 a, b Means different superscripts are significantly different at 5% level of significance; LSD=Least Significant Difference; and SEM= Standard Error of the Mean; Av=Average 4.3.2.7 Mortality Mortality in Nana chicks was not significantly (P>0.05) different from that of nana
ones; however, total mortality (chick & adult) was significantly (P<0.05) lower in the
Nana birds compared to their nana counterparts (Table 4.3.2.7 and Appendix 2).
Table 4.3.2.7: The Effect of Naked Neck Gene on Survivability of F1 Birds Parameters/ F1 Birds Nana nana LSD SEM Chick Mortality (%) 1.45 1.38 0.220 0.1037 Total Mortality (%) 7.79a 9.13b 0.392 0.1992 a, b Means different superscripts are significantly different at 5% level of significance; LSD=Least Significant Difference; and SEM= Standard Error of the Mean
4.3.3.0 Matings Involving Naked Necks (Nana × Nana)
4.3.3.1 The Second Generation Parents (P2)
The male and female birds selected as parents of the second generation were
heterozygous naked neck birds from the first filial generation of birds (Fig. 4.3.3.1). The
males were 400 g heavier than the females (2000 g vs 1600 g) at 20weeks of age.
Mortality from the growing to the laying period was only 2%, and this resulted in a

88
narrow difference (3%) between hen-day and hen-housed rates of lay. Reproductive
performance in terms of fertility (91.78%) and hatchabilty (72.10%) were satisfactory.
Fig. 4.3.3: Heterozygous Naked neck Males and Females Used in the Second Mating Productive and reproductive characteristics of the second generation of parents such as
average body weight at 20 weeks, average age at first egg, average rate of lay (hen-
housed and hen-day), average egg size to body weight ratio, fertility, hatchability and
mortality, and their standard deviation are shown in Table 4.3.3a.

89
Table 4.3.3.1a: Productive and Reproductive Characteristics of the Second Parental Generation (P2) Trait Standard Error Av. Body Weight at 20wks-Males 2000.00g 2.65 Av. Body Weight at 20wks-Females 1600.00g 2.09 Av. Age at First Egg 148.00days 1.86 Hen-Housed Rate of Lay 65.00% 1.91 Hen-Day Rate of Lay 68.00% 2.02 Av. Egg Size to Body Weight Ratio 1: 29.31 2.31 Av. Fertility 91.78% 1.84 Av. Hatchability 72.10% 3.02 Mortality 2.00% 0.00
The eggs of the second parental generation dams were moderate in size (58g) and high
in quality (Haugh unit = 78%). The egg shells were also thick (0.37mm). The egg
quality characteristics of the second parental generation in terms of egg size, albumen
height, Haugh unit, shell thickness, yolk height, yolk diameter and yolk colour score are
presented in Table 4.3.3.1b
Table 4.3.3.1b: Egg Quality Characteristics of the Second Parental Generation Trait Standard Error Av. Egg Size 58.00g 2.49 Av. Albumen Height 7.35mm 2.05 Av. Haugh Unit 78.00% 1.91 Av. Shell Thickness 0.37mm 1.88 Av. Yolk Height 17.00mm 2.09 Av. Yolk Diameter 40.00mm 1.98 Av. Yolk Colour Score 5.00 2.41 Av=Average 4.3.4.0 Second Filial Generation (F2) Birds – Naked Necks (NaNa, Nana) and Normals (nana) 4.3.4.1 Plumage Colour The second filial generation (F2) birds (homozygous naked neck-NaNa, heterozygous
naked neck-Nana & normal feathered-nana) had different plumage colours which were

90
either multi or single. The colours included white, black, barred and brown; however,
the majority of the females had brown plumage colour.
Fig.4.3.4: F2 Homozygous Naked Necks 4.3.4.2 Body Weight and Body Weight Gain (Day-old to Week 20) Chick weight and weekly weight gain from day-old to the end of week 2 were
significantly higher in nana chicks than NaNa and Nana ones, except at the end of week
2 where the body weight of nana chicks were not significantly different from those of
NaNa ones (Table 4.3.4.2a). NaNa and Nana chicks had a significantly higher average
body weight and body weight gain from week three to the end of week six compared to
the nana chicks (Table 4.3.4.2a, Fig. 4.3.4.2a and Appendix 2).

91
Table 4.3.4.2a: A Comparison of the Body Weight and Body Weight Gain of NaNa, Nana and nana F2 Chicks (Day-old to Week 6) Parameters/ F2 Chicks NaNa Nana nana LSD SEM Av.Body Weight-WK0 (g) 39.71b 38.66b 42.29a 1.997 0.9860 Av.Body Weight-WK1 (g) 96.89b 95.33b 103.11a 3.672 1.8140 Av.Body Weight-Gain b/n WK0&1 (g) 32.18b 31.67b 35.83a 1.931 0.9540 Av.Body Weight-Wk2 (g) 137.40ab 136.39a 138.14b 1.405 0.6940 Av.Body Weight-Gain b/n Wk1&2 (g) 40.45b 41.06b 34.97a 2.571 1.2700 Av.Body Weight-WK3 (g) 183.02b 182.98b 181.74a 0.520 0.2570 Av.Body Weight-Gain b/n WK2&3 (g) 45.69b 46.59b 43.66a 1.639 0.8090 Av.Body Weight-WK4 (g) 232.62b 233.09b 230.16a 1.313 0.6480 Av.Body Weight-Gain b/n WK3&4 (g) 49.59b 50.11b 48.42a 0.936 0.4620 Av.Body Weight-WK5 (g) 300.13b 301.04b 295.17a 2.609 1.2890 Av.Body Weight-Gain b/n WK4&5 (g) 67.52b 67.95b 65.00a 1.296 0.6400 Av.Body Weight-WK6 (g) 383.96b 384.97b 373.30a 4.885 2.4130 Av.Body Weight Gain b/n WK5&6 (g) 83.83b 83.93b 78.13a 2.388 1.1800 a, b Means with different superscripts are significantly (P<0.05) different at 5% level of significance; LSD=Least Significant Difference; SEM=Standard Error of the Mean; Av=Average; b/n = between
Body weights of NaNa, Nana and nana chickens did not show any significant (P>0.05)
differences from weeks seven to twelve (Table 4.3.4.2b and Appendix 2).
366368370372374376378380382384386
NaNa Nana nana
Body Weight at 6wks (grams)
F2 BirdsFig. 4.3.5a: A Bar Chart Showing Six-week Body Weights of
Homozygous Naked neck, Heterozygous Naked neck and Normal …

92
Table 4.3.4.2b: Body Weight and Body Weight Gain of NaNa, Nana & nana F2 Birds (Weeks 7 to 14) Parameter/ F2 Birds NaNa Nana nana LSD SEM Av.Body Weight-WK7 (g) 386.78 384.44 385.78 3.339 1.696 Av.Body Weight-WK8 (g) 427.11 425.22 427.67 4.179 2.1220 Av.Body Weight-Gain b/n WK7&8 (g)
39.56 39.56 42.01 2.350 1.1930
Av.Body Weight-Wk9 (g) 489.10 485.60 491.40 5.430 2.7600 Av.Body Weight-Gain b/n Wk8&9 (g)
61.12 60.17 62.17 2.191 1.1130
Av.Body Weight-WK10 (g) 583.30 581.10 580.00 6.830 3.4700 Av.Body Weight-Gain b/n WK9&10 (g)
92.68b 94.44b 87.99a 3.337 1.6950
Av.Body Weight-WK11 (g) 685.90 686.20 677.20 8.710 4.4200 Av.Body Weight-Gain b/n WK10&11 (g)
102.44b 105.11b 97.22a 3.587 1.822
Av.Body Weight-Wk12 (g) 801.10 803.20 786.00 11.130 5.6500 Av.Body Weight-Gain b/n Wk11&12 (g)
114.67b 117.89b 108.56a 3.909 1.9850
Av.Body Weight-WK13 (g) 934.10b 939.30b 912.30a 14.190 7.2100 Av.Body Weight-Gain b/n WK12&13 (g)
133.33b 136.33b 126.11a 4.400 2.2340
Av.Body Weight-WK14 (g) 1077.90b 1087.70b 1050.30a 18.330 9.3100 Av.Body Weight-Gain b/n WK13&14 (g)
143.89a 148.33b 138.00c 4.196 2.1310
a – c Means with different superscripts are significantly (P<0.05) different at 5% level of significance; LSD=Least Significant Difference; SEM=Standard Error of the Mean; Av=Average; b/n = between The average body weights at weeks 13 and 14 of the nana birds were significantly
(P<0.05) lower than those of both NaNa and Nana birds. However, there were no
significant differences in the body weights of NaNa and Nana birds during the same
periods. From the 10th week to the 14th week the weights gained by the nana birds were
significantly lower than the weight gained by the NaNa and Nana birds. A significant
difference in weight gain between the NaNa and Nana birds was observed in week 14
(Table 4.3.4.2b and Appendix 2).

93
Body weight and body weight gain of NaNa and Nana birds from weeks fifteen to
twenty were significantly higher compared to those of nana birds (Table 4.3.4.2c, Fig.
4.3.4.2b and Appendix 2).
Table 4.3.4.2c: Body Weight and Body Weight Gain of NaNa, Nana & nana F2 Birds (Weeks 15 to 20) Parameter/ F2 Birds NaNa Nana nana LSD SEM Av.Body Weight-Wk15 (g) 1231.30b 1247.40b 1197.20a 21.320 10.8300 Av.Body Weight-Gain b/n Wk14&15 (g)
153.89a 158.11b 148.00c 4.177 2.1210
Av.Body Weight-WK16 (g) 1396.10b 1413.90b 1356.10a 23.680 12.0300 Av.Body Weight-Gain b/n WK15&16 (g)
164.11b 168.11b 158.00a 4.185 2.1250
Av.Body Weight-WK17 (g) 1552.10b 1577.60b 1502.90a 28.900 14.6700 Av.Body Weight-Gain b/n WK16&17 (g)
156.30a 163.20b 146.60c 5.630 2.8600
Av.Body Weight-WK18 (g) 1738.80b 1761.20b 1683.90a 32.750 16.6300 Av.Body Weight-Gain b/n WK17&18 (g)
176.80a 183.70b 166.00c 5.640 2.8700
Av.Body Weight-WK19 (g) 1911.90b 1938.90b 1844.60a 37.680 19.1300 Av.Body Weight-Gain b/n WK18&19 (g)
173.40b 179.20b 162.20a 5.880 2.9800
Av.Body Weight-WK20 (g) 2085.90b 2122.80b 2008.90a 43.870 22.2700 Av.Body Weight-Gain b/n WK19&20 (g)
175.30a 183.90b 163.10c 7.010 3.5600
a – c Means with followed by different superscripts are significantly (P<0.05) different at 5% level of significance; LSD=Least Significant Difference; SEM=Standard Error of the Mean; Av=Average; b/n = between

94
The NaNa and Nana birds did not show any significant difference in body weight from
week fifteen to twenty. In body weight gain Nana F2 birds gained significantly more
weight than NaNa F2 birds in weeks 15, 17, 18 and 20 (Tables 4.3.4.2c, Fig. 4.3.4.2b
and Appendix 2).
4.3.4.3 Body Measurements
Average body length of the Nana F2 birds was significantly higher (P<0.05) than that of
the NaNa F2 birds whose average body length was also significantly higher than that of
the nana F2 birds. Body widths of NaNa and Nana F2 birds were significantly higher
(P<0.05) than that of the nana F2 birds. However, shank length did not show any
significant difference (P>0.05) between the F2 birds (NaNa, Nana & nana), (Table
4.3.4.3 and Appendix 2).
1950
2000
2050
2100
2150
NaNa Nana nana
Body Weight at 20wks (grams)
F2 BirdsFig.4.3.5b: Comparative Body Weight at Twenty Weeks of Age of F2
NaNa, Nana and nana

95
Table 4.3.4.3: Body Measurements of NaNa, Nana and nana F2 Birds Parameters/Phenotype NaNa Nana nana LSD SEM Av.Body Length (cm) 38.17a 38.50b 36.50c 0.285 0.1445 Av.Body Width (cm) 14.00b 14.00b 13.50a 0.260 0.1320 Av.Shank Length (cm) 8.50 8.42 8.33 0.158 0.0803 a – c Means different superscripts are significantly (P<0.05) different at 5% level of significance; P’TERS=PARAMETRS; LSD=Least Significant Difference; SEM=Standard Error of the Mean; Av=Average 4.3.4.4 Laying Performance Number of eggs per clutch, egg size, egg size to body weight ratio, hen-housed rate of
lay and hen-day rate of lay were significantly (P<0.05) lower in the F2 nana layers
compared to those of NaNa and Nana F2 birds. F2 nana layers laid their first eggs
significantly (P<0.05) earlier than NaNa and Nana F2 layers. Age at first egg was
significantly (P<0.05) better in Nana F2 layers than NaNa ones whilst the value for hen-
day rate of lay was significantly (P<0.05) higher in NaNa F2 layers than Nana ones
(Table 4.3.4.4a and Appendix 2).
Table 4.3.4.4a: Laying Performance of NaNa, Nana and nana F2 Birds Parameter/ Phenotype NaNa Nana nana LSD SEM Av.Age at First Egg (days) 135.87a 135.20b 129.47c 0.665 0.3360 Av.Eggs per Clutch 18.93b 19.27b 16.27a 0.472 0.2386 Av.Egg Size (g) 58.32b 58.10b 52.62a 0.491 0.2480 Av.Egg Size to Body Wt Ratio 31.21b 31.09b 30.14a 0.275 0.1319 Rate of Lay-Hen-housed (%) 63.27b 63.00b 55.93a 0.640 0.3230 Rate of Lay-Hen-day (%) 66.00a 65.00b 59.20c 0.550 0.2780 a – c Means with different superscripts are significantly (P<0.05) different at 5% level of significance; P’TERS=PARAMETRS; LSD=Least Significant Difference; SEM=Standard Error of the Mean; Av=Average
4.3.4.4.1 Effect of Environment (Village) on Laying Performance
Age at first egg, egg size to body weight ratio, hen-housed rate of lay and hen-day rate
of lay were not significantly different (P>0.05) between birds from Yawkwei, Juaso and
Nkwanta. However, values for number of eggs per clutch and egg size were

96
significantly higher (P<0.05) in birds kept at Nkwanta compared to those from
Yawkwei and Juaso (Table 4.3.4.4b and Appendix 2).
Table 4.3.4.4b: Effect of Environment (Village) on Laying Performance Parameters/ Villages Yawkwei Juaso Nkwanta LSD SEM Av.Age at First Egg (days) 133.60 133.60 133.33 0.665 0.3360 Av.Eggs per Clutch 17.93b 17.93b 18.60a 0.472 0.2386 Av.Egg Size (g) 56.13b 56.13b 56.79a 0.491 0.2480 Av.Egg Size to Body Wt Ratio 30.80 30.80 30.85 0.275 0.1391 Rate of Lay-Hen-housed (%) 60.87 60.87 60.47 0.640 03230 Rate of Lay-Hen-day (%) 63.40 63.40 63.40 0.550 0.2780 a, b Means with different at 5% level of significance; P’TERS=PARAMETRS; LSD=Least Significant Difference; SEM=Standard Error of the Mean; Av=Average 4.3.4.5 Egg Quality Parameters Eggs from the layers of normal feathered birds (nana) had significantly lower average
values for albumen height, Haugh unit, shell thickness, yolk height, yolk diameter and
yolk colour score compared to those from the layers of homozygous (NaNa) and
heterozygous (Nana) naked neck F2 birds. With regard to yolk colour score the
difference between eggs laid by NaNa and nana layers was not significant (P>0.05).
Albumen height and yolk diameter were significantly superior in eggs from F2 NaNa
layers compared to those from F2 Nana layers (Table 4.3.4.5 and Appendix 2).
Table 4.3.4.5: Egg Quality Parameters of NaNa, Nana and nana F2 Birds Parameters/ Phenotypes NaNa Nana nana LSD SEM Av.Albumen Height (mm) 7.70a 7.38b 6.99c 0.0568 0.02870 Av.Haugh Unit (%) 82.87a 82.73a 76.07b 1.098 0.5540 Av.Shell Thickness (mm) 0.36a 0.36a 0.31b 0.00623 0.00315 Av.Yolk Height (mm) 18.22a 18.09a 17.41b 0.174 0.0878 Av.Yolk Diameter (mm) 41.73a 40.93b 40.27c 0.449 0.2268 Av.Yolk Colour Score 8.00ab 8.40a 7.73b 0.410 0.2070 a – c Means different superscripts are significantly (P<0.05) different at 5% level of significance; LSD=Least Significant Difference; SEM=Standard Error of the Mean; Av=Average

97
4.3.4.6: Some Carcass Parameters Percent defeathered weight, dressed weight, thigh and drumstick weight, breast muscle
weight, gizzard weight and liver weight were significantly (P<0.05) higher in the
carcasses of NaNa and Nana F2 birds compared to those of nana F2 birds. However,
relative weight of intestines was significantly higher (P<0.05) in nana F2 birds
compared to that of NaNa and Nana F2 birds. Percent defeathered weight, dressed
weight and breast muscle weight were significantly higher (P<0.05) in NaNa F2 birds
than Nana ones whilst relative weight of intestines was significantly higher (P<0.05) in
Nana than NaNa F2 birds (Table 4.3.4.6 and Appendix 2).
Table 4.3.4.6: Some Carcass Parameters of NaNa, Nana and nana F2 Birds Parameter/ Phenotype NaNa Nana nana LSD SEM Av.Defeathered Weight (%) 95.97a 93.76b 88.54c 0.415 0.2095 Av.Dressed Weight (%) 74.48a 73.09b 69.29c 0.978 0.4940 Av.Thigh and Drumstick Wt (%) 23.62b 23.42b 22.71a 0.342 0.1727 Av.Chest Muscle Weight (%) 17.79a 17.36b 13.37c 0.145 0.07310 Av.Wings Weight (%) 10.00 10.26 10.09 0.298 0.1503 Av.Gizzard Weight (%) 4.13b 4.19b 3.59a 0.0810 0.0409 Av.Intestines Weight (%) 4.26a 4.41b 4.96c 0.160 0.0810 Av.Heart Weight (%) 1.58 1.60 1.64 0.0517 0.02610 Av.Liver Weight (%) 2.00b 2.10b 2.31a 0.101 0.0508 a –c Means with different superscripts are significantly (P<0.05) different at 5% level of significance; LSD=Least Significant Difference; SEM=Standard Error of the Mean; Av=Average 4.3.4.7 Mortality Chick mortality was significantly lower (P<0.05) in nana F2 chicks compared to those
of NaNa and Nana F2 birds. However, total mortality (chick & adult) was significantly
(P<0.05) higher in nana F2 birds than NaNa and Nana ones (Table 4.3.4.7).
Table 4.3.4.7: Mortality of NaNa, Nana and nana F2 Birds Parameters/ Phenotypes NaNa Nana nana LSD SEM Chick Mortality (%) 1.33b 1.26b 1.14a 0.0928 0.04580 Total Mortality (%) 7.91b 8.16b 13.82a 0.662 0.3350 a, b Means with different superscripts are significantly (P<0.05) different at 5% level of significance; LSD=Least Significant Difference; SEM=Standard Error of the Mean

98
4.4 STUDY FOUR: MATINGS INVOLVING FRIZZLES (Ff × ff) 4.4.1 First Parental Generation (P1)
Body weights of the sires ranged from 1,200 g to1,650 g, with sire F1 being the heaviest
and sire F3, the lightest. Fertility of eggs from matings involving the sires ranged from
88.20% (Sire F3) to 99.20% (Sire F4). Hatchabilty of eggs from matings involving the
five sires was moderate, ranging from 66.70% (Sire F3) to 89.6% (Sire F5), (Table
4.4.1a).
Table 4.4.1a: Characteristics of the Indigenous Heterozygous Frizzle (Ff) Males used in the First Matings Sire Number
Sire Colour Age (Months)
Av.Weight ±SE (g)
Av.Fertility ±SE (%)
Av.Hatchability ±SE (%)
F1 Brown and White
14.00 1650 ± 1.38 96.90 ± 1.24 69.65 ± 2.15
F2 Brown 8.00 1500 ± 1.61 94.30 ± 1.55 70.95 ± 2.04 F3 White 10.00 1200 ± 1.66 88.20 ± 1.36 66.70 ± 2.25 F4 Multi 18.00 1350 ± 1.22 99.2 ± 1.32 70.85 ± 1.98 F5 Ash 16.00 1400 ± 1.88 89.65 ± 2.01 89.65 ± 2.32 SD = Standard Error; Av = Average
The forty Lohmann commercial females used in the first mating were fifty two weeks
old. Their average body weight, average egg size, average egg size to body weight ratio,
average fertility and average hatchability are presented in Table 4.4.1b.
Table 4.4.1b: Characteristics of the Lohmann Commercial Lohmann Females used in the First Matings with Frizzles Parameters SE Colour Brown - Age 52.00weeks - Average Weight 1,650.00g 1.96 Average Egg Size 62.36g 1.77 Average Egg Size to Body Wt Ratio 26.46 2.02 Rate of Lay – Hen day 62.55% 2.24 Average Fertility 93.65% 2.46 Average Hatchabiltity 73.56% 2.08 SD= Standard Error

99
Egg quality characteristics such as albumen height, Haugh unit, shell thickness, yolk
height, yolk diameter and yolk colour score of the eggs from the Lohmann commercial
females used in the first matings are presented in Table 4.4.1c
Table 4.4.1c: Egg Quality Characteristics of the Eggs from the Commercial Lohmann Females used in the First Mating Parameters Standard Error Av.Albumen Height 7.21mm 2.62 Av.Haugh Unit 76.60% 2.51 Av.Shell Thickness 0.31mm 1.46 Av.Yolk Height 15.50mm 1.96 Av.Yolk Diameter 40.00mm 2.17 Av.Yolk Colour Score 5.00 1.23 Av=Average
4.4.2 First Filial Generation (F1) Frizzles (Ff) and Normals (ff)
4.4.2.1 Plumage Colour
Fig. 4.4.1: Heterozygous Frizzle and Normal Feathered F1 Birds

100
The heterozygous frizzle and normal feathered birds produced in the first filial
generation had varying plumage colours (Fig. 4.4.2.1); some of the birds were multi-
coloured while others had single colours. The colours included white, black and brown;
however, the majority of the females were brown in colour.
4.4.2.2 Body Weight and Body Weight Gain (Day-old to 20th Week) The F1 heterozygous frizzle (Ff) birds were significantly (P<0.05) heavier than their
normal feathered (ff) counterparts and higher (P<0.05) in body weight gain from day-
old to the sixth week (Table 4.4.2.2a and Appendix 2).
Table 4.4.2.2a: Body Weight and Body Weight Gain of F1 Ff & ff Chicks (0-6 wks) Parameters/ F1 Birds Ff ff LSD SEM Av.Weight at Day-old (g) 39.66a 39.00b 0.2410 0.1155 Av.Weight at Week 1 (g) 63.45b 59.45a 0.00762 0.00365 Av.Weight-Gain b/n Week 0& 1 (g) 23.79a 20.44b 0.00762 0.00365 Av.Weight at Week 2 (g) 111.39b 101.56a 0.418 0.2000 Av.Weight-Gain b/n Week 1&2 (g) 47.93a 42.12b 0.00762 0.00365 Av.Weight at Week 3 (g) 166.94b 155.12a 0.00762 0.00365 Av.Weight-Gain b/n Week 2&3 (g) 55.55b 53.55a 0.2422 0.1161 Av.Weight at Week 4 (g) 230.18b 212.37a 0.00762 0.00365 Av.Weight-Gain b/n Week 3&4 (g) 61.64a 57.25b 0.03474 0.01665 Av.Weight at Week 5 (g) 333.01b 306.52a 0.00762 0.00365 Av.Weight-Gain b/n Week 4&5 (g) 102.80a 94.20b 0.3415 0.1637 Av.Weight at Week 6 (g) 435.10a 403.48b 0.00762 0.00365 Av.Weight-Gain b/n Week 5&6 (g) 102.10b 97.00a 0.2422 0.1161 a, b Means with different superscripts are significantly different (P<0.05); LSD=Least Significance Difference; SEM= Standard Error of the Mean; Av =Average; b/n = between The heterozygous frizzle (Ff) F1 birds were significantly heavier (P<0.05) than their
normal feathered (ff) counterparts from week 7 to week 13. However, weekly weight
gained values within the same period did not differ significantly (P>0.05) between the
two phenotypes (Table 4.4.2.2b and Appendix 2).

101
Table 4.4.2.2b: Body Weight and Body Weight Gain (Week 7 to Week 13) of F1 Ff & ff Birds Parameters/ F1 Birds Ff ff LSD SEM
Av. Wt at Wk7 421.33b 408.33a 3.796 5.2610 Av. Wt at Wk8 473.00b 457.30a 4.240 2.1500 Av. Wt Gain b/n Wk7&8 49.33 47.67 2.260 1.1440 Av. Wt at Wk9 532.70b 507.30a 4.420 2.2400 Av. Wt Gain at Wk8&9 54.67 53.67 2.503 1.2670 Av. Wt at Wk10 604.00b 568.60a 4.680 2.3700 Av. Wt Gain at Wk9&10 67.67 65.00 3.276 1.6580 Av. Wt at Wk11 688.70b 645.30a 5.780 2.9300 Av. Wt Gain at Wk10&11 80.00 79.33 3.300 1.6700 Av. Wt at Wk12 781.00b 729.00a 6.550 3.3100 Av. Wt Gain at Wk11&12 87.30 88.70 3.990 2.0200 Av. Wt at Wk13 876.00b 817.70a 7.040 3.5600 Av. Wt Gain at Wk12&13 89.70 90.00 3.990 2.0200 a, b Means different superscripts are significantly different (P<0.05); LSD=Least Significant Difference; SEM= Standard Error of the Mean; Av=Average; b/n = between Table 4.4.2.2c: Comparing the Body Weight and Body Weight Gain (Week 14 to week 20) of F1 Ff and ff Birds Parameters/ F1 Birds Ff ff LSD SEM Av. Wt at Wk14 971.70b 903.00a 8.700 4.4100 Av. Wt Gain b/n Wk13&14 90.33 90.67 3.834 1.9400 Av. Wt at Wk15 1073.70b 992.30a 12.380 6.2600 Av. Wt Gain b/n Wk14&15 95.67 95.67 3.709 1.8770 Av. Wt at Wk16 1177.30b 1086.00a 10.180 5.1500 Av. Wt Gain b/n Wk15&16 98.67 98.22 3.665 1.8550 Av. Wt at Wk17 1241.70b 1141.30a 9.680 4.9000 Av. Wt Gain b/n Wk16&17 106.70 103.90 3.980 2.0100 Av. Wt at Wk18 1356.90b 1247.00a 11.030 5.5800 Av. Wt Gain b/n Wk17&18 111.7 108.3 4.160 2.1100 Av. Wt at Wk19 1474.00b 1357.00a 12.160 6.1600 Av. Wt Gain b/n Wk18 &19 113.7 113.2 4.110 2.0800 Av. Wt at Wk20 1582.60b 1467.00a 14.530 7.3500 Av. Wt Gain b/n Wk19&20 110.67 109.33 3.571 1.8070 a, b Means with different superscripts are significantly different (P<0.05); LSD=Least Significant Difference; SEM= Standard Error of the Mean; Av=Average; b/n = between The F1 Ff birds were significantly (P<0.05) higher in body weight compared to their ff
counterparts from week 14 to week 20 whilst the differences in weekly weight gained

102
values between the two phenotypes within the same period were not significant
(P>0.05), (Table 4.4.2.2c and Appendix 2).
4.4.2.3 Body Measurements Body length, body width and shank length of Ff and ff F1 birds were not significantly
(P>0.05) different (Table 4.4.2.4 and Appendix 2)
Table 4.4.2.3: Body Measurements of Ff & ff F1 Birds Parameters/ F1 Birds Ff ff LSD SEM
Av.Body Length (cm) 35.18 34.99 0.629 0.3210 Av.Body Width (cm) 14.13 14.14 0.0912 0.0465 Av.Shank Length (cm) 8.25 8.21 0.0680 0.0346 Means with different superscripts are significantly different (P<0.05); LSD= Least Significant Difference; SEM= Standard Error of the Mean; Av=Average 4.4.2.4 Egg Laying Performance The F1 Ff layers were significantly superior (P<0.05) to their ff counterparts in terms of
number of eggs per clutch, egg size to body size ratio and rate of lay (hen-housed and
hen-day). However, age at first egg was significantly better (P<0.05) in F1 ff layers
compared to the F1 Ff ones whilst egg size was not significantly different (P>0.05)
between the two phenotypes (Table 4.4.2.4a and Appendix 2).
Table 4.4.2.4a: Laying Performance of F1 Ff & ff Birds Parameters/ F1 Birds Ff ff LSD SEM
Av.Age at First Egg (days) 147.32a 144.48b 0.828 0.4210 Av.Egg per Clutch 16.76a 15.20b 0.622 0.3160 Av.Egg Size (g) 48.32 48.44 0.718 0.3650 Av.Egg Size to Body Size Ratio 28.57b 26.26a 0.650 0.3310 Rate of Lay-Hen-housed (%) 54.83b 51.49a 0.693 0.3520 Rate of Lay- Hen-day (%) 60.31b 57.88a 0.797 0.4060 a, b Means with different superscripts are significantly different (P<0.05); P’TYPE= Phenotypes; LSD= Least Significant Difference; SEM= Standard Error of the Mean; Av=Average

103
4.4.2.4.1 The Effect of Environment (Village) on Laying Performance
Age at first egg, eggs per clutch, egg size, egg size to body size ratio and hen-day rate
of lay were not significantly different (P>0.05) among layers that were reared in the
three villages; hen-housed rate of lay was significantly lower in layers that were reared
at Yawkwei as compared to those reared at Juaso and Nkwanta (Table 4.4.2.4b and
Appendix 2).
Table 4.4.2.4b: The Effect of Environment on Laying Performance of F1 Birds Parameters/Villages Yawkwei Juaso Nkwanta LSD SEM Av.Age at First Egg (days) 145.66 145.98 146.06 1.014 0.5160 Av.Eggs per Clutch 15.94 15.94 16.06 0.762 0.3870 Av.Egg Size (g) 48.55 48.36 48.23 0.880 0.4470 Av.Egg Size to Body Size Ratio 27.49 27.33 27.42 0.796 0.4050 Rate of Lay-Hen-housed (%) 52.24a 53.69b 53.55b 0.848 0.4320 Rate of Lay- Hen-day (%) 58.07 59.53 59.68 0.976 0.4970 a, b Means with different superscripts are significantly different (P<0.05); LSD= Least Significant Difference; SEM= Standard Error of the Mean; Av=Average 4.4.2.4.2 The Effect of Sire on Laying Performance Age at first egg was significantly (P<0.05) better in the offspring of sires F2, F4 and F5
followed by those of sires F3, and F1 respectively (Table 4.4.2.4c). Egg size was
significantly higher in the offspring of sire F1 than those of sires F2, F4 and F5 which
were significantly better than those of F3. Egg size to body size ratio was significantly
(P<0.05) better in the offspring of sires F3 and F4 compared to those of sires F1 and F5,
and those of sire F2 performed least; however, among the offspring of sires F1 & F3
and also F3 & F5 the differences were not significant (P>0.05). Hen-housed rate of lay
was significantly higher (P<0.05) in the offspring of sire F2 than those of sires F1 & F5
which were significantly better (P<0.05) compared to the offspring of sires F3 & F4.
However, the difference was not significant (P>0.05) neither between the offspring of

104
sires F2 and F5 nor those of sires F1 and F3. Number of eggs per clutch and hen-day
rate of lay did not differ significantly (P>0.05) between offspring of the five sires
(Table 4.4.2.4c and Appendix 2).
Table 4.4.2.4c: The Effect of Sire on Laying Performance of F1 Birds P’ters/ Sires F1 F2 F3 F4 F5 LSD SEM Av.Age at First Egg (days)
148.20a 145.10b 146.50c 144.60b 145.10b 1.309 0.6660
Av.No. of Eggs per Clutch
15.80 15.90 16.60 15.60 16.00 0.983 0.5000
Av.Egg Size (g) 50.82a 49.11be 45.95c 47.62de 48.39e 1.135 0.5780 Av.Egg Size to Body Size Ratio
27.31a 28.83b 26.72ac 26.22c 27.99a 1.027 0.5230
Rate of Lay-Hen-housed (%)
53.20ac 54.50b 52.33cd 51.87d 53.90ab 1.095 0.5570
Rate of Lay- Hen-day (%)
58.60 59.40 58.27 59.40 59.80 1.261 0.6410
a, b Means with different superscripts are significantly different (P<0.05); Av=Average; P’TERS= Parameters; LSD= Least Significant Difference; SEM= Standard Error of the Mean;
4.4.2.5 Egg Quality Parameters The eggs of the F1 heterozygous frizzle (Ff) layers had significantly (P<0.05) higher
values for albumen height, Haugh unit and yolk height as compared to eggs from their
normal feathered counterparts. However, shell thickness, yolk diameter and yolk colour
score values were not significantly different (P>0.05) between eggs from layers of the
two phenotypes (Table 4.4.2.5 and Appendix 2).
Table 4.4.2.5: Egg Quality Measurements of F1 Ff and ff Birds Parameters/ F1 Birds Ff ff LSD SEM
Av.Albumen Height (mm) 6.60a 5.91b 0.394 0.2000 Av.Haugh Unit (%) 80.32a 77.24b 1.222 0.9830 Av.Shell Thickness (mm) 0.31 0.31 0.00287 0.001459 Av.Yolk Height (mm) 15.50a 14.96b 0.437 0.2220 Av.Yolk Diammeter (mm) 39.59 39.40 0.998 0.5080 Av.Yolk Colour Score 8.24 8.09 0.185 0.0940 a, b Means with followed by different superscripts are significantly different (P<0.05); P’TERS= Parameters; LSD= Least Signiificant Difference; SEM= Standard Error of the Mean; Av=Average

105
4.4.2.6 Carcass Parameters The carcasses of the F1 birds with the frizzle (Ff) phenotype did not differ significantly
(P>0.05) from those of their normal feathered counterparts in terms of defeathered
weight, thigh and drumstick weight, breast muscle weight, weight of wings, gizzard
weight, heart weight and liver weight (Table 4.4.2.6 and Appendix 2). Values for
dressed weight and weight of intestines of the Ff birds were significantly (P<0.05)
higher than those of the ff birds (Table 4.4.2.6 and Appendix 2).
Table 4.4.2.6: Some Carcass Parameters of F1 Ff and ff Birds Parameters/ F1 Birds Ff ff LSD SEM Av. Defeathered Weight (%) 90.52 90.41 0.241 0.1224 Av. Dressed Weight (%) 68.50a 68.24b 0.238 0.1212 Av. Thigh and Drumstick Wt (%) 23.18 23.09 0.153 0.0779 Av. Chest Muscle Weight (%) 14.62 14.61 0.0544 0.0277 Av. Wing Weight (%) 9.63 9.58 0.0553 0.0281 Av. Weight of Intestines (%) 4.08a 3.85b 0.0801 0.0408 Av. Gizzard Weight (%) 3.56 3.58 0.0474 0.0241 Av. Heart Weight (%) 1.56 1.56 0.0279 0.01419 Av. Liver Weight (%) 1.99 1.99 0.0242 0.01229 a, b Means with different superscripts are significantly different (P<0.05); LSD= Least Significant Difference; SEM= Standard Error of the Mean; Av=Average
4.4.2.7 Mortality The Ff birds were significantly higher (P<0.05) in chick (day-old to 6wks) and total
(day-old to end of lay) mortalities compared to their ff counterparts (Table 4.4.2.7 and
Appendix 2).
Table 4.4.2.7: Mortality of F1 Ff and ff Birds Parameters/ F1 Birds Ff ff LSD SEM Chick Mortality (%) 1.34a 1.24b 0.0762 0.0365 Total Mortality (%) 11.30a 10.96b 0.211 0.1074 a, b Means with different superscripts are significantly (P<0.05) different; LSD= Least Significant Difference; SEM= Standard Error of the Mean

106
4.4.3 Matings Involving Frizzles (Ff × Ff) 4.4.3.1 Second Parental Generation (P2)
The male and female parents of the second generation were selected from the
heterozygous frizzles produced in the first filial generation. The males were 400g
heavier than the females at 20 weeks of age. Mortality from the growing to the laying
period was only 3%. Fertility was 92.67% whilst hatchability was 77.70%. Productive
characteristics of the second generation of parents (P2) namely average body weight at
20 weeks, average age at first egg, average rate of lay (hen-housed and hen-day),
average egg size to body weight ratio and mortality and their measures of dispersion are
shown in Table 4.4.3a. Reproductive characteristics of the second parental generation
such as fertility and hatchability, and their measures of dispersion are also shown in
Table 4.4.3a.
Table 4.4.3a: Productive and Reproductive Characteristics of P2 Birds Parameters Mean SE Av. Body Weight at 20wks-Males 1,900.00g 2.44 Av. Body Weight at 20wks-Females 1,500.00g 2.25 Av. Age at First Egg 138.00days 1.88 Hen-Housed Rate of Lay 60.00% 1.76 Hen-Day Rate of Lay 64.00% 2.22 Av. Egg Size to Body Weight Ratio 27.27 2.04 Av. Fertility 92.67% 1.92 Av. Hatchability 77.70% 2.85 Mortality 3.00% 0.00 SD=Standard Error; Av=Average
The eggs of the females of second generation of parents had an average weight of 55g
with a Haugh unit of 75.20%. The egg quality characteristics of the P2 female parents in
terms of egg size, albumen height, Haugh unit, shell thickness, yolk height, yolk
diameter and yolk colour score are presented in Table 4.4.3b.

107
Table 4.4.3b: Egg Quality Characteristics of the Second Generation Parents (P2) Parameters Mean SE Av.Egg Size 55.00g 2.14 Av.Albumen Height 7.12mm 1.54 Av.Haugh Unit 75.20% 1.84 Av.Shell Thickness 0.34mm 1.28 Av.Yolk Height 16.00mm 1.82 Av.Yolk Diameter 40.00mm 1.70 AvYolk Colour Score 6.00 1.65 SD- Standard Error; Av=Average
4.4.4.0 Second Filial Generation Birds – Frizzles (FF, Ff) and Normals (ff) 4.4.4.1 Plumage Colour The second filial generation (F2) birds (homozygous frizzles-FF, heterozygous frizzle-
Ff and normal feathered-ff) had varying feather colours (Fig. 4.4.4.1); some had multi-
colours while others had single colours. The colours included white, black, reddish
brown and brown; however, majority of the females were brown in colour.
Fig.4.4.2: The F2 Generation Homozygous Frizzles (FF)

108
4.4.4.2 Body Weight and Body Weight Gain (Day-old to Week 20) Body weight and body weight gain from day-old to six weeks of age of homozygous
frizzle (FF), heterozygous frizzle (Ff) and normal feathered (ff) F2 birds did not differ
significantly (P>0.05), (Table 4.4.4.2a and Appendix 2).
Table 4.4.4.2a: Body Weight and Body Weight Gain (Day-old to Week 6) of FF, Ff & ff F2 Birds PARAMETERS/ F2 BIRDS FF Ff ff LSD SEM Av.Body Wt at Day-old 35.90 36.76 38.00 3.309 1.6350 Av.Body Weight at Week 1 70.77 71.69 71.99 2.566 1.2670 Av.Body Weight-Gain b/n Week0&1 34.27 33.50 32.64 2.418 1.1950 Av.Body Weight at Week 2 122.13 121.03 122.10 2.616 1.292 Av.Body Weight-Gain b/n Week1&2 51.56 51.27 51.84 3.210 1.5860 Av.Body Weight at Week 3 180.27 179.51 179.71 2.294 1.1330 Av.Body Weight-Gain b/n Week2&3 58.60 58.25 57.84 3.603 1.7800 Av.Body Weight at Week 4 243.58 243.68 242.64 4.857 2.3990 Av.Body Weight-Gain b/n Week3&4 62.84 62.70 61.66 2.709 1.3380 Av.Body Weight at Week 5 307.70 306.90 307.20 6.130 30300 Av.Body Weight-Gain b/n Week4&5 64.90 65.06 64.52 3.300 1.6300 Av.Body Weight at Week 6 388.10 378.40 376.90 10.740 5.3000 Av.Body Weight-Gain b/n Week5&6 80.20 72.40 72.80 8.950 4.4200 Means with different superscripts are significantly different at 5% level of significance; LSD= Least Significant Difference; SEM=Standard Error of the Mean; Av=Average; b/n = between At the end of weeks 7 and 13 the normal feathered F2 birds were significantly (P<0.05)
higher in body weight than the homozygous and heterozygous F2 frizzles (Table
4.4.4.2b). During weeks 8, 12 and 14 to 18, the heterozygous F2 frizzles and the normal
feathered F2 birds were significantly heavier (P<0.05) than the homozygous F2 frizzles.
Body weight at the end of week 9 was significantly higher (P<0.05) for the
heterozygous F2 frizzles compared to the homozygous F2 frizzles and normal feathered
F2 birds (Table 4.4.4.2b and Appendix 2).

109
Table 4.4.4.2b: Body Weight and Body Weight Gain (Week 7 to Week 14) of Homozygous Frizzle (FF), Heterozygous Frizzle (Ff) and the Normal Feathered (ff) F2 Birds Parameters/ F2 Birds FF Ff ff LSD SEM Av. Body Wt at Week 7 (g) 387.78b 387.22b 393.56a 4.561 2.3160 Av. Body Weight at Week 8 (g) 425.56a 431.67b 434.44b 4.698 2.3850 Av. Body Weight-Gain b/n Week7& 8 (g)
46.67b 52.22a 48.67b 2.850 1.4470
Av. Body Weight at Week 9 (g) 487.22b 496.11a 491.22b 4.568 2.3200 Av. Body Weight-Gain b/n Week8& 9 (g)
66.11 65.00 64.33 2.778 1.4110
Av. Body Weight at Week 10(g) 573.30 573.30 567.90 5.230 2.6500 Av. Body Weight-Gain b/n Week 9&10 (g)
83.33b 83.33b 79.00a 3.209 1.6290
Av. Body Weight at Week 11 (g) 661.10 656.70 659.10 5.370 2.7300 Av. Body Weight-Gain b/n Week 10&11 (g)
91.67 91.67 92.00 3.226 1.6380
Av. Body Weight at Week 12 (g) 738.00a 773.00b 771.00b 31.860 16.1800 Av. Body Weight-Gain b/n Week 11&12 (g)
111.67b 114.44b 120.33a 4.072 2.0680
Av. Body Weight at Week 13 (g) 906.10b 905.00b 911.90a 5.790 2.9400 Av. Body Weight-Gain b/n Week 12&13 (g)
133.33 137.22 135.11 4.457 2.2630
Av. Body Weight at Week 14 (g) 1038.30a 1051.10b 1051.90b 10.470 5.3200 Av. Body Weight-Gain b/n Week 13&14 (g)
138.33 138.33 140.11 3.530 1.7930
a, b Means with different superscripts are significantly (P<0.05); LSD= Least Significant Difference; SEM=Standard Error of the Mean; Av=Average; b/n = between Body weight gain at week 8 was significantly higher (P<0.05) for Ff birds as compared
to the FF and ff ones (Table 4.4.4.2b and Appendix 2). During weeks 10, 12 and 18,
body weight gain was significantly higher (P<0.05) for ff birds than FF and Ff birds.
Body weight gain at weeks 17 and 19 was significantly higher (P<0.05) for Ff and ff
birds compared to FF ones (Table 4.4.4.2b & c and Appendix 2). However, body
weight at the end of weeks 10, 11, 19 and 20, and also body weight gain during weeks
9, 11, 13 to 16 and 20 were not significantly different (P>0.05) between FF, Ff, ff birds
(Table 4.4.4.2b & c, Fig. 4.4.4.2 and Appendix 2).

110
Table 4.4.4.2c: Effect of Genotype on the Weekly Body Weight and Weekly Weight Gain of F2 FF, Ff & ff Birds (Week 15 to Week 20). Parameter/ F2 Birds FF Ff ff LSD SEM Av.Body Weight at Week 15 (g) 1161.70a 1173.90b 1176.30b 6.180 3.1400 Av.Body Weight-Gain b/n Week14& 15 (g)
141.67 145.00 145.78 4.054 2.0580
Av.Body Weight at Week 16 (g) 1302.80a 1316.70b 1315.30b 7.710 3.9200 Av.Body Weight-Gain b/n Week 15&16 (g)
143.33 144.44 144.11 3.833 1.9460
Av.Body Weight at Week 17 (g) 1428.90a 1448.90b 1445.90b 10.980 5.5700 Av.Body Weight-Gain b/n Week 16&17 (g)
133.33a 142.22b 139.11b 4.072 2.0680
Av.Body Weight at Week 18 (g) 1540.60a 1555.60b 1552.20b 10.130 5.1400 Av.Body Weight-Gain b/n Week 17&18 (g)
128.30b 133.90b 141.30a 4.920 2.5000
Av.Body Weight at Week 19 (g) (g) 1667.20 1673.30 1664.80 12.120 6.1500 Av.Body Weight-Gain b/n Week18& 19
118.90a 126.70b 123.40b 5.110 2.6000
Av.Body Weight at Week 20 (g) 1760.60 1776.10 1768.00 30.890 15.6800 Av.Body Weight-Gain b/n Week 19&20 (g)
121.10 118.90 124.00 5.230 2.6500
a, b Means with different superscripts are significantly different at 5% level of significance; LSD= Least Significant Difference; SEM=Standard Error of the Mean; Av=Average; b/n = between
0
200
400
600
800
1000
1200
1400
1600
1800
2000
0 2 4 6 8 10 12 14 16 18 20
Bod
y W
eigh
t (gr
ams)
Age (Weeks)
Fig.4.4.3: A Graph Showing the Growth Patterns of Homozygous Frizzle, Heterozygous Frizzle and Normal Feathered F2 Birds
Homozygous Frizzle
Heterozygous Frizzle
Normal feathered

111
4.4.4.3 Body Measurements Ff birds had significantly (P<0.05) higher values in average body length compared to
their FF and ff counterparts. However, average body width and shank length did not
differ significantly (P>0.05) among FF, Ff and ff F2 birds (Table 4.4.4.3 and Appendix
2).
Table 4.4.4.3: Body Measurements of Homozygous Frizzle, Heterozygous Frizzle and Normal Feathered F2 Birds Parameters/F2 Birds FF Ff ff LSD SEM
Av.Body Length (cm) 37.40b 38.07a 37.06b 0.517 0.2630
Av.Body Width (cm) 13.93 14.13 13.89 0.357 0.1812
Av.Shank Length (cm) 8.52 8.32 8.51 0.262 0.1328 a, b Means with different superscripts are significantly different at 5% level of significance; LSD=Least Significant Difference; SEM= Standard Error of the Mean; Av=Average
4.4.4.4 Egg Laying Performance Normal feathered (ff) F2 birds had a significantly (P<0.05) better value for age at first
egg than the frizzles (FF and Ff ). Number of eggs per clutch was significantly (P<0.05)
higher for Ff birds followed by FF ones and the ff birds had the lowest. Hen-housed
and hen-day rate of lay were significantly (P<0.05) higher for the birds showing the
homozygous and heterozygous frizzle phenotypes as compared to those with the normal
feathered phenotype. Egg size and egg size to body weight ratio did not differ
significantly (P>0.05) between layers from the three phenotypes (Table 4.4.4.4a and
Appendix 2).

112
Table 4.4.4.4a: Laying Performance of F2 FF, Ff & ff Birds Parameters/ F2 Birds FF Ff ff LSD SEM Av.Age at First Egg (days) 133.07b 133.47b 130.00a 2.820 1.4250 Av.Eggs per Clutch 16.80a 17.53b 15.53c 0.584 0.2950 Av.Egg Size (g) 53.95 54.23 52.84 1.204 0.6080 Av. Egg Size to Body Size Ratio 1 : 28.31 1 : 27.98 1 : 27.71 0.491 0.2480 Rate of Lay-Hen-housed (%) 59.07b 59.93b 55.73a 2.447 1.2360 Rate of Lay- Hen-day (%) 63.87b 64.27b 60.80a 1.651 0.8340 a – c Means with different superscripts are significantly different at 5% level of significance; LSD=Least Significant Difference; SEM=Standard Error of the Mean; Av=Average 4.4.4.4.1 The Effect of Environment (Village) on Laying Performance
Age at first egg, egg size, egg size to body weight ratio, hen-housed rate of lay and hen-
day rate of lay of FF, Ff and ff F2 birds were not significantly different (P>0.05)
between layers from the three villages (Table 4.4.4.4b and Appendix 2). However,
values for number of eggs per clutch were significantly higher (P<0.05) in layers from
Nkwanta compared to those from Yawkwei and Juaso (Table 4.4.4.4b and Appendix 2).
Table 4.3.4.4b: Effect of Environment on Laying Performance of F2 Birds (FF, Ff & ff) Parameters/ Villages Yawkwei Juaso Nkwanta LSD SEM Av.Age at First Egg (days) 133.60 133.60 133.33 0.665 0.3360 Av.Number of Eggs per Clutch 17.93b 17.93b 18.60a 0.472 0.2386 Av.Egg Size (g) 53.64 53.66 53.65 0.203 0.1428 Av.Egg Size to Body Wt Ratio 30.80 30.80 30.85 0.275 0.1391 Rate of Lay-Hen-housed (%) 60.87 60.87 60.47 0.640 03230 Rate of Lay-Hen-day (%) 63.40 63.40 63.40 0.550 0.2780 a, b Means with different superscripts are significantly different at 5% level of significance; P’TERS=PARAMETRS; LSD=Least Significant Difference; SEM=Standard Error of the Mean; Av=Average
4.4.4.5 Egg Quality Parameters Eggs from the layers of homozygous frizzle, heterozygous frizzle and normal feathered
F2 birds did not differ significantly (P>0.05) in values for albumen height, yolk height,
yolk diameter and yolk colour score (Table 4.4.4.5 and Appendix 2). Haugh unit value
was significantly higher (P<0.05) in eggs from the layers of homozygous and

113
heterozygous frizzles compared to those from the layers of normal feathered ones. Eggs
from the layers with homozygous frizzle phenotype had a significantly higher (P<0.05)
shell thickness values than the heterozygotes which also had significantly thicker
(P<0.05) shells than the normal feathered ones (Table 4.4.4.5 and Appendix 2).
Table 4.4.4.5: Egg Quality Performance of F2 FF, Ff & ff Birds Parameters/ F2 Birds FF Ff ff LSD SEM Av.Albumen Height (mm) 7.39 7.23 7.11 0.364 0.1840 Av.Haugh Unit (%) 79.40b 79.20b 76.87a 2.251 1.1370 Av.Shell Thickness (mm) 0.35a 0.34b 0.32c 0.00484 0.002445 Av.Yolk Height (mm) 16.59 16.58 16.24 0.414 0.2093 Av.Yolk Diammeter (mm) 40.47 40.27 40.00 1.650 0.8330 Av.Yolk Colour Score 8.27 8.00 7.80 0.417 0.2108 a – c Means with different superscripts are significantly different at 5% level of significance; LSD=Least Significant Difference; SEM=Standard Error of the Mean; Av=Average 4.4.4.6 Some Carcass Parameters Defeathered weight, thigh and drumstick weight, breast muscle weight, weight of
wings, weight of intestines, gizzard weight and heart weight were not significantly
(P>0.05) affected by the phenotypes of the birds (Table 4.4.4.6 and Appendix 2).
Normal feathered F2 birds had significantly lower (P<0.05) values for dressed and liver
weights than the frizzles (FF, Ff), (Table 4.4.4.6 and Appendix 2).

114
Table 4.4.4.6: Comparison of Some Carcass Parameters of Homozygous Frizzle (FF), Heterozygous Frizzle (Ff) and the Normal Feathered (ff) F2 Birds Parameter/ F2 Birds FF Ff ff LSD SEM Av.Defeathered Weight (%) 92.31 91.00 90.17 2.592 1.310 Av.Dressed Weight (%) 72.70b 71.61b 70.46a 1.114 0.5630 Av.Thigh and Drumstick Wt (%) 24.50 24.24 23.97 0.950 0.4800 Av.Chest Muscle Weight (%) 15.63 15.16 15.21 0.818 0.4130 Av.Wings Weight (%) 9.49 9.46 9.80 0.615 0.3110 Av.Gizzard Weight (%) 3.72 3.64 3.47 0.852 0.430 Av.Intestines Weight (%) 4.51 4.37 4.63 0.731 0.3690 Av.Heart Weight (%) 1.55 1.55 1.58 0.0431 0.02178 Av.Liver Weight (%) 2.09b 2.11b 1.96a 0.126 0.0636 a, b Means with different superscripts are significantly different at 5% level of significance; LSD=Least Significant Difference; SEM=Standard Error of the Mean; Av=Average
4.4.4.7 Mortality Chick mortality of homozygous frizzle, heterozygous frizzle and normal feathered F2
birds were not affected significantly (P>0.05) by the phenotypes of the birds; while total
mortality (from day-old to the end of lay) was significantly higher (P<0.05) in the
normal feathered birds as compared to the homozygous and heterozygous frizzles
(Table 4.4.4.7 and Appendix 2).
Table 4.4.4.7: The Effect of Genotype on the Mortality of the F2 Birds Parameters/ F2 Birds FF Ff ff LSD SEM Chick Mortality (%) 1.52 1.39 1.40 0.2413 0.119 Total Mortality (%) 9.27b 8.80b 11.27a 0.666 0.3360 a, b Means with different superscripts are significantly different (P<0.05); LSD=Least Significant Difference; SEM= Standard Error of the Mean

115
4.5 STUDY FIVE: F2 NAKED NECKS (NaNa, Nana), FRIZZLES (FF, Ff) AND NORMALS (nana/ff) REARED UNDER THREE DIFFERENT MANAGEMENT SYSTEMS (INTENSIVE, SEMI-INTENSIVE & EXTENSIVE) 4.5.1 Introduction Comparisons in traits of economic importantance between Nana & nana; NaNa, Nana
& nana; Ff & ff; and FF, Ff & ff birds have already been done in the two previous
experiments. Therefore, the results of this experiment will focus on comparison
between naked neck (NaNa, Nana) and frizzle (FF, Ff) phenotypes in reproductive and
productive traits. However, since the economics of producing these birds have not been
considered in any of the experiments, comparison between the three phenotypes (naked
neck, frizzle and normal feathered) have been done on these parameters in this
experiment. Additionally, results on the effects of management system (intensive, semi-
intensive and extensive) on all the traits measured would also be presented.
4.5.2 Body Weight and Weight Gain Body weights from week 7 to week 20 were significantly (P<0.05) higher in F2 birds
showing the naked neck phenotypes (NaNa & Nana) compared to the frizzles (FF &
Ff), (Tables 4.5.2a1 & 2). NaNa and Nana F2 birds gained significantly (P<0.05) more
weight from week 8 to week 20 than FF & Ff ones (Tables 4.5.2a1 & 2, Fig. 4.5.2 and
Appendix 2).

116
Table 4.5.2a1: Body Weight and Body Weight Gain (Week 7 to week 14) F2 Naked necks (NaNa, Nana) and Frizzles (FF, Ff)
a – d Means with different superscripts are significantly different (P<0.05); LSD=Least Significant Difference; SEM=Standard Error of the Mean; Av=Average; b/n = between Table 4.5.2a2: Body Weight and Body Weight Gain (Week 15 to week 20) of NaNa,Nana, FF & Ff Birds
a – d Means with different superscripts are significantly different (P<0.05); LSD=Least Significant Difference; SEM=Standard Error of the Mean; Av=Average; b/n = between
Parameters/Genotype NaNa Nana FF Ff LSD SEM Av.Wt at Wk7 509.7a 508.63a 440.44c 448.44b 3.876 1.9760 Av.Wt at Wk8 562.30a 561.85a 478.22c 484.67b 4.555 2.3220 Av.Wt Gain b/n Wk7&8 51.67a 52.00a 37.89b 37.22b 0.900 1.7650 Av.Wt at Wk9 620.74a 624.07a 521.11b 525.67b 5.535 2.8210 Av.Wt Gain b/n Wk8&9 60.00a 56.00b 42.78c 41.11d 1.651 0.8420 Av.Wt at Wk10 697.63a 688.44b 578.67c 583.44c 5.446 2.7760 Av.Wt Gain b/n Wk9&10 75.11a 72.11b 57.67c 57.78c 1.758 0.8960 Av.Wt at Wk11 786.33a 777.33b 653.44c 652.33c 5.588 2.8480 Av.Wt Gain b/n Wk10&11 90.33a 88.00b 74.67c 68.89d 1.868 0.9520 Av.Wt at Wk12 886.80a 872.60b 743.70c 732.50d 7.290 2.8800 Av.Wt Gain b/n Wk11&12 99.78a 94.89b 83.56c 78.00d 1.821 0.9280 Av.Wt at Wk13 998.90a 981.80b 830.00c 819.30d 6.590 3.3600 Av.Wt Gain b/n Wk12&13 110.44a 108.56a 96.11b 90.67c 2.225 1.1340 Av.Wt at Wk14 1121.40a 1101.80b 932.70c 918.80d 7.160 3.6500 Av.Wt Gain b/n Wk13&14 124.33a 121.00b 102.56c 99.56d 1.498 0.7640
Parameters/Genotype NaNa Nana FF Ff LSD SEM Av.Wt at Wk15 1258.80a 1234.20b 1052.50c 1034.30d 8.230 4.2000 Av.Wt Gain b/n Wk14&15 123.44a 127.67b 125.67ab 118.67c 3.091 1.5760 Av.Wt at Wk16 1413.10a 1384.20b 1177.70c 1155.90d 8.940 4.5600 Av.Wt Gain b/n Wk15&16 155.00a 149.89a 130.00c 125.89d 2.300 1.1730 Av.Wt at Wk17 1579.70a 1543.90b 1314.90c 1283.00d 9.890 5.0400 Av.Wt Gain b/n Wk16&17 163.78a 158.44b 133.44c 126.11d 2.065 1.0520 Av.Wt at Wk18 1763.80a 1721.30b 1463.80c 1426.40d 10.890 5.5500 Av.Wt Gain b/n Wk17&18 175.70a 179.22b 158.56c 146.11d 2.788 1.4210 Av.Wt at Wk19 1810.10a 1925.30b 1746.40c 1569.60d 30.420 15.5100 Av.Wt Gain b/n Wk18&19 192.56a 185.89b 155.89c 150.67d 2.275 1.1600 Av.Wt at Wk20 2159.50a 2102.30b 1795.80c 1734.90d 14.400 7.3400 Av.Wt Gain b/n Wk19&20 203.44a 197.78b 169.37c 164.44d 2.347 1.1960

117
Fig.4.5.2: Various F2 Phenotypes reared Under the three Management Systems
0
500
1000
1500
2000
2500
NaNa Nana FF Ff
20wks Body Weight (g)
F2 Naked necks and FrizzlesFig.4.5.1: A Bar Chart Showing the 20wks Body Weight of Homozygous
Naked neck, Heterozygous Naked neck, Homozygous Frizzle and Heterozygous Frizzle F2 Birds

118
4.5.2.1 The Effect of Management System on Body Weight and Body Weight Gain Body weight and body weight gain during weeks 7 to 20 were significantly higher
(P<0.05) in birds reared under the intensive system compared to those reared under the
semi-intensive system which was better (P<0.05) than those reared under the extensive
system (Tables 4.5.2b1 & 2 and Appendix 2).
Table 4.5.2b1: The Effect of Management System on Body Weight and Body Weight Gain (Week 7 to week 14) of F2 Birds
Parameters/ M. System Int Sem. Int Ext LSD SEM Av.Wt at Wk7 550.69a 476.67b 382.27c 3.003 1.5310 Av.Wt at Wk8 611.40a 522.76b 405.40c 3.528 1.7980 Av.Wt Gain at Wk8 61.53a 43.93b 23.63c 1.368 0.6970 Av.Wt at Wk9 683.98a 573.18b 429.07c 4.288 2.1860 Av.Wt Gain at Wk9 68.20a 52.53b 23.73c 1.279 0.6520 Av.Wt at Wk10 761.20a 643.93b 468.58c 4.219 2.1500 Av.Wt Gain at Wk10 81.53a 71.00b 38.33c 1.362 0.6940 Av.Wt at Wk11 861.67a 731.00b 515.93c 4.328 2.2060 Av.Wt Gain at Wk11 100.53a 87.00b 47.80c 1.447 0.7380 Av.Wt at Wk12 971.90a 822.20b 578.90c 5.640 2.8800 Av.Wt Gain at Wk12 110.20a 91.07b 57.20c 1.411 0.7190 Av.Wt at Wk13 1092.30a 926.70b 644.70c 5.110 2.6000 Av.Wt Gain at Wk13 118.13a 105.47b 73.87c 1.724 0.8790 Av.Wt at Wk14 1221.80a 1037.70b 729.50c 5.540 2.8300 Av.Wt Gain at Wk14 130.47a 110.80b 85.73c 1.160 0.5910
a – c Means different superscripts are significantly different (P<0.05); LSD=Least Significant Difference; SEM=Standard Error of the Mean; Av=Average
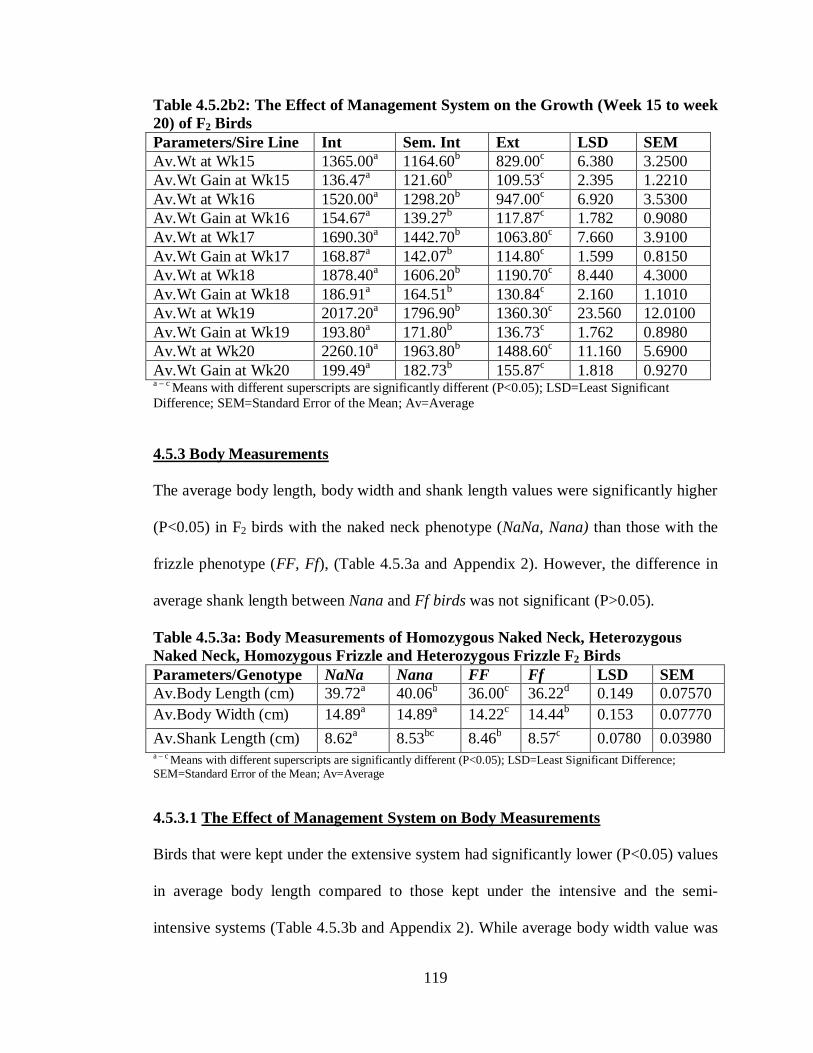
119
Table 4.5.2b2: The Effect of Management System on the Growth (Week 15 to week 20) of F2 Birds Parameters/Sire Line Int Sem. Int Ext LSD SEM Av.Wt at Wk15 1365.00a 1164.60b 829.00c 6.380 3.2500 Av.Wt Gain at Wk15 136.47a 121.60b 109.53c 2.395 1.2210 Av.Wt at Wk16 1520.00a 1298.20b 947.00c 6.920 3.5300 Av.Wt Gain at Wk16 154.67a 139.27b 117.87c 1.782 0.9080 Av.Wt at Wk17 1690.30a 1442.70b 1063.80c 7.660 3.9100 Av.Wt Gain at Wk17 168.87a 142.07b 114.80c 1.599 0.8150 Av.Wt at Wk18 1878.40a 1606.20b 1190.70c 8.440 4.3000 Av.Wt Gain at Wk18 186.91a 164.51b 130.84c 2.160 1.1010 Av.Wt at Wk19 2017.20a 1796.90b 1360.30c 23.560 12.0100 Av.Wt Gain at Wk19 193.80a 171.80b 136.73c 1.762 0.8980 Av.Wt at Wk20 2260.10a 1963.80b 1488.60c 11.160 5.6900 Av.Wt Gain at Wk20 199.49a 182.73b 155.87c 1.818 0.9270 a – c Means with different superscripts are significantly different (P<0.05); LSD=Least Significant Difference; SEM=Standard Error of the Mean; Av=Average 4.5.3 Body Measurements The average body length, body width and shank length values were significantly higher
(P<0.05) in F2 birds with the naked neck phenotype (NaNa, Nana) than those with the
frizzle phenotype (FF, Ff), (Table 4.5.3a and Appendix 2). However, the difference in
average shank length between Nana and Ff birds was not significant (P>0.05).
Table 4.5.3a: Body Measurements of Homozygous Naked Neck, Heterozygous Naked Neck, Homozygous Frizzle and Heterozygous Frizzle F2 Birds Parameters/Genotype NaNa Nana FF Ff LSD SEM Av.Body Length (cm) 39.72a 40.06b 36.00c 36.22d 0.149 0.07570 Av.Body Width (cm) 14.89a 14.89a 14.22c 14.44b 0.153 0.07770 Av.Shank Length (cm) 8.62a 8.53bc 8.46b 8.57c 0.0780 0.03980 a – c Means with different superscripts are significantly different (P<0.05); LSD=Least Significant Difference; SEM=Standard Error of the Mean; Av=Average 4.5.3.1 The Effect of Management System on Body Measurements
Birds that were kept under the extensive system had significantly lower (P<0.05) values
in average body length compared to those kept under the intensive and the semi-
intensive systems (Table 4.5.3b and Appendix 2). While average body width value was

120
significantly higher (P<0.05) in birds that were kept under the intensive system than
those raised under semi-intensive which had significantly higher (P<0.05) average body
width value than those reared under the extensive systems. Shank length did not differ
significantly (P>0.05) among birds that were kept under the three management systems
(Table 4.5.3b and Appendix 2).
Table 4.5.3b: The Effect of Management System on Body Measurements of F2 Birds Parameters/M. System Int Semi-Int Ext LSD SEM Av.Body Length (cm) 37.83a 37.93a 37.07b 0.115 0.05860 Av.Body Width (cm) 14.90a 14.67b 14.20c 0.118 0.06020 Av.Shank Length (cm) 8.54 8.48 8.48 0.0604 0.03080 a – c Means with different at 5% level of significance; MS=Management System; INT=Intensive; EXT= Extensive; LSD=Least Significant Difference 4.5.4 Egg Laying Performance Layers showing the naked neck phenotype (NaNa, Nana) had significantly (P<0.05)
better values in average number of eggs per clutch, egg size, egg size to body weight
ratio, hen-housed rate of lay and hen-day rate of lay compared to those with the frizzle
phenotype (FF, Ff); however, the difference in egg size to body weight ratio was not
significant (P>0.05) between Nana and Ff layers (Table 4.5.4a and Appendix 2).
Phenotypes (Naked necks & Frizzles) of the F2 birds did not affect average age at first
egg significantly (P>0.05), (Table 4.5.4a and Appendix 2).
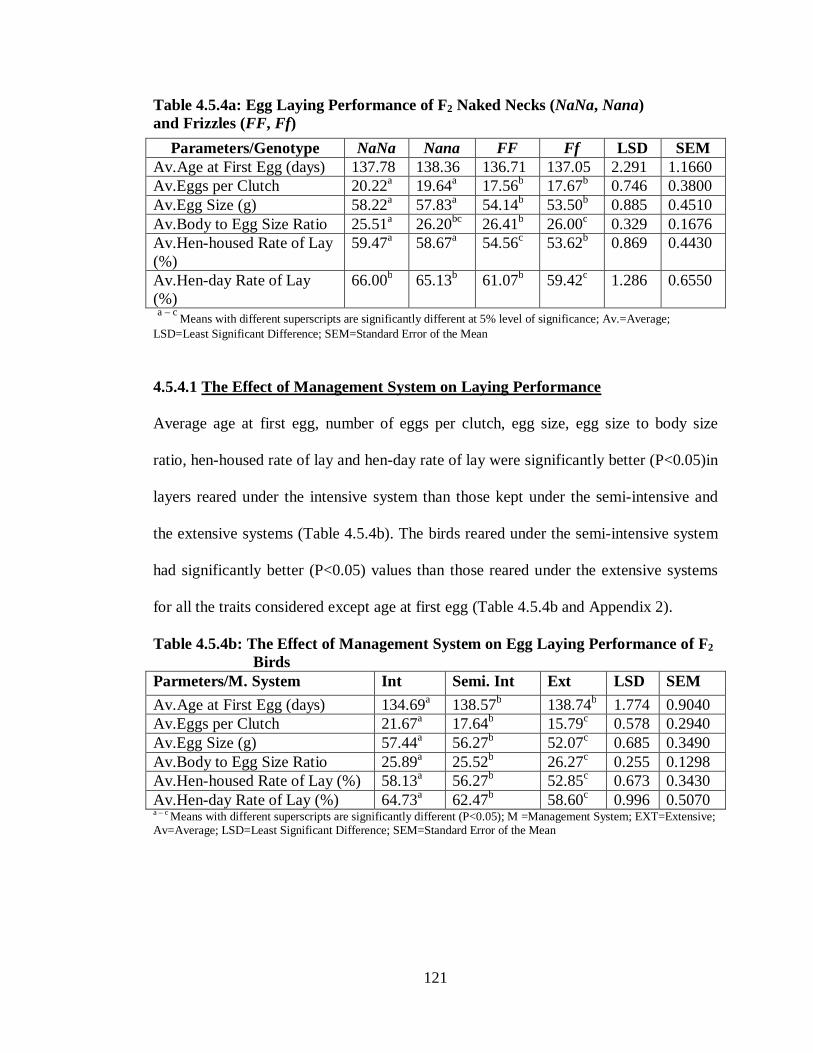
121
Table 4.5.4a: Egg Laying Performance of F2 Naked Necks (NaNa, Nana) and Frizzles (FF, Ff)
a – c Means with different superscripts are significantly different at 5% level of significance; Av.=Average; LSD=Least Significant Difference; SEM=Standard Error of the Mean 4.5.4.1 The Effect of Management System on Laying Performance Average age at first egg, number of eggs per clutch, egg size, egg size to body size
ratio, hen-housed rate of lay and hen-day rate of lay were significantly better (P<0.05)in
layers reared under the intensive system than those kept under the semi-intensive and
the extensive systems (Table 4.5.4b). The birds reared under the semi-intensive system
had significantly better (P<0.05) values than those reared under the extensive systems
for all the traits considered except age at first egg (Table 4.5.4b and Appendix 2).
Table 4.5.4b: The Effect of Management System on Egg Laying Performance of F2 Birds Parmeters/M. System Int Semi. Int Ext LSD SEM Av.Age at First Egg (days) 134.69a 138.57b 138.74b 1.774 0.9040 Av.Eggs per Clutch 21.67a 17.64b 15.79c 0.578 0.2940 Av.Egg Size (g) 57.44a 56.27b 52.07c 0.685 0.3490 Av.Body to Egg Size Ratio 25.89a 25.52b 26.27c 0.255 0.1298 Av.Hen-housed Rate of Lay (%) 58.13a 56.27b 52.85c 0.673 0.3430 Av.Hen-day Rate of Lay (%) 64.73a 62.47b 58.60c 0.996 0.5070 a – c Means with different superscripts are significantly different (P<0.05); M =Management System; EXT=Extensive; Av=Average; LSD=Least Significant Difference; SEM=Standard Error of the Mean
Parameters/Genotype NaNa Nana FF Ff LSD SEM Av.Age at First Egg (days) 137.78 138.36 136.71 137.05 2.291 1.1660 Av.Eggs per Clutch 20.22a 19.64a 17.56b 17.67b 0.746 0.3800 Av.Egg Size (g) 58.22a 57.83a 54.14b 53.50b 0.885 0.4510 Av.Body to Egg Size Ratio 25.51a 26.20bc 26.41b 26.00c 0.329 0.1676 Av.Hen-housed Rate of Lay (%)
59.47a 58.67a 54.56c 53.62b 0.869 0.4430
Av.Hen-day Rate of Lay (%)
66.00b 65.13b 61.07b 59.42c 1.286 0.6550

122
4.5.5 Egg Quality Parameters Average values for albumen height, Haugh unit, shell thickness, yolk height, yolk
diameter and yolk colour score were significantly higher (P<0.05) in eggs from the
layers of the F2 Naked necks (NaNa, Nana) compared to eggs from those showing the
frizzle phenotype (FF, Ff), (Table 4.5.5a and Appendix 2).
Table 4.5.5a: Comparison of Some Egg Quality Parameters of F2 Naked Necks (NaNa, Nana) and Frizzles (FF, Ff) Parameters/Genotype NaNa Nana FF Ff LSD SEM Av.Albumen Height (mm) 7.21a 7.19a 6.95b 6.88b 0.0974 0.04960 Av.Haugh Unit (%) 83.67a 82.53b 79.33c 78.20d 0.5902 0.3006 Av.Shell Thickness (mm) 0.37a 0.37a 0.32b 0.32b 0.00339 0.001726 Av.Yolk Height (mm) 17.29a 17.49b 16.37c 15.45d 0.175 0.08920 Av.Yolk Diameter (mm) 40.67a 39.69b 38.62c 39.04d 0.302 0.1537 Av.Yolk Colour Score 7.60a 6.93b 6.22c 5.59c 0.301 0.1533 a – c Means with different superscripts are significantly different (P<0.05); Av=Average; LSD=Least Significant Difference; SEM=Standard Error of the Mean 4.5.5.1 The Effect of Management System on Some Egg Quality Parameters Eggs from layers reared under the intensive system had significantly higher (P<0.05)
values in albumen height, Haugh Unit and yolk height than eggs from those reared
under the extensive system whose eggs had significantly (P<0.05) higher average values
in the traits mentioned compared to eggs from layers raised under the semi-intensive
system except Haugh unit (Table 4.5.5b and Appendix 2). Average value for yolk
colour score was significantly (P<0.05) higher in eggs from layers that were reared
under the extensive system than eggs from those kept under the semi-intensive system
whose eggs were significantly (P<0.05) better than eggs from layers reared under the
intensive system (Table 4.5.5b and Appendix 2). Average values for yolk diameter and
shell thickness did not differ significantly (P>0.05) between eggs from layers that were
kept under the three management systems.

123
Table 4.5.5b: Effect of Management System on Egg Quality Parameters of F2 Birds Parameters/M. Systems Int. Semi Int. Ext. LSD SEM
Av.Albumen Height (mm) 7.20a 6.85b 7.04c 0.0754 0.03840 Av.Haugh Unit (%) 82.00a 80.07 80.09 0.457 0.2328 Av.Shell Thickness (mm) 0.34 0.34 0.34 0.00263 0.001337 Av.Yolk Height (mm) 16.57a 16.19b 16.42c 0.136 0.06910 Av.Yolk Diameter (mm) 39.40 39.13 39.29 0.234 0.1190 Av.Yolk Colour Score 5.60a 6.46b 7.74c 0.233 0.1188 a – c Means with different superscripts are significantly different (P<0.05) ;M=Management; INT=Intensive; EXT=Extensive Av=Average; LSD=Least Significant Difference; SEM=Standard Error of the Mean
4.5.6 Some Carcass Parameters The naked necks (NaNa, Nana) had significantly (P<0.05) higher average values for
defeathered weight, dressed weight, thigh and drumstick weight, breast muscle weight
and weight of wings than the frizzles (FF, Ff), (Table 4.5.6a and Appendix 2). Average
values for weight of intestines, gizzard weight, heart weight and liver weight were
significantly (P<0.05) higher in birds with the frizzle phenotype (FF, Ff) compared to
those showing the naked neck phenotype (NaNa, Nana); however, average weight of
intestines was not significantly (P>0.05) different between NaNa birds and the frizzles
(FF, Ff), (Table 4.5.6a).
Table 4.5.6a: Some Carcass Parameters of F2 Naked Neck (NaNa, Nana) and Frizzle (FF, Ff) Birds Parameters/Genotype NaNa Nana FF Ff LSD SEM Av. Defeathered Wt (%) 96.83a 95.26b 92.32b 91.21b 0.1221 0.0622 Av. Dressed Wt (%) 81.99a 80.16b 74.33c 72.58d 0.3762 0.1916 Av. Thigh and Drumstick Wt (%) 25.65a 26.15b 26.15b 25.72c 0.2266 0.1154 Av. Breast Muscle Wt (%) 19.24a 18.69b 14.82c 14.33d 0.1553 0.0791 Av. Wings Wt (%) 10.16a 10.06b 9.99c 9.97c 0.0901 0.0459 Av. Intestines Wt (%) 4.33a 4.22b 4.36a 4.35a 0.0854 0.0435 Av. Gizzard Wt (%) 3.56a 3.72b 4.36c 4.49d 0.0684 0.0348 Av. Heart Wt (%) 1.33a 1.39b 1.62 1.65 0.0340 0.01733 Av. Liver Wt (%) 1.61a 1.68b 1.97c 2.03d 0.0441 0.02247 a – d Means with different superscripts are significantly different (P<0.05); LSD=Least Significant Difference; SEM=Standard Error of the Mean; Av=Average

124
4.5.6.1 The Effect of Management System on Some Carcass Parameters of F2 Birds Average values of defeathered weight, eviscerated weight, dressed weight, and thigh
and drumstick weight were significantly higher (P<0.05) in birds that were reared under
the intensive system than those kept under the semi-intensive system which were
significantly better (P<0.05) in all the traits listed than those reared under the extensive
system (Table 4.5.6b). Average weight of intestines, gizzard and heart values were
significantly higher (P<0.05) in birds that were reared under the semi-intensive system
than those reared under the extensive and intensive systems; also, birds raised under the
extensive system were significantly better (P<0.05) than those reared under the
intensive system in all the traits just mentioned except average weight of gizzard
(P>0.05), (Table 4.5.6b and Appendix 2). Average values for breast muscle weight and
weight of wings did not differ significantly (P>0.05) between birds that were raised
under the three management systems (Table 4.5.6b and Appendix 2).
Table 4.5.6b: Effect of Management System on Carcass Parameters of F2 Birds Parameters/M. System Int Semi. Int Ext LSD SEM Av.Live Weight (kg) 2.29a 1.97b 1.43c 0.0208 0.01059 Av.Defeathered Wt (%) 93.75a 93.25b 91.83c 0.0946 0.04820 Av.Eviscerated Wt (%) 86.74a 85.61b 85.17c 0.1707 0.08690 Av.Dressed Wt (%) 78.12a 76.79b 72.68c 0.2914 0.14840 Av.Thigh and Drumstick Wt (%)
26.32a 25.92a 25.29c 0.1755 0.08940
Av.Breast Muscle Wt (%) 16.35 16.27 16.36 0.1203 0.06130 Av.Wings Wt (%) 10.01 10.02 10.05 0.0698 0.03560 Av.Intestines Wt (%) 4.23a 4.46b 4.31c 0.0661 0.03370 Av.Gizzard Wt (%) 3.95b 4.12a 3.98b 0.0530 0.02700 Av.Heart Wt (%) 1.30a 1.53b 1.49c 0.0264 0.01343 Av.Liver Wt (%) 1.69a 1.86b 1.86b 0.0342 0.01741 a – c Means with different superscripts are significantly different (P<0.05); M= Management ; INT=Intensive System; EXT=Extensive System; Av=Average; LSD=Least Significant Difference; SEM=Standard Error of the Mean

125
4.5.7 Mortality (Effects of Genotype and Management system) Mortality was significantly lower (P<0.05) in birds with NaNa & Nana genotypes than
in those with FF& Ff genotypes (Table 4.5.7 and Appendix 2). Birds reared under the
extensive system had significantly higher (P<0.05) mortality rates than those reared
under intensive and semi-intensive systems (Table 4.5.7 and Appendix 2).
Table 4.5.7: The Effects of Genotype and Management System on Mortality of F2 Birds Parameter/ Genotype NaNa Nana FF Ff LSD SEM Mortality (%) 6.89a 6.22b 10.44c 11.44d 0.558 0.2841 Parameters/M. Systems Int. S. Int. Ext. LSD SEM Mortality (%) 7.87b 7.89b 12.73a 0.432 0.2201 a – d Means with different superscripts are significantly different (P<0.05); LSD= Least Significant Difference; SEM= Standard Error of the Mean; M = Management; Int. = Intensive; S. Int. = Semi-Intensive; Ext. = Extensive; 4.5.8 Economics of Production Annual income received from the sale of birds and eggs as well as the annual profit
made were higher in the naked necks (NaNa, Nana) than in frizzles (FF, Ff) and
normals (nana/ff), (Table 4.5.8a, Fig. 4.5.4 and Appendix 2). However, birds showing
the frizzle phenotypes (FF, Ff) had higher average values in the traits listed than the
normal feathered (nana/ff) ones (Table 4.5.8a, Fig. 4.5.4 and Appendix 2). Annual cost
of production was similar in the three phenotypes.
Table 4.5.8a: Economics of Production of NaNa, Nana, FF, Ff and nana/ff F2 Birds
P’TERS = Parameters; G’TYPE=Genotype; Av=Average; LSD= Least Significant Difference; SEM=Standard Error of the Mean
Parameters/Genotype NaNa Nana FF Ff nana/ff Av.Cost of Feeding (GH¢) 413.37 413.37 413.37 413.40 413.37 Av.Income (GH¢) 1021.85 1011.70 910.33 907.58 903.55 Av.Profit (GH¢) 608.52 598.40 496.96 494.22 490.19

126
4.5.8.1 The Effect of Management System on Economics of Production Average amount for annual cost of production and annual income received from the
sale of birds and eggs were higher in birds reared under the intensive system than in
those raised under the semi-ntensive and extensive systems (Table 4.5.8b, Fig 4.5.5 and
Appendix 2). However, producing the birds under the semi-intensive system resulted in
higher average amounts in the traits just mentioned than those reared under the
extensive system. The average amount for annual profit made was higher in birds kept
under the semi-intensive system compared to those reared under the extensive system
whose average performance in this parameter was better than birds kept under the
intensive system (Table 4.5.8b, Fig. 4.5.5 and Appendix 2).
0
100
200
300
400
500
600
700
NaNa Nana FF Ff nana/ff
Annual Profit (Ghana Cedi)
F2 BirdsFig.4.5.3: A Bar Showing the Annual Profit Made from Rearing Five Different
F2 Genotypes (NaNa, Nana, FF, Ff, nana/ff)

127
Table 4.5.8b: The Effect of Management System on Economics of Production of F2 Birds Parameters/ M. System Int Semi. Int Ext Av. Cost of Feedin (GH¢) 718.88 333.58 187.66 Av. Income (GH¢) 1156.49 1060.16 636.36 Av. Profit (GH¢) 437.59 726.60 448.80 MS= Management System; INT=Intensive; EXT=Extensive; LSD=Least Significant Difference; SEM=Standard Error of the Mean
0
100
200
300
400
500
600
700
800
Intensive Semi-Int. Extensive
Annual Profit (Ghana Cedi)
Management Systems
Fig.4.5.4: A Bar Chart Showing the Annual Profit Made from Rearing F2 Chickens Under Intensive, Semi-intensive and Extensive Systems

128
CHAPTER FIVE
5.0 DISCUSSION
5.1 STUDY ONE
5.1.1 Number of Years in Local Chicken Production
The average number of years that the villagers in the Ashanti region of Ghana have
been in local chicken production (Table 4.1.1) was affected by the wiping out of an
entire flock by Newcastle disease during some harmattan periods; which made keepers
sometimes lose their entire flock and might have to restart production. When this
happens, the villagers had to wait until they obtain new pullet(s) either through purchase
or from relatives and friends, to restart production of local birds. During the survey,
most of the villagers gave the ages of their new beginnings in local chicken production.
The keeping of indigenous local fowls has long been part of the life of Ghanaian village
dwellers.
5.1.2 Management
5.1.2.1 Flock Size
Even though 92% of the respondents stated that they have had flock sizes larger than
fifty birds before, the average flock size was low during the survey as can be seen from
the results (Table 4.1.1). This might have been due to the fact that the survey was
conducted in the months of December and January; because according to Gondwe et al.
(2005) the major constraint to the production of local chickens in Africa are outbreaks
of Newcastle disease among chickens in the months of September to December every
year. This can lead to about 60 to 70 percent mortality of the entire flock (FAO, 2002).

129
According to 50% of the keeper they lost greater percentages of their flock before they
were interviewed. The villagers have the pattern of replenishing their flock by using
virtually all eggs for reproduction. It seems impossible to have a stable flock size in
local chicken production since the cycle of losing a high percentage of the flock every
year, either through predators or Newcastle disease, continues unabated. According to
FAO (1998) with four to five reproductive cycles per year, only about nine replacement
pullets may be obtained. This trend, according to the keepers is what sometimes makes
local chicken production unprofitable.
5.1.2.2 Management System
The extensive system, under which the birds scavenge for their own feed, used by the
local chicken keepers in Ghana is similar to the system common in other countries. It
has been indicated that free-ranging local chickens are known for their ability to survive
under various types of shelter, including makeshift chicken houses, kitchens and even
roosting on trees (Andrews, 1990; Musharaf, 1990; Yongolo, 1996). Atunbi and
Sonaiya (1994) found that it was common for local birds to be reared without provision
of housing or shelter and indicated that where housing was provided to village chickens,
the houses were made with locally available materials such as wood, mud bricks,
sugarcane stems, bamboo and cereal stovers, and concluded that cane cages were
cheaper than wooden cages. It was observed that those who provided shelter for their
flock were able to maintain a higher flock size than those who did not since their birds
were protected from predators especially thieves and hawks. Mburu and Ondwasi
130
(2005) stated that proper chicken housing should keep birds, especially young chickens,
secure from wild animals, hawks, and theft.
Birds scavenge on a variety of feed if allowed to move freely, these include green
leaves, worms, insects, termites and kitchen leftovers (fruit and vegetable waste, cereal
grains and by-products, fishmeal, tubers and roots, brewers waste). It is therefore true
that the scavenging feed resource base depends on the household food status as stated
by Gondwe and Wollny (2005).
5.1.2.3 Types of Feed Supplements
Most of these chicken keepers eke out a living and will hardly use their meager earnings
to buy feed supplements. The majority of them gave whole maize because they are
farmers who cultivate maize every year and therefore used some of the harvested maize
as a supplement for the birds. Those who used maize bran obtain it either from their
own houses, relatives, neighbours, or corn millers. The maize bran is a by- product of
some local dishes prepared from maize such as “nkyekyerawa”, “obrayo”, etc. A small
minority (10.37% of the respondents) will pay a token amount to corn mill operators for
the milling leftovers. They will then collect dry fish waste from sellers, mill it and mix
it with the milling waste. This supplement is more nutritious than the first two
mentioned. About one- third of those interviewed do not give any supplement at all.
Apparently, giving feed supplements to local birds enhances production. Gondwe and
Wollny (2005) found that feeding management contributes to about 30% of their growth
potential and added that growth of local chickens can be enhanced through improved
management under free-ranging conditions. It was observed during the survey that birds

131
given daily feed supplement always stayed inside or around the house instead of going
far away or into the bushes to be either knocked by a vehicle, stolen, or killed by a wild
animal. This confirms the findings of Mburu and Ondwasi (2005) that local chickens
perform very well when extra feed, proper housing and disease-free environment are
provided.
5.1.2.4 Health of Birds
5.1.2.4.1 Survivability of Chicks and Total Mortality
As can be seen from Table 4.1.1, 50% of chicks under local chicken production do not
survive to the grower stage. According to the chicken keepers, disease is not the main
cause of chick mortality among indigenous local birds but rather predators and
accidents. Hawks, crows and snakes were mentioned as the main predators that prey on
the chicks. Since local birds mix with people either in the kitchen or on the compound,
people sometimes mistakenly step on the chicks and kill them. Hardy hens with good
mothering abilities are sometimes able to protect their chicks from hawks and crows by
giving them cover when they sense their presence. Birds that are given supplements
everyday do not go into the bush and therefore are protected from snakes and other wild
animals. Chicks that stay in coops are not easily seen by hawks and crows and are
therefore better protected than those that roam outside. It seems obvious that with good
management, chick mortality could be reduced markedly.
Growers and matured birds can be attacked by predators and also die of accidents;
however, the main cause of their mortalities is the Newcastle disease, especially during

132
the harmattan season. As can be noted from Table 4.1.1, it can kill about 65% of the
flock and in some cases it wipes-off the entire flock. According to Gondwe et al.
(2005), the outbreaks of Newcastle disease among local chickens in Africa in the
months of September to December every year is one of the major constraints to the
production of local chickens. The keepers testified that the outbreak of Newcastle
disease was intense between the months of September to January every year. Chaheuf
(1990) described Newcastle disease as the most devastating disease of village chickens
in Africa. Even though through many years of exposure to poultry diseases, local birds
have been able to develop resistance to various diseases of poultry, they hardly survive
the attack of Newcastle disease during the months of September to January.
5.1.2.4.2 Disease Control
It is not clear how the chicken keepers got to know the efficacy of tetracycline and
vitamin B-complex in treating poultry diseases, and yet almost all the respondents
(92%) were aware of their usage and had one time or another made use of them in
treating diseases. It is imperative that veterinarians look into the efficacy and safety of
using these drugs in controlling poultry diseases. However, according to the chicken
keepers these orthodox drugs had been efficient in curing diseases in most cases. The
traditional medicines are also sometimes able to control certain diseases. For instance,
pawpaw leaves can effectively control worms according to the chicken keepers. Local
birds are easily infected with a number of worms because of their scavenging nature.
Studies by Tona (1995) in some African countries revealed that worm species such as
Ascaridia galli, Prosthogonium spp., Strongyloids avium, Heterakis gallinarum,

133
Raillietina spp, Davainea progglottina, Tetrameres Americana, and species of
Trichuridae were common in village chickens. Therefore the keepers’ assertion that
pawpaw leaves can serve as a dewormer may be true.
5.1.3 Performance
5.1.3.1 Weight of Birds and Eggs
The results show that the weights of local birds and their eggs are generally low. These
results confirm the characteristics of local birds given by the FAO (1998). The average
weights of cocks and hens in this survey were similar to what have been found in other
African countries. Wilson et al. (1987) reported average weights of 1.6 and 1.02 kg for
local cocks and hens respectively in Mali. However, the finding of Minga et al. (1989)
in the United Republic of Tanzania was different from that obtained in this study, they
found average weights of cocks and hens to be 1.2 kg and 2.2 kg respectively due to
high deposit of abdominal fat in the hens. The egg weight obtained in this study was
also similar to what have been reported in other African countries such as Ethiopia, 40-
49g (Shanawany and Banerjee, 1991); Burkina Faso, 30- 40g (Bourzat and Saunders,
1990); United Republic of Tanzania, 41g (Minga et al, 1989) and Sudan, 40.6g
﴾Wilson,1979﴿. The average weight of 34.6g obtained in Mali (Wilson et al., 1987) is
lower than that obtained in this study. The average chick weight was low (35g) and this
may be due to the smaller eggs laid by the local birds.
Local birds have lower genetic potential and also have low feed conversion efficiency.
However, their small sizes is partly due to inadequate availability of balanced feed,
since in most cases the birds are allowed to scavenge without giving any nutritionally

134
balanced feed supplement. According to Gondwe and Wollny (2005) the growth
potential of local chickens is not fully exploited under free-range (scavenging)
conditions due to inadequate feeds. Mwalusanya et al. (2002) reported that apart from
genetics the low productivity of local chickens was due to the prevailing poor
management practices particularly, lack of proper health care, poor nutrition and
housing. Due to their smaller sizes, local birds have low nutritional maintenance
requirement. This is a survival strategy under the scavenging free- range conditions. As
stated in one FAO (2000) report, it is difficult to imagine birds better adapted for
survival under scavenging free-range conditions than the breeds that have evolved
under the very same conditions, and are still surviving as proof of their ability to do so.
This survival ability of local birds, under scavenging free-range conditions, is what
makes it possible for rural smallholders, landless farmers and industrial labourers to
keep them.
5.1.3.2 Number of Layers and their Performance
The number of layers accounts 50% of the entire flock excluding the chicks, and the
remaining 50% is made up of pullets, cockerels and cocks. This is because layers are
hardly sold as compared to cocks, and their mortality is quite low as compared to
chicks, pullets and cockerels. The clutch size of 2 to 3 found in this survey was similar
to the 2.5 clutch size found earlier by van Veluw (1987) and also closer to the values of
2.1 and 2.7-3.0 reported in other African countries (Wilson et al.,1987; Bourzat and
Saunders, 1990). It was however different from the 4.5 clutch size reported in Sudan by
Wilson (1979).

135
Van Veluw (1987) found average eggs per clutch of 10, which was close to the range 9-
13 found in this survey. Values of 12-18 (Bourzat and Saunders, 1990), 6-20 (Minga
et.al., 1989), 8.8 (Wilson et al., 1987), and 10.87 (Wilson, 1979) have been reported in
Burkina Faso, Tanzania, Mali and Sunda respectively, which were also not too different
from what was reported in this survey. The lower number of clutches per year and eggs
per clutch, which resulted in fewer eggs per year, was due to broodiness associated with
local hens. This results in lengthening of the reproductive cycle. According to Horst
(1999), the egg brooding (incubation) and chick rearing activity increases the length of
the reproductive cycle by 58 days to about 74 days in total. This means that local birds
use a whole year less 17 days to complete two laying cycles, and in each of these
cycles, a local hen will rarely lay more than 15 eggs.
The average hatchability of 77% observed in this study is close to the 72% reported
earlier by van Veluw (1987) to be the hatchability of local eggs in Ghana. Similar
values have been reported in Burkina Faso, Tanzania, Mali and Sunda: 60-90%
(Bourzat and Saunders, 1990), 50-100% (Minga et al., 1989), 69.1% (Wilson et al.,
1987) and 90% (Wilson, 1979) respectively. However, the 39- 42% hatchability
reported in Ethiopia by Shanawany and Banerjee (1991) was far lower than what was
realized in this study. The high percentage of hatchability among the local birds may be
due to the fact that, the hen does the incubation of eggs naturally. It knows by instinct
when to provide the right temperature for its eggs by sitting-on and turning the eggs
with the beak. Turning of eggs and provision of required humidity (60-80%) by
splashing water on the eggs via her beak, for the developing embryo are done perfectly

136
by the broody hen than any man-made incubator. Broody hens that are large so as to
cover all the eggs set and keep them warm enhance natural incubation; according to
FAO (2000), hatchability declines with more than ten eggs depending on the size of the
hen. Under favourable conditions, the broody hen hatches all fertile eggs. However,
according to FAO (2000) a hatchability of 80 percent (of eggs set) from natural
incubation is normal, but a range of 75 to 80 percent is considered satisfactory.
5.1.3.3 Economics of Production
Apart from feed supplementation, other costs of production came from purchasing of
pharmaceutical products such as tetracycline (anti- biotic) and B-complex (vitamin).
Prices of cocks and hens were not fixed but dependent on some factors such as age,
size, season, location of the village (distance from the city or the main road leading to
the city), colour and the phenotype of bird. For instance, two birds may be of the same
size but villagers do not appreciate tender chicken meat and therefore if the difference
in age is wide, the older one may be sold at a higher price. Body size was the main
factor in determining the price of local chickens. Females are not normally sold but if it
is done, the sex is not given any special preference most of the time and therefore size
(weight) still becomes the determining factor for pricing. During Christmas, Easter,
Ramadan, and Idl-Adhar birds are sold at higher prices since there is a high demand for
them and therefore the effect of demand-supply relationship on price comes in. Birds
are sold for higher prices in villages close to the city or along the main road leading to
the city because the birds are purchased by city dwellers who drive along the road or
visit the villlage. For example, within the Asante- Akim South district a bird may be

137
sold at three Ghana cedis (GH¢3.00) in a village called Nkwanta which is quite distant
from the city and the main road. This same bird may be sold for four Ghana cedis
(GH¢4.00) in Yawkwei, which is in between Konongo and Juaso, also relatively closer
to Kumasi, and along the Kumasi- Accra road. Birds with special plumage colours such
as all white and all black, and phenotypes such as naked neck and frizzle are sold at
higher prices since it is believed that one only looks for a bird with a special colour or
phenotype when it is needed for rituals.
A fresh egg was sold for ten Ghana pesewas (GHp10) or three for twenty Ghana
pesewas (GHp 20.00). After selecting enough eggs for natural incubation, the keeper
has the option of using the surplus eggs to supplement his diets, or sell for petty cash.
Local eggs are either sold in the market during market days, or within the keeper’s
neighbourhood. The price of a local egg during the survey was somewhat the same as
that of a commercial egg (GHp 10), even though the latter is far bigger than the former.
This is because the villagers believe that eggs from local chickens are more nutritious,
tasty and appealing (yellow yolk) than commercial eggs.
The results show that most chicken keepers get very little monetary profit from their
business. This is partly due to the reason that almost all the villagers interviewed hardly
sell their birds. According to them, there are two main reasons that sometimes impel
them to sell their birds: 1) when they are in urgent need of money and there is no
alternative; and 2) if the flock size is too large to maintain (>30 birds). To most of the
respondents, the main reason for keeping local birds is to use the meat and surplus eggs

138
as an animal protein source for the family. This confirms an earlier finding in Ghana by
van Veluw (1987); he reported that the main function of village chickens from the
farmer's perspective is the provision of meat and eggs for home consumption. It seems
that the only way keepers of local chickens can make reasonable monetary gains is the
availability of crossbred birds (exotic × local) with improved meat and egg production
potentials. In this way what the villagers will get from the crossbred birds in terms of
meat and eggs will be too much to be consumed by the family alone and will therefore
be compelled to sell the surplus meat and eggs for money.
5.1.4 Reasons for Keeping Birds
The study revealed that the main reason for keeping local birds is for home
consumption and this confirmed an earlier report within Ghana by van Veluw (1987).
Higher consumption of chicken meat and eggs occurred during celebrations such as
Christmas, New year, Easter, Ramadan, Idl-Adhar, birth days, etc. As one keeper
narrated, smiles come upon the faces of all the family members in anticipation of that
special dinner, if not for anything they will soon enjoy a tasty soup with ‘fufu’ and meet
their daily animal protein requirement for once. According to FAO (1997), chicken
meat and egg contain 19% and 12.1% of protein respectively and contain appreciable
amounts of energy, vitamins and minerals. In South Africa, resource-poor households
with small poultry production units of 12 laying hens per unit have higher levels of
consumption of animal protein and reduced incidence of malnutrition (MacGregor and
Abrams, 1996). It is therefore envisaged that if the local birds are improved in terms of
139
meat and egg production, the malnutrition situation in the country will be reduced
drastically if not eliminated.
Chicken keepers sometimes receive income from selling birds and surplus eggs. This is
normally done during festive occasions when the number of cocks are more than what
the family will need for the festival or when they need to pay a debt or do something
that requires money urgently or when some one is in need of a particular colour, age, or
phenotype of chicken in the flock for rituals. Most of the chicken keepers were poor and
could not buy enough meat to prepare a dinner for an important guest but having
chickens in the house makes it possible to honour the guest with a delicious dinner.
Guests who cannot enjoy dinner with them due to some circumstances are given live
birds as gifts. Indigenous beliefs are common in the villages of Ghana and the villagers
often use local birds for rituals when necessary. Obviously, they find it more convenient
when they have the particular kind of bird needed for the ritual in their own flock. Some
of the villagers keep birds because seeing them and admiring their feather colour and
nature make them happy. One percent (1%) of the respondents were of the opinion that
local birds have a special way of alerting people when a dangerous animal like a snake
comes into the house. According to them the birds do this by crowing, panting, and
running away from where the danger is; to them this is enough reason to always have
birds in the house.

140
5.1.5 Challenges in Local Chicken Production and their Suggested Solutions 5.1.5.1 Challenges According to the respondents, predators such as crows, hawks, fox and snakes prey on
the chicks and therefore only about one- third or less of chicks hatched are able to
survive to the matured stage. Newcastle disease attacks the birds at all stages and very
severely during the harmattan season, within which an entire flock can be wiped-out.
Various studies on local chicken production within the country and other African
countries have reported these problems (van Veluw, 1987; Chabeuf, 1990; FAO, 1998;
Awuni, 2002; Gondwe et. al., 2005). The major constraints to the production of local
chickens are outbreaks of Newcastle disease among chickens in the months of
September to December every year, predators that feed on chickens, poor housing and
prolonged weaning periods for chickens (Gondwe et al., 2005).
Abdelqader et al. (2005) reported that in Cameroon, 40% of the flock of local birds
under local management system is dies before reaching 6 months of age, and mortality
from diseases, predators, parasites, and cold stress for chicks accounted for 49 %, 31.6
%, 10 %, and 9.4% of the total loss, respectively. They added that, the most frequent
outbreak of diseases, as perceived by the keepers, was in the order of severity:
Newcastle Disease (51 %), Infectious Bronchitis (21 %), Fowl Typhoid (18 %) and
other diseases (10 %). The main predators were foxes (25% of the cases), and wild cats
(11.5%). Wirsiy and Fonba (2005) observed that, under the Tanzanian local system of
producing chickens, disease outbreaks are common and often erase stocks of chicken
from an entire household. However, according to FAO (1998) malnutrition, infections,

141
predators, and accidents result in mortality rates of 60 to 70 percent during the rearing
stage. According to Abdelqader et al. (2005) the significant nutritional and economic
functions of local chicken production in rural communities are constrained markedly by
mortality due to diseases and predation and added that in Malaysia the mean annual
financial loss per flock due to mortality is 42 US dollars (Abdelqader et al., 2005).
According to the chicken keepers, having access to funds will enhance their production
since provision of feed supplement improves performance and proper housing protects
the birds from predators. New stock including sound males can also be purchased to
maintain or increase flock size and also solve the problem of low fertility that some of
them had. Some of these chicken keepers sometimes buy cockerels from commercial
poultry farms and put them under scavenging conditions and according to them the
performance of their offspring in terms of body weight, egg size, and number of eggs
laid are superior to those of the local breeds. They lamented that, sometimes, a local
cock not less than six months old is not able to prepare a sufficient dinner for a family
of six. This was similar to a report by INFPD (1999), which stated that the productivity
of local chickens is low with regard to egg production, egg weight, growth rate and
chick survival rate; chicken housing, feeding, and health care are below standard. The
assertion of the local chicken keepers therefore was that if the management problems
are solved, getting a hybrid with improved body weight, egg size, and number of eggs
laid will make the local chicken production more lucrative than it is now.

142
Those without problems argued that they do not spend any money on their birds and are
therefore satisfied with the little benefits they get.
5.1.5.2 Solutions
The various solutions suggested by the chicken keepers were not out of place since they
are in conformity with what other researchers have suggested or recommended. For
instance, Wirsiy and Fonba (2005) stated that vaccination of local fowls against major
poultry diseases like Newcastle, infectious bronchitis, gumboro, etc. can prevent these
losses. According to FAO (1998), if balanced feed, good health-care supplies and day-
old chicks of hybrid varieties are locally available, then managing local chickens
intensively is an option. It however cautioned that, if these things are not available,
raising local breeds under scavenging free-range systems would still be the best choice.
This is imperative since according to Mwalusanya et al. (2004) the low productivity of
local chickens is partly due to poor management practices, in particular the lack of
proper health care, poor nutrition and housing.
Njenga et al. (2005) stated that, one way of overcoming the challenges in local chicken
production was improving sustainable productivity through genetic selection and
development of suitable indigenous parent stock. The improvement of these poultry
should be in line with the existing rural conditions to avoid the likelihood of
maladjusted management. Selection over time may yield a stock that fits local
conditions. Rural poultry offers a wide range of genetic potential, as the local chickens

143
are genetically heterogeneous, offering a wide range of phenotypes and genotypes to
select from.
From the above suggestions for improving local chicken production, it is clear that all
the problems enumerated by the local farmers can be grouped into two: management
and genetics. As suggested by the local farmers, if these problems in local chicken
production are solved, it could be harnessed to augment poverty reduction strategies in
the country.
5.2 STUDY TWO 5.2.1 Percentages of Nana, Ff & nana/ff Birds in the Population of Local Birds
The results show that a high percentage of indigenous chickens are normal feathered
(78.33%) compared to naked neck (13.33%) and frizzles (8.33%) phenotypes. This
means that the naked neck and frizzle genes are present within the random-mated
indigenous chicken population but their combined frequency within the population is
low. Fayeye and Oketoyin (2006) had a much lower frequency for these phenotypes
(<0.1) when they characterized Fulani-ecotypes of chickens in Nigeria; while Nsoso et
al. (2003) had 8.41% of the naked neck phenotype within the local chicken population
in Botswana. These thermoregulatory genes are at the brink of extinction (Adesina,
2002; Ojo, 2002; Fayeye and Oketoyin, 2006) and this may have been caused partly by
random drift. However, non-genetic factors such as diseases, and religious and social
activities might have played a role in the lower frequencies of these phenotypes. For
instance, flocks of local birds are easily wiped-out by Newcastle disease and anyone
starting a new flock of birds will more likely use normal birds instead of these mutants

144
due to their low phenotypic frequencies within the population of local chickens. Naked
neck and frizzle birds are often used for rituals by traditionalist resulting in the
dwindling of their phenotypic frequencies. Socially, naked neck and frizzle birds are
normally stolen due to their uniqueness within the population of indigenous birds,
resulting in the reduction of these phenotypes.
5.2.2 Average Weights of Birds and Eggs
The average weight of chicks (0-5days) was significantly lower for the indigenous Nana
(naked neck) chicks compared to the Ff (frizzle) and nana/ff (normal feathered) chicks
due to the differences in the sizes of eggs. The hens from the various chicken
phenotypes that produced the eggs and consequently the chicks were not of the same
age, and since age and egg size, and also egg size and weight of day-old chicks are
positively correlated (Fairfull, 1990), the differences in chick weight (0-5days) among
indigenous chicken phenotypes (naked neck, frizzle and normal feathered) could shift to
any direction at any point in time.
The average weight of cocks did not differ significantly (P>0.05) among the three
indigenous chicken phenotypes (numerical values were higher in Nana birds than Ff &
nana/ff ones) while the average weight of Nana hens were significantly (P<0.05) higher
than those of Ff birds and this indicates that, even under scavenging conditions where
the birds scavenge for their own feed for growth and development, the naked neck
phenotype has an advantage over the frizzle and the normal feathered phenotypes. This
might have been due to the 20 to 40 percent less feather coverage in naked neck birds
which would considerably reduce the need for dietary nutrients to supply protein inputs

145
for feather production. It is imperative that the indigenous naked neck phenotype is
utilized in providing suitable birds for village chicken production since protein is a
limiting factor in many scavenging feed resource bases (FAO, 2002).
The observed matured body weights of indigenous naked neck (Nana), frizzle (Ff) and
normal feathered (nana/ff) chickens were similar to those reported in the few studies
that had compared available native chicken phenotypes. For instance, Desai et al.
(1961), Yoshimura et al. (1997) and Njenga (2005) compared the naked neck birds with
other native chicken phenotypes including frizzle and normal feathered birds and
concluded that the naked neck birds were heavier than the other native chickens.
However, Singh et al. (1996) and Mohammed et al. (2005) reported that all the
indigenous chicken phenotypes were similar in body weight.
5.2.3 Egg Laying Performance
The naked neck layers had significantly higher (P<0.05)values for egg weight, number
of eggs per clutch and number of eggs per bird per year than those of the frizzle and the
normal feathered layers because naked neck birds might have had a better ability to
thrive well under adverse environmental, poor housing, bad management and poor
nutritional conditions. It could also be due to the 20 to 40 percent reduction in feather
coverage which conserves more protein for egg production. Singh et al. (1996),
Yoshimura et al. (1997) and Njenga (2005) compared the performance of indigenous
chicken phenotypes including the naked neck, frizzle and normal feathered birds
reported that the naked neck birds were significantly superior to the other phenotypes in

146
terms of egg weight followed by the frizzle birds. Yoshimura et al. (1997) and Moreki
and Masupu (2003) concluded that among indigenous chickens the naked neck laid a
significantly higher (P<0.05) number of eggs (number of eggs per clutch and number of
eggs per bird per year) compared to the other phenotypes including frizzle and normal
feathered. Desai et al. (1961) found Nana birds to be superior to all other indigenous
phenotypes in terms of number of eggs per bird per year. However, in the studies of
Singh et al. (1996) and Mohammed et al. (2005) involving indigenous chicken
phenotypes (including naked neck, frizzle and normal feathered), annual egg
production, and hen-housed and hen-day egg production did not differ significantly
(P>0.05).
The absence of significant difference in the number of clutches of eggs per year among
the local chickens studied shows that the pause in egg laying of local birds caused by
broodiness which results from an increase in plasma prolactin hormone level, affects
various phenotypes within the population of indigenous birds in Ghana, in a similar
way.
Eggs from the indigenous frizzle birds had significantly (P<0.05) higher hatchability
values than eggs from naked neck birds as a result of the modification of their plumage
structure (curled feathers). Hachability under natural incubation is influenced to a large
extent by the hen’s ability to cover all the eggs-set. The frizzled feathers extend
outwards and away from the body and therefore as the hen sits on the eggs, the

147
protruding feathers give better cover to a larger number of eggs and thereby a higher
percentage of the eggs hatch sucessfully.
5.2.4 Egg Quality Performance
The superiority of the eggs from indigenous naked neck birds in albumen height and
Haugh unit over the eggs from their frizzle and normal feathered counterparts may be
due to the 20 to 40% reduction in plumage of naked neck birds, since this reserves
protein which would have been used for feather formation, for productive activities
such as the development of the egg albumen (Akhtar-Uz-Zaman, 2002). Additionally,
chickens do not have sweat glands and therefore lack the ability to regulate their body
temperature through sweating and are therefore stressed when the ambient temperature
is high. Apparently, stress in birds affects egg formation and therefore egg quality
parameters such as albumen height, Haugh unit, shell thickness, yolk height and yolk
diameter are adversely affected. The feather reduction in naked neck birds enhances
heat loss by conduction through the bare skin, preventing stress and its eventual
consequence on egg quality parameters.
Yolk height and diameter were similar in the naked neck and frizzle birds. The frizzle
birds also have their feathers modified and are therefore able to regulate their body
temperature under high ambient temperatures, though not to the same extent as the
naked neck birds. This may account for their superiority over the normal feathered
phenotype in Haugh unit, yolk height and yolk diameter. Yolk colour score was not
significantly different among the three phenotypes. This may be due to the fact that,

148
under the scavenging system all the birds have access to green leaves and therefore the
yellowish carotene pigmentation appears in their eggs at almost the same level.
Egg shell thickness being significantly higher in naked neck birds confirms the findings
of Njenga (2005) and Sharifi (2006), who concluded that the indigenous naked neck
birds were significantly superior in shell thickness compared to the frizzle and the
normal feathered birds. Akhtar-Uz-Zaman (2002) explained that, the reduction in
feather coverage of naked neck birds enables them to receive more solar radiation,
which may facilitate greater vitamin D3 synthesis and in turn, contribute to the better
shell quality.
5.2.5 Carcass Parameters
Relative defeathered weight, dressed weight and breast muscle weight were
significantly higher in the indigenous naked neck compared to the indigenous frizzle
and the normal feathered birds because of the higher proportion of muscle found in the
pectoral region of naked neck birds. According to Merat (1986), this gives them 1.8-7.1
percent more meat than normal feathered birds when their carcasses are dressed.
Furthermore, the reduction of plumage (20-40%) in naked neck birds conserves protein
which is used for the development of muscle tissues. According Merat (1986), this
gives them 1.5-3.0% more carcass yield than their normal feathered counterparts
regardless of the temperature. Barrio et al. (1991) noted that, naked neck birds are
significantly superior to their normal feathered counterparts in carcass traits. Fathi et al.
(2008) reported that the naked neck birds (NaNa or Nana) exhibit higher relative weight

149
of dressed carcass, drumstick and breast muscles compared to normally feathered
individuals (nana). According to N’Dri et al. (2005) carcass yield of naked neck birds
were higher than that of normally feathered birds (81.6 % vs. 80.0 %).
The frizzle birds had significantly higher relative defeathered weight, eviscerated and
dressed weight than the normal feathered birds due to the modification in plumage
coverage of frizzle birds that helps them to regulate their body temperature under high
ambient temperatures. Since a bird’s ability to regulate its body temperature determines
how stress-free it would be, the frizzle birds might have consumed more feed and
utilized it better which resulted in good muscle development (higher values for
defeathered and dressed weights) than their normal feathered counterparts.
Additionally, since live weight was not significantly different between the two
phenotypes, frizzle birds may have had relatively fewer feathers than their normal
feathered counterparts and this eventually affected the differences in relative
defeathered and dressed weights.
The frizzle birds had significantly higher relative weight of intestines, gizzard weight,
heart weight and liver weight. Benedict et al. (1932), Boas and Landauer (1933),
(1934), Landauer and Aberle (1935) and Landauer and Upham (1936) reported similar
results and had concluded that, this was due to the acceleration of basal metabolism in
frizzle birds that led to increased production of both thyroid and adrenal gland
hormones. They added that, feed intake, oxygen consumption, heart rate and volume of

150
circulating blood were increased, resulting in enlargement of heart, spleen, gizzard and
alimentary canal in frizzled birds.
5.2.6 Mortality The lower chick mortality observed in the frizzle birds compared to the naked neck and
normal feathered birds may be due to the good mothering ability of the frizzle hens.
This is because under the conditions of local chicken mortality of chicks is mostly due
predation and therefore survivability of chicks depends on the ability of the hen to
protect them. The lower total mortality observed in the naked neck birds compared to
the frizzle and normal feathered birds is in agreement with and explained by earlier
findings in other countries. Singh (1996) and Sharifi (2006) reported that the survival
ratio of naked neck hens was significantly superior to their normal feathered
counterparts. According to Barrio et al. (1991) and Banga Mboko (1996), the naked
neck gene has a higher resistance to coccidiosis-causing protozoa- E. tanella and E.
necatrix. Haushi et al. (2002) studied the naked neck and the normal feathered birds for
general immunocompetence and reported that a significantly higher haemolytic
complement level in serum was observed in birds carrying a copy of the Na mutation as
compared to the normally feathered birds. Naked neck birds are superior to normal
feathered birds for viability, immunocompetence, blood biochemical parameters and
mortality (Barrio et al., 1991). Barrio et al. (1987) stated that, there is less frequent
cannibalism among naked neck birds and that this may have a relation to survival rate.

151
5.3 STUDY THREE, FOUR AND FIVE
5.3.1 Parental Generations (P1&2)
The indigenous male parents used in the first matings with normal Lohmann
Commercials (Experiments Three & Four) varied in colour because indigenous birds
are produced as a result of random mating among indigenous chickens. Therefore many
colours appear even within chicks from the same parents. They were quite old since
almost all of them were a year or more old. Their average weights (1.50 kg - naked neck
& 1.42kg - frizzle) were far below the body weight of some standard breeder males
whose weight range between two and three kilograms (LPSMP, 1999).
The average fertility was quite high (94%). Males showing these thermoregulatory
genes (Na & F) have been associated with high fertility (Singh et al., 1996; Sharifi,
2006); even though Njenga (2005) associated them with low fertility when various
phenotypes of indigenous birds were compared. Average hatchability was low
especially in the naked necks (66% for naked necks & 74% for frizzles). However, the
naked neck gene has been found to influence hatchability positively (Singh et al., 1996;
Moreki and Masupu, 2003). Therefore, this low hatchability value might have been
caused by faulty incubator and faulty hatchery operations since the commercial
hatchery where the birds were hatched had generally low hatchability records.
The females used as the first generation parents (In Experiment Three and Four) were
Lohmann commercial layers which were uniformly brown in colour. They were 52
weeks old. This explains their larger egg sizes (62g) and moderate rate of lay (66.67%),

152
because egg size increases with the age of birds while rate of lay is inversely
proportional to age after the peak laying period. Fertility was good (94%) even though it
was lower than that of original Lohmann parent stock (95-98%). However, this might
have been affected by their age and the fact that they were commercial layers but not
selected female parent stock. The low hatchability realized within the Lohmann females
(66% compared to the 78-82% for original Lohmann parent stock) may be due to
environmental factors (hatchery problems) but not genetics.
The values for egg quality parameters such as albumen height (7.11mm), Haugh unit
(77%), shell thickness (0.32mm), yolk height (40mm), yolk diameter (15mm) and yolk
colour score (5) for the Lohmann layers used as the female parents during the first
mating show that the eggs were of good quality.
The second generation of parents (P2) was selected from the F1 heterozygous naked
neck and heterozygous frizzle birds. The selection was done during the seventh week
and was therefore based on growth rate and general appearance. However, the objective
of the selection was not only for meat production but also for egg production. This
objective was achieved because the parents of this second parental generation were
widely unrelated and therefore their offspring took advantage of heterosis, which made
them perform above the average of the two parents in both meat and egg production.
Naked neck and frizzle hybrids producing both eggs and meat is possible because Báldy
et al. (1954) improved egg production together with body weight to a level that did not
affect meat quality. Their work resulted in a good dual-purpose (meat and egg)

153
Hungarian naked neck chicken breed, which was propagated all over the country and
abroad.
As hybrids from indigenous chickens and exotic ones, hen-housed rate of lay of 60
(frizzle) and 65% (naked neck), hen-day rate of lay of 64 and 68% and egg size of 55
and 58g were on the higher side. Age at first egg of 138 and 148 days shows especially
that naked neck birds are generally not early maturers and this might have contributed
to their bigger egg sizes since according to Oni et al. (1991), late maturers normally lay
bigger eggs than early maturers. Mortality from week seven through the laying period
was very low (Tables 4.3.3a & 4.4.3a) and this explains the closeness of hen-housed
and hen-day rates of lay (65% vs 68% & 60 vs 64%). The low mortality also confirms
the positive influence of the naked neck and the frizzle genotypes on survivability of
chickens as observed by Barrio et al. (1987), (1991); Banga Mboko (1996); Singh
(1996); Haushi et al. (2002); and Sharifi (2006).
Fertility (92%- naked neck & 92.67%- frizzle) and hatchability (72%-naked neck &
77.70-frizzle) of these parents were moderate, which is in line with some published
results on the fertility and hatchability of naked neck and frizzle birds that are
sometimes found to be moderate (Singh, 1996; Njenga, 2005; Mohammed, 2005) and
other times found to be high (Hammade, 1987; Sharifi, 2006). Hybrid progenies had
been associated with higher fertility compared to their exotic parents (Trail, 1961;
Kicka et al. 1978). On the other hand, hatchability of fertile eggs has been reported by
many authors to be influenced by genetic factors, storage temperature, handling of eggs,

154
quality of eggs, age of bird, season, nutrition, pre-incubation warming, humidity, etc.
(Hyre, 1962; Byng and Nash, 1962; Simkova, 1962; Gringer, 1964; Laxi, 1964; Reddy
et al., 1965). However, crossbreeding improves hatchability by 5 to 20% in most
crosses (Byng and Nash, 1962). Bice and Tower (1939) observed higher hatchability in
crossbred birds than in indigenous birds. The above discussion shows that fertility and
hatchability results for the second generation of parents (P2) were affected by multiple
factors: genetic factors (Na & F genes), crossbreeding and non-genetic factors.
The eggs of these parents were of high quality (Table 4.3.3b & 4.4.3b) and this might
have been due to the positive influence of the naked neck and frizzle genotypes on egg
quality performance in chickens as a result of pleiotropy or linkage (Fraga and Lam,
1987; Singh et al., 1996; Njenga, 2005). Additionally, these birds were first filial
generation hybrids and might have been influenced by heterosis, which according to
Burrell (1999) is highest in hybrids for egg quality traits.
5.3.2 First and Second Generation (F1 & F2) Birds
5.3.2.1 Plumage Colour The naked necks (NaNa & Nana), frizzles (FF & Ff) and normals (nana/ff) produced in
the first and second filial generations had varying plumage colours as a result of the
variation in sire colours. To obtain a single colour for male and female offspring, the
colours of the sires and dams should be taken into consideration during the mating. For
instance brown sires (ss) and white dams (S -) when mated will produce white males

155
(Ss) and brown females (s -) in the offspring since the gold gene (colour brown) is
recessive to the silver gene (white).
5.3.2.2 Body Weight and Body Weight Gain The F1 and F2 naked neck birds were significantly heavier than normal feathered
(Tables 4.3.2.2a-c & 4.3.4.2a-c) and frizzle (Tables 4.5.2a1 & 2) ones because the 20-
40 percent less feather coverage in naked neck birds reduces considerably the need for
dietary nutrition to supply protein input for feather production. This makes naked neck
birds save protein, which may result in faster growth (Horst, 1987; Merat, 1990; Ajang
et al., 1993; Cahaner et al., 1993) leading to improved body weight. Secondly, the
naked neck gene (Na) may have a linkage with some of the genes which control body
weight and body weight gain in chicken (Crawford, 1976). Further more, reduction in
feather coverage increases the rate of irradiation of internally produced heat, thus
improving thermoregulation under high (30oC) or even moderate (22oC), ambient
temperatures. Therefore, naked neck chickens have a better capacity to maintain their
body temperature at high ambient temperatures (Yahav et al., 1998) due to the absence
of feathers on their neck, and also the absence of scattered down and semiplume
feathers on the apteria, which radiate heat that are normally held-in by the feathers of
chickens. According to Bordas et al. (1978), the reduction in feather coverage of naked
neck birds by 20-30% and 30-40% respectively for the heterozygous (Nana) and
homozygous (NaNa), facilitates better heat dissipation and improves thermoregulation
resulting in better relative heat tolerance under hot climates. This, according to Ward et
al. (2001) results in relief from heat stress, which enhances the productive and

156
reproductive performance of birds; since chickens minimize endogenous heat
production, to avoid a lethal increase in body temperature, by reducing feed intake,
resulting in decreased growth and meat yield in birds (Yahav et al., 1998).
This result is similar to that of Njenga (2005) who compared the growth of naked neck,
frizzle, dwarf and normal feathered birds from day-old to week 5, and concluded that
the naked neck birds were significantly heavier (P<0.05) than all the other chicken
phenotypes. In studies involving slow growing birds under fluctuating temperatures,
N’Dri et al. (2005) and Sharifi (2006) observed that heterozygous naked neck birds
reached the weight of 2 kg 3.3 days sooner than normal feathered birds. Merat (1986)
and Rauen et al. (1986) reported that heterozygous naked neck birds had significantly
higher (P<0.05) values in growth performance than their normal feathered counterparts
at temperatures of 30oC and higher. Somes (1988), Hareen-Kiso (1991) and Mathur
(2003) found that under constant heat stress, heterozygous naked neck birds perform
significantly better than their normal feathered counterparts in terms of growth
performance.
The F1 heterozygous frizzle birds were significantly heavier (P<0.05) than the normal
feathered birds in body weight from day-old to the twentieth week (Tables 4.4.2.2a-c)
because the frizzle gene may have a linkage with some genes which control growth in
chickens. Additionally the frizzling gene is a feather structure gene (Horst, 1988) that
causes a reduction in tropical heat stress by improving the bird's ability to convect heat,
resulting in improved feed conversion and better performance (Merat, 1990). Benedict
157
et al. (1932) found a considerable increase in energy metabolism for frizzled birds,
implying that they will respond differently from normal feathered birds to high
temperatures. This result is similar to that of Sharifi (2006) who stated that, weight of
chicks improves by the presence of the F-gene. According Njenga (2005) the frizzle
birds have higher chick weights within the first week of life among indigenous local
birds such as the naked neck, dwarf and normal feathered. Somes (1988) and Mathur
(2003) reported that the frizzle gene has favourable effect on body weight.
However, body weight gain between the two phenotypes was only higher in the frizzle
birds within the first six weeks while those of weeks 8 to 20 were not significantly
different (P>0.05), and this shows that the positive influence of the frizzle phenotype on
growth under the conditions of this experiment may have occurred only during the first
six weeks. Therefore, the F-gene may only affect growth in chickens under natural
environmental conditions in the tropics, during the juvenile stages (day old - 6wks).
This result agrees with that of Sharifi (2006) who found that under moderate
temperatures the frizzle gene in heterozygous form has no significant impact on growth
performance.
The F2 frizzle phenotypes were not significantly different (P>0.05) from their normal
feathered siblings in the twenty weeks study of body weight and weight gain (Tables
4.4.4.2a-c). Where there were significant differences (P<0.05), it was either Ff birds or
ff birds or both which were heavier than the other phenotypes; and this might be due to
the fluctuating nature of the temperature which might have masked the influence of the

158
frizzle gene on body weight and weight gain. These birds were hatched in the raining
season and reared through both rainy and dry seasons and therefore the heat load was
not strong enough to cause the level of stress that would make the F-gene more
advantageous. This result presupposes that the frizzle phenotype may not always be
superior to the normal feathered one in growth performance under natural tropical
conditions where chickens are not constantly under heat stress. Mathur (2003) studied
frizzle birds in different countries (Turkey, Egypt, Cuba, Burundi, Bolivia and
Malaysia) and concluded that under natural conditions there are large differences in the
performance of frizzle birds in terms of body weight and productivity index at different
locations.
5.3.2.2.1 Effect of Management System on Body Weight and Weight Gain
The significantly better performance of the birds reared under the intensive
management system compared to those reared under the semi-intensive and extensive
systems may be due to the reason that, birds reared under the intensive system were fed
ad libitum with a commercial diets that was high in protein (15%) and energy (2650kcal
ME/kg) compared to the local mash that was given to those reared under semi-intensive
and extensive systems in a controlled manner.
5.3.2.3 Body Measurements
The F2 Nana birds having higher values for body length than NaNa ones could be due to
overdominance (a situation where the heterozygous form of a gene (Nana) performs
better in a trait than the two homozygotes (NaNa & nana)). Additionally, the NaNa
birds have only been found to perform better than Nana ones under constant artificial

159
higher ambient temperatures (>25oC), (Deeb and Cahaner, 1999). Therefore, it could be
possible that the fluctuating natural temperatures in the tropics gives more advantage to
heterozygous naked neck birds in terms of body length than homozygous naked neck
ones.
The F1 and F2 frizzles (FF & Ff) and the normal feathered (ff) birds had a similar
genetic background, therefore their similar performances in body measurements such as
body length, body width and shank length means that the frizzle gene did not have any
significant influence on these traits. However, in the F2 birds body length value was
significantly higher (P<0.05) in Ff birds than FF and ff ones, and this clarifies the report
of Baldy et al. (1954) that it was the heterozygous frizzle birds which were used as
game cocks but not the homozygous ones, since game cocks are selected based on body
conformation aside the feather modifications which only frizzle birds possess.
5.3.2.3.1 Effect of Management System on Body Measurements
Birds reared under intensive and semi-intensive systems had higher values in body
length and body width than those reared under extensive system because they were
given diets that were balanced nutritionally and this made the birds grow bigger and
faster compared birds reared under the extensive system. The diet given to birds reared
under the intensive system had a higher quantity of protein (17%), and also the birds ate
more feed per day (fed ad libitum) compared to the birds reared under the semi-
intensive system. This result also show that body measurements of birds are not only
influenced by genes but also management.

160
5.3.2.4 Laying Performance
The naked neck phenotype had positive effects on number of eggs per clutch, egg size
and rate of lay than the frizzle (Table 4.5.4a) and normal feathered (Table 4.3.2.4a,
4.3.4.4a) ones because the Na gene which is located on the third chromosomes in
chickens may have a linkage with some genes that control egg production which are
located on the same chromosome (Crawford, 1976). Secondly, part of dietary protein is
used in feather formation and the reduction of feathers in naked neck birds releases
more protein which can be used for egg formation. Furthermore, the average day
temperatures during the study ranged from 25 to 32oC which could have caused heat
stress in the the layers. However, due to feather reduction in naked neck layers, they
were able to dessipate heat properly which alleviated heat stress under the high ambient
temperatures and therefore improved feed intake, feed utilization, egg formation and
egg laying.
The results were similar to those of Somes (1988), Haaren-Kiso (1991), Mathur (2003)
and Sharifi (2006) who found that under constant heat stress, heterozygous naked neck
birds perform significantly better than their normal feathered counterparts in terms of
egg numbers. Rauen et al. (1986) observed that the advantage of the Na gene at high
temperatures for egg production mainly involves persistency of laying. Somes (1988),
Hareen-Kiso (1991), Rauen et al. (1986), Yoshimura (1997) and Mathur (2003)
associated the naked neck genotype with bigger egg size compared to the normal
feathered birds. Rauen et al. (1986) reported that under high temperatures the

161
heterozygous naked neck birds are superior in rate of lay compared to their normal
feathered counterparts.
Age at first egg was better for the heterozygous naked neck birds than the homozygous
ones because the former reached sexual maturity earlier than the latter. These F2 birds
were hatched in the rainy season with average early morning ambient temperatures of
15-18oC which because of inadequate heating during brooding affected the growth of
the homozygous naked neck birds and therefore resulted in a delay in sexual maturity.
The usefulness of the naked neck genotype in stress management at higher ambient
temperatures has already been explained in this section. Stress in birds during high
ambient temperatures affects egg production markedly; therefore, the 1% higher
production of the homozygous naked neck birds in hen-day egg production compared to
the heterozygous naked neck genotype was due to the extensive feather mass reduction
(40%) in the former compared to the latter (20% feather mass reduction).
The naked neck birds being inferior to the normal feathered (Tables 4.3.2.4a & 4.3.4.4a)
and frizzle birds (Table 4.5.4a) in age at first egg may be due to the fact that naked neck
birds are associated with bigger egg sizes; because according to Oni et al. (1991) breeds
that attain sexual maturity early end up laying lighter eggs than late maturers.
The F1 and F2 frizzle (FF & Ff) birds had significantly higher values for number of eggs
per clutch, hen-housed rate of lay and hen-day rate of lay than their normal feathered
counterparts because the frizzle gene may have a positive linkage with some genes

162
which control egg production in the chicken. Also, the frizzle gene curls the feathers of
chickens which assist in thermo-regulation. This in turn improves feed intake and feed
utilization which would eventually improve egg production. This finding is similar to
what had earlier been found by Somes (1988) and Mathur (2003) who reported that
under natural conditions the frizzle gene had favourable effects on production traits
such as egg number and productivity index but less pronounced than the naked neck
gene. Horst (1987) found that under high temperatures, the frizzle gene caused an
increase in egg number. Sharifi (2006) stated that under high ambient temperatures, the
frizzle gene in heterozygous form (Ff) had a positive effect on laying performance, but
added that this advantage was not significant under moderate temperatures. Missohou et
al. (2003) studied frizzle, sex- linked dwarfism, normal feathered, normal size and
combined frizzle and sex- linked dwarfism birds under Senegalese natural conditions
and found that, the interaction between the two genes was positive for egg number.
The results on egg weight which did not differ significantly between frizzles and
normals in both F1 and F2 generations show that the frizzle gene may not have
significant influence on this trait in the fluctuating ambient temperature under which the
study was conducted, since this comparison was done between birds from similar
genetic backgrounds. On the contrary, Somes (1988) and Mathur (2003) reported that
under natural conditions the frizzle gene had favourable effect on egg weight.
Age at first egg was significantly better in F1 frizzle (Ff) birds than the normals (ff),
however, in the F2, normals (ff) had a better value in this trait than the frizzles (FF &

163
Ff); the birds had similar genetic background and therefore the trait being superior in
each of the two phenotypes for one of the two generations shows that the differences
might have been caused by environmental but not genetic factors. Secondly, the frizzle
gene could influence this trait only in F1 birds but not in birds from any other
generation. However, Sharifi (2006) concluded that the presence of the F-gene
especially in the homozygous dominant form (FF) delays age at first egg.
The heterozygous frizzle birds had higher average value in number of eggs per clutch
than the homozygous frizzles under the conditions of this study because their feathers
were extremely curled which exposed parts of their skin and were therefore pecked by
themselves and other phenotypes. This slightly affected their feed intake and feed
utilization and eventually number of eggs per clutch. Furthermore, since the
heterozygous frizzle birds performed better than their two homozygous counterparts
(FF & ff), it could be due to overdominance.
5.3.2.4.1 Effect of Village and Sire on Laying Performance
The villages where the F1 birds (Naked necks, frizzles and Normals) were reared
affected their laying performance significantly, which showed under local management
conditions is not only affected by the genetic make-up of the birds, but also a wide
range of environmental factors such as the micro-climate (rainfall, temperature and
relative humidity), sanitation (cleanliness of pen or coop, feeders and waterers) and
scavenging feed resource base. According to Mathur (2003), under natural conditions
there are large differences in the performance of chickens in terms of egg number, egg

164
weight, egg mass and productivity index at different locations. The four sires used also
affected egg production performance of the F1 birds significantly indicating the
possibility of the offspring inheriting some egg production genes from their sires.
Location (village) affected the laying performance of F2 birds with regards to number
of eggs per clutch and egg size, which were significantly better in birds reared in
Nkwanta as compared to Yawkwei and Juaso because some of the farmers in Nkwanta
used very spacious rooms to keep their birds, which reduced stocking density
significantly. This in turn reduced heat stress and cannibalism and consequently
enhanced feed intake and feed utilization. Additionally, they gave their birds a lot of
green leaves including “nkontomire” (cocoyam leaves), which are quiet nutritious.
These environmental factors might have improved number of eggs per clutch and egg
size of the birds raised in that village.
5.3.2.4.2 Effect of Management System on Laying Performance
Laying performance was significantly better (P<0.05) in birds reared under the intensive
system than those reared under the semi-intensive system which were better than those
reared under the extensive system because layers reared under intensive system were
giving diets containing relatively higher amounts of protein (17%) compared to diets
given to those reared under the semi-intensive (14% CP) and the extensive systems.
Birds that met their daily demand for protein laid bigger eggs and also laid more
consistently than those that were served with relatively lower protein diets. The results
also indicate that improving the genetics of local birds without any improvement in

165
management might not raise their productive and reproductive performance
significantlty.
5.3.2.5 Egg Quality Performance The F1 and F2 naked necks had higher values in albumen height, Haugh unit, shell
thickness, yolk height and yolk diameter because the naked neck gene may have a
positive linkage with some of the genes which control the quality of an egg.
Additionally, ambient temperature during the experiment was high (25-32oC of day
ambient temperature) and could therefore lead to stress in layers and eventually affect
egg formation and quality. However, the presence of the naked neck gene improves heat
dissipation in birds which alleviates stress due to heat and results in improvement in egg
formation and quality.
This result is similar to that of Somes (1988), Hareen-Kiso (1991), Mathur (2003) and
Njenga (2005), who reported that under constant heat stress heterozygous naked neck
birds performed better in egg mass and productivity index than their normal feathered
counterparts. Fraga and Lam (1987) and Sharifi (2006) found better egg shell strength
for the heterozygous naked neck genotype under high temperature conditions compared
to its normal feathered counterpart. According to Singh et al. (1996) the naked neck
gene has a positive influence on egg quality traits.
F1 frizzle (Ff) birds had higher values for albumen height, Haugh unit and yolk height
than the normals (ff) while in the F2 generation the frizzles (FF, Ff) had higher values in

166
Haugh unit and shell thickness than the normals (ff) which indicate that the frizzle gene
has positive influence on egg quality. According to Isikwenu et al. (1999) Haugh unit is
one of the best indicators of internal egg quality; and the higher the Haugh unit the more
desirable the egg quality. The superior Haugh unit in the frizzle phenotype in this study
is contrary to the finding of Missohou et al. (2003) who studied frizzles, sex- linked
dwarfs, normal feathered and normal sized birds and combined frizzle and sex- linked
dwarf birds under Senegalese conditions and found that, the frizzle gene does not
significantly influence egg quality. However, Mathur (2003) who studied the frizzle
phenotype under natural conditions in different countries stated that under natural
conditions there are large differences in the performance of frizzle birds in terms of
productivity index at different locations.
The frizzle birds performed better in egg quality within this study because the frizzle
gene may have a positive linkage with some genes which control egg quality in
chickens genetically (Benedict et al., 1932). Additionally, the high ambient
temperatures during the experiment could have caused stress in laying birds and affects
egg formation and quality negatively. However, birds showing the frizzle phenotype
have been found to respond differently from normals under heat stress due to their
curled feathers which help in thermo-regulation to reduce heat stress and alleviate its
eventual consequence on egg formation and quality.
The homozygous frizzles had higher values in shell thickness than the heterozygous
ones, thereby deepening the fact that the frizzle gene has a positive influence on egg

167
shell thickness. The contrary results reported by Sharifi (2006) might have been due to
the variability in the performance of frizzle genotypes at different locations (Mathur,
2003).
Results on yolk diameter and yolk colour score showed that the frizzle genotypes do not
influence these traits significantly. This is in agreement with the findings of Missohou
et al. (2003). However, the most important egg quality traits are the Haugh unit and
shell thickness which the frizzle phenotypes influenced positively in this study.
5.3.2.6 Some Carcass Parameters The F1 and F2 naked necks had higher values for defeathered weight, dressed weight,
thigh and drumstick weight, breast muscle weight than their frizzle (Table 4.5.6a) and
normal feathered counterparts (Table 4.3.2.6 & 4.3.4.6) because the reduction of
plumage (20-40%) in naked neck birds saves protein that may be used to develop meat
tissues. Also, the fewer feathers of naked neck birds gave them higher carcass yield than
their normal feathered and frizzle counterparts. Additionally, naked neck birds have a
higher proportion of muscle in the pectoral region and this gives them more meat. The
effect of the reduction in feather mass caused by the Na gene on breast muscle yield
mimics the effect of reducing ambient temperature (AT). Several studies with normally
feathered birds have shown that breast muscle yield is higher at low to moderate AT
than at high AT (Howlider and Rose, 1989; Leenstra and Cahaner, 1992). Therefore, the
higher meat yield of the naked neck birds, especially because it is even higher in the
NaNa genotype than in the Nana, also indicates that their ability to endure heat stress
168
under high ambient temperatures has an effect equivalent to that of a lower
environmental temperature.
The result is similar to that of Fathi et al. (2008) who found the two naked neck
genotypes to be superior in relative drumstick weight compared to their normal
feathered counterparts. They also found dressing percentage and relative breast muscle
weight to be higher in the naked neck genotypes (NaNa and Nana) compared to their
normal feathered counterpart which is similar to what was found in this study.
The homozygous naked necks had higher values for defeathered weight, dressed weight
and breast muscle weight than the heterozygous naked necks because the phenotypic
influence of the naked neck gene in a homozygous form is more pronounced than that
of the heterozygous. This coupled with the fact that the birds had similar genetic
backgrounds indicate that the Na gene has a substantial influence on carcass traits. This
result is similar to that of Deeb and Cahaner (1999) who studied three genotypes
(NaNa, Nana and nana) in broilers under alternating ambient temperature (24: 32o C)
and reported that the heterozygous and homozygous naked neck broilers gained 4.5 and
8.1% more body weight respectively than their normally feathered sibs, from 35 to 49
days of age. Deeb and Cahaner (1999) also stated that the naked neck birds especially
the homozygotes exhibit higher breast weight and percentage compared with their fully
feathered sibs. This advantage of the homozygous naked neck genotype over its
heterozygous naked neck counterpart has been consistent over a wide range of ambient
temperatures. The average advantage of Nana and NaNa broilers compared with their

169
fully feathered sibs was 5.5 and 7.0% at a constant temperature of 24oC (Cahaner et al.,
1993); 3.0 and 9.0% at a constant temperature of 28oC (Deeb and Cahaner, 1994); 8.4
and 11.5% at a constant temperature of 32o C (Cahaner et al., 1993); and 3.8 and 7.6%
at alternating temperature of 24:32o C.
Values for weight of intestines and liver weight were higher in frizzle birds than the
normals because basal metabolism of frizzle birds is accelerated leading to increased
production of both thyroid and adrenal gland hormones. According to Benedict et al.
(1932), Boas and Landauer (1933,1934), Landauer and Aberle (1935) and Landauer and
Upham (1936) this condition leads to increased food intake, oxygen consumption, heart
rate and volume of circulating blood, resulting in enlargement of internal organs and
alimentary canal in frizzle birds.
5.3.2.6.1 Effect of Management System on Carcass Parameters
Carcass parameters differed among birds reared under the three management systems
which show that carcass parameters are influenced by the management system.
Therefore, any attempt to improve the productivity of local birds should consider
improving both genetic factors and management. The breast muscle weight that did not
differ among birds reared under the various management systems shows that this
carcass trait is not influenced by environmental factors (management).

170
5.3.2.7 Mortality Chick mortality was higher in F1 and F2 naked neck chicks than normal feathered ones,
which might have been due to electrical power failures during the brooding period.
However, total mortality was lower in naked neck birds than frizzles (FF, Ff), (Table
4.5.7) and normals (nana), (Tables 4.3.2.7 & 4.3.4.7) because the presence of the Na
gene in the birds might have increased their resistance against diseases (Mahrous,
2008). Additionally, the naked neck birds were very docile, which made them less
prone to pecking despite their bare necks and this might have increased their
survivability.
The F1 frizzle (Ff) birds had higher values for chick mortality than the normal feathered
ones (ff), (Table 4.4.2.7a) due to inadequate heating during brooding. Additionally, the
frizzles died more than the normals during the entire experiment (Table 4.4.2.7) because
the F gene only influences mortality positively under high ambient temperatures when
the birds are stressed because of heat load (Horst, 1987; Haaren – Kiso et al., 1988).
Unlike the naked neck gene, the frizzle gene does not seem to influence the immunity in
birds (Haushi et al., 2002). However, the ambient temperature during the experiment
was fluctuating and therefore during the rainy and harmattan seasons when most of the
poultry diseases occured, the frizzle birds were disadvantaged since the ambient
temperatures at dawn and early morning were low (14-18oC) and therefore they died
more than the other phenotypes because of diseases. Furthermore, the birds were kept
on a deep litter and quite a number of the frizzle birds died through pecking. Njenga
(2005) had a similar experience when he studied four indigenous chicken genotypes

171
including the frizzle. Due to the modification of its feathers, the skin of frizzle birds are
easily exposed, making them more prone to pecking. This result is similar to that of
Sharifi (2006) who stated that under moderate temperatures the frizzle gene has no
effect on mortality.
Total mortality recorded for the F2 normals (ff) was higher than what was recorded for
the F2 frizzles (FF, Ff), which was contrary to what was observed in the F1. Birds used
in this study were reared under natural conditions under the semi-intensive system and
did not suffer much heat stress. The result on mortality might have been influenced by
other factors aside phenotypes; for instance, the keepers reported high incidence of
thefts which could have affected the total mortality of the normal feathered phenotypes.
This also explains why chick mortality was not significantly different among the
frizzles and normals. However, the positive influence of the frizzle genotype on
survivability had been reported by Horst (1987) and Haaren – Kiso et al. (1988).
5.3.2.7.1 Effect of Management System on Mortality
Mortality was lower in birds reared under the intensive and semi-intensive systems
compared to those kept under the extensive system because birds reared under the
intensive and semi-intensive systems had good nutrition and could therefore withstand
infections better than their counterparts that were reared under the extensive system.
Furthermore, birds that were reared under the extensive system were affected very
much by theft and accidents and these factors increased the mortality. The results show
that improvement in nutrition, housing, sanitation and general husbandry practices will

172
reduce mortality under the local chicken production system. Experience has shown that
vaccination of local fowls against major poultry diseases like Newcastle disease,
infectious bronchitis, Gumboro, etc. can prevent some of these losses (Wirsiy and
Fonba, 2005). Birds that were used for this study were vaccinated against Newcastle
disease and Gumboro, which led to the general improvement in survivability even in
birds reared under the extensive system.
5.3.2.8 Economics of Production 5.3.2.8.1 Effect of Phenotype
It was more profitable to rear the naked neck birds followed by frizzles and normal
feathered birds respectively; this was due to the positive influence of the naked neck
gene on body weight, egg production traits and survivability under tropical conditons,
which has been discussed in various sections of this study. It has also been discussed in
various sections of this study that the frizzle genotype influences productive and
reproductive traits positively under tropical conditions but less pronounced as compared
to the naked neck genotype. Scientist in this field of study have long been advocating
the use of these genotypes in the tropics for higher productivity and profitability (Horst,
1982, 1987; Cahaner et al., 1993; Mathur, 2003).
5.3.2.8.2 Effect of Management System on Economics Production
It was more profitable to produce the birds under the semi-intensive system compared
to the extensive system which was also significantly more profitable than the intensive
one. The birds which were 50% local and 50% exotic could not perform to the level of

173
exotic commercial birds especially in terms of egg production and therefore feeding
them with a commercial poultry diet made the business unprofitable under the intensive
management system. On the other hand, the local mash used under the semi-intensive
system was prepared from local ingredients. For instance, palm kernel cake could be
obtained within the villages free of charge and thereby reduce the cost of production
and consequently maximize profit.
In this study, birds that were kept under the extensive system were given concentrate to
supplement scavenging. It was found that when the scavenging birds were given
concentrate twice or thrice a day, they scavenged around the source of feed. This served
as a fence of protection from predators including thieves, for the birds, and it reduced
losses markedly. This coupled with the low cost of production under the extensive
system made it more profitable to rear the birds under this system than the intensive
one.
According to Branckaert and Guèye (1999) the management systems under local
chicken production frequently overlap. Therefore, free-range with feed supplementation
and night confinement as was the case in this study actually improved profitability but
not as much as that of the semi-intensive system. According to Ramlah (2005) free-
range and semi-intensive systems of keeping local chickens are still the most popular
and viable production systems for rural households.
174
5.4.0 Contributions of the Various Studies in Achieving the Main Objective The main objective of the study was to assess the productive potential of indigenous
chickens and to determine the magnitude of improvement that can be obtained by
mating them with commercial hybrid layers.
The first study established that local chicken production provides immense benefits for
the keepers in the form increased dietary intake of animal protein and also generation of
petty cash through the sales of surplus eggs and cockerels. However, the keepers have
various challenges which could be grouped broadly under genetics and management.
Local birds were found in almost every household in the villages surveyed, which
means that if the genetic and management problems are solved, local chicken
production could easily be harnessed as a poverty alleviation tool in Ghana.
In the second study it was found that local birds possessing naked neck (Na) and frizzle
(F) genes performed significantly better (P<0.05) than their normal feathered
counterparts in traits of economic importance. It became clear that multiplying the Na
and F genes which are found in the genome of local chicken population in Ghana could
improve productivity significantly.
The third, fourth and fifth studies proved that introducing genes from the genome of
exotic birds into local ones in addition to the Na and F genes through crossbreeding
would enhance the productivity of local birds to a magnitude which is far beyond what
they are producing currently.

175
Furthermore, it was established in the fifth experiment, that using semi-intensive system
where the crossbred chickens are given supplement prepared from available local
ingredients up to 75g per bird per day would help solve most of the management
problems associated with the production of local birds. This would help translate the
genetic improvement which has been made into profitability.

176
CHAPTER SIX
6.0 SUMMARY, CONCLUSION AND RECOMMENDATIONS
6.1 Summary and Conclusion
6. 1.1 Study One
All the chicken keepers interviewed reared their birds under the extensive system of
production with flock sizes averaging 22 in the ratio of 4 cocks: 6 hens: 12 chicks. The
foremost benefit derived by the keepers was the improved levels of animal protein in
the diets of their families through the consumption of meat and surplus eggs.
Survivability of chicks and total mortality were 50% and 65% respectively. Average
weights of cocks, hens, chicks and eggs were 1.55kg, 1.13kg, 35.00g and 42.80g
respectively. The average number of eggs per clutch ranged from 9 to 13. Challenges
faced by local chicken keepers included diseases, predators, theft, lack of funds to
increase stock and construct structures, smaller sizes of birds and eggs and smaller
numbers of eggs laid. It can therefore be concluded that local birds provide immense
benefits for keepers but their productivity is significantly hindered by genetic and
management problems.
6.1.2 Study Two
Body weight, egg weight, egg production, survivability, carcass yield and egg quality
were significantly higher (P<0.05) in birds with the naked neck phenotype than in those
with the frizzle phenotype which were better (P<0.05) than those that had the normal
feathered phenotype. It can therefore be concluded that naked neck and frizzle genes
improve the productivity of local birds but the naked neck gene appears to be more
effective than the frizzle gene.

177
6.1.3 Study Three Homozygous (NaNa) and heterozygous naked neck (Nana) birds were reared under the
local system of production with improved housing and feeding. It was found that the F1
Nana birds and F2 Nana and NaNa birds were significantly superior (P<0.05) to their
normal feathered (nana) counterparts in body length, body width, body weight, body
weight gain, number of eggs per clutch, hen-housed and hen-day rates of lay, egg size,
albumen height, Haugh unit, shell thickness, yolk height, yolk diameter, survivability
and carcass yield. However, age at first egg and egg size to body weight ratio were
significantly better (P<0.05) in the nana birds compared to the NaNa and Nana ones.
Shank length, yolk colour score, chick mortality and relative weights of intestines, heart
and liver did not differ significantly (P>0.05) between the two phenotypes. Therefore,
using birds that show the naked neck phenotype in local chicken production will
enhance productive and reproductive performance significantly.
6.1.4 Study Four
Homozygous (FF) and heterozygous frizzle (Ff) birds were produced in the first and
second generation (F1 & F2) of a mating between indigenous frizzle (Ff) males and
Lohmann commercial females. It was observed that the F1 Ff birds were significantly
(P<0.05) better than their normal feathered (ff ) counterparts in terms body weight, age
at first egg, number of eggs per clutch, hen-housed and hen-day rates of lay, egg size to
body weight ratio, albumen height, Haugh unit, yolk height and carcass yield, under the
conditions of this experiment. However, survivability was significantly better (P<0.05)
in the ff birds compared to the Ff ones, while traits such as body length, body width,
178
shank length, egg size, shell thickness, yolk diameter and yolk colour score did not
differ significantly (P>0.05) between the two phenotypes. The F2 FF and Ff birds were
significantly superior (P<0.05) to their ff counterparts in number of eggs per clutch,
hen-housed and hen-day rates of lay, Haugh unit, shell thickness, survivability and
carcass yield. However, age at first egg was significantly better (P<0.05) in the ff birds
compared to the FF and Ff genotypes; while body length, body width, shank length,
body weight, body weight gain, egg size, egg size to body weight ratio, albumen height,
yolk height, yolk diameter, yolk colour score and chick mortality were not significantly
different (P>0.05) between the frizzles and the normal feathered birds. It can therefore
be concluded that using frizzle (FF, Ff) hybrids in local chicken production will
increase productivity, though to a lesser extent than when naked necks (NaNa, Nana)
are used.
6.1.5 Study Five
The NaNa and Nana birds were significantly superior (P<0.05) to their FF and Ff
counterparts in body weight, body weight gain, body length, body width, shank length,
number of eggs per clutch, hen-housed and hen-day rates of lay, egg size, albumen
height, Haugh unit, shell thickness, yolk height, yolk diameter, yolk colour score,
carcass yield and economics of production. However, age at first egg was not
significantly different (P>0.05) between the naked neck and the frizzle phenotypes;
while egg size to body weight ratio, and relative weights of heart and liver were
significantly superior (P<0.05) in the FF and Ff birds compared to their NaNa and
Nana counterparts. It was most economically viable to rear all the genotypes (NaNa,

179
Nana, FF, Ff & nana/ff) under the semi-intensive system than the extensive system.
Rearing the birds under intensive system, where the birds are housed and fed under
commercial poultry standards was the most economically unprofitable. It can therefore
be concluded that aside genetic improvements, rearing local birds under the semi-
intensive system will improve profitability significantly.
6.2 Recommendations
1. It is recommended that the Ministry of Food and Agriculture collaborates well with
scientists who are interested in researching into local chicken production, since it has
the potential of being harnessed to improve the livelihood of the poor in our society.
2. Crossbred birds with naked neck (NaNa and Nana) and frizzle (FF and Ff)
phenotypes are recommended as suitable birds for local chicken production due to their
high productive and reproductive performance as well as survivability under the tropical
environment.
3. The results of this study indicate that the semi-intensive system is the best for the
rearing of local birds, where the birds will be vaccinated against two or three prevailing
diseases especially Newcasle disease, and housed in an improved infrastructure which
will protect them from thieves and predators.

180
4. The birds were transferred to the villages from KNUST for this study at the end of
the sixth week; therefore this work should be repeated where the birds will be reared in
the local environment from day-old to maturity.
5. The introduction of the naked neck (Na) gene into meat and egg type commercial
poultry parent stock in the tropics and comparing their performance with those of parent
stocks being used currently is recommended.

181
REFERENCES
Abdelqader, A., Wollny, C. and Gauly, M. (2005). Mortality Constrains Production Efficiency in Smallholder Local Chicken Production in Jordan. A workshop on Global Food & Product Chain-Dynamics, Innovations, Conflicts and Strategies. Deutscher Tropentag, October 11-13, 2005, Hohenheim. Abdel-Gawad, E.M., Khalid, A.Z. and Balat, M. (1980). Genetic analyses of the new breed of chickens, Mamourah. Egypt, J. Genet. Cytol. 8: 303-313
Adesina, O. M. (2002). Gene frequency and influence of polydactyl and ptylopody on body size of Nigerian local chickens. M.Sc Thesis, University of Ilorin. Nigeria.
Ajang, O. A., Prinjono, S. and Smith, W. K. (1993). Effect of dietary protein content on growth and body composition of fast and slow feathering broiler chickens. British Poultry Science, 34:73–91. Akhtar-Uz-Zaman, M. (2002). Eggs Production Performance of Crossbred Birds in Bangladish. Sylhet Government veterinary College, Tilagorh Sylhet- 3100, Bangladesh. Andrews, P. (1990). Rural poultry development in the Gambia. In Proceedings, CTA Seminar on Smallholder Rural Poultry Production, Thessaloniki, Greece, 9–13 October, 1990, Vol. 2, p.81–85. Anonymous (2005). The naked neck gene and its effects on performance of chickens. www.omlet.co.uk/homepage/homepage.php
Anonymous (2007). Major genes in the local chicken population. Animal Life. Environmental Division Information, Antigua and Barbuda. www.ANIMAL LIFE/ Antigua & Barbuda's Environment Division.htm.com
Asiedu, F.H.K. and Weever, W. (1993). Growth rate and egg production of Creole and Rhode Island Red × Creole fowls. Journal of Tropical Animal Health and Production 25:111-117.
Atunbi, O.A. and Sonaiya, E.B. (1994). An assessment of backyard poultry housing in Osogbo. Osun State, Nigeria. African Network for Rural Development Newsletter, 4(1): 7.
Awan, M. A., Otte, M. J. and James, A. D. (1994). The epidemiology of Newcastle disease in rural poultry: A review. Asian Journal of Avian Pathology, 23: 405-423.
Awuni, D.J. (2002). Strategies for the Improvement of Local Chickens in Ghana. Ghana veterinary Service. Accra Ghana.

182
Ayorinde, K.L. (1987). Changes in anatomical points of the guinea hens in lay. Nigeria Journal of Animal Production, 14: 121-123.
Báldy, B., Lacza, B. and Suschka, A. (1954). Indigenous birds: their characteristics and improvement. Annual Report, Institute for Small Animal Research, India.
Banga Mboko, H. (1996). Study of genetic resistance of two naked neck and normal feathered lines infected experimentally by Eimeria necatrix. Final study report, Institute of Tropical Medicine Prince Leopold, Anvers publishing Co. Ltd., UK. 13 pp.
Barrio, I., Viamonte, O., Szcipel, B., Fraga, L. and Cardenas, M. (1991). A note on the response to Eimeria tanella by White Leghorn Naked Neck chicks. Cuban Journal of Agricultural Science, 25: 67-69.
Barrrio, I., Fraga, L. M. and Perez, P. (1987). Influence of the Naked neck gene (Na) on the Incidence of pecking and cannibalism in light Layers. Cuban Journal of Agricultural Science. 21: 285-289.
Bell, J.G., Kane, M. and Le Jan, J. (1990): An investigation of the disease status of village poultry in Mauritania. Journal of Preventive Veterinary Medicine 8: 291-294.
Bembridge, T.J. (1988). Impact of maize extension programme in Transkei, Botswana. South African Journal of Agricultural Extension, 17: 22–28. Benedict, F.G., Landuer, W. and Fox, E.L. (1932). The physiology of normal and frizzle fowl, with special reference to the basal metabolism. Storrs Agricultural Experimental Station, Bull.177, India. Bhagwat, A.I. (1996). Low-cost housing designs and structures to suit tropical and subtropical conditions. In Proceedings. 20th World Poultry Congress, New Delhi, India, 1–5 September 1996, Vol. 2, p. 621–630. Bice, C.A. and Tower, B.A (1939). Crossbreeding poultry for meat production. Hawai Agricultural Experiment Station, Bulletin, 81.
Boas, E. P., and Landauer, W. (1933). The effect of elevated metabolism on the heart of frizzle fowl. American Journal of Medical Science, 185:654-665.
Boas, E.P., and Landauer, W. (1934). The effect of elevated metabolism on the heart of frizzle II. Increased ratio of heart to body weight. American Journal of Medical Science, 188:359-364.
Bordas, A., Merat, P. Sergent, D. and Ricard, F.H. (1978). Influence of the naked neck gene on the performance of chickens. Journal of Animal Genetics, 10: 209 - 231.

183
Bourzat, D. and Saunders, M. (1990). Improvement of traditional methods of poultry production in Burkina Faso. In Proceedings, CTA Seminar; 3rd International Symposium on Poultry Production in Hot Climates, Hameln, Germany, 12 June 1987.
Branckaert, R.D.S. and Guèye, E.F. (1999). FAO’s programme for support to family poultry production. In F. Dolberg & P.H. Petersen, editorials. Poultry as a Tool in Poverty Eradication and Promotion of Gender Equality, 244-256 pp. Proceedings workshop, March 22-26, 1999, Tune Landboskole, Denmark .
Burrell, W. C., (1999). How can I benefit from heterosis and still maintain uniformity in my calves? Proceedings of the 19th Annual Utah Beef Cattle Field Day. pp. 24-27. Brigham. Byng, A.J. and Nash, D. (1962). The effect of egg storage on hatchability. Animal Breeding Abstracts, 30: 557. Cahaner, A., Deeb, N. and Gutman, M. (1993). Effects of the plumage-reducing naked neck (Na) gene on the performance of fast growing broilers at normal and high ambient temperatures. Poultry Sci. 72: 767 – 775. Cahaner, A. (2007) Disputed Featherless Broilers: Natural Phenomenon. World Poultry Science Journal,18 (8): 5-8. Chaheuf, N. (1990). Disease prevention in smallholder village poultry production in Africa. In Proceedings, CTA Seminar on Smallholder Rural Poultry Production. Thessaloniki. Greece, 1: 129–137. Chale, F. and Carloni, A.S. (1982). Nutrition and rura1 poultry and rabbit production projects. Food and Nutrition (FAO), 8(2): 26–31. Chen, C. F., Huang, N. Z., Gourichon, D. Lee, Y. P. Tixier-Boichard, M. and Bordas, A. (2008). Effect of Introducing the Naked Neck Gene in a Line Selected for Low Residual Feed Consumption on Performance in Temperate or Subtropical Environments. World Poultry Science Journal, 87:1320-1327.
Cheong, I. C. and Chung, S. B. (1985). Estimation of heterosis from strain crosses of single comb white leghorns for certain economic traits. Korean , Journal of Animal Science, 27:135-142.
Chrysostome, C.A.A.M., Bell, J.G., Demey, F. and Verhulst, A. (1995): Seroprevalences to three diseases in village chickens in Benin. Preventive Veterinary Medicine, 22: 257-261.
Crawford, R. D., (1976). Incomplete dominance of the gene for naked neck in domestic fowl. Journal of Poultry Science, 55: 820 - 822.

184
Crawford, R.D. (1977). Naked neck transmission ratios and embryo survival in domestic fowl. Journal of Poultry Science, 56: 1706 (Abstract). Crawford, R.D. (1978). The naked neck locus in domestic fowl. A balanced polymorphism? Journal of Poultry Science, 57: 1131(Abstract). Creevey, L.E. (1991). Supporting small-scale enterprises for women farmers in the Sahel. Journal of lnternational Development, 3(4): 355–386. Dalby, A. (2003). Food in the Ancient World From A-Z, Routledge: London, 2003 (p. 83-4) Dankwa, D., Nelson, F.S., Oddoye, O.K. and Duncan, J.L. (2002). Housefly larvae as a feed supplement for rural poultry. Ghana Journal of Agricultural Science: 35, 185-187.
Davenport, C.B. (1914). The bare necks. Journal of Heredity, 5: 374.
Deeb, N. and Cahaner, A. (1999). The effects of naked neck genotypes, ambient temperature, and feeding status and their interactions on body temperature and performance of broilers. Poultry Science, 78:1341–1346 Deeb, N. and Cahaner, A. (1994). Genotype-environment interaction and heat tolerance of naked-neck broilers. Proceedings of the 5th World Congress on Genetics Applied to Livestock Production. Vol. 20. Pp 65–68, Guelph, Canada. Demeke, S. (2003). Growth performance and survival of Local and White Leghorn chickens under scavenging and intensive systems of management in Ethiopia. Journal of Livestock Research for Rural Development, 15 (11): 25 - 28. Desai, D.K., Logan, F. and Halbrook, E.R. ( 1961). Egg production and mortality of various breeds and crosses of chickens under Sudan conditions. The Sudan Journal of Veterinary Science and Animal Husbandry, 2: 51-54. Eberhart, D. E. and Washburn, K. W. (1993). Assessing the effect of the naked neck gene on chronic heat stress resistance in two genetic populations. Journal of Poultry Science, 72: 1391 – 1399.
Fanuel, J. (1997). A survey on the status of local chicken and the unconventional poultry species in Morogoro urban area. M.Sc. Thesis, Sokoine University of Agriculture, Morogoro, Tanzania.
FAO. (1982). Report on the expert consultation on rural poultry and rabbit production. Animal Production and Health Division Publication, No. 226521. Rome.

185
FAO. (1987). Report on the expert consultation on rural poultry development in Asia, Dhaka, Bangladesh, 23 – 28 March 1987. Animal Production and Health Division Publ. No. 274415, Rome. FAO. (1997). Human Nutrition in the Developing World. By M.C. Latham. FAO Food and Nutrition Series, No. 29, Rome. FAO. (1998). Village Chicken Production Systems in Rural Africa. FAO Animal Production and Health Paper, No.142, Rome. FAO. (2000). Small scale poultry production. FAO Corporate Document Repository, 2000. http://www.fao.org/docrep/008/y5169e/y5169e01.htm# FAO (2002). Small-Scale Poultry Production. FAO Corporate Document Repository, 2002. FAO Animal Production and Health Paper, No. 35, Rome. Fathi, M. M., El-Attar, A. H., Ali, U. M. and Nazmi, A. (2008). Effect of the naked neck gene on carcass composition and immunocompetence in chicken. British Poultry Science, Volume 49 (2): 103 - 110
Fayeye, T. R. and Oketoyin, A. B. (2006). Characterization of the Fulani-ecotype chicken for thermoregulatory feather gene. Livestock Research for Rural Development 18 (3): 98 - 102
Fayeye, T. R., Ayorinde, K. L., Ojo, V. and Adesina, O. M. (2005). Frequency and influence of some major genes on body weight and body size parameters of Nigerian local chickens. Livestock Research for Rural Development 18 (3): 11 - 14.
Fraga, L. M. and Lam, P.T. (1987). A study of the naked neck gene in the productive traits of semi-light layers. Cuban Journal of Agricultural Science, 21: 69-73 Genstat, Discovery Edition 3. (2007). VSN International Software for Biosciences. Global Plan, (1992). Sustainable Agriculture and Natural Resources Management. Volume 1
Gondwe, T. N., Wollny, C. B. A, Safalaoh, A .C .L., Chagunda,M. G. G. and Chilera, F. C.(2005). Performance of scavenging Malawi local chickens during the period of human food shortage. Livestock Research for Rural Development 17 (5): 56 - 59.
Gondwe, T. N. and Wollny, C.B.A. (2005). Evaluation of the Growth Potential of Local Chickens in Malawi. International Journal of Poultry Science, 4 (2): 64-70, 2005. Gringer, P. (1964). The effect of vitamin K nutrition on hatchability of eggs and prothrombin levels of chicks. Poultry Science, 43: 289.

186
Guèye H. F. (1998). Village egg and fowl meat production in Africa. World's Poultry Science Journal 54:73-86.
Gyening, K. O. (2006). The future of the poultry industry in Ghana. Paper prepared for the Ghana Veterinary Medical Association, 7pp. Haaren-Kiso, A., (1991). The effects of naked neck and frizzle genes on performance and immunocompetence of chickes. Ph.D Thesis, Institute for Animal Production, Technical (Umboldt) University of Berlin.
Haaren-Kiso, A., Horst, P. and Zarate, A. V. (1995). Direct and indirect effects of the frizzle gene (F) on the productive adaptability of laying hens. Animal Research and Development. 42: 98-114.
Hammade, H., Petijean, M., Douaire, M., Mallard, J. and Merat, P. (1987). The effect of the frizzle gene (F) on productive adaptability of laying hens under warm and temperate environmental conditions. Proc. 8th World poultry Science. cong., Nagoya, Japan.
Haushi, S., Sharma, D., Nayal, L.M.S., Singh, D.P. and Singh, R.V. (2002). Effect of naked neck gene (NA) and frizzle gene (F) on immunocompetence in chickens British Poultry Science, 43: 28-32.
Hertwig, P. (1933). The naked neck gene. Germany Journal of Zoology and Genetics, 38: 112-118.
Horst, P. (1999) Evaluation Of Local Poultry Resources For Creating Genetics Stock (1992-1995), published by CTA, 1999. Horst, P. (1989). Native Fowls for a Reservoire of Genomes and Major Genes with Direct and Indirect Effects on the Adaptability and their Potential for Tropically Oriented Breeding Plans. Archive for development, 53: 93-101. Horst, P. (1988). Native fowl as reservoir for genomes and major genes with direct and indirect effects on production adaptability. In Proceedings, 18th World Poultry Congress, Nagoya, Japan, 4–9 September 1988, p. 105.
Horst, P. (1987). Some remarks on poultry improvement in Bangladesh as related to socio-economic factors. Paper presented to the FAO Expert Consultation on Rural Poultry Development in Asia, Dhaka, Bangladesh.
Horst, P., (1982). Genetical perspective for poultry breeding on improved productive ability to tropical conditions. Proc. 2nd World Cong. Genet. Applied Livestock Production, (Madrid) 8: 887 - 892. Howlider, M.A.R. and S.P. Rose, (1989). Temperature and the growth of broiler.

187
Worlds Poultry Science Journal, 45: 228 - 236. Huchzermeyer, F. W. (1973). Free-ranging hybrid chickens under African tribal conditions. Rhodesian Agricultural Journal, 70: 73–75. Huchzermeyer, F.W. (1976). Immunization Against Coccidiosis in Fowls. Journal of South African Veterinary Association, 47(4): 253 - 254 Hutt, F. B. (1949). Genetics of the Fowl. McGraw-Hill Book Company, Inc., New York. Hutt, F.B. (1936). The Genetisists objectives in Poultry improvement. American Naturalists, 72: 268.
Hutt, F.B. (1930). The genetics of the fowl. I. The inheritance of frizzled plumage. Journal of Genetics, 22:109-127.
Hyre, W.M. (1962). The effect on hatchability of dipping chicken eggs into vitamin A and vitamin solution. Poultry Science, 41: 1652. International Network for Family Poultry Development –INFPD (1999). Newsletter Vol. 9 No. 2, April - June 1999 Isika M.A., Okon B.I, Agiang E.A.., Oluyemi J.A. (2005). Dietary Energy and Crude Protein Requirement for Chicks of Nigeria Local Fowl and Crossbreds. International Journal of Poultry Science, 5 (3): 271-274.
Isikwenu, J. O., Okaplefe, C. S. and Mmereole, F .U. C. (1999). Storability of chicken eggs under different storage conditions. Proceedings of the 26th Annual Nigeria Society for Animal Production Conference, 21-25 March, 1999, Ilorin.
Islam, A. (2006). Rural Poultry Production: 1.Incubating Capacity of Broody Hens and Chick Performance. Master of Science Thesis. Department of Animal Science and Animal Health and Network for Smallholder Poultry Development. The Royal Veterinary and Agricultural University, Bülowsvej 17, 1870 Fredriksberg C., Denmark.
Katule, A.M. (1992). Crossbreeding as a tool for genetic improvement of chickens in sub-optimal environments. Bulletin of Animal Health and Production in Africa 41:71-80.
Khadijah, E. (1988). Usefulness of the naked neck gene in meat and egg type chickens. University Malaya, Kuala Lumpur 212. (PhD thesis).
Kicka, M. A. M., Stino, F.K.R. and Kamar, G.A.R. (1978). Genetical studies on some economical traits of chickens in the subtropics. Animal Breeding Abstract, 46: 12.

188
Kitalyi, A. J. (1998). Village Chicken Production Systems in rural Africa: Households Food security and gender issues. FAO Animal Production and Health Paper 142, Rome.
Kitalyi, A. J. (1999). Family poultry management systems in Africa. First INFPD/FAO electronic conference on family poultry. INFPD (International Network for Family Poultry Development).
Kuit, H.G., Traore, A. and Wilson, R.T. (1986). Livestock production in Central Mali: ownership, management and productivity of poultry in traditional sector. Tropical Animal Health and Production, 18: 222–231. Ladjali, K., Tixier-Boichard, M., Bordas, A. and Mérat P. (2005). Cytogenetic study of early chicken embryos: effect of naked neck gene and high ambient temperature. Poultry Science, 74(6) : 903 - 909.
Landauer, W. (1933). A gene modifying frizzling in the fowl. Journal of Heredity 24:152-156.
Landauer, W. and Dunn, L.C. (1930). The “frizzle” character of fowls, its expression and inheritance. Journal of Heredity, 21: 290 - 305.
Landauer, W. and Upham, E. (1936). Weight and size of organs in frizzle fowl. Storrs Agricultural Experimental Station, Bull. 210.
Landauer, W. and Aberle, S.D (1935). Studies on the endocrine glands of frizzle fowl. American Journal of Anatomy. 57: 99 - 134.
Laxi, J. (1964). The effect of mating type, age of hen, pre-incubation, working of eggs and the age of eggs on hatchability. Animal Breeding Abstract, 33: 141. Lea, R. W., Dods, A. S. M., Sharp, P. J., and Chadwick, A. (1981). The possible role of prolactin in the regulation of nesting behaviour and the secretion of luteinizing hormone in broody bantams. Journal of Endocrinology, 91, 89 – 97. Leenstra, F. and Cahaner, A. (1992). Effects of low, normal, and high temperatures on slaughter yield of broilers from lines selected for high weight gain, favorable feed conversion, and high or low fat content. Poultry Science, 71: 1994 – 2006.
Li, L.Z. and Y.P. Lee, (1995). Broody behavior and egg production traits of Taiwan native fowls in deep litter floor pens and individual cages. Journal of the Chinese Society of Animal of Science, 42: 211 – 214.
LPIU, (Livestock Planning and Information Unit) (2006). Projections of the Veternary Services Directorate. Livestock census, figures of (1995/1996).

189
LPSMP (1999). Lohmann Parent Stock Management Program. Lohmann Tierzucht, Germany. www.ltz.de
MacDonald, K.C. and Blench, R.M. (2000). Feed Ingredients and Feeding of Chickens. The Cambridge World History of Food (Cambridge University Press - 2000)
MacGregor, R.G and Abrams, L.A. (1996). Development, implementation and evaluation of poultry development scheme for resource-poor communities in South Africa. In Proceedings. 20th World Poultry Congress, New Belhi, India, 3: 297–302. Mahrous, M., Galal, A., Fathi, M.M. and Zein El-Dein, A .(2008). Impact of Naked Neck (Na) and Frizzle (F) Genes on Growth Performance and Immunocompetence in Chickens. International Journal of Poultry Science 7 (1): 45 – 54. Mathur, P.K. and Horst, P. (1989). Temperature stress and tropical locations as factors for genotype x environment interactions in poultry production. Proceedings Genotype and environment interactions in poultry production, INRA, Jouy-en-Josas (France): 83-96.
Mathur, P. K. (2003). Genotype- Environment Interactions: Problems Associated with Selection for Increased Production. In Poultry Genetics, Breeding and Biotechnology edited by M.W. Muir and S.E. Aggrey. CABI Publishing, UK, P. 546.
Mburu, B. M. and Ondwasi H. O. (2005). Discover Hidden Treasure in Local Chicken. Manual on Local Chicken production. Kenya Agricultural Research Institute, pp. 8 -10.
Melewas, J. N. (1989). The contribution of poultry industry to the national economy. In: Proceedings of the 7th Tanzania Veterinary Association Scientific Conference, Arusha, Tanzania, 7: 13-35.
Merat P. (1990) Pleiotropic and associated effects of major genes In: Crawford R. D., (ed), Poultry breeding and genetics, Elsevier, Amsterdam. pp. 442 - 448
Merat, P., (1986). Potential usefulness of the Na (Naked neck) gene in poultry production. World’s Poultry Science Journal, 42: 124-142. Meteorological Service Department (2008). Daily Meteorological Records at the Kwame Nkrumah University of Science and Technology (KNUST) Sub-station of the Department of Meteorological Service, Kumasi, Ashanti Region of Ghana.
Minga, U. M., Katule, A. M., Maeda, T. and Musasa, J. (1989). Potential of the traditional chicken Industry in Tanzania. In: Proceedings of the 7th Tanzania Veterinary Association Scientific Conference, Arusha, Tanzania, pp 207-215.

190
Missohou A., Dieng A., Horst P., Zarate V.A., Nesseim T. and Tchedre K. (2003). Effect of dwarf (dw) and frizzle (F) genes on the performance of layers under Senegalese conditions. Tropical Animal Health and Production, 35(4): 373-380. Mohammed, M.D., Abdalsalam, Y.I., Mohammed,A.R.K., Jin-yu, W. and Hussein, M.H. (2005). Growth performance of indigenous x exotic crosses of chicken and evaluation of general and specific combining ability under Sudan condition. International Journal of Poultry Science 4 (7): 468-471. Mokotjo, J.L. (1990). Supply, demand and marketing of principal food grains in Lesotho. Food Security Policies in SADCC regions. In Rukuni, M., Mudimu, G. & Jayne, T.S., eds. Proceedings. 5th Annual Conference on Food Security Research in Southern Africa, 16-18 October 1989, pp. 204 – 211. Moreki, J.C. and Masupu, P.K. (2003). Country report on local chicken production: Bostwana. Journal of Poultry Science, 24(4): 407 - 420. Mukherjee, T.K. (1990). Breeding and Selection Programmes in Developing Countries. In: Crawford R. D., (ed), Poultry Breeding and Genetics, Elsevier, Amsterdam. pp. 1048-1055. Musharaf, N.A. (1990). Feeding and feed resources. In Proceedings, CTA Seminar on Smallholder Rural Poultrv Production, Thessaloniki, Greece, 9–13 October 1990, Vol. I, p. 17–22. Mwacharo, J.M., Nomura, K., Hanada, H., Jianlin, H., Hanotte, O. and Amano, T. (2007). Genetic relationships among Kenyan and other East African indigenous chickens. Journal of Animal Genetics, 38(5): 485 – 490. Mwalusanya, N.A., Katule, A.M., Mutayoba, S.K., Mtambo, M.M.A., Olsen, J.E. and Minga, U.M. (2004). Productivity of Local Chickens under Village Management Conditions. Tropical Animal Health and Production, Springer Netherlands, Volume 34, Number 5, pp 405 - 416 N’Dri, A.L., Mignon-Grasteau, S., Sellier, N. and Tixier-Boichard, M. (2005). Influence of the Naked Neck Gene on Heat Tolerance of Slow Growing Broilers on Growth, Body Composition And Meat Quality. Fourth European Poultry Genetics Symposium, Croatia. Abstract of poster. Nixey, C., (1973). An analysis of broodiness and egg production in turkey flocks starting to lay at two different times in the year. 4th European Poultry Conference, London, pp: 87 - 93.

191
Njenga, S.K. (2005). Productivity and Socio-Cultural Aspects Of Local Poultry Phenotypes In Coastal Kenya. Masters of Science Degree Thesis. Network for Smallholder Poultry Development, the Royal Veterinary and Agricultural University, Dyrlaegevej 2, 1870 Frederiksberg C, Copenhagen, DENMARK. Nsoso, S.J., Lottering, R.N. and Moreki, J.C. (2003). Effects of village, sex, scholastic qualification and age of farmers on rearing of backyard chickens that phenotypically show naked neck (Na) and dwarfism (Dw) genes in Kgatleng District, Botswana. South African Journal of Animal Science, vol 4: 5 - 8.
Oguike, M. A. and Onyekweodiri, E. O. (1999). Egg shell quality of four commercial strains of layers. Proceedings of the 26th Annual NSAP Conference, 21-25 March, 1999, Ilorin.
Ojo, V. (2002). Incidence and influence of naked neck and frizzle genes on body size of local chickens. M.Sc. Thesis, University of Ilorin, Nigeria.
Oluyemi, J.A. (1979). Potentials of the indigenous species of poultry for meat and egg production in Nigeria. pp.163-186. Proceedings 1st National Seminar on Poultry Production in Nigeria, 11-13 December, 1979. Ahmadu Bello University, Zaria, Nigeria. National Animal Production Research Institute.
Oluyemi, J.A., (1976). Crossbreeding and up-grading of the indigenous fowl of Nigeria with improved breed. Zeablieacaein veterinary Medicine, A27: 300-370. Oluyemi, J.A., Adene, D.F. and Ladoye, G.O. (1979). A comparison of the Nigerian indigenous fowl with White Rock under conditions of disease and nutritional stress. Tropical Animal Health and Production, 11: 199–202.
Omeje, S.S.I. and Nwosu, C.C. (1988). Utilisation of the Nigerian chicken in poultry breeding: Assessment of heterosis in growth and egg production. Journal of Animal Breeding and Genetics 105:417-425.
Oni, O.O., Abubakar, B.Y. and Ogundipe, S.O. (1991). Genetic and phenotypic associations of juvenile body weights and egg production traits in two strains of Rhode Island chickens. Nigerian Journal of Animal Production 18: 66 - 70 Osei-Amponsah, R., Kayang, B.B. and Naazie, A. (2007). Age, Ecotype and Sex Effects on Growth Rate of local chicken and Sasso T44 Chickens under Improved Management in Ghana. Proceedings of the 15th biennial conference of the Ghana Society of Animal Production (GSAP), pp 114-118.
Pampin, M. and Ruiz, C. (1998). Characterization of semi-rustic fowls. Broodiness. Revista Cubana de Ciencia Avicola, 22:1,69-71.

192
Panda, P.C. (1996). Egg and Poultry Technology. Textbook, Ram Printograph, Delhi, India. P 42. Permin, A., Pedersen, G. and Riise, J. C. (2000). Poultry as a Tool for Poverty Alleviation : Opportunities and Problems related to Poultry Production at Village Level. The Royal Veterinary and Agricultural University, Denmark. Poel, E.V., Hosseipoor, A. R., Jehu-Appiah, C., Vega, J. and Speybroek, N. (2007). Malnutrition and the disproportional burden on the poor: the case of Ghana. International Journal for Equity in Health, 6: 21. Ponapa, C.G., (1982). Eggs in child’s Nutrition. Poultry Advisor. 51 - 53. Quisumbing, A. R., L.R. Brown, H. S. Feldstein, L. Haddad, and C. Pena, (1995). Women, the key to food security. Food Policy Statement. Number.21.http:// www. cgiar.org/ifpri/fps/Fps 21.htm. Ramlah A. H. (2005). The Scope and Effect of Family Poultry Research and Development. Production aspects of village chicken in the South-East Asian Region. FAO 12653 Rauen, H. W. (1985). Effects of some major genes in chickens on productivity. Thesis, University of Berlin. Rauen, H. W., Horst, P. and Valle-Zarate, A (1986). Influence of the naked neck and frizzle genes on productive performance of birds under high ambient temperatures. Archive of Genetics. 50: 235-245. Reddy, V. B., Sharma, P. L. M. and Varadarajulu, P. (1965). The effect of breed, pre-incubation storage time and egg weight on hatchability of poultry eggs. Indian Veterinary Journal, 42: 438. Renkema, J. A. (1992). Economic aspects of nutrition in relation to environment and product quality of eggs and broilers. In Proceedings, 19th World Poultry Congress, Amsterdam, the Netherlands, 20–24 September 1992, Vol. 2, p. 465–471. Roberts, J. A. and Gunaratne, S. P. (1992). The scavenging feed resource base for village chickens in a developing country. In Proceedings, 19th World Poultry Congress, Amsterdam, the Netherlands. 20–24 September 1992, Vol. 1, p. 822–825. Samnang, H. (1998). Pasture versus integrated farming system as scavenging source for local and exotic chickens. Journal of Livestock Research for Rural Development, 10 (3) 1998. Shanawany, M. M. and Banerjee, A. K. (1991). Indigenous chicken genotypes of Ethiopia. Animal Genetic Resources Information, 8: 84 – 88.

193
Sharifi, A. R. (2006). Reproductive Adaptability of Naked neck, Frizzle and Dwarf Genotypes Under Different Temperatures. www. European Poultry Science.com. Sharp, P. J., Macnamee, M. C., Sterling, R. J., Lea, R. W., and Pedersen, H. C. (1988). Relationships between prolactin, LH and broody behaviour in bantam hens. Journal of Endocrinology. 118: 279–286. Simkova, A. (1962). The effect of age of hen on the quality of eggs for incubation on hatchability and on viability and production of the progeny. Animal Breeding Abstract, 32:122. Singh, C.V., Kumar, D. and Singh, Y.P. (1996). Potential usefulness of the plumage reducing Naked Neck (Na) gene in poultry production at normal and high ambient temperatures. World Poultry Science Journal. 57:139-156. Singh, B. D., Choudhuri, P., Chandra, P., Malik, S. and Singh, B. P. (1998). Effect of Naked Neck Gene on Broiler Performance of Two Populations in Tropical Climate. In: proceedings of 6th world congress on Genetics applied to livestock Production, Armidale, Australia. Pp 361-364. Somes, R.G., Jr., (1990). Mutations and major variants of plumage and skin in chickens In: Poultry Breeding and Genetics, 1990. Edited by R.D. Crawford. Pp 402-405.
Somes, R.G., Jr., (1988). International Registry of Poultry Genetic Stocks. Storrs Agricultural Experimental Station Bulletin, 476.
Sonaiya, E.B., Branckaert, R.D.S. and Guèye, E.F. (1999). Research and development options for family poultry. Introductory paper to the First INFPD/FAO electronic conference on family poultry, December, 1998 to July, 1999. Sorensen, P. (2003) Breeding Strategies in Poultry for Genetic Adaptation to the Organic Environment. Danish Institute of Agricultural Science, Dept of Animal Breeding and Genetics, Research Centre Foulum, DK-8830 Tjele, Denmark. Tlf.: (45) 88 89 13 03, Fax: (45) 88 99 13 00, Email: [email protected] Soukossi, A. (1992). Maggot production for fish and poultry production. Small scale poultry production, Bulletin, 9: 9–10, India.
Supramaniam, P. (1988). Economic importance of Newcastle disease vaccine to the village poultry industry in Malaysia. Proceedings Second Asian/Pacific Poultry Health Conference, 13-25 September, 1988, Surfers’ Paradise, Australia, 53: 511-516.
Todd, H., (1998). Women climbing out of poverty through credit: or what do cows have to do with it? Livestock Research for Rural Development. Vol. 10 (3): 1 - 3.

194
Tona, G.O. (1995). Incidence of worms in chickens on farms in Ikorodu Loal Government Area of Lagos State, Nigeria. African Network of Rural Poultry Development Newsletter, 5 (1). Trail, J.C.M. (1961). The indigenous poultry of Uganda. Poultry Science, 41: 1271.
United Nations’ Department of Economic and Social Affairs (UN/DESA) Population Division (2009). http://www.alertnet.org/db/cp/ghana.htm van Veluw, K. (1987). Traditional poultry keeping in Northern Ghana. ILEIA, 3(4). Veterinary Services Department-VSD (1998). Controlling New Castle Disease in Village Chicken. Accra Ghana. 12pp.
Ward, J. M., Houston, D. C., Ruxton, G. D., McCafferty, D. J. and Cook, P (2001). Thermal resistance of chicken (Gallus domesticus) plumage: a comparison between broiler and free-range birds British Poultry Science, 42: 558 - 563
Warren, D.C. (1933). Nine independently inherited autosomal factors in the domestic fowl. American Journal on Genetics, 18:68-81.
Weaver, W.D. (1996). Housing designs and structures to suit different climatic conditions. In Proceedings, 20th World Poultry Congress, New Delhi, India, 1–5 September 1996, Vol. 2, p. 617–620. Wilson, R.T. (1979). Studies on the livestock of Southern Darfur, Sudan. VII. Production of poultry under simulated traditional conditions. Tropical Animal Health Production, 11: 143 – 150. Wilson, R.T., Traore,A., Kuit, H.G. and Slingerland, M. (1987). Chick mortality in scavenging village chickens in Sri Lanka. Tropical Animal Health Production, 19: 229 –236. Wirsiy E. F. and Fonba E. S. (2005). Strategy For Improving Local Poultry Production In Rural Communities. CEPROCA NEWS No. 2949, 26-11-2005. World Health Organization-WHO (2000). Malnutrition in Africa. In: Awake magazine, May 8th 2000 edition, page 4. www.watchtower.org Yahav, S., Luger, D., Cahaner, A., Dotan, M., Rusal, M., Hurwitz, S. (1998). Thermoregulation in naked neck chickens subjected to different ambient temperatures. British Poultry Science, 39: 133-138. Yongolo, M.G.S. (1996). Epidemiology of Newcastle disease in village chickens in Tanzania. PhD dissertation, Sokoine University of Agriculture, Morogoro, United Republic of Tanzania.

195
Yoshimura, Y., Barua A., Heryanto B., Ohira H., and Zheng W. (1997). Reproductive physiology in domestic animals as a basic knowledge to improve poultry production in Asian countries. Journal of Agricultural Sciences. 41: 367 - 370.
Zadworny, D., Walton, J.S. and Etches, R.J. (1985). The relationship between plasma concentrations of prolactin and consumption of feed and water during the reproductive cycle of the domestic turkey. Poultry Science, 64: 401-410. Zadworny, D., Shimada, K., Ishida, H., Sumi, C. and Sato, K. (1988). Changes in plasma levels of prolactin and estradiol, nutrient intake, and time spent nesting during the incubation phase of broodiness in Chabo hen (Japanese bantam). Journal of Endocrinology 72: 132 - 135. Zaria, T., Sinha, P.K., Natiti, L.S. & Nawathe, D.R. (1993). Ectoparasites of domestic fowl in an arid zone. Thesis, African Network Young University. Provo, Utah.

196
APPENDIX
APPENDIX 1A: QUESTIONAIRE FOR STUDY ONE
TOPIC: ASSESSING THE CURRENT PERFORMANCE OF INDIGENOUS CHICKENS IN THE ASHANTI REGION OF GHANA
Town/Village…………………………………………………………………………. District………………………………………………………………………………… Name of Respondent…………………………………………………………………. Educational Background…………………………………………………………….. Main Occupation……………………………………………………………………... 1. When did you start rearing chickens?…………………………………………….......
2. How many birds do you have?........................................................................................
And how many of them are (a) cocks ………, (b) hens ……… and (c) chicks …........
3. Do you have naked neck birds? Yes ( ) No ( )
If yes , how many of them do you have?........................................................................
4. Do you have frizzle birds? Yes ( ) No ( )
If yes , how many of them do you have?........................................................................
5. What system of management do you use? Extensive ( ) Semi-intensive ( )
Intensive ( )
6. Do you give any feed supplement to your birds? Yes ( ) No ( )
If yes, how often do you give them? Everyday ( ) Once a week ( )
Two or more days within the week ( ) Occasionally ( )
7. What kind of feed supplement do you give them?……………………………………
8. What is the cost of the supplement per year?................................................................
9. Do you buy any verterinary drugs for the birds when they are sick? Yes ( ) No ( )
If yes, how much do you spend on the drugs per year?………………………………
10. Aside feed and drugs, do you incur any additional cost on the birds? Yes ( )
No ( ). If yes, how much do you spend per year?......................................................
11. What is the average weight of your cocks?................................................................
12. What is the average weight of your hens?...................................................................
13. What is the average weight of your chicks?................................................................
14. Do you sell some of your birds? Yes ( ) No ( )

197
If yes, how much do you sell: (a) one hen?................... and (b) one cock…………
And on the average, how many birds do you sell within a year?.............................
15. What is the criteria for pricing?...................................................................................
16. How many layers do you have?....................................................................................
17. What is the average clutch size of your layers?..........................................................
18. What is the average eggs per clutch of your layers?..................................................
19. What is the average eggs per bird per year of your layers?………………………..
20. What is the average weight of an egg from your layers?...........................................
21. How do your layers brood? (a) Good brooders ( ) (b) Poor brooders ( )
22. What percentage of eggs set is normally hatched?.....................................................
23. What percentage of chicks normally survives to adulthood? ……………………...
24. What are the symptoms of diseases that normally attack your birds?……………
………………………………………………………………………………………….
25. What is the mortalities per year? ……………………………………………………
26. Aside diseases, what are the other causes of mortalities (in descending order)?
……………………………………………………………………………………………
27. Why do you keep indigenous chickens? ……………………………………………..
………………………………………………………………………………………….
28. What are some of the problems that hinder you from getting the maximum
benefit (in descending order)?
29. Are you satisfied with what you gain from keeping the chickens? Yes ( ) No ( )
If No, what do you think should be done to improve local chicken production?
……………………………………………………………………………………………
……………………………………………………………………………………………

198
APPENDIX 1B: QUESTIONAIRE FOR STUDY TWO TOPIC: EVALUATING THE POTENTIALS OF INDIGENOUS NAKED NECK (NaNa ,Nana) AND FRIZZLE (FF, Ff) CHICKENS IN THE ASHANTI REGION
OF GHANA Town/Village…………………………………………………………………………. District………………………………………………………………………………… Name of Respondent…………………………………………………………………. Educational Background…………………………………………………………….. Main Occupation……………………………………………………………………... 1. How many birds do you have?........................................................................................
And how many of them are (a) naked neck ………….. , (b) frizzle ………………….
and (c) normal feathered …............................
Naked Neck Birds (Nana)
2. What is the average weight of your Nana cocks?...........................................................
3. What is the average weight of your Nana hens?.............................................................
4. What is the average weight of your Nana chicks?.........................................................
5. How many Nana layers do you have?............................................................................
6. What is the average clutch size of your Nana layers?....................................................
7. What is the average eggs per clutch of your Nana layers?.............................................
8. What is the average eggs per bird per year of your Nana layers?……………………
9. What is the average weight of an egg from your Nana layers?......................................
10. What percentage of eggs from Nana layers is normally hatched?................................
11. What percentage of Nana chicks normally survives to adulthood? ………………….
12. What is the percentage mortality per year for Nana birds? …………………………
Frizzle Birds (Ff) 13. What is the average weight of your Ff cocks?.............................................................
14. What is the average weight of your Ff hens?.............................................................
15. What is the average weight of your Ff chicks?.........................................................
16. How many Ff layers do you have?............................................................................
17. What is the average clutch size of your Ff layers?....................................................
18. What is the average eggs per clutch of your Ff layers?.............................................
19. What is the average eggs per bird per year of your Ff layers?……………………

199
20. What is the average weight of an egg from your Ff layers?......................................
21. What percentage of eggs from Ff layers is normally hatched?..................................
22. What percentage of Ff chicks normally survives to adulthood? ………………….
23. What is the percentage mortality per year for Ff birds? ……………………………
Normal Feathered Birds (nana/ff)
24. What is the average weight of your nana/ff cocks?.......................................................
25. What is the average weight of your nana/ff hens?........................................................
26. What is the average weight of your nana/ff chicks?.....................................................
27. How many nana/ff layers do you have?........................................................................
28. What is the average clutch size of your nana/ff layers?................................................
29. What is the average eggs per clutch of your nana/ff layers?.........................................
30. What is the average eggs per bird per year of your nana/ff layers?…………………..
31. What is the average weight of an egg from your nana/ff layers?..................................
32. What percentage of eggs from nana/ff layers is normally hatched?.............................
33. What percentage of nana/ff chicks normally survives to adulthood? ………………
34. What is the percentage mortality per year for nana/ff birds? ………………………

200
APPENDIX 2: ANOVA TABLES Experiment Two: Survey on Local Naked neck and Frizzle Birds Variate: Flock Size Source of variation d.f. s.s. m.s. v.r. F pr. District 2 456.000 228.000 41.88 <.001 Phenotype 2 0.000 0.000 0.00 1.000 District.Phenotype 4 0.000 0.000 0.00 1.000 Residual 18 98.000 5.444 Total 26 554.000 Variate: % Phenotype within a Flock Source of variation d.f. s.s. m.s. v.r. F pr. District 2 0.000 0.000 0.00 1.000 Phenotype 2 27450.000 13725.000 5146.88 <.001 District.Phenotype 4 408.000 102.000 38.25 <.001 Residual 18 48.000 2.667 Total 26 27906.000 Variate: Average Weight of Chicks (g) Source of variation d.f. s.s. m.s. v.r. F pr. District 2 16.258200 8.129100 6417.71 <.001 Phenotype 2 19.224800 9.612400 7588.74 <.001 District.Phenotype 4 16.089400 4.022350 3175.54 <.001 Residual 18 0.022800 0.001267 Total 26 51.595200 Variate: Average Weight of Cocks (kg) Source of variation d.f. s.s. m.s. v.r. F pr. District 2 0.101267 0.050633 9.10 0.002 Phenotype 2 0.024067 0.012033 2.16 0.144 District.Phenotype 4 0.002133 0.000533 0.10 0.983 Residual 18 0.100200 0.005567 Total 26 0.227667 Variate: Average Weight of Hens (kg) Source of variation d.f. s.s. m.s. v.r. F pr. District 2 0.01307 0.00653 0.42 0.664 Phenotype 2 0.32107 0.16053 10.29 0.001 District.Phenotype 4 0.07413 0.01853 1.19 0.350 Residual 18 0.28080 0.01560 Total 26 0.68907

201
Laying Performance Variate: Eggs Per clutch Source of variation d.f. s.s. m.s. v.r. F pr. District 2 2.667 1.333 1.33 0.288 Phenotype 2 162.667 81.333 81.33 <.001 District.Phenotype 4 3.333 0.833 0.83 0.522 Residual 18 18.000 1.000 Total 26 186.667 Variate: Clutches Per Year Source of variation d.f. s.s. m.s. v.r. F pr. District 2 0.18667 0.09333 7.00 0.006 Phenotype 2 0.04667 0.02333 1.75 0.202 District.Phenotype 4 0.05333 0.01333 1.00 0.433 Residual 18 0.24000 0.01333 Total 26 0.52667 Variate: Eggs Per Bird Per Year Source of variation d.f. s.s. m.s. v.r. F pr. District 2 8.667 4.333 4.33 0.029 Phenotype 2 1644.667 822.333 822.33 <.001 District.Phenotype 4 21.333 5.333 5.33 0.005 Residual 18 18.000 1.000 Total 26 1692.667 Variate: Hatchability (%) Source of variation d.f. s.s. m.s. v.r. F pr. District 2 104.667 52.333 10.47 <.001 Phenotype 2 72.667 36.333 7.27 0.005 District.Phenotype 4 25.333 6.333 1.27 0.319 Residual 18 90.000 5.000 Total 26 292.667 Variate: Average Weight of Eggs (g) Source of variation d.f. s.s. m.s. v.r. F pr. District 2 20.2881 10.1440 91.22 <.001 Phenotype 2 57.5701 28.7850 258.86 <.001 District.Phenotype 4 2.5157 0.6289 5.66 0.004 Residual 18 2.0016 0.1112 Total 26 82.3755 Variate: Average Albumen Height (mm) Source of variation d.f. s.s. m.s. v.r. F pr. District 2 0.3172667 0.1586333 1586.33 <.001 Phenotype 2 0.6304667 0.3152333 3152.33 <.001 District.Phenotype 4 0.5001333 0.1250333 1250.33 <.001 Residual 18 0.0018000 0.0001000 Total 26 1.4496667

202
Variate: Haugh Unit (%) Source of variation d.f. s.s. m.s. v.r. F pr. District 2 42.667 21.333 21.33 <.001 Phenotype 2 290.667 145.333 145.33 <.001 District.Phenotype 4 3.333 0.833 0.83 0.522 Residual 18 18.000 1.000 Total 26 354.667 Variate: Shell Thickness (mm) Source of variation d.f. s.s. m.s. v.r. F pr. District 2 0.0004667 0.0002333 1.75 0.202 Phenotype 2 0.0020667 0.0010333 7.75 0.004 District.Phenotype 4 0.0003333 0.0000833 0.62 0.651 Residual 18 0.0024000 0.0001333 Total 26 0.0052667 Variate: Yolk Height (mm) Source of variation d.f. s.s. m.s. v.r. F pr. District 2 1.85407 0.92704 18.40 <.001 Phenotype 2 2.89407 1.44704 28.73 <.001 District.Phenotype 4 1.22815 0.30704 6.10 0.003 Residual 18 0.90667 0.05037 Total 26 6.88296 Variate: Yolk Diameter (mm) Source of variation d.f. s.s. m.s. v.r. F pr. District 2 88.667 44.333 33.25 <.001 Phenotype 2 116.667 58.333 43.75 <.001 District.Phenotype 4 21.333 5.333 4.00 0.017 Residual 18 24.000 1.333 Total 26 250.667 Variate: Yolk Colour Score Source of variation d.f. s.s. m.s. v.r. F pr. District 2 2.667 1.333 1.09 0.357 Phenotype 2 2.667 1.333 1.09 0.357 District.Phenotype 4 3.333 0.833 0.68 0.614 Residual 18 22.000 1.222 Total 26 30.667 Mortality Variate: Chick Mortality (%) Source of variation d.f. s.s. m.s. v.r. F pr. District 2 114.000 57.000 42.75 <.001 Phenotype 2 62.000 31.000 23.25 <.001 District.Phenotype 4 10.000 2.500 1.88 0.159 Residual 18 24.000 1.333 Total 26 210.000

203
Variate: Total Mortality (%) Source of variation d.f. s.s. m.s. v.r. F pr. District 2 168.000 84.000 84.00 <.001 Phenotype 2 776.000 388.000 388.00 <.001 District.Phenotype 4 64.000 16.000 16.00 <.001 Residual 18 18.000 1.000 Total 26 1026.000 Carcass Performance Variate: Defeathered Weight as % of Live Weight Source of variation d.f. s.s. m.s. v.r. F pr. District 2 0.464 0.232 1160.67 <.001 Phenotype 2 1.186 5.930 2.965 <.001 District.Phenotype 4 6.559 1.640 8198.17 <.001 Residual 18 0.360 0.200 Total 26 1.256 Variate: Eviscerated Weight as % of Live Weight Source of variation d.f. s.s. m.s. v.r. F pr. District 2 4.0491 2.0245 9.10 0.002 Phenotype 2 88.5195 44.2597 198.99 <.001 District.Phenotype 4 11.8023 2.9506 13.27 <.001 Residual 18 4.0036 0.2224 Total 26 108.3745 Variate: Dressed Weight as % of Live Weight Source of variation d.f. s.s. m.s. v.r. F pr. District 2 1.1008667 0.5504333 3302.60 <.001 Phenotype 2 84.9968667 42.4984333 2.550 <.001 District.Phenotype 4 12.0181333 3.0045333 1.803 <.001 Residual 18 0.0030000 0.0001667 Total 26 98.1188667 Variate: Thigh and Drumstick Weight as a % of Live Weight Source of variation d.f. s.s. m.s. v.r. F pr. District 2 2.7168000 1.3584000 8150.40 <.001 Phenotype 2 0.7706000 0.3853000 2311.80 <.001 District.Phenotype 4 1.4338000 0.3584500 2150.70 <.001 Residual 18 0.0030000 0.0001667 Total 26 4.9242000 Variate: Chest Muscle Weight as a % of Live Weight Source of variation d.f. s.s. m.s. v.r. F pr. District 2 3.2558000 1.6279000 9767.40 <.001 Phenotype 2 67.4538000 33.7269000 2.024 <.001 District.Phenotype 4 2.9602000 0.7400500 4440.30 <.001 Residual 18 0.0030000 0.0001667 Total 26 73.6728000

204
Variate: Wings Weight as a % of Live Weight Source of variation d.f. s.s. m.s. v.r. F pr. District 2 1.8749 0.9374 1.69 0.213 Phenotype 2 0.2289 0.1144 0.21 0.816 District.Phenotype 4 1.3069 0.3267 0.59 0.676 Residual 18 10.0026 0.5557 Total 26 13.4133 Variate: Intestines Weight as a % of Live Weight Source of variation d.f. s.s. m.s. v.r. F pr. District 2 0.112867 0.056433 24.54 <.001 Phenotype 2 0.205067 0.102533 44.58 <.001 District.Phenotype 4 0.017733 0.004433 1.93 0.149 Residual 18 0.041400 0.002300 Total 26 0.377067 Variate: Gizzard Weight as a % of Live Weight Source of variation d.f. s.s. m.s. v.r. F pr. District 2 0.414067 0.207033 90.01 <.001 Phenotype 2 1.021667 0.510833 222.10 <.001 District.Phenotype 4 0.427733 0.106933 46.49 <.001 Residual 18 0.041400 0.002300 Total 26 1.904867 Variate: Heart Weight as a % of Live Weight Source of variation d.f. s.s. m.s. v.r. F pr. District 2 0.0340667 0.0170333 170.33 <.001 Phenotype 2 0.0970667 0.0485333 485.33 <.001 District.Phenotype 4 0.0255333 0.0063833 63.83 <.001 Residual 18 0.0018000 0.0001000 Total 26 0.1584667 Variate: Liver Weigght as a % of Live Weight Source of variation d.f. s.s. m.s. v.r. F pr. District 2 0.0481407 0.0240704 209.65 <.001 Phenotype 2 0.0909407 0.0454704 396.03 <.001 District.Phenotype 4 0.0742815 0.0185704 161.74 <001 Residual 18 0.0020667 0.0001148 Total 26 0.2154296 Experiment Three: Comparative Studies on F1 Naked neck and Frizzle Birds Growth Performance Variate: Body Weight at Day-old Source of variation d.f. s.s. m.s. v.r. F pr. Sire_Line 3 182.3185 60.7728 485.70 <.001 Phenotype 1 13.6353 13.6353 108.97 <.001 Sire_Line.Phenotype 3 5.0905 1.6968 13.56 <.001 Residual 16 2.0020 0.1251 Total 23 203.0464

205
Variate: Body Weight at Week 1 Source of variation d.f. s.s. m.s. v.r. F pr. Sire_Line 3 31.636912 10.545637 4036.61 <.001 Phenotype 1 29.106037 29.106037 1.114 <.001 Sire_Line.Phenotype 3 7.363913 2.454638 939.57 <.001 Residual 16 0.041800 0.002613 Total 23 68.148663 Variate: Body Weight Gain at Week 1 Source of variation d.f. s.s. m.s. v.r. F pr. Sire_Line 3 73.590450 24.530150 1.784E <.001 Phenotype 1 2.898150 2.898150 2107.75 <.001 Sire_Line.Phenotype 3 3.266850 1.088950 791.96 <.001 Residual 16 0.022000 0.001375 Total 23 79.777450 Variate: Body Weight at Week 2 Source of variation d.f. s.s. m.s. v.r. F pr. Sire_Line 3 1.294 4.312 1.674 <.001 Phenotype 1 1.574 1.574 6.114 <.001 Sire_Line.Phenotype 3 5.518 1.839 7143.55 <.001 Residual 16 0.412 0.257 Total 23 1.506 Variate: Body Weight Gain at Week 2 Source of variation d.f. s.s. m.s. v.r. F pr. Sire_Line 3 1.676 5.587 4.858 <.001 Phenotype 1 5.116 5.116 4.449 <.001 Sire_Line.Phenotype 3 1.013 3.376 2.936 <.001 Residual 16 0.184 0.115 Total 23 1.828 Variate: Body Weight at Week 3 Source of variation d.f. s.s. m.s. v.r. F pr. Sire_Line 3 2.853 9.510 7.111 <.001 Phenotype 1 2.768 2.768 2.070 <.001 Sire_Line.Phenotype 3 3.066 1.022 7640.18 <.001 Residual 16 0.214 0.134 Total 23 3.161 Variate: Body Weight Gain at Week 3 Source of variation d.f. s.s. m.s. v.r. F pr. Sire_Line 3 3502.4570 1167.4857 9305.46 <.001 Phenotype 1 16.7334 16.7334 133.37 <.001 Sire_Line.Phenotype 3 155.8791 51.9597 414.15 <.001 Residual 16 2.0074 0.1255 Total 23 3677.0769

206
Variate: Body Weight at Week 4 Source of variation d.f. s.s. m.s. v.r. F pr. Sire_Line 3 6.625 2.208 2.208 <.001 Phenotype 1 5.104 5.104 5.104 <.001 Sire_Line.Phenotype 3 2.281 7.604 7.604 <.001 Residual 16 0.160 0.100 Total 23 1.401 Variate: Body Weight Gain at Week 4 Source of variation d.f. s.s. m.s. v.r. F pr. Sire_Line 3 1.391 4.636 1.801 <.001 Phenotype 1 3.004 3.004 1.167 <.001 Sire_Line.Phenotype 3 2.198 7.325 2.845 <.001 Residual 16 0.412 0.258 Total 23 6.592 Variate: Body Weight at Week 5 Source of variation d.f. s.s. m.s. v.r. F pr. Sire_Line 3 1.442 4.806 4.806 <.001 Phenotype 1 6.376 6.376 6.376 <.001 Sire_Line.Phenotype 3 2.099 6.998 6.998 <.001 Residual 16 0.160 1.000 Total 23 2.289 Variate: Body Weight Gain at Week 5 Source of variation d.f. s.s. m.s. v.r. F pr. Sire_Line 3 1.598 5.328 3.674 <.001 Phenotype 1 6.956 6.956 4.798 <.001 Sire_Line.Phenotype 3 9.444 3.148 2.171 <.001 Residual 16 0.232 0.145 Total 23 2.612 Variate: Body Weight at Week 6 Source of variation d.f. s.s. m.s. v.r. F pr. Sire_Line 3 5.575 1.858 1.858 <.001 Phenotype 1 9.299 9.299 9.299 <.001 Sire_Line.Phenotype 3 3.469 1.156 1.156 <.001 Residual 16 0.160 0.100 Total 23 1.834 Variate: Body Weight Gain at Week 6 Source of variation d.f. s.s. m.s. v.r. F pr. Sire_Line 3 3.115 1.038 3.611 <.001 Phenotype 1 2.768 2.768 9.629 <.001 Sire_Line.Phenotype 3 6.736 2.245 7.809 <.001 Residual 16 0.460 0.288 Total 23 4.065

207
Variate: Chick Mortality (%) Source of variation d.f. s.s. m.s. v.r. F pr. Sire_Line 3 0.00458 0.00153 0.02 0.995 Phenotype 1 0.03375 0.03375 0.52 0.480 Sire_Line.Phenotype 3 0.01458 0.00486 0.08 0.972 Residual 16 1.03333 0.06458 Total 23 1.0862 Variate: Body Weight at Week 7 Source of variation d.f. s.s. m.s. v.r. F pr. Batch stratum 4 956 239 0.00 Sex stratum 1 336297 336297 2.12 Batch.Sex stratum 4 635848 158962 155.59 Batch.Sex.*Units* stratum Village 2 48690 24345 23.83 <.001 Sire_Line 3 55602 18534 18.14 <.001 Phenotype 1 229417 229417 224.54 <.001 Village.Sire_Line 6 35685 5947 5.82 <.001 Village.Phenotype 2 3336 1668 1.63 0.196 Sire_Line.Phenotype 3 32971 10990 10.76 <.001 Village.Sire_Line.Phenotype 6 23154 3859 3.78 0.001 Residual 687 701907 1022 Total 719 2103864 Variate: Body Weight at Week 8 Source of variation d.f. s.s. m.s. v.r. F pr. Batch stratum 4 1013 253 0.00 Sex stratum 1 435324 435324 2.15 Batch.Sex stratum 4 808854 202214 139.56 Village 2 31715 15858 10.94 <.001 Sire_Line 3 65641 21880 15.10 <.001 Phenotype 1 378710 378710 261.38 <.001 Village.Sire_Line 6 52474 8746 6.04 <.001 Village.Phenotype 2 2216 1108 0.76 0.466 Sire_Line.Phenotype 3 29111 9704 6.70 <.001 Village.Sire_Line.Phenotype 6 20226 3371 2.33 0.031 Residual 687 995390 1449 Total 719 2820675 Variate: Body Weight at Week Gain Week 8 Source of variation d.f. s.s. m.s. v.r. F pr. Batch stratum 4 59.07 14.77 0.00 Sex stratum 1 7562.16 7562.16 2.15 Batch.Sex stratum 4 14041.11 3510.28 44.37 Batch.Sex.*Units* stratum Village 2 5058.00 2529.00 31.97 <.001 Sire_Line 3 1299.27 433.09 5.47 0.001 Phenotype 1 24512.84 24512.84 309.84 <.001 Village.Sire_Line 6 4211.22 701.87 8.87 <.001 Village.Phenotype 2 3436.33 1718.17 21.72 <.001 Sire_Line.Phenotype 3 1227.18 409.06 5.17 0.002 Village.Sire_Line.Phenotype 6 753.70 125.62 1.59 0.148 Residual 687 54351.03 79.11 Total 719 116511.91

208
Variate: Body Weight at Week 9 Source of variation d.f. s.s. m.s. v.r. F pr. Batch stratum 4 2078 519 0.00 Sex stratum 1 640414 640414 2.12 Batch.Sex stratum 4 1207855 301964 189.61 Batch.Sex.*Units* stratum Village 2 23017 11509 7.23 <.001 Sire_Line 3 91771 30590 19.21 <.001 Phenotype 1 731227 731227 459.14 <.001 Village.Sire_Line 6 80275 13379 8.40 <.001 Village.Phenotype 2 6781 3391 2.13 0.120 Sire_Line.Phenotype 3 35801 11934 7.49 <.001 Village.Sire_Line.Phenotype 6 26874 4479 2.81 0.010 Residual 687 1094111 1593 Total 719 3940204 Variate: Body Weight gain at Week 9 Source of variation d.f. s.s. m.s. v.r. F pr. Batch stratum 4 122.7 30.7 0.00 Sex stratum 1 16807.4 16807.4 2.15 Batch.Sex stratum 4 31304.5 7826.1 49.49 Batch.Sex.*Units* stratum Village 2 2772.0 1386.0 8.76 <.001 Sire_Line 3 1442.0 480.7 3.04 0.028 Phenotype 1 45318.4 45318.4 286.58 <.001 Village.Sire_Line 6 6583.9 1097.3 6.94 <.001 Village.Phenotype 2 2595.7 1297.9 8.21 <.001 Sire_Line.Phenotype 3 184.1 61.4 0.39 0.762 Village.Sire_Line.Phenotype 6 619.8 103.3 0.65 0.688 Residual 687 108639.4 158.1 Total 719 216389.9 Variate: Body Weight at Week 10 Source of variation d.f. s.s. m.s. v.r. F pr. Batch stratum 4 3195 799 0.00 Sex stratum 1 925253 925253 2.13 Batch.Sex stratum 4 1740551 435138 179.25 Batch.Sex.*Units* stratum Village 2 23605 11802 4.86 0.008 Sire_Line 3 103934 34645 14.27 <.001 Phenotype 1 1267662 1267662 522.19 <.001 Village.Sire_Line 6 119806 19968 8.23 <.001 Village.Phenotype 2 19139 9570 3.94 0.020 Sire_Line.Phenotype 3 38739 12913 5.32 0.001 Village.Sire_Line.Phenotype 6 40197 6700 2.76 0.012 Residual 687 1667756 2428 Total 719 5949835

209
Variate: Body Weight gain at Week WG10 Source of variation d.f. s.s. m.s. v.r. F pr. Batch stratum 4 192.2 48.1 0.00 Sex stratum 1 26405.9 26405.9 2.18 Batch.Sex stratum 4 48430.6 12107.6 50.61 Batch.Sex.*Units* stratum Village 2 7000.0 3500.0 14.63 <.001 Sire_Line 3 816.3 272.1 1.14 0.333 Phenotype 1 60876.4 60876.4 254.46 <.001 Village.Sire_Line 6 8177.1 1362.8 5.70 <.001 Village.Phenotype 2 8456.3 4228.2 17.67 <.001 Sire_Line.Phenotype 3 273.0 91.0 0.38 0.767 Village.Sire_Line.Phenotype 6 1428.6 238.1 1.00 0.427 Residual 687 164356.0 239.2 Total 719 326412.4 Variate: Body Weight at Week 11 Source of variation d.f. s.s. m.s. v.r. F pr. Batch stratum 4 5569 1392 0.00 Sex stratum 1 1329122 1329122 2.15 Batch.Sex stratum 4 2471526 617881 161.32 Batch.Sex.*Units* stratum Village 2 31603 15802 4.13 0.017 Sire_Line 3 116827 38942 10.17 <.001 Phenotype 1 2068550 2068550 540.08 <.001 Village.Sire_Line 6 185837 30973 8.09 <.001 Village.Phenotype 2 53311 26655 6.96 0.001 Sire_Line.Phenotype 3 40554 13518 3.53 0.015 Village.Sire_Line.Phenotype 6 47871 7979 2.08 0.053 Residual 687 2631250 3830 Total 719 8982021 Variate: Body Weight gain at Week 11 Source of variation d.f. s.s. m.s. v.r. F pr. Batch stratum 4 456.7 114.2 0.01 Sex stratum 1 36614.0 36614.0 2.26 Batch.Sex stratum 4 64764.9 16191.2 59.56 Batch.Sex.*Units* stratum Village 2 8627.5 4313.8 15.87 <.001 Sire_Line 3 549.1 183.0 0.67 0.569 Phenotype 1 100368.5 100368.5 369.23 <.001 Village.Sire_Line 6 11948.2 1991.4 7.33 <.001 Village.Phenotype 2 10711.0 5355.5 19.70 <.001 Sire_Line.Phenotype 3 173.8 57.9 0.21 0.887 Village.Sire_Line.Phenotype 6 920.5 153.4 0.56 0.759 Residual 687 186750.3 271.8 Total 719 421884.5

210
Variate: Body Weight at Week 12 Source of variation d.f. s.s. m.s. v.r. F pr. Batch stratum 4 7630 1907 0.00 Sex stratum 1 1763522 1763522 2.17 Batch.Sex stratum 4 3255329 813832 132.04 Batch.Sex.*Units* stratum Village 2 74190 37095 6.02 0.003 Sire_Line 3 144914 48305 7.84 <.001 Phenotype 1 3256978 3256978 528.41 <.001 Village.Sire_Line 6 257667 42944 6.97 <.001 Village.Phenotype 2 132769 66385 10.77 <.001 Sire_Line.Phenotype 3 28052 9351 1.52 0.209 Village.Sire_Line.Phenotype 6 73856 12309 2.00 0.064 Residual 687 4234446 6164 Total 719 13229352 Variate: Body Weight Gain at Week 12 Source of variation d.f. s.s. m.s. v.r. F pr. Batch stratum 4 322.6 80.7 0.00 Sex stratum 1 40012.0 40012.0 2.26 Batch.Sex stratum 4 70946.3 17736.6 55.04 Batch.Sex.*Units* stratum Village 2 35740.9 17870.5 55.46 <.001 Sire_Line 3 395.1 131.7 0.41 0.747 Phenotype 1 106627.5 106627.5 330.91 <.001 Village.Sire_Line 6 11166.9 1861.1 5.78 <.001 Village.Phenotype 2 11821.7 5910.8 18.34 <.001 Sire_Line.Phenotype 3 681.0 227.0 0.70 0.550 Village.Sire_Line.Phenotype 6 1466.7 244.5 0.76 0.603 Residual 687 221370.0 322.2 Total 719 500550.7 Variate: Body Weight at Week 13 Source of variation d.f. s.s. m.s. v.r. F pr. Batch stratum 4 8715 2179 0.00 Sex stratum 1 2203954 2203954 2.17 Batch.Sex stratum 4 4066955 1016739 110.06 Batch.Sex.*Units* stratum Village 2 238161 119081 12.89 <.001 Sire_Line 3 218127 72709 7.87 <.001 Phenotype 1 4576207 4576207 495.34 <.001 Village.Sire_Line 6 390671 65112 7.05 <.001 Village.Phenotype 2 288782 144391 15.63 <.001 Sire_Line.Phenotype 3 34932 11644 1.26 0.287 Village.Sire_Line.Phenotype 6 152174 25362 2.75 0.012 Residual 687 6346810 9238 Total 719 18525488
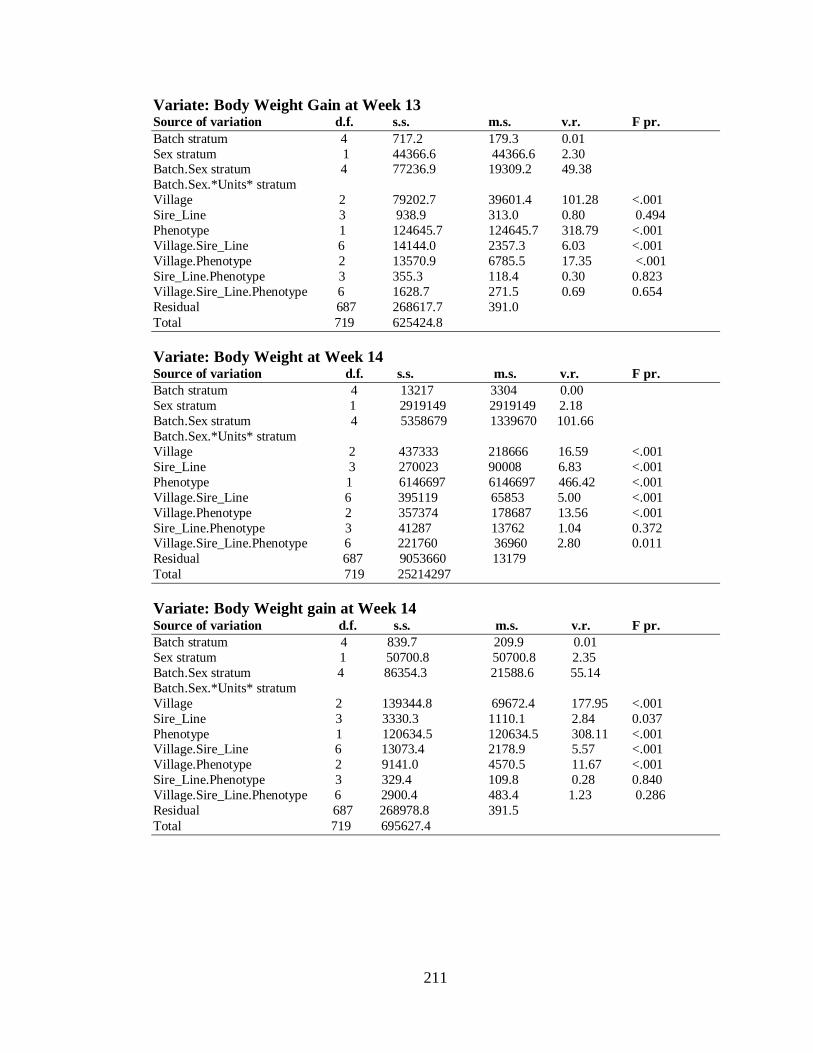
211
Variate: Body Weight Gain at Week 13 Source of variation d.f. s.s. m.s. v.r. F pr. Batch stratum 4 717.2 179.3 0.01 Sex stratum 1 44366.6 44366.6 2.30 Batch.Sex stratum 4 77236.9 19309.2 49.38 Batch.Sex.*Units* stratum Village 2 79202.7 39601.4 101.28 <.001 Sire_Line 3 938.9 313.0 0.80 0.494 Phenotype 1 124645.7 124645.7 318.79 <.001 Village.Sire_Line 6 14144.0 2357.3 6.03 <.001 Village.Phenotype 2 13570.9 6785.5 17.35 <.001 Sire_Line.Phenotype 3 355.3 118.4 0.30 0.823 Village.Sire_Line.Phenotype 6 1628.7 271.5 0.69 0.654 Residual 687 268617.7 391.0 Total 719 625424.8 Variate: Body Weight at Week 14 Source of variation d.f. s.s. m.s. v.r. F pr. Batch stratum 4 13217 3304 0.00 Sex stratum 1 2919149 2919149 2.18 Batch.Sex stratum 4 5358679 1339670 101.66 Batch.Sex.*Units* stratum Village 2 437333 218666 16.59 <.001 Sire_Line 3 270023 90008 6.83 <.001 Phenotype 1 6146697 6146697 466.42 <.001 Village.Sire_Line 6 395119 65853 5.00 <.001 Village.Phenotype 2 357374 178687 13.56 <.001 Sire_Line.Phenotype 3 41287 13762 1.04 0.372 Village.Sire_Line.Phenotype 6 221760 36960 2.80 0.011 Residual 687 9053660 13179 Total 719 25214297 Variate: Body Weight gain at Week 14 Source of variation d.f. s.s. m.s. v.r. F pr. Batch stratum 4 839.7 209.9 0.01 Sex stratum 1 50700.8 50700.8 2.35 Batch.Sex stratum 4 86354.3 21588.6 55.14 Batch.Sex.*Units* stratum Village 2 139344.8 69672.4 177.95 <.001 Sire_Line 3 3330.3 1110.1 2.84 0.037 Phenotype 1 120634.5 120634.5 308.11 <.001 Village.Sire_Line 6 13073.4 2178.9 5.57 <.001 Village.Phenotype 2 9141.0 4570.5 11.67 <.001 Sire_Line.Phenotype 3 329.4 109.8 0.28 0.840 Village.Sire_Line.Phenotype 6 2900.4 483.4 1.23 0.286 Residual 687 268978.8 391.5 Total 719 695627.4

212
Variate: Body Weight at Week 15 Source of variation d.f. s.s. m.s. v.r. F pr. Batch stratum 4 17810 4452 0.00 Sex stratum 1 3663680 3663680 2.21 Batch.Sex stratum 4 6644307 1661077 96.32 Batch.Sex.*Units* stratum Village 2 973983 486991 28.24 <.001 Sire_Line 3 337234 112411 6.52 <.001 Phenotype 1 7887680 7887680 457.37 <.001 Village.Sire_Line 6 488394 81399 4.72 <.001 Village.Phenotype 2 453020 226510 13.13 <.001 Sire_Line.Phenotype 3 46394 15465 0.90 0.442 Village.Sire_Line.Phenotype 6 232626 38771 2.25 0.037 Residual 687 11847807 17246 Total 719 32592933 Variate: Body Weight Gain at Week 15 Source of variation d.f. s.s. m.s. v.r. F pr. Batch stratum 4 689.7 172.4 0.01 Sex stratum 1 39083.9 39083.9 2.34 Batch.Sex stratum 4 66846.0 16711.5 37.43 Batch.Sex.*Units* stratum Village 2 113049.5 56524.7 126.61 <.001 Sire_Line 3 7396.4 2465.5 5.52 <.001 Phenotype 1 137626.5 137626.5 308.26 <.001 Village.Sire_Line 6 7528.0 1254.7 2.81 0.010 Village.Phenotype 2 4950.8 2475.4 5.54 0.004 Sire_Line.Phenotype 3 1238.4 412.8 0.92 0.428 Village.Sire_Line.Phenotype 6 3537.3 589.5 1.32 0.245 Residual 687 306718.1 446.5 Total 719 688664.5 Variate: Body Weight at Week 16 Source of variation d.f. s.s. m.s. v.r. F pr. Batch stratum 4 26034 6509 0.00 Sex stratum 1 4487992 4487992 2.22 Batch.Sex stratum 4 8077003 2019251 87.51 Batch.Sex.*Units* stratum Village 2 1630602 815301 35.33 <.001 Sire_Line 3 404284 134761 5.84 <.001 Phenotype 1 10414853 10414853 451.35 <.001 Village.Sire_Line 6 611721 101953 4.42 <.001 Village.Phenotype 2 629131 314565 13.63 <.001 Sire_Line.Phenotype 3 61714 20571 0.89 0.445 Village.Sire_Line.Phenotype 6 252414 42069 1.82 0.092 Residual 687 15852377 23075 Total 719 42448124
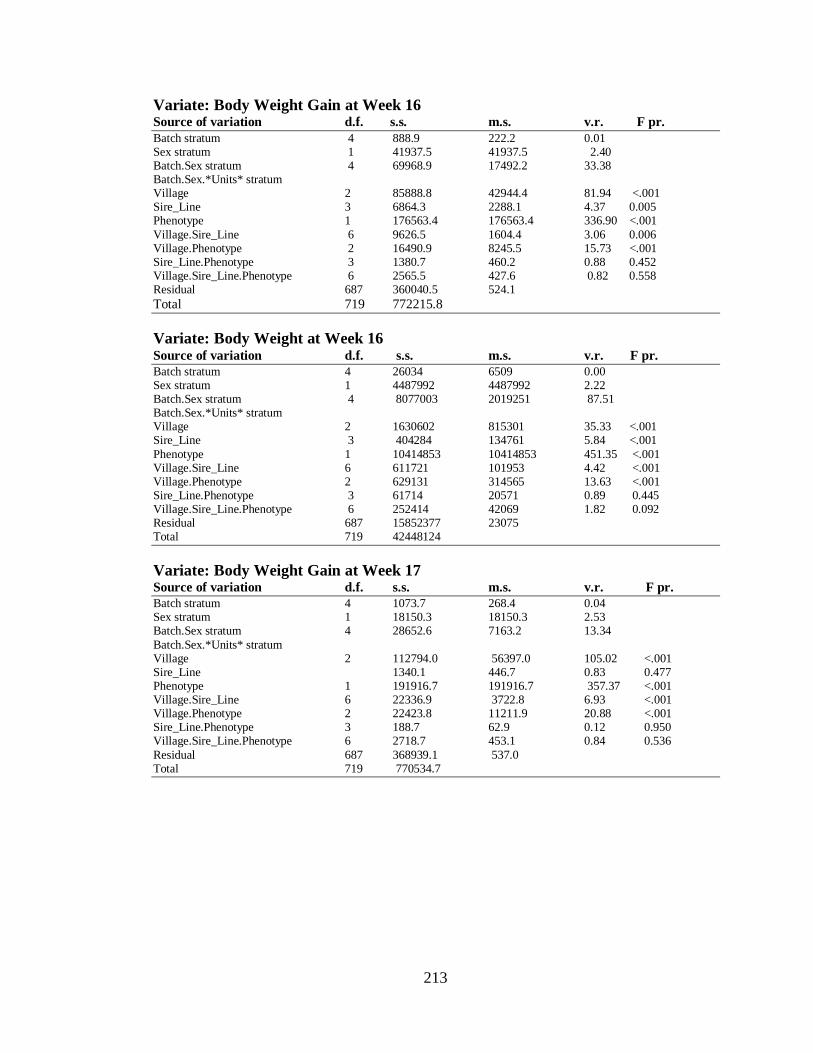
213
Variate: Body Weight Gain at Week 16 Source of variation d.f. s.s. m.s. v.r. F pr. Batch stratum 4 888.9 222.2 0.01 Sex stratum 1 41937.5 41937.5 2.40 Batch.Sex stratum 4 69968.9 17492.2 33.38 Batch.Sex.*Units* stratum Village 2 85888.8 42944.4 81.94 <.001 Sire_Line 3 6864.3 2288.1 4.37 0.005 Phenotype 1 176563.4 176563.4 336.90 <.001 Village.Sire_Line 6 9626.5 1604.4 3.06 0.006 Village.Phenotype 2 16490.9 8245.5 15.73 <.001 Sire_Line.Phenotype 3 1380.7 460.2 0.88 0.452 Village.Sire_Line.Phenotype 6 2565.5 427.6 0.82 0.558 Residual 687 360040.5 524.1 Total 719 772215.8 Variate: Body Weight at Week 16 Source of variation d.f. s.s. m.s. v.r. F pr. Batch stratum 4 26034 6509 0.00 Sex stratum 1 4487992 4487992 2.22 Batch.Sex stratum 4 8077003 2019251 87.51 Batch.Sex.*Units* stratum Village 2 1630602 815301 35.33 <.001 Sire_Line 3 404284 134761 5.84 <.001 Phenotype 1 10414853 10414853 451.35 <.001 Village.Sire_Line 6 611721 101953 4.42 <.001 Village.Phenotype 2 629131 314565 13.63 <.001 Sire_Line.Phenotype 3 61714 20571 0.89 0.445 Village.Sire_Line.Phenotype 6 252414 42069 1.82 0.092 Residual 687 15852377 23075 Total 719 42448124 Variate: Body Weight Gain at Week 17 Source of variation d.f. s.s. m.s. v.r. F pr. Batch stratum 4 1073.7 268.4 0.04 Sex stratum 1 18150.3 18150.3 2.53 Batch.Sex stratum 4 28652.6 7163.2 13.34 Batch.Sex.*Units* stratum Village 2 112794.0 56397.0 105.02 <.001 Sire_Line 1340.1 446.7 0.83 0.477 Phenotype 1 191916.7 191916.7 357.37 <.001 Village.Sire_Line 6 22336.9 3722.8 6.93 <.001 Village.Phenotype 2 22423.8 11211.9 20.88 <.001 Sire_Line.Phenotype 3 188.7 62.9 0.12 0.950 Village.Sire_Line.Phenotype 6 2718.7 453.1 0.84 0.536 Residual 687 368939.1 537.0 Total 719 770534.7

214
Variate: Body Weight at Week 18 Source of variation d.f. s.s. m.s. v.r. F pr. Batch stratum 4 49431. 1 12358.0 0.00 Sex stratum 1 6001514. 6 6001514.0 2.26 Batch.Sex stratum 4 10621987.0 2655497.0 73.98 Batch.Sex.*Units* stratum Village 2 2907765.0 1453883.0 40.50 <.001 Sire_Line 3 455981.0 151994.0 4.23 0.006 Phenotype 1 17259272.0 17259272.0 480.82 <.001 Village.Sire_Line 6 906241.0 151040.0 4.21 <.001 Village.Phenotype 2 1226180.0 613090.0 17.08 <.001 Sire_Line.Phenotype 3 37878.0 12626.0 0.35 0.788 Village.Sire_Line.Phenotype 6 396466.0 66078.0 1.84 0.089 Residual 687 24660102.0 35895.0 Total 719 64522817.0 Variate: Weight Gain at Week 18 Source of variation d.f. s.s. m.s. v.r. F pr. Batch stratum 4 1096.4 274.1 0.03 Sex stratum 1 26220.9 26220.9 2.48 Batch.Sex stratum 4 42328.6 10582.2 19.02 Batch.Sex.*Units* stratum Village 2 143595.2 71797.6 129.02 <.001 Sire_Line 3 2615.7 871.9 1.57 0.196 Phenotype 1 187695.3 187695.3 337.29 <.001 Village.Sire_Line 6 22503.4 3750.6 6.74 <.001 Village.Phenotype 2 20116.5 10058.2 18.07 <.001 Sire_Line.Phenotype 3 282.9 94.3 0.17 0.917 Village.Sire_Line.Phenotype 6 4039.9 673.3 1.21 0.299 Residual 687 382305.0 556.5 Total 719 832799.7 Variate: Body Weight at Week 19 Source of variation d.f. s.s. m.s. v.r. F pr. Batch stratum 4 43146.0 10787. 0.00 Sex stratum 1 6272000.0 6272000. 2.04 Batch.Sex stratum 4 12319860.0 3079965. 52.18 Batch.Sex.*Units* stratum Village 2 2528308.0 1264154.0 21.42 <.001 Sire_Line 3 266733.0 88911.0 1.51 0.212 Phenotype 1 19827042.0 19827042.0 335.90 <.001 Village.Sire_Line 6 785660.0 130943.0 2.22 0.040 Village.Phenotype 2 1436874.0 718437.0 12.17 <.001 Sire_Line.Phenotype 3 209809.0 69936.0 1.18 0.315 Village.Sire_Line.Phenotype 6 545507.0 90918.0 1.54 0.162 Residual 687 40551026.0 59026.0 Total 719 84785964.0

215
Variate: Weight Gain 19 Source of variation d.f. s.s. m.s. v.r. F pr. Batch stratum 4 1393.9 348.5 0.02 Sex stratum 1 40575.0 40575.0 2.36 Batch.Sex stratum 4 68902.2 17225.6 29.22 Batch.Sex.*Units* stratum Village 2 86052.2 43026.1 72.99 <.001 Sire_Line 3 9387.0 3129.0 5.31 0.001 Phenotype 1 131625.3 131625.3 223.29 <.001 Village.Sire_Line 6 11900.3 1983.4 3.36 0.003 Village.Phenotype 2 4031.5 2015.7 3.42 0.033 Sire_Line.Phenotype 3 924.3 308.1 0.52 0.667 Village.Sire_Line.Phenotype 6 7264.4 1210.7 2.05 0.057 Residual 687 404981.4 589.5 Total 719 767037.5 Variate: Body Weight at Week 20 Source of variation d.f. s.s. m.s. v.r. F pr. Batch stratum 4 88511.0 22128.0 0.01 Sex stratum 1 9767128.0 9767128.0 2.27 Batch.Sex stratum 4 17187554.0 4296889.0 92.42 Batch.Sex.*Units* stratum Village 2 3437221.0 1718611.0 36.97 <.001 Sire_Line 3 1025454.0 341818. 7.35 <.001 Phenotype 1 19658471.0 19658471.0 422.84 <.001 Village.Sire_Line 6 2025585.0 337598.0 7.26 <.001 Village.Phenotype 2 1319650.0 659825.0 14.19 <.001 Sire_Line.Phenotype 3 391142.0 130381.0 2.80 0.039 Village.Sire_Line.Phenotype 6 776860.0 129477.0 2.78 0.011 Residual 687 31939487.0 46491.0 Total 719 87617062.0 Variate: Weight Gain 20 Source of variation d.f. s.s. m.s. v.r. F pr. Batch stratum 4 1303.3 25.8 0.02 Sex stratum 1 36266.8 36266.8 2.37 Batch.Sex stratum 4 61203.3 15300.8 32.49 Batch.Sex.*Units* stratum Village 2 51276.9 25638.5 54.45 <.001 Sire_Line 3 3264.2 1088.1 2.31 0.075 Phenotype 1 96373.5 2395.4 5.09 <.001 Village.Phenotype 2 3895.3 1947.6 4.14 0.016 Sire_Line.Phenotype 3 161.8 53.9 0.11 0.952 Village.Sire_Line.Phenotype 1966.9 327.8 0.70 0.653 Residual 687 323488.2 470.9 Total 719 593572.8

216
Egg Laying Performance Variate: Age at 1st Egg Source of variation d.f. s.s. m.s. v.r. F pr. Batch stratum Phenotype 1 0.125 0.125 0.63 0.484 Residual 3 0.594 0.198 0.02 Batch.*Units* stratum Village 2 7.684 3.842 0.39 0.680 Sire_Line 3 108.476 36.159 3.63 0.013 Phenotype 1 868.186 868.186 87.20 <.001 Village.Sire_Line 6 124.546 20.758 2.08 0.055 Village.Phenotype 2 61.803 30.902 3.10 0.046 Sire_Line.Phenotype 3 6.151 2.050 0.21 0.892 Village.Sire_Line.Phenotype 6 60.466 10.078 1.01 0.417 Residual 332 3305.299 9.956 Total 359 4543.331 Variate: Clutch Size Source of variation d.f. s.s. m.s. v.r. F pr. Batch stratum Phenotype 1 0.086 0.086 3.89 0.143 Residual 3 0.067 0.022 0.01 Batch.*Units* stratum Village 2 22.832 11.416 5.56 0.004 Sire_Line 3 93.051 31.017 15.12 <.001 Phenotype 1 282.756 282.756 137.81 <.001 Village.Sire_Line 6 3.468 0.578 0.28 0.945 Village.Phenotype 2 2.421 1.211 0.59 0.555 Sire_Line.Phenotype 3 15.796 5.265 2.57 0.055 Village.Sire_Line.Phenotype 6 7.106 1.184 0.58 0.748 Residual 332 681.191 2.052 Total 359 1108.775 Variate: Rate of Lay (Hen-housed) Source of variation d.f. s.s. m.s. v.r. F pr. Batch stratum Phenotype 1 0.117 0.117 1.01 0.390 Residual 3 0.350 0.117 0.02 Batch.*Units* stratum Village 2 142.649 71.325 13.16 <.001 Sire_Line 3 236.634 78.878 14.55 <.001 Phenotype 1 899.517 899.517 165.93 <.001 Village.Sire_Line 6 104.180 17.363 3.20 0.005 Village.Phenotype 2 21.271 10.635 1.96 0.142 Sire_Line.Phenotype 3 79.693 26.564 4.90 0.002 Village.Sire_Line.Phenotype 6 41.793 6.965 1.28 0.264 Residual 332 1799.771 5.421 Total 359 3325.975

217
Variate: Rate of Lay (Hen-day) Source of variation d.f. s.s. m.s. v.r. F pr. Batch stratum Phenotype 1 0.076 0.076 0.98 0.396 Residual 3 0.233 0.078 0.02 Batch.*Units* stratum Village 2 190.915 95.457 19.28 <.001 Sire_Line 3 315.435 105.145 21.24 <.001 Phenotype 1 908.990 908.990 183.62 <.001 Village.Sire_Line 6 64.023 10.670 2.16 0.047 Village.Phenotype 2 13.442 6.721 1.36 0.259 Sire_Line.Phenotype 3 39.584 13.195 2.67 0.048 Village.Sire_Line.Phenotype 6 34.397 5.733 1.16 0.329 Residual 332 1643.528 4.950 Total 359 3210.622 Variate: Body Weight to Egg Weight Ratio Source of variation d.f. s.s. m.s. v.r. F pr. Batch stratum Phenotype 1 0.07 0.07 0.19 0.693 Residual 3 1.15 0.38 0.04 Batch.*Units* stratum Village 2 15.97 7.99 0.78 0.458 Sire_Line 3 99.99 33.33 3.26 0.022 Phenotype 1 463.14 463.14 45.34 <.001 Village.Sire_Line 6 38.16 6.36 0.62 0.712 Village.Phenotype 2 42.19 21.10 2.07 0.128 Sire_Line.Phenotype 3 55.14 18.38 1.80 0.147 Village.Sire_Line.Phenotype 6 23.52 3.92 0.38 0.889 Residual 332 3391.58 10.22 Total 359 4130.92 Egg Quality Performance Variate: Egg Size Source of variation d.f. s.s. m.s. v.r. F pr. Batch stratum Phenotype 1 0.751 0.751 3.11 0.176 Residual 3 0.723 0.241 0.03 Batch.*Units* stratum Village 2 576.671 288.335 38.31 <.001 Sire_Line 3 395.502 131.834 17.52 <.001 Phenotype 1 859.374 859.374 114.19 <.001 Village.Sire_Line 6 53.761 8.960 1.19 0.311 Village.Phenotype 2 114.123 57.062 7.58 <.001 Sire_Line.Phenotype 3 63.085 21.028 2.79 0.040 Village.Sire_Line.Phenotype 6 29.349 4.891 0.65 0.690 Residual 332 2498.577 7.526 Total 359 4591.917

218
Variate: Albumin Height Source of variation d.f. s.s. m.s. v.r. F pr. Batch stratum Phenotype 1 0.0483 0.0483 3.07 0.178 Residual 3 0.0473 0.0158 0.06 Batch.*Units* stratum Village 2 0.2070 0.1035 0.38 0.685 Sire_Line 3 39.8909 13.2970 48.63 <.001 Phenotype 1 10.4710 10.4710 38.30 <.001 Village.Sire_Line 6 3.3623 0.5604 2.05 0.059 Village.Phenotype 2 4.4379 2.2190 8.12 <.001 Sire_Line.Phenotype 3 6.7794 2.2598 8.26 <.001 Village.Sire_Line.Phenotype 6 8.1184 1.3531 4.95 <.001 Residual 332 90.7758 0.2734 Total 359 164.1383 Variate: Haugh Unit Source of variation d.f. s.s. m.s. v.r. F pr. Batch stratum Phenotype 1 0.72 0.72 1.71 0.282 Residual 3 1.26 0.42 0.03 Batch.*Units* stratum Village 2 54.37 27.18 2.26 0.106 Sire_Line 3 2129.18 709.73 59.02 <.001 Phenotype 1 774.81 774.81 64.44 <.001 Village.Sire_Line 6 702.50 117.08 9.74 <.001 Village.Phenotype 2 33.86 16.93 1.41 0.246 Sire_Line.Phenotype 3 137.64 45.88 3.82 0.010 Village.Sire_Line.Phenotype 6 230.91 38.49 3.20 0.005 Residual 332 3992.04 12.02 Total 359 8057.29 Variate: Shell_Thickness Source of variation d.f. s.s. m.s. v.r. F pr. Batch stratum Phenotype 1 0.0000714 0.0000714 2.62 0.204 Residual 3 0.0000817 0.0000272 0.03 Batch.*Units* stratum Village 2 0.0097842 0.0048921 6.23 0.002 Sire_Line 3 0.0615497 0.0205166 26.12 <.001 Phenotype 1 0.0672785 0.0672785 85.65 <.001 Village.Sire_Line 6 0.0187010 0.0031168 3.97 <.001 Village.Phenotype 2 0.0014637 0.0007318 0.93 0.395 Sire_Line.Phenotype 3 0.0442430 0.0147477 18.77 <.001 Village.Sire_Line.Phenotype 6 0.0078436 0.0013073 1.66 0.129 Residual 332 0.2607954 0.0007855 Total 359 0.4718122

219
Variate: Yolk Diameter Source of variation d.f. s.s. m.s. v.r. F pr. Batch stratum Phenotype 1 0.009 0.009 0.39 0.578 Residual 3 0.067 0.022 0.01 Batch.*Units* stratum Village 2 0.290 0.145 0.06 0.941 Sire_Line 3 58.648 19.549 8.20 <.001 Phenotype 1 37.388 37.388 15.68 <.001 Village.Sire_Line 6 64.679 10.780 4.52 <.001 Village.Phenotype 2 6.150 3.075 1.29 0.277 Sire_Line.Phenotype 3 60.033 20.011 8.39 <.001 Village.Sire_Line.Phenotype 6 17.256 2.876 1.21 0.303 Residual 332 791.604 2.384 Total 359 1036.122 Variate: Yolk Height Source of variation d.f. s.s. m.s. v.r. F pr. Batch stratum Phenotype 1 0.0141 0.0141 24.44 0.016 Residual 3 0.0017 0.0006 0.00 Batch.*Units* stratum Village 2 1.5144 0.7572 1.38 0.254 Sire_Line 3 113.1407 37.7136 68.55 <.001 Phenotype 1 6.4000 6.4000 11.63 <.001 Village.Sire_Line 6 2.4376 0.4063 0.74 0.619 Village.Phenotype 2 4.1797 2.0899 3.80 0.023 Sire_Line.Phenotype 3 3.5745 1.1915 2.17 0.092 Village.Sire_Line.Phenotype 6 2.3448 0.3908 0.71 0.642 Residual 332 182.6552 0.5502 Total 359 316.2627 Variate: Yolk Colour Score Source of variation d.f. s.s. m.s. v.r. F pr. Batch stratum Phenotype 1 0.048 0.048 1.74 079 Residual 3 0.083 0.028 0.02 Batch.*Units* stratum Village 2 55.810 27.905 16.61 <.001 Sire_Line 3 6.085 2.028 1.21 0.307 Phenotype 1 1.883 1.883 1.12 0.290 Village.Sire_Line 6 41.861 6.977 4.15 <.001 Village.Phenotype 2 14.557 7.279 4.33 0.014 Sire_Line.Phenotype 3 15.244 5.081 3.03 0.030 Village.Sire_Line.Phenotype 6 14.792 2.465 1.47 0.188 Residual 332 557.636 1.680 Total 359 708.000

220
Body Measurement Variate: Body Length (cm) Source of variation d.f. s.s. m.s. v.r. F pr. Batch stratum 4 12.950 3.238 0.01 Sex stratum 1 726.013 726.013 3.16 Batch.Sex stratum 4 918.189 229.547 95.88 Batch.Sex.*Units* stratum Village 2 66.369 33.185 13.86 <.001 Sire_Line 3 571.126 190.375 79.52 <.001 Phenotype 1 262.812 262.812 109.77 <.001 Village.Sire_Line 6 54.319 9.053 3.78 0.001 Village.Phenotype 2 3.475 1.738 0.73 0.484 Sire_Line.Phenotype 3 77.449 25.816 10.78 <.001 Village.Sire_Line.Phenotype 6 29.214 4.869 2.03 0.059 Residual 687 1644.749 2.394 Total 719 4366.665 Variate: Body Weight (cm) Source of variation d.f. s.s. m.s. v.r. F pr. Batch stratum 4 4.175 1.044 0.02 Sex stratum 1 189.112 189.112 3.31 Batch.Sex stratum 4 228.575 57.144 52.37 Batch.Sex.*Units* stratum Village 2 10.075 5.037 4.62 0.010 Sire_Line 3 87.238 29.079 26.65 <.001 Phenotype 1 46.512 46.512 42.63 <.001 Village.Sire_Line 6 1.225 0.204 0.19 0.980 Village.Phenotype 2 8.125 4.062 3.72 0.025 Sire_Line.Phenotype 3 0.737 0.246 0.23 0.879 Village.Sire_Line.Phenotype 6 3.575 0.596 0.55 0.773 Residual 687 749.637 1.091 Total 719 1328.987 Variate: Shank Length (cm) Source of variation d.f. s.s. m.s. v.r. F pr. Batch stratum 4 0.6583 0.1646 0.02 Sex stratum 1 41.5200 41.5200 3.88 Batch.Sex stratum 4 42.7553 10.6888 18.94 Batch.Sex.*Units* stratum Village 2 2.2324 1.1162 1.98 0.139 Sire_Line 3 26.3739 8.7913 15.58 <.001 Phenotype 1 0.3337 0.3337 0.59 0.442 Village.Sire_Line 6 3.1351 0.5225 0.93 0.475 Village.Phenotype 2 0.1041 0.0521 0.09 0.912 Sire_Line.Phenotype 3 0.4706 0.1569 0.28 0.841 Village.Sire_Line.Phenotype 6 0.9434 0.1572 0.28 0.947 Residual 687 387.6727 0.5643 Total 719 506.1997

221
Carcass Performance Variate: Defeathered (%) Source of variation d.f. s.s. m.s. v.r. F pr. Batch stratum 4 1.32 0.33 0.03 Batch.*Units* stratum Village 2 12.91 6.46 0.56 0.574 Sire_Line 3 55.93 18.64 1.61 0.187 Phenotype 1 13.73 13.73 1.18 0.277 Village.Sire_Line 6 48.95 8.16 0.70 0.647 Village.Phenotype 2 257.58 128.79 11.11 <.001 Sire_Line.Phenotype 3 23.21 7.74 0.67 0.573 Village.Sire_Line.Phenotype 6 33.87 5.65 0.49 0.818 Residual 332 3849.49 11.59 Total 359 4297.00 Variate: Eviscerated (%) Source of variation d.f. s.s. m.s. v.r. F pr. Batch stratum 4 13.11 3.28 0.16 Batch.*Units* stratum Village 2 19.83 9.92 0.49 0.615 Sire_Line 3 70.53 23.51 1.15 0.327 Phenotype 1 41.35 41.35 2.03 0.155 Village.Sire_Line 6 65.85 10.98 0.54 0.778 Village.Phenotype 2 413.31 206.66 10.15 <.001 Sire_Line.Phenotype 3 28.68 9.56 0.47 0.704 Village.Sire_Line.Phenotype 6 38.97 6.49 0.32 0.927 Residual 332 6759.60 20.36 Total 359 7451.23 Variate: Dressed Weight (%) Source of variation d.f. s.s. m.s. v.r. F pr. Batch stratum 4 27.04 6.76 0.35 Batch.*Units* stratum Village 2 38.69 19.34 0.99 0.373 Sire_Line 3 145.96 48.65 2.49 0.060 Phenotype 1 61.67 61.67 3.15 0.077 Village.Sire_Line 6 107.57 17.93 0.92 0.483 Village.Phenotype 2 429.20 214.60 10.97 <.001 Sire_Line.Phenotype 3 37.66 12.55 0.64 0.589 Village.Sire_Line.Phenotype 6 70.18 11.70 0.60 0.732 Residual 332 6493.24 19.56 Total 359 7411.21

222
Variate: Thigh and Drumstick (%) Source of variation d.f. s.s. m.s. v.r. F pr. Batch stratum 4 0.1591 0.0398 0.12 Batch.*Units* stratum Village 2 1.8029 0.9014 2.82 0.061 Sire_Line 3 15.3029 5.1010 15.95 <.001 Phenotype 1 1.5458 1.5458 4.83 0.029 Village.Sire_Line 6 3.8602 0.6434 2.01 0.064 Village.Phenotype 2 3.1543 1.5771 4.93 0.008 Sire_Line.Phenotype 3 6.2590 2.0863 6.52 <.001 Village.Sire_Line.Phenotype 6 3.0955 0.5159 1.61 0.143 Residual 332 106.1588 0.3198 Total 359 141.3384 Variate: Wings (%) Source of variation d.f. s.s. m.s. v.r. F pr. Batch stratum 4 0.0413 0.0103 0.04 Batch.*Units* stratum Village 2 0.1733 0.0866 0.32 0.726 Sire_Line 3 0.2972 0.0991 0.37 0.778 Phenotype 1 1.7752 1.7752 6.56 0.011 Village.Sire_Line 6 0.1520 0.0253 0.09 0.997 Village.Phenotype 2 0.5533 0.2766 1.02 0.361 Sire_Line.Phenotype 3 4.4021 1.4674 5.42 0.001 Village.Sire_Line.Phenotype 6 1.7124 0.2854 1.05 0.390 Residual 332 89.9090 0.2708 Total 359 99.0157 Variate: Breast Muscle (%) Source of variation d.f. s.s. m.s. v.r. F pr. Batch stratum 4 2.946 0.736 0.08 Batch.*Units* stratum Village 2 1.553 0.777 0.08 0.919 Sire_Line 3 4.185 1.395 0.15 0.928 Phenotype 1 770.562 770.562 83.94 <.001 Village.Sire_Line 6 4.003 0.667 0.07 0.999 Village.Phenotype 2 35.184 17.592 1.92 0.149 Sire_Line.Phenotype 3 12.416 4.139 0.45 0.717 Village.Sire_Line.Phenotype 6 41.404 6.901 0.75 0.608 Residual 332 3047.602 9.180 Total 359 3919.855 Variate: Gizzard (%) Source of variation d.f. s.s. m.s. v.r. F pr. Batch stratum 4 0.0545 0.0136 0.11 Batch.*Units* stratum Village 2 1.5082 0.7541 6.07 0.003 Sire_Line 3 1.8547 0.6182 4.97 0.002 Phenotype 1 1.0541 1.0541 8.48 0.004 Village.Sire_Line 6 2.6755 0.4459 3.59 0.002 Village.Phenotype 2 0.7814 0.3907 3.14 0.044 Sire_Line.Phenotype 3 2.5580 0.8527 6.86 <.001 Village.Sire_Line.Phenotype 6 0.8653 0.1442 1.16 0.327 Residual 332 41.2675 0.1243 Total 359 52.6192 Variate: Intestines (%)

223
Source of variation d.f. s.s. m.s. v.r. F pr. Batch stratum 4 0.13710 0.03428 1.08 Batch.*Units* stratum Village 2 0.76684 0.38342 12.12 <.001 Sire_Line 3 0.32977 0.10992 3.47 0.016 Phenotype 1 0.06588 0.06588 2.08 0.150 Village.Sire_Line 6 0.51819 0.08637 2.73 0.013 Village.Phenotype 2 0.01131 0.00565 0.18 0.836 Sire_Line.Phenotype 3 0.02362 0.00787 0.25 0.862 Village.Sire_Line.Phenotype 6 0.18690 0.03115 0.98 0.436 Residual 332 10.50378 0.03164 Total 359 12.54339 Variate: Heart (%) Source of variation d.f. s.s. m.s. v.r. F pr. Batch stratum 4 0.02763 0.00691 0.45 Batch.*Units* stratum Village 2 0.16870 0.08435 5.49 0.005 Sire_Line 3 0.71317 0.23772 15.48 <.001 Phenotype 1 0.00488 0.00488 0.32 0.574 Village.Sire_Line 6 0.37041 0.06173 4.02 <.001 Village.Phenotype 2 0.19198 0.09599 6.25 0.002 Sire_Line.Phenotype 3 0.21447 0.07149 4.65 0.003 Village.Sire_Line.Phenotype 6 0.11662 0.01944 1.27 0.273 Residual 332 5.09971 0.01536 Total 359 6.90756 Variate: Liver (%) Source of variation d.f. s.s. m.s. v.r. F pr. Batch stratum 4 0.07297 0.01824 0.60 Batch.*Units* stratum Village 2 0.81004 0.40502 13.41 <.001 Sire_Line 3 0.24542 0.08181 2.71 0.045 Phenotype 1 0.00831 0.00831 0.28 0.600 Village.Sire_Line 6 1.13863 0.18977 6.29 <.001 Village.Phenotype 2 0.02994 0.01497 0.50 0.610 Sire_Line.Phenotype 3 0.03817 0.01272 0.42 0.738 Village.Sire_Line.Phenotype 6 0.16148 0.02691 0.89 0.501 Residual 332 10.02416 0.03019 Total 359 12.52912

224
Mortality Variate: Total Mortality (%) Source of variation d.f. s.s. m.s. v.r. F pr. Batch stratum Phenotype 1 0.064 0.064 1.23 0.349 Residual 3 0.156 0.052 0.01 Batch.*Units* stratum Village 2 1.430 0.715 0.20 0.819 Sire_Line 3 15.890 5.297 1.48 0.219 Phenotype 1 161.392 161.392 45.19 <.001 Village.Sire_Line 6 43.480 7.247 2.03 0.061 Village.Phenotype 2 19.313 9.657 2.70 0.068 Sire_Line.Phenotype 3 8.983 2.994 0.84 0.474 Village.Sire_Line.Phenotype 6 29.187 4.865 1.36 0.229 Residual 332 1185.635 3.571 Total 359 1465.531 F2 Homozygous Naked Neck, Heterozygous Naked Neck and Normal Feathered Birds Growth Performance Variate: Weight at Day-old Source of variation d.f. s.s. m.s. v.r. F pr. batch stratum 4 2.440 0.610 0.08 batch.*Units* stratum Phenotype 2 104.368 52.184 7.15 0.002 Residual 38 277.202 7.295 Total 44 384.010 Variate: Weight at Week 6 Source of variation d.f. s.s. m.s. v.r. F pr. batch stratum 4 27.35 6.84 0.16 batch.*Units* stratum Phenotype 2 1254.93 627.46 14.37 <.001 Residual 38 1659.44 43.67 Total 44 2941.71 Variate: Weight Gain at Week 6 Source of variation d.f. s.s. m.s. v.r. F pr. batch stratum 4 7.19 1.80 0.17 batch.*Units* stratum Phenotype 2 330.71 165.36 15.84 <.001 Residual 38 396.59 10.44 Total 44 734.50

225
Variate: Weight at Week 20 Source of variation d.f. s.s. m.s. v.r. F pr. Batch stratum 4 154602 38651 0.13 Sex stratum 1 2408333 2408333 8.38 Batch.Sex stratum 4 1149137 287284 12.87 Batch.Sex.*Units* stratum Village 2 46734 23367 1.05 0.353 Phenotype 2 607814 303907 13.61 <.001 Village.Phenotype 4 170233 42558 1.91 0.110 Residual 252 5626434 22327 Total 269 10163287 Variate: Weight Gain at Week 20 Source of variation d.f. s.s. m.s. v.r. F pr. Batch stratum 4 953.3 238.3 0.13 Sex stratum 1 27200.4 27200.4 14.50 Batch.Sex stratum 4 7501.5 1875.4 3.29 Batch.Sex.*Units* stratum Village 2 526.7 263.3 0.46 0.631 Phenotype 2 19628.9 9814.4 17.20 <.001 Village.Phenotype 4 4931.1 1232.8 2.16 0.074 Residual 252 143794.8 570.6 Total 269 204536.7 Body Measurements Variate: Body Length (cm) Source of variation d.f. s.s. m.s. v.r. F pr. Batch stratum 4 0.0000 0.000 Sex stratum 1 800.8333 800. 8333 Batch.Sex stratum 4 0.0000 0.0000 0.00 Batch.Sex.*Units* stratum Village 2 3.2667 1.6333 1.74 0.178 Phenotype 2 206.6667 103.3333 109.94 <.001 Village.Phenotype 4 6.5333 1.6333 1.74 0.142 Residual 252 236.8667 0.9399 Total 269 1254.1667 Variate: Body Width (cm) Source of variation d.f. s.s. m.s. v.r. F pr. Batch stratum 4 0.0000 0.0000 Sex stratum 1 240.8333 240. 8333 Batch.Sex stratum 4 0.0000 0.0000 0.00 Batch.Sex.*Units* stratum Village 2 1.4000 0.7000 0.89 0.411 Phenotype 2 15.0000 7.5000 9.57 <.001 Village.Phenotype 4 2.8000 0.7000 0.89 0.468 Residual 252 197.4667 0.7836 Total 269 457.5000
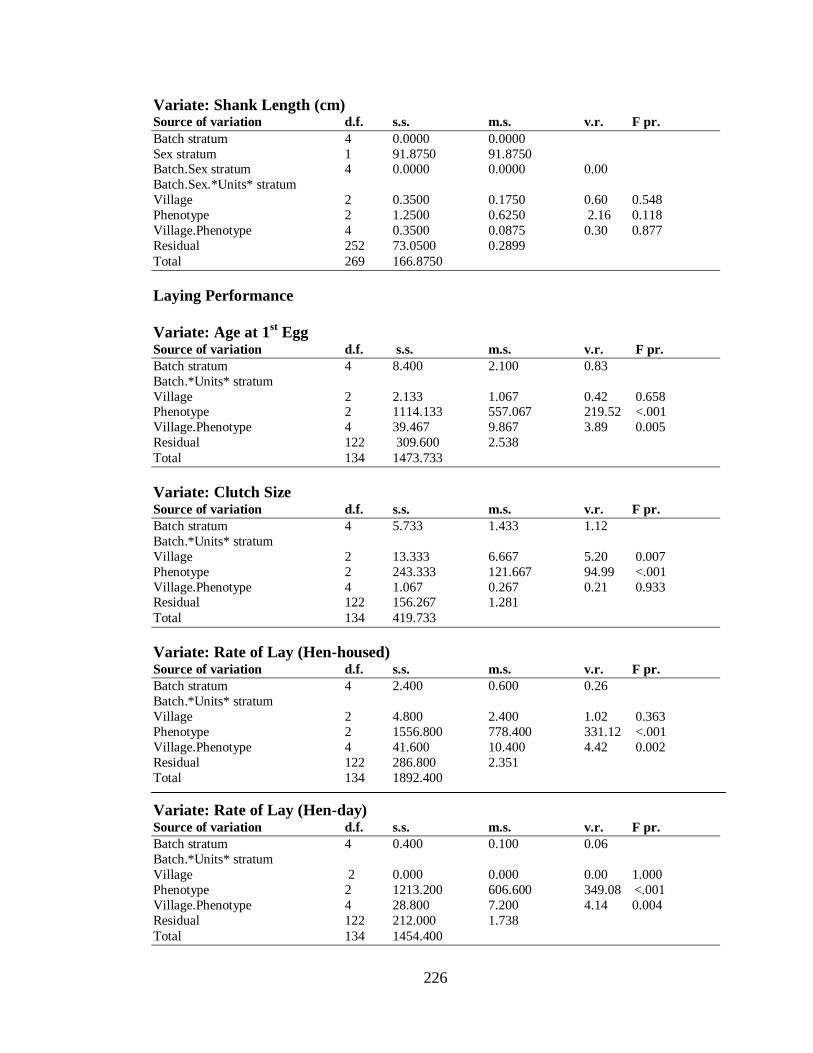
226
Variate: Shank Length (cm) Source of variation d.f. s.s. m.s. v.r. F pr. Batch stratum 4 0.0000 0.0000 Sex stratum 1 91.8750 91.8750 Batch.Sex stratum 4 0.0000 0.0000 0.00 Batch.Sex.*Units* stratum Village 2 0.3500 0.1750 0.60 0.548 Phenotype 2 1.2500 0.6250 2.16 0.118 Village.Phenotype 4 0.3500 0.0875 0.30 0.877 Residual 252 73.0500 0.2899 Total 269 166.8750 Laying Performance Variate: Age at 1st Egg Source of variation d.f. s.s. m.s. v.r. F pr. Batch stratum 4 8.400 2.100 0.83 Batch.*Units* stratum Village 2 2.133 1.067 0.42 0.658 Phenotype 2 1114.133 557.067 219.52 <.001 Village.Phenotype 4 39.467 9.867 3.89 0.005 Residual 122 309.600 2.538 Total 134 1473.733 Variate: Clutch Size Source of variation d.f. s.s. m.s. v.r. F pr. Batch stratum 4 5.733 1.433 1.12 Batch.*Units* stratum Village 2 13.333 6.667 5.20 0.007 Phenotype 2 243.333 121.667 94.99 <.001 Village.Phenotype 4 1.067 0.267 0.21 0.933 Residual 122 156.267 1.281 Total 134 419.733 Variate: Rate of Lay (Hen-housed) Source of variation d.f. s.s. m.s. v.r. F pr. Batch stratum 4 2.400 0.600 0.26 Batch.*Units* stratum Village 2 4.800 2.400 1.02 0.363 Phenotype 2 1556.800 778.400 331.12 <.001 Village.Phenotype 4 41.600 10.400 4.42 0.002 Residual 122 286.800 2.351 Total 134 1892.400 Variate: Rate of Lay (Hen-day) Source of variation d.f. s.s. m.s. v.r. F pr. Batch stratum 4 0.400 0.100 0.06 Batch.*Units* stratum Village 2 0.000 0.000 0.00 1.000 Phenotype 2 1213.200 606.600 349.08 <.001 Village.Phenotype 4 28.800 7.200 4.14 0.004 Residual 122 212.000 1.738 Total 134 1454.400

227
Variate: Body Weight to Egg Weight Ratio Source of variation d.f. s.s. m.s. v.r. F pr. Batch stratum 4 5.8679 1.4670 3.37 Batch.*Units* stratum Village 2 0.0986 0.0493 0.11 0.893 Phenotype 2 30.8115 15.4057 35.40 <.001 Village.Phenotype 4 2.0027 0.5007 1.15 0.336 Residual 122 53.0887 0.4352 Total 134 91.8693 Variate: Egg Size Source of variation d.f. s.s. m.s. v.r. F pr. Batch stratum 4 18.775 4.694 3.40 Batch.*Units* stratum Village 2 13.174 6.587 4.77 0.010 Phenotype 2 938.992 469.496 339.71 <.001 Village.Phenotype 4 0.251 0.063 0.05 0.996 Residual 122 168.610 1.382 Total 134 1139.803 Variate: Haugh Unit (%) Source of variation d.f. s.s. m.s. v.r. F pr. Batch stratum 4 98.000 24.500 3.54 Batch.*Units* stratum Village 2 104.533 52.267 7.56 <.001 Phenotype 2 1360.533 680.267 98.33 <.001 Village.Phenotype 4 20.267 5.067 0.73 0.572 Residual 122 844.000 6.918 Total 134 2427.333 Variate: Shell Thickness (mm) Source of variation d.f. s.s. m.s. v.r. F pr. Batch stratum 4 0.0005333 0.0001333 0.60 Batch.*Units* stratum Village 2 0.0002133 0.0001067 0.48 0.621 Phenotype 2 0.0700933 0.0350467 157.27 <.001 Village.Phenotype 4 0.0001067 0.0000267 0.12 0.975 Residual 122 0.0271867 0.0002228 Total 134 0.0981333 Carcass Performance Variate: Defeatherd , % of Live Weight Source of variation d.f. s.s. m.s. v.r. F pr. Batch stratum 4 9.6052 2.4013 2.43 Batch.*Units* stratum Village 2 3.5354 1.7677 1.79 0.171 Phenotype 2 1310.4112 655.2056 663.61 <.001 Village.Phenotype 4 1.2624 0.3156 0.32 0.864 Residual 122 120.4552 0.9873 Total 134 1445.2695

228
Variate: Dressed (%) Source of variation d.f. s.s. m.s. v.r. F pr. Batch stratum 4 63.101 15.775 2.87 Batch.*Units* stratum Village 2 25.725 12.862 2.34 0.100 Phenotype 2 650.137 325.068 59.20 <.001 Village.Phenotype 4 5.034 1.259 0.23 0.922 Residual 122 669.936 5.491 Total 134 1413.933 Variate: Breast Muscle (%) Source of variation d.f. s.s. m.s. v.r. F pr. Batch stratum 4 0.8877 0.2219 1.85 Batch.*Units* stratum Village 2 0.3280 0.1640 1.36 0.259 Phenotype 2 536.8357 268.4178 2233.40 <.001 Village.Phenotype 4 0.3334 0.0833 0.69 0.598 Residual 122 14.6624 0.1202 Total 134 553.0472 Mortality Variate: Chick Mortality (%) Source of variation d.f. s.s. m.s. v.r. F pr. batch stratum 4 0.02667 0.00667 0.42 batch.*Units* stratum Phenotype 2 0.28578 0.14289 9.07 <.001 Residual 38 0.59867 0.01575 Total 44 0.91111 Variate: Total Mortality (%) Source of variation d.f. s.s. m.s. v.r. F pr. Batch stratum 4 4.667 1.167 0.46 Batch.*Units* stratum Village 2 10.015 5.007 1.99 0.141 Phenotype 2 1006.681 503.341 199.81 <.001 Village.Phenotype 4 0.119 0.030 0.01 1.000 Residual 122 307.333 2.519 Total 134 1328.815

229
Experiment Four : Frizzles and Normals Growth Performance Variate: Weight at Week 20 Source of variation d.f. s.s. m.s. v.r. F pr. Sex stratum 1 6954136 6954136 2859.39 Sex.*Units* stratum Village 2 20675 10338 4.25 0.016 Sire_Lines 4 1932781 483195 198.68 <.001 Phenotypes 1 600889 600889 247.07 <.001 Village.Sire_Lines 8 135755 16969 6.98 <.001 Village.Phenotypes 2 4055 2028 0.83 0.436 Sire_Lines.Phenotypes 4 141185 35296 14.51 <.001 Village.Sire_Lines.Phenotypes 8 51492 6436 2.65 0.010 Residual 149 362373 2432 Total 179 10203341 Variate: Weight Gain at Week 20 Source of variation d.f. s.s. m.s. v.r. F pr. Sex stratum 1 4500.0 4500.0 30.62 Sex.*Units* stratum Village 2 0.0 0.0 0.00 1.000 Sire_Lines 4 10000.0 2500.0 17.01 <.001 Phenotypes 1 80.0 80.0 0.54 0.462 Village.Sire_Lines 8 3050.0 381.3 2.59 0.011 Village.Phenotypes 2 40.0 20.0 0.14 0.873 Sire_Lines.Phenotypes 4 320.0 80.0 0.54 0.703 Village.Sire_Lines.Phenotypes 8 2110.0 263.7 1.79 0.082 Residual 149 21900.0 147.0 Total 179 42000.0 Body Measurements Variate: Body Length (mm) Source of variation d.f. s.s. m.s. v.r. F pr. Batch stratum 4 787.76 196.94 1.89 Sex stratum 1 220.03 220.03 2.11 Batch.Sex stratum 4 417.19 104.30 4.51 Batch.Sex.*Units* stratum Village 2 12.94 6.47 0.28 0.756 Sire_Line 4 90.35 22.59 0.98 0.419 Phenotype 1 8.41 8.41 0.36 0.547 Village.Sire_Line 8 38.04 4.75 0.21 0.990 Village.Phenotype 2 33.95 16.97 0.73 0.480 Sire_Line.Phenotype 4 21.73 5.43 0.23 0.919 Village.Sire_Line.Phenotype 8 94.83 11.85 0.51 0.847 Residual 861 19907.19 23.12 Total 899 21632.41

230
Variate: Body Width (mm) Source of variation d.f. s.s. m.s. v.r. F pr. Batch stratum 4 19.5601 4.8900 0.64 Sex stratum 1 5.6327 5.6327 0.73 Batch.Sex stratum 4 30.6558 7.6640 15.78 Batch.Sex.*Units* stratum Village 2 0.6872 0.3436 0.71 0.493 Sire_Line 4 0.7806 0.1951 0.40 0.807 Phenotype 1 0.0196 0.0196 0.04 0.841 Village.Sire_Line 8 3.0441 0.3805 0.78 0.617 Village.Phenotype 2 0.5621 0.2810 0.58 0.561 Sire_Line.Phenotype 4 1.8305 0.4576 0.94 0.439 Village.Sire_Line.Phenotype 8 4.4162 0.5520 1.14 0.336 Residual 861 418.1200 0.4856 Total 899 485.3089 Variate: Shank Length (mm) Source of variation d.f. s.s. m.s. v.r. F pr. Batch stratum 4 1.4776 0.3694 0.13 Sex stratum 1 3.9867 3.9867 1.38 Batch.Sex stratum 4 11.5638 2.8910 10.71 Batch.Sex.*Units* stratum Village 2 0.2353 0.1176 0.44 0.647 Sire_Line 4 0.3888 0.0972 0.36 0.837 Phenotype 1 0.3640 0.3640 1.35 0.246 Village.Sire_Line 8 2.8538 0.3567 1.32 0.229 Village.Phenotype 2 0.7212 0.3606 1.34 0.263 Sire_Line.Phenotype 4 0.9684 0.2421 0.90 0.465 Village.Sire_Line.Phenotype 8 2.2140 0.2767 1.03 0.415 Residual 861 232.3096 0.2698 Total 899 257.0831 Egg Laying Performance Variate: Age at 1st Egg Source of variation d.f. s.s. m.s. v.r. F pr. Batch stratum 4 3.20 0.80 0.04 Batch.*Units* stratum Village 2 13.44 6.72 0.34 0.714 Sire_Line 4 775.80 193.95 9.72 <.001 Phenotype 1 907.38 907.38 45.49 <.001 Village.Sire_Line 8 89.16 11.14 0.56 0.812 Village.Phenotype 2 23.52 11.76 0.59 0.555 Sire_Line.Phenotype 4 88.92 22.23 1.11 0.349 Village.Sire_Line.Phenotype 8 22.68 2.84 0.14 0.997 Residual 416 8298.40 19.95 Total 449 10222.50

231
Variate: Clutch Size Source of variation d.f. s.s. m.s. v.r. F pr. Batch stratum 4 2.72 0.68 0.06 Batch.*Units* stratum Village 2 1.44 0.72 0.06 0.938 Sire_Line 4 51.12 12.78 1.13 0.339 Phenotype 1 273.78 273.78 24.31 <.001 Village.Sire_Line 8 18.96 2.37 0.21 0.989 Village.Phenotype 2 0.48 0.24 0.02 0.979 Sire_Line.Phenotype 4 43.92 10.98 0.98 0.421 Village.Sire_Line.Phenotype 8 7.92 0.99 0.09 1.000 Residual 416 4684.48 11.26 Total 449 5084.82 Variate: BodyWeight to Egg Weight Ratio Source of variation d.f. s.s. m.s. v.r. F pr. Batch stratum 4 1.95 0.49 0.04 Batch.*Units* stratum Village 2 1.84 0.92 0.08 0.928 Sire_Line 4 384.45 96.11 7.82 <.001 Phenotype 1 596.44 596.44 48.54 <.001 Village.Sire_Line 8 97.49 12.19 0.99 0.442 Village.Phenotype 2 3.89 1.94 0.16 0.854 Sire_Line.Phenotype 4 103.51 25.88 2.11 0.079 Village.Sire_Line.Phenotype 8 9.96 1.24 0.10 0.999 Residual 416 5112.04 12.29 Total 449 6311.55 Variate: Rate of Lay (Hen-housed) Source of variation d.f. s.s. m.s. v.r. F pr. Batch stratum 4 53.37 13.34 0.96 Batch.*Units* stratum Village 2 192.05 96.03 6.87 0.001 Sire_Line 4 423.08 105.77 7.57 <.001 Phenotype 1 1250.00 1250.00 89.47 <.001 Village.Sire_Line 8 117.41 14.68 1.05 0.397 Village.Phenotype 2 0.69 0.35 0.02 0.975 Sire_Line.Phenotype 4 287.40 71.85 5.14 <.001 Village.Sire_Line.Phenotype 8 24.77 3.10 0.22 0.987 Residual 416 5811.70 13.97 Total 449 8160.48 Variate: Ratw of Rate (Hen-day) Source of variation d.f. s.s. m.s. v.r. F pr. Batch stratum 4 48.90 12.23 0.66 Batch.*Units* stratum Village 2 235.85 117.93 6.37 0.002 Sire_Line 4 145.28 36.32 1.96 0.099 Phenotype 1 662.48 662.48 35.79 <.001 Village.Sire_Line 8 97.55 12.19 0.66 0.728 Village.Phenotype 2 28.25 14.13 0.76 0.467 Sire_Line.Phenotype 4 303.52 75.88 4.10 0.003 Village.Sire_Line.Phenotype 8 39.01 4.88 0.26 0.977 Residual 416 7699.23 18.51 Total 449 9260.08

232
Variate: Egg Size Source of variation d.f. s.s. m.s. v.r. F pr. Batch stratum 4 3.52 0.88 0.06 Batch.*Units* stratum Village 2 7.78 3.89 0.26 0.772 Sire_Line 4 1165.04 291.26 19.40 <.001 Phenotype 1 1.55 1.55 0.10 0.748 Village.Sire_Line 8 70.30 8.79 0.59 0.790 Village.Phenotype 2 3.27 1.63 0.11 0.897 Sire_Line.Phenotype 4 53.50 13.37 0.89 0.469 Village.Sire_Line.Phenotype 8 61.24 7.66 0.51 0.849 Residual 416 6246.04 15.01 Total 449 7612.24 Egg Quality Variate: Haugh Unit (%) Source of variation d.f. s.s. m.s. v.r. F pr. Batch stratum 4 26.72 6.68 0.15 Batch.*Units* stratum Village 2 63.84 31.92 0.73 0.481 Sire_Line 4 1755.72 438.93 10.10 <.001 Phenotype 1 1067.22 1067.22 24.55 <.001 Village.Sire_Line 8 186.36 23.30 0.54 0.830 Village.Phenotype 2 442.08 221.04 5.08 0.007 Sire_Line.Phenotype 4 458.28 114.57 2.64 0.034 Village.Sire_Line.Phenotype 8 214.92 26.87 0.62 0.763 Residual 416 18086.08 43.48 Total 449 22301.22 Variate: Shell Thickness Source of variation d.f.(m.v.) s.s. m.s. v.r. F pr. Batch stratum 4 0.0000000 0.0000000 0.00 Batch.*Units* stratum Village 2 0.0000000 0.0000000 0.00 1.000 Sire_Line 4 0.0299902 0.0074976 31.32 <.001 Phenotype 1 0.0000000 0.0000000 0.00 1.000 Village.Sire_Line 8 0.0000000 0.0000000 0.00 1.000 Village.Phenotype 2 0.0000000 0.0000000 0.00 1.000 Sire_Line.Phenotype 4 0.0039987 0.0009997 4.18 0.003 Village.Sire_Line.Phenotype 8 0.0000000 0.0000000 0.00 1.000 Residual 386 0.0924000 0.0002394 Total 419 0.1241333

233
Carcass Performance Variate: Defeathered (%) Source of variation d.f. s.s. m.s. v.r. F pr. Batch stratum 4 0.126 0.031 0.02 Batch.*Units* stratum Village 2 0.015 0.008 0.00 0.996 Sire_Line 4 0.752 0.188 0.11 0.978 Phenotype 1 1.378 1.378 0.82 0.366 Village.Sire_Line 8 3.769 0.471 0.28 0.972 Village.Phenotype 2 17.036 8.518 5.06 0.007 Sire_Line.Phenotype 4 2.069 0.517 0.31 0.873 Village.Sire_Line.Phenotype 8 7.556 0.944 0.56 0.810 Residual 416 700.662 1.684 Total 449 733.361 Variate: Dressed (%) Source of variation d.f. s.s. m.s. v.r. F pr. Batch stratum 4 0.131 0.033 0.02 Batch.*Units* stratum Village 2 0.064 0.032 0.02 0.981 Sire_Line 4 0.913 0.228 0.14 0.968 Phenotype 1 7.530 7.530 4.55 0.033 Village.Sire_Line 8 14.027 1.753 1.06 0.390 Village.Phenotype 2 13.922 6.961 4.21 0.015 Sire_Line.Phenotype 4 8.033 2.008 1.21 0.304 Village.Sire_Line.Phenotype 8 10.057 1.257 0.76 0.638 Residual 416 687.713 1.653 Total 449 742.391 Variate: Breast Muscle (%) Source of variation d.f. s.s. m.s. v.r. F pr. Batch stratum 4 0.04856 0.01214 0.14 Batch.*Units* stratum Village 2 0.03603 0.01801 0.21 0.811 Sire_Line 4 0.42732 0.10683 1.24 0.293 Phenotype 1 0.00454 0.00454 0.05 0.818 Village.Sire_Line 8 1.17514 0.14689 1.70 0.095 Village.Phenotype 2 0.27856 0.13928 1.62 0.200 Sire_Line.Phenotype 4 0.35969 0.08992 1.04 0.384 Village.Sire_Line.Phenotype 8 0.63683 0.07960 0.92 0.497 Residual 416 35.85279 0.08618 Total 449 38.81946

234
Mortality Variate: Total Mortality (%) Source of variation d.f. s.s. m.s. v.r. F pr. Batch stratum 4 4.889 1.222 0.67 Sex stratum 1 0.004 0.004 0.00 Batch.Sex stratum 4 7.351 1.838 0.71 Batch.Sex.*Units* stratum Village 2 2.727 1.363 0.53 0.592 Sire_Line 4 2.100 0.525 0.20 0.937 Phenotype 1 25.671 25.671 9.89 0.002 Village.Sire_Line 8 7.307 0.913 0.35 0.945 Village.Phenotype 2 1.069 0.534 0.21 0.814 Sire_Line.Phenotype 4 3.073 0.768 0.30 0.881 Village.Sire_Line.Phenotype 8 15.387 1.923 0.74 0.655 Residual 861 2234.422 2.595 Total 899 2304.000 F2 Frizzles and Normals Growth Performance Variate: Weight at Day-old Source of variation d.f. s.s. m.s. v.r. F pr. Batch stratum 4 3.22 0.80 0.04 Batch.*Units* stratum Phenotype 2 33.34 16.67 0.83 0.443 Residual 38 761.62 20.04 Total 44 798.18 Variate: Weight at Week 6 Source of variation d.f. s.s. m.s. v.r. F pr. Batch stratum 4 160.6 40.1 0.19 Batch.*Units* stratum Phenotype 2 1120.1 560.0 2.66 0.083 Residual 38 8015.4 210.9 Total 44 9296.0 Variate: Weight Gain at Week 6 Source of variation d.f. s.s. m.s. v.r. F pr. Batch stratum 4 89.7 22.4 0.15 Batch.*Units* stratum Phenotype 2 590.5 295.2 2.01 0.147 Residual 38 5570.2 146.6 Total 44 6250.4

235
Variate: Weight at Week 20 Source of variation d.f. s.s. m.s. v.r. F pr. Batch stratum 4 36.0 9.0 1.00 Sex stratum 1 10632653.0 10632653 1.196 Batch.Sex stratum 4 36.9.0 0.00 Batch.Sex.*Units* stratum Village 2 63616.0 31808 2.87 0.058 Phenotype 2 23496.0 11748 1.06 0.348 Village.Phenotype 4 57689.0 14422 1.30 0.269 Residual 252 2789622.0 11070 Total 269 13567147.0 Variate: Weighty Gain at Week 20 Source of variation d.f. s.s. m.s. v.r. F pr. Batch stratum 4 8.9 2.2 1.00 Sex stratum 1 20280.0 20280.0 9126.00 Batch.Sex stratum 4 8.9 2.2 0.01 Batch.Sex.*Units* stratum Village 2 15046.7 7523.3 23.74 <.001 Phenotype 2 1182.2 591.1 1.87 0.157 Village.Phenotype 4 1131.1 282.8 0.89 0.469 Residual 252 79862.2 316.9 Total 269 117520.0 Body Measurements Variate: Body Length (cm) Source of variation d.f. s.s. m.s. v.r. F pr. Batch stratum 4 7.948 1.987 0.64 Batch.*Units* stratum Village 2 22.496 11.248 3.63 0.028 Phenotype 2 47.563 23.781 7.66 <.001 Village.Phenotype 4 2.059 0.515 0.17 0.956 Residual 257 797.419 3.103 Total 269 877.485 Variate: Body Width (cm) Source of variation d.f. s.s. m.s. v.r. F pr. Batch stratum 4 0.793 0.198 0.13 Batch.*Units* stratum Village 2 9.119 4.559 3.09 0.047 Phenotype 2 3.052 1.526 1.03 0.357 Village.Phenotype 4 13.304 3.326 2.25 0.064 Residual 257 379.674 1.477 Total 269 405.941
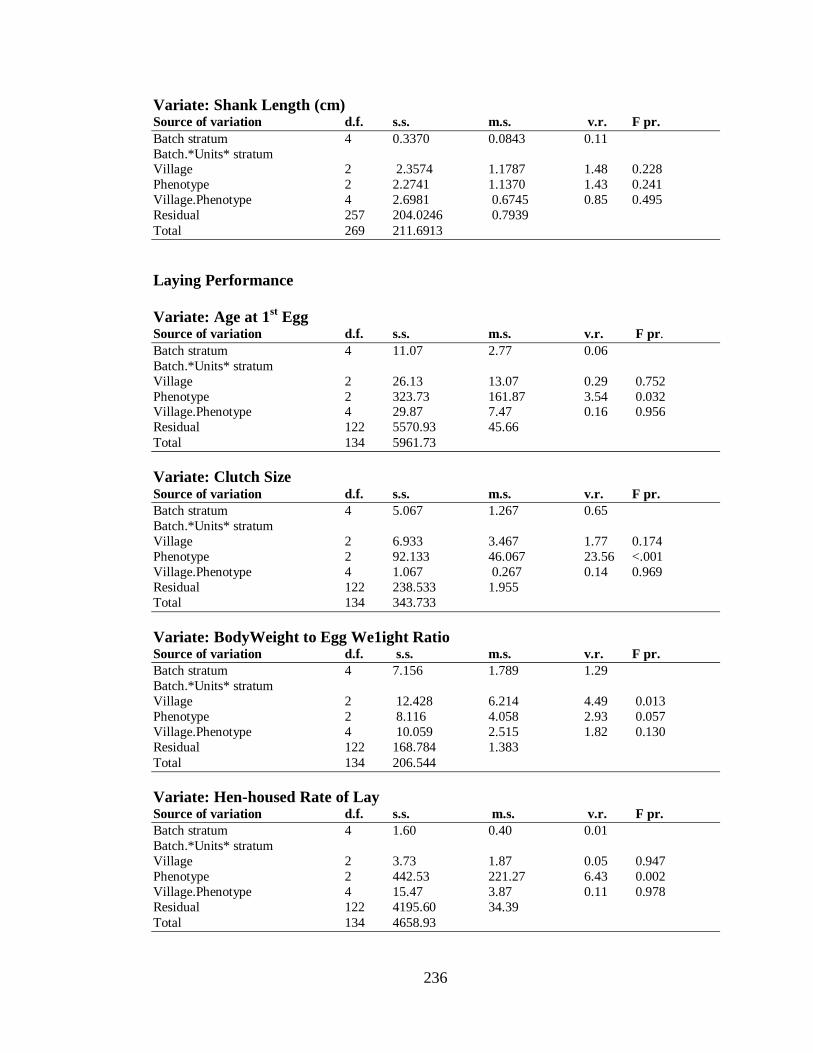
236
Variate: Shank Length (cm) Source of variation d.f. s.s. m.s. v.r. F pr. Batch stratum 4 0.3370 0.0843 0.11 Batch.*Units* stratum Village 2 2.3574 1.1787 1.48 0.228 Phenotype 2 2.2741 1.1370 1.43 0.241 Village.Phenotype 4 2.6981 0.6745 0.85 0.495 Residual 257 204.0246 0.7939 Total 269 211.6913 Laying Performance Variate: Age at 1st Egg Source of variation d.f. s.s. m.s. v.r. F pr. Batch stratum 4 11.07 2.77 0.06 Batch.*Units* stratum Village 2 26.13 13.07 0.29 0.752 Phenotype 2 323.73 161.87 3.54 0.032 Village.Phenotype 4 29.87 7.47 0.16 0.956 Residual 122 5570.93 45.66 Total 134 5961.73 Variate: Clutch Size Source of variation d.f. s.s. m.s. v.r. F pr. Batch stratum 4 5.067 1.267 0.65 Batch.*Units* stratum Village 2 6.933 3.467 1.77 0.174 Phenotype 2 92.133 46.067 23.56 <.001 Village.Phenotype 4 1.067 0.267 0.14 0.969 Residual 122 238.533 1.955 Total 134 343.733 Variate: BodyWeight to Egg We1ight Ratio Source of variation d.f. s.s. m.s. v.r. F pr. Batch stratum 4 7.156 1.789 1.29 Batch.*Units* stratum Village 2 12.428 6.214 4.49 0.013 Phenotype 2 8.116 4.058 2.93 0.057 Village.Phenotype 4 10.059 2.515 1.82 0.130 Residual 122 168.784 1.383 Total 134 206.544 Variate: Hen-housed Rate of Lay Source of variation d.f. s.s. m.s. v.r. F pr. Batch stratum 4 1.60 0.40 0.01 Batch.*Units* stratum Village 2 3.73 1.87 0.05 0.947 Phenotype 2 442.53 221.27 6.43 0.002 Village.Phenotype 4 15.47 3.87 0.11 0.978 Residual 122 4195.60 34.39 Total 134 4658.93

237
Variate: Rate of Lay (Hen-Day) Source of variation d.f. s.s. m.s. v.r. F pr. Batch stratum 4 13.60 3.40 0.22 Batch.*Units* stratum Village 2 19.73 9.87 0.63 0.534 Phenotype 2 323.73 161.87 10.35 <.001 Village.Phenotype 4 7.47 1.87 0.12 0.975 Residual 122 1908.40 15.64 Total 134 2272.93 Variate: Egg Size Source of variation d.f. s.s. m.s. v.r. F pr. Batch stratum 4 6.917 1.729 0.21 Batch.*Units* stratum Village 2 11.941 5.970 0.72 0.490 Phenotype 2 48.940 24.470 2.94 0.057 Village.Phenotype 4 2.330 0.582 0.07 0.991 Residual 122 1015.445 8.323 Total 134 1085.572 Variate: Haugh Unit Source of variation d.f. s.s. m.s. v.r. F pr. Batch stratum 4 37.07 9.27 0.32 Batch.*Units* stratum Village 2 70.93 35.47 1.22 0.299 Phenotype 2 178.53 89.27 3.07 0.050 Village.Phenotype 4 36.27 9.07 0.31 0.870 Residual 122 3548.93 29.09 Total 134 3871.73 Variate: Shell Thickness Source of variation d.f. s.s. m.s. v.r. F pr. Batch stratum 4 0.0005067 0.0001267 0.94 Batch.*Units* stratum Village 2 0.0011200 0.0005600 4.16 0.018 Phenotype 2 0.0163600 0.0081800 60.80 <.001 Village.Phenotype 4 0.0006400 0.0001600 1.19 0.319 Residual 122 0.0164133 0.0001345 Total 134 0.0350400 Carcass Performance Variate: Defeathered (%) Source of variation d.f. s.s. m.s. v.r. F pr. Batch stratum 4 0.00 0.00 0.00 Batch.*Units* stratum Village 2 0.88 0.44 0.01 0.989 Phenotype 2 104.78 52.39 1.36 0.261 Village.Phenotype 4 2.54 0.63 0.02 0.999 Residual 122 4707.64 38.59 Total 134 4815.83

238
Variate: Dressed (%) Source of variation d.f. s.s. m.s. v.r. F pr. Batch stratum 4 0.000 0.000 0.00 Batch.*Units* stratum Village 2 0.718 0.359 0.05 0.951 Phenotype 2 13.466 56.733 7.96 <.001 Village.Phenotype 4 11.839 2.960 0.42 0.797 Residual 122 869.476 7.127 Total 134 995.499 Variate: Breast Muscle (%) Source of variation d.f. s.s. m.s. v.r. F pr. Batch stratum 4 0.000 0.000 0.00 Batch.*Units* stratum Village 2 9.891 4.946 1.29 0.280 Phenotype 2 5.895 2.948 0.77 0.467 Village.Phenotype 4 6.369 .592 0.41 0.798 Residual 122 469.057 3.845 Total 134 491.212 Mortality Variate: Chick Mortality (%) Source of variation d.f. s.s. m.s. v.r. F pr. Batch stratum 4 0.0636 0.0159 0.15 Batch.*Units* stratum Phenotype 2 0.1524 0.0762 0.72 0.496 Residual 38 4.0498 0.1066 Total 44 4.2658 Variate:Total Mortality (%) Source of variation d.f. s.s. m.s. v.r. F pr. Batch stratum 4 4.000 1.000 0.39 Batch.*Units* stratum Village 2 6.933 3.467 1.36 0.260 Phenotype 2 154.533 77.267 30.33 <.001 Village.Phenotype 4 1.067 0.267 0.10 0.981 Residual 122 310.800 2.548 Total 134 477.333

239
EXPERIMENT FIVE: Naked necks, Frizzles and Normals Growth Performance Variate: Body Weight at Week 20 Source of variation d.f. s.s. m.s. v.r. F pr. Batch stratum 4 6.760 1.690 1.00 Sex stratum 1 5.654 5.654 3.346 Batch.Sex stratum 4 6.760 1.690 0.02 Batch.Sex.*Units* stratum Village 2 3.133 1.566 21.53 <.001 Mgt_Sytm 2 1.363 6.817 9368.39 <.001 Phenotype 4 4.745 1.186 1630.41 <.001 Village.Mgt_Sytm 4 1.958 4.896 6.73 <.001 Village.Phenotype 8 1.627 2.034 2.80 0.005 Mgt_Sytm.Phenotype 8 9.907 1.238 17.02 <.001 Village.Mgt_Sytm.Phenotype 16 1.822 1.139 1.56 0.071 Residual 1296 9.430 7.276 Total 1349 2.516 Variate: Weight Gain at Week 20 Source of variation d.f. s.s. m.s. v.r. F pr. Batch stratum 4 4.0 1.0 1.00 Sex stratum 1 105616 1.2 1056161.2 1.056 Batch.Sex stratum 4 4.0 1.0 0.01 Batch.Sex.*Units* stratum Village 2 13875.7 6937.9 35.92 <.001 Mgt_Sytm 2 435819.7 21790 9.9 1128.21 <.001 Phenotype 4 418682.5 10467 0.6 541.92 <.001 Village.Mgt_Sytm 4 2359.4 589.9 3.05 0.016 Village.Phenotype 8 2585.0 323.1 1.67 0.100 Mgt_Sytm.Phenotype 8 23001.0 2875.1 14.89 <.001 Village.Mgt_Sytm.Phenotype 16 2242.1 140.1 0.73 0.770 Residual 1296 250317.5 193.1 Total 1349 2205052.1 Egg Laying Performance Variate: Age at 1st Egg Source of variation d.f. s.s. m.s. v.r. F pr. Batch stratum 4 711.89 177.97 1.94 Batch.*Units* stratum Village 2 61.75 30.87 0.34 0.715 Mgt_Sytm 2 2360.73 1180.37 12.85 <.001 Phenotype 4 271.25 67.81 0.74 0.566 Village.Mgt_Sytm 4 3139.28 784.82 8.55 <.001 Village.Phenotype 8 112.91 14.11 0.15 0.996 Mgt_Sytm.Phenotype 8 328.72 41.09 0.45 0.892 Village.Mgt_Sytm.Phenotype 16 651.76 40.74 0.44 0.971 Residual 626 57490.38 91.84 Total 674 65128.66

240
Variate: Clutch Size Source of variation d.f. s.s. m.s. v.r. F pr. Batch stratum 4 0.053 0.013 0.00 Batch.*Units* stratum Village 2 34.901 17.450 1.79 0.168 Mgt_Sytm 2 4065.301 2032.650 208.62 <.001 Phenotype 4 1197.090 299.273 30.72 <.001 Village.Mgt_Sytm 4 17.988 4.497 0.46 0.764 Village.Phenotype 8 5.914 0.739 0.08 1.000 Mgt_Sytm.Phenotype 8 90.981 11.373 1.17 0.317 Village.Mgt_Sytm.Phenotype 16 15.108 0.944 0.10 1.000 Residual 626 6099.280 9.743 Total 674 11526.616 Variate: Clutch Size Source of variation d.f. s.s. m.s. v.r. F pr. Batch stratum 4 0.053 0.013 0.00 Batch.*Units* stratum Village 2 34.901 17.450 1.79 0.168 Mgt_Sytm 2 4065.301 2032.650 208.62 <.001 Phenotype 4 1197.090 299.273 30.72 <.001 Village.Mgt_Sytm 4 17.988 4.497 0.46 0.764 Village.Phenotype 8 5.914 0.739 0.08 1.000 Mgt_Sytm.Phenotype 8 90.981 11.373 1.17 0.317 Village.Mgt_Sytm.Phenotype 16 15.108 0.944 0.10 1.000 Residual 626 6099.280 9.743 Total 674 11526.616 Variate: Body Weight to Egg Weight Ratio Source of variation d.f. s.s. m.s. v.r. F pr. Batch stratum 4 0.000 0.000 0.00 Batch.*Units* stratum Village 2 0.000 0.000 0.00 1.000 Mgt_Sytm 2 63.845 31.923 16.85 <.001 Phenotype 4 111.879 27.970 14.76 <.001 Village.Mgt_Sytm 4 266.623 66.656 35.17 <.001 Village.Phenotype 8 0.000 0.000 0.00 1.000 Mgt_Sytm.Phenotype 8 34.570 4.321 2.28 0.021 Village.Mgt_Sytm.Phenotype 16 60.939 3.809 2.01 0.011 Residual 626 1186.276 1.895 Total 674 1724.132 Variate: Egg Size Source of variation d.f. s.s. m.s. v.r. F pr. Batch stratum 4 0.77 0.19 0.01 Batch.*Units* stratum Village 2 5.59 2.80 0.20 0.815 Mgt_Sytm 2 3591.19 1795.60 131.07 <.001 Phenotype 4 3620.67 905.17 66.07 <.001 Village.Mgt_Sytm 4 55.70 13.92 1.02 0.398 Village.Phenotype 8 16.54 2.07 0.15 0.997 Mgt_Sytm.Phenotype 8 40.73 5.09 0.37 0.936 Village.Mgt_Sytm.Phenotype 16 53.00 3.31 0.24 0.999 Residual 626 8575.95 13.70 Total 674 15960.15

241
Variate: Rate of Lay (Hen-housed) Source of variation d.f. s.s. m.s. v.r. F pr. Batch stratum 4 0.05 0.01 0.00 Batch.*Units* stratum Village 2 67.23 33.61 2.54 0.080 Mgt_Sytm 2 3226.03 1613.01 121.96 <.001 Phenotype 4 5292.19 1323.05 100.04 <.001 Village.Mgt_Sytm 4 68.13 17.03 1.29 0.273 Village.Phenotype 8 56.77 7.10 0.54 0.829 Mgt_Sytm.Phenotype 8 231.97 29.00 2.19 0.026 Village.Mgt_Sytm.Phenotype 16 62.67 3.92 0.30 0.997 Residual 626 8279.15 13.23 Total 674 17284.19 Variate: Rate of Lay (Hen-Day) Source of variation d.f. s.s. m.s. v.r. F pr. Batch stratum 4 1.33 0.33 0.01 Batch.*Units* stratum Village 2 180.56 90.28 3.12 0.045 Mgt_Sytm 2 4328.00 2164.00 74.81 <.001 Phenotype 4 6609.33 1652.33 57.12 <.001 Village.Mgt_Sytm 4 144.56 36.14 1.25 0.289 Village.Phenotype 8 32.51 4.06 0.14 0.997 Mgt_Sytm.Phenotype 8 270.67 33.83 1.17 0.315 Village.Mgt_Sytm.Phenotype 16 155.97 9.75 0.34 0.993 Residual 626 18107.07 28.93 Total 674 29830.00 Egg Quality Performance Variate: Haugh Unit (%) Source of variation d.f. s.s. m.s. v.r. F pr. Batch stratum 4 0.213 0.053 0.01 Batch.*Units* stratum Village 2 0.320 0.160 0.03 0.974 Mgt_Sytm 2 553.040 276.520 45.35 <.001 Phenotype 4 2831.280 707.820 116.09 <.001 Village.Mgt_Sytm 4 3.200 0.800 0.13 0.971 Village.Phenotype 8 10.880 1.360 0.22 0.987 Mgt_Sytm.Phenotype 8 203.360 25.420 4.17 <.001 Village.Mgt_Sytm.Phenotype 16 108.800 6.800 1.12 0.336 Residual 626 3816.987 6.097 Total 674 7528.080 Variate: Shell Thickness Source of variation d.f. s.s. m.s. v.r. F pr. Batch stratum 4 0.0000213 0.0000053 0.03 Batch.*Units* stratum Village 2 0.0000107 0.0000053 0.03 0.974 Mgt_Sytm 2 0.0008107 0.0004053 2.02 0.134 Phenotype 4 0.4006213 0.1001553 498.00 <.001 Village.Mgt_Sytm 4 0.0010853 0.0002713 1.35 0.250 Village.Phenotype 8 0.0002027 0.0000253 0.13 0.998 Mgt_Sytm.Phenotype 8 0.0154027 0.0019253 9.57 <.001 Village.Mgt_Sytm.Phenotype 16 0.0106613 0.0006663 3.31 <.001 Residual 626 0.1258987 0.0002011 Total 674 0.5547147

242
Carcass Performance Variate: Defeathered Weight (%) Source of variation d.f. s.s. m.s. v.r. F pr. Batch stratum 4 2.2303 0.5576 2.14 Batch.*Units* stratum Village 2 8.9101 4.4550 17.07 <.001 Mgt_Sytm 2 447.6137 223.8069 857.39 <.001 Phenotype 4 5220.6104 1305.1526 4999.94 <.001 Village.Mgt_Sytm 4 3.1985 0.7996 3.06 0.016 Village.Phenotype 8 4.0089 0.5011 1.92 0.055 Mgt_Sytm.Phenotype 8 157.9996 19.7499 75.66 <.001 Village.Mgt_Sytm.Phenotype 16 9.0596 0.5662 2.17 0.005 Residual 626 163.4069 0.2610 Total 674 6017.0380 Variate: Dressed Weight (%) Source of variation d.f. s.s. m.s. v.r. F pr. Batch stratum 4 16.820 4.205 1.70 Batch.*Units* stratum Village 2 27.868 13.934 5.63 0.004 Mgt_Sytm 2 3624.516 1812.258 731.64 <.001 Phenotype 4 13548.710 3387.178 1367.46 <.001 Village.Mgt_Sytm 4 15.437 3.859 1.56 0.184 Village.Phenotype 8 13.035 1.629 0.66 0.729 Mgt_Sytm.Phenotype 8 394.988 49.373 19.93 <.001 Village.Mgt_Sytm.Phenotype 16 27.997 1.750 0.71 0.789 Residual 626 1550.596 2.477 Total 674 19219.968 Variate: Breast Muscle (%) Source of variation d.f. s.s. m.s. v.r. F pr. Batch stratum 4 0.1636 0.0409 0.10 Batch.*Units* stratum Village 2 0.1636 0.0818 0.19 0.824 Mgt_Sytm 2 1.1107 0.5554 1.32 0.269 Phenotype 4 3164.7708 791.1927 1874.01 <.001 Village.Mgt_Sytm 4 6.8710 1.7177 4.07 0.003 Village.Phenotype 8 0.1344 0.0168 0.04 1.000 Mgt_Sytm.Phenotype 8 1.5010 0.1876 0.44 0.894 Village.Mgt_Sytm.Phenotype 16 3.1104 0.1944 0.46 0.965 Residual 626 264.2925 0.4222 Total 674 3442.1180
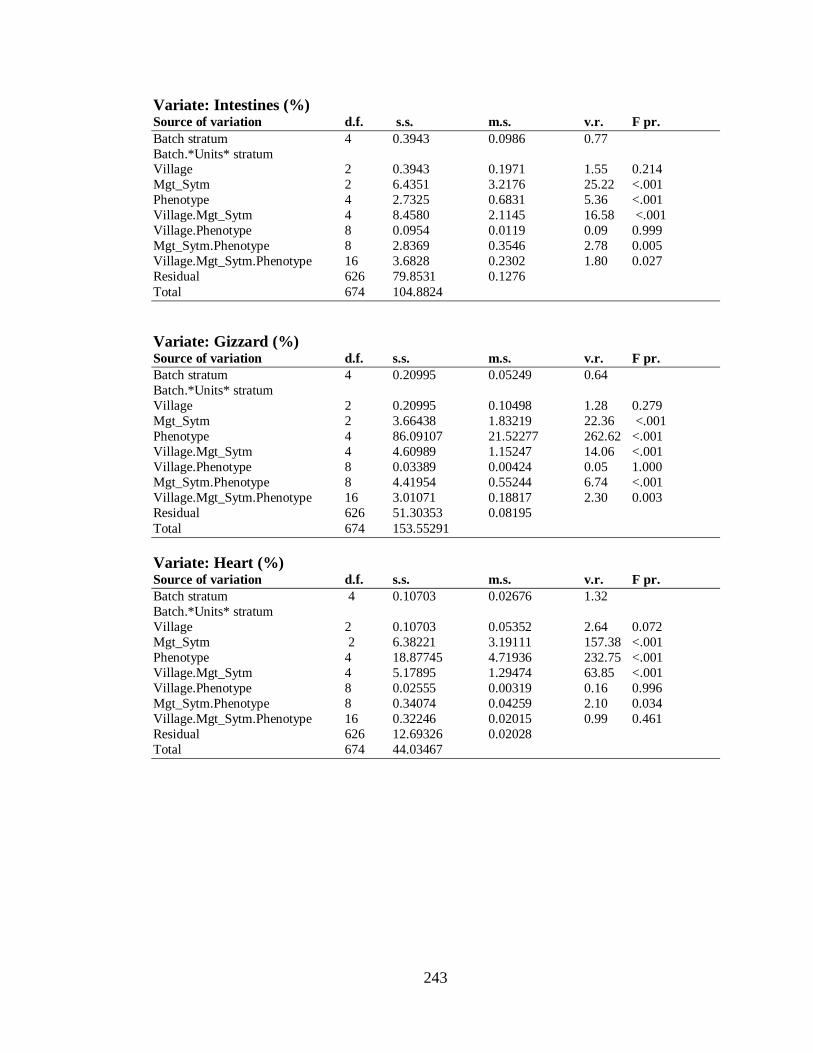
243
Variate: Intestines (%) Source of variation d.f. s.s. m.s. v.r. F pr. Batch stratum 4 0.3943 0.0986 0.77 Batch.*Units* stratum Village 2 0.3943 0.1971 1.55 0.214 Mgt_Sytm 2 6.4351 3.2176 25.22 <.001 Phenotype 4 2.7325 0.6831 5.36 <.001 Village.Mgt_Sytm 4 8.4580 2.1145 16.58 <.001 Village.Phenotype 8 0.0954 0.0119 0.09 0.999 Mgt_Sytm.Phenotype 8 2.8369 0.3546 2.78 0.005 Village.Mgt_Sytm.Phenotype 16 3.6828 0.2302 1.80 0.027 Residual 626 79.8531 0.1276 Total 674 104.8824 Variate: Gizzard (%) Source of variation d.f. s.s. m.s. v.r. F pr. Batch stratum 4 0.20995 0.05249 0.64 Batch.*Units* stratum Village 2 0.20995 0.10498 1.28 0.279 Mgt_Sytm 2 3.66438 1.83219 22.36 <.001 Phenotype 4 86.09107 21.52277 262.62 <.001 Village.Mgt_Sytm 4 4.60989 1.15247 14.06 <.001 Village.Phenotype 8 0.03389 0.00424 0.05 1.000 Mgt_Sytm.Phenotype 8 4.41954 0.55244 6.74 <.001 Village.Mgt_Sytm.Phenotype 16 3.01071 0.18817 2.30 0.003 Residual 626 51.30353 0.08195 Total 674 153.55291 Variate: Heart (%) Source of variation d.f. s.s. m.s. v.r. F pr. Batch stratum 4 0.10703 0.02676 1.32 Batch.*Units* stratum Village 2 0.10703 0.05352 2.64 0.072 Mgt_Sytm 2 6.38221 3.19111 157.38 <.001 Phenotype 4 18.87745 4.71936 232.75 <.001 Village.Mgt_Sytm 4 5.17895 1.29474 63.85 <.001 Village.Phenotype 8 0.02555 0.00319 0.16 0.996 Mgt_Sytm.Phenotype 8 0.34074 0.04259 2.10 0.034 Village.Mgt_Sytm.Phenotype 16 0.32246 0.02015 0.99 0.461 Residual 626 12.69326 0.02028 Total 674 44.03467

244
Variate: Liver Weight (%) Source of variation d.f. s.s. m.s. v.r. F pr. Batch stratum 4 0.61383 0.15346 4.50 Batch.*Units* stratum Village 2 0.61383 0.30692 9.00 <.001 Mgt_Sytm 2 4.14497 2.07249 60.80 <.001 Phenotype 4 18.69661 4.67415 137.14 <.001 Village.Mgt_Sytm 4 8.61338 2.15335 63.18 <.001 Village.Phenotype 8 0.01037 0.00130 0.04 1.000 Mgt_Sytm.Phenotype 8 0.07474 0.00934 0.27 0.974 Village.Mgt_Sytm.Phenotype 16 0.14844 0.00928 0.27 0.998 Residual 626 21.33677 0.03408 Total 674 54.25294 Mortality Variate: Mortality Source of variation d.f. s.s. m.s. v.r. F pr. Batch stratum 4 0.000 0.000 0.00 Batch.*Units* stratum Village 2 248.687 124.343 22.82 <.001 Mgt_Sytm 2 3552.667 1776.333 326.02 <.001 Phenotype 4 4172.000 1043.000 191.43 <.001 Village.Mgt_Sytm 4 405.673 101.418 18.61 <.001 Village.Phenotype 8 85.680 10.710 1.97 0.048 Mgt_Sytm.Phenotype 8 1224.000 153.000 28.08 <.001 Village.Mgt_Sytm.Phenotype 16 174.160 10.885 2.00 0.012 Residual 626 3410.800 5.449 Total 674 13273.667
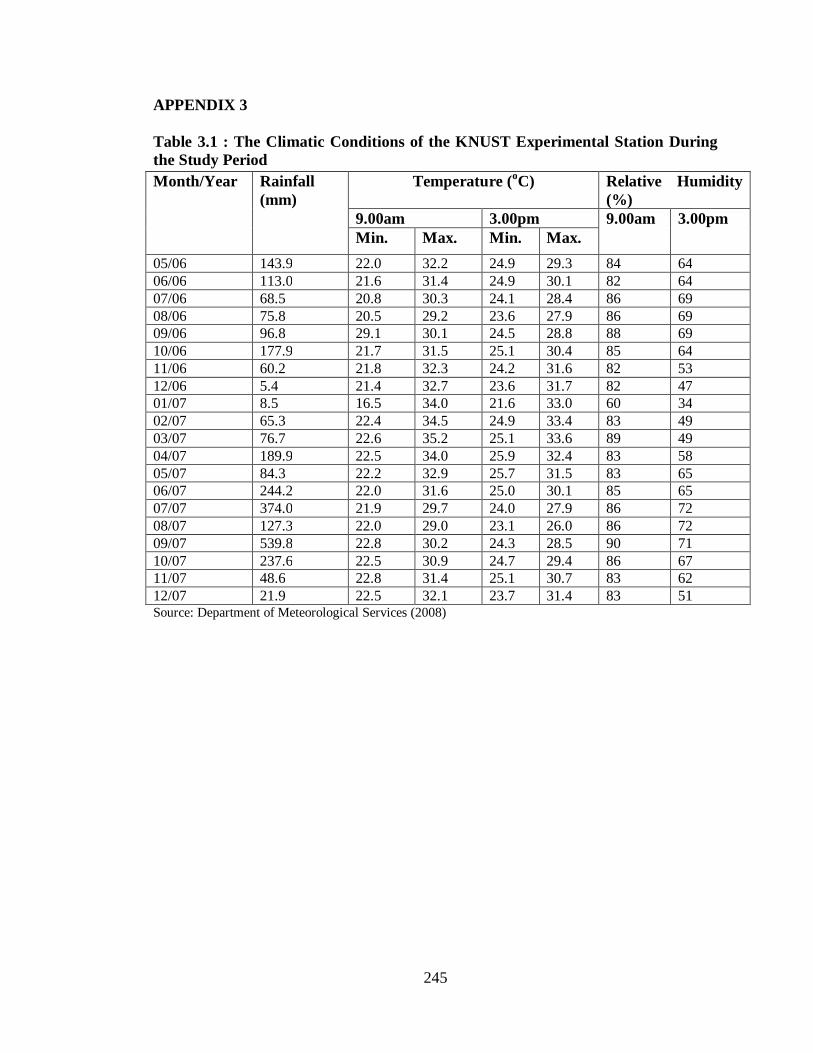
245
APPENDIX 3 Table 3.1 : The Climatic Conditions of the KNUST Experimental Station During the Study Period
Source: Department of Meteorological Services (2008)
Month/Year Rainfall (mm)
Temperature (oC) Relative Humidity (%)
9.00am 3.00pm 9.00am 3.00pm Min. Max. Min. Max.
05/06 143.9 22.0 32.2 24.9 29.3 84 64 06/06 113.0 21.6 31.4 24.9 30.1 82 64 07/06 68.5 20.8 30.3 24.1 28.4 86 69 08/06 75.8 20.5 29.2 23.6 27.9 86 69 09/06 96.8 29.1 30.1 24.5 28.8 88 69 10/06 177.9 21.7 31.5 25.1 30.4 85 64 11/06 60.2 21.8 32.3 24.2 31.6 82 53 12/06 5.4 21.4 32.7 23.6 31.7 82 47 01/07 8.5 16.5 34.0 21.6 33.0 60 34 02/07 65.3 22.4 34.5 24.9 33.4 83 49 03/07 76.7 22.6 35.2 25.1 33.6 89 49 04/07 189.9 22.5 34.0 25.9 32.4 83 58 05/07 84.3 22.2 32.9 25.7 31.5 83 65 06/07 244.2 22.0 31.6 25.0 30.1 85 65 07/07 374.0 21.9 29.7 24.0 27.9 86 72 08/07 127.3 22.0 29.0 23.1 26.0 86 72 09/07 539.8 22.8 30.2 24.3 28.5 90 71 10/07 237.6 22.5 30.9 24.7 29.4 86 67 11/07 48.6 22.8 31.4 25.1 30.7 83 62 12/07 21.9 22.5 32.1 23.7 31.4 83 51

246