local governance and public provision tamil nadu, india c. ramasamy vice-chancellor s. d. sivakumar...
TRANSCRIPT

Local Governance and Public Provision Tamil Nadu, India
C. RAMASAMYVice-Chancellor
S. D. SIVAKUMARK. UMA
Tamil Nadu Agricultural UniversityCoimbatore
Tamil Nadu, India

PRESENTATION – in brief
• History and development of Local Governance (Panchayats)
• About the project in TNAU - IFPRI
• Focus of this paper
• Impact of improved local governance

Local Governance - Genesis
• 1687 - British formed the first municipal corporation in Madras
• 1882 - Ripon Resolution elevated the role of local administration
• 1925 - Eight provinces in British India adopted the reforms – Madras, Bombay,
Bengal, Central provinces and Berar, Uttar Pradesh, Punjab and Assam
• 1935 - Government of India Act allowed provincial autonomy, facilitating the evolution of Grama Panchayats

Local Governance - Committees
• Balwant Rai Mehta Committee, 1959
• Ashok Mehta Committee, 1977
• 73rd Amendment 1992 – Establishment of Panchayat Raj in India

73rd Amendment – Key Features
• Three tier sytem• Panchayat in all villages in every State• Grama Sabha in each village• Direct election• Seats for socially under privileged and women• Uniform five year term• Preparing plans and implementing schemes
for social justice and economic development• State government authorizes Panchayat to
collect tax• State Finance Commission for Panchayats• State Election Commission

ORGANISATIONAL STRUCTURE – Tamil Nadu
Village Panchayats
12617
Panchayat Unions 385
District Panchayats
28
Presidents 12617 Ward
Members 97398
Chairman 385
Members 6499
Chairman 28
Members 648
Women 33 % Socially backward 20 %

GRAMA PANCHAYAT
Grama Panchayat
6 - 12 elected representativesPresidentVice-President
Grama sabha Persons in village registered in electoral rolls
Eligibility Age : above 21 yearsRegistered as votersMentally soundNot disqualified under any law

Cont’d…
Tenure 5 yearsDissolution allowedReconstitute within 6 months
Meetings Once in a month

FinanceTAXES AND LEVIES
• House Tax
• Profession Tax
• Tax on agricultural land for specific purpose
• Advertisement Tax
• Licensing fee for building plan and lay out approval
• Fees and charges on D and O trades, market fee, water charges, fees on cart-stand
• Other sources like revenue from social forestry, fishery rental, income from market, fairs, ferries, fines and penalties etc.
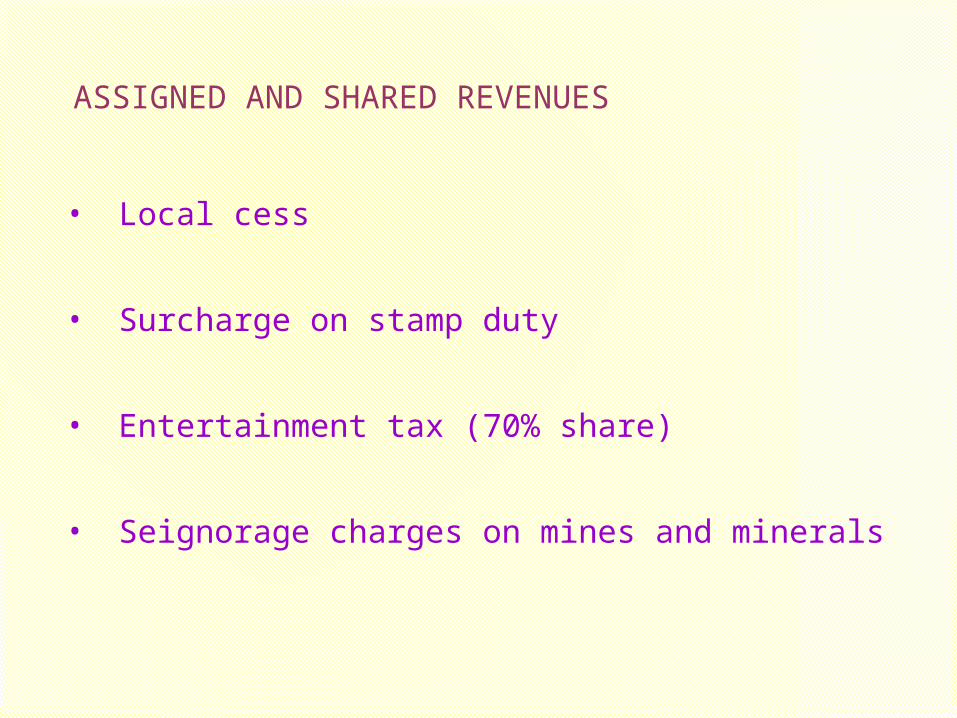
ASSIGNED AND SHARED REVENUES
• Local cess
• Surcharge on stamp duty
• Entertainment tax (70% share)
• Seignorage charges on mines and minerals

GRANTS
• Grants provided by Finance Commission, Government of India
• State Finance Commission Grant
• Development grants under schemes like JGSY, IAY and CRSP

Powers and Functions
• Obligatory functions – basic amenities
• Discretionary Functions• Developmental Functions• Regulatory and Administrative
Function• Judicial Functions
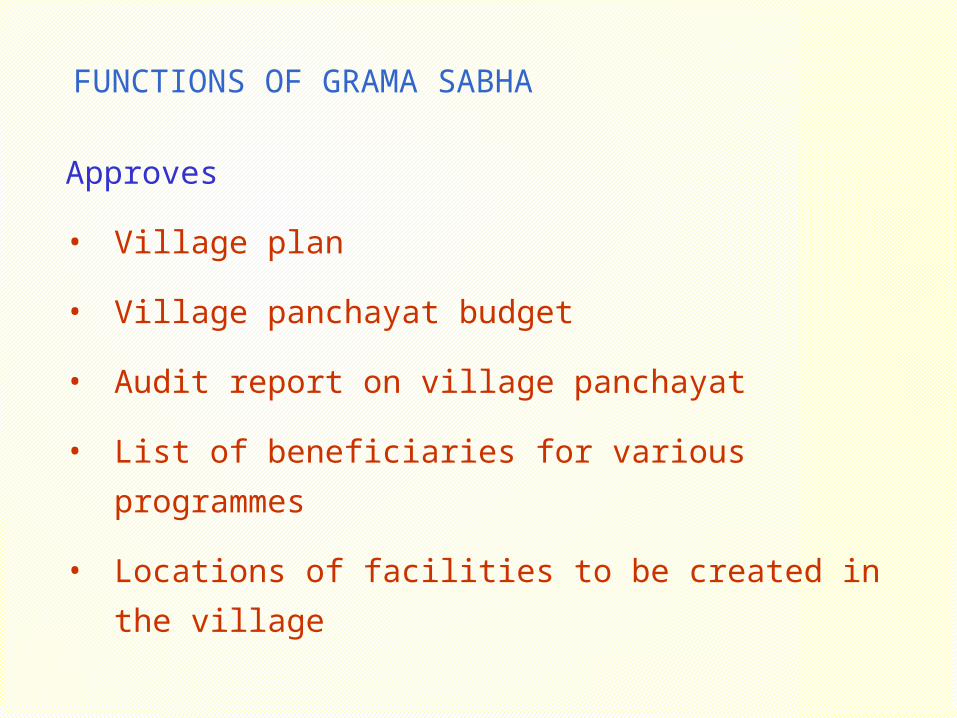
FUNCTIONS OF GRAMA SABHA
Approves
• Village plan
• Village panchayat budget
• Audit report on village panchayat
• List of beneficiaries for various programmes
• Locations of facilities to be created in the village

FUNCTIONS OF GRAMA SABHA
• Review works executed by the village panchayat and scrutinise the list of works undertaken for the year
• Promotes communal and social harmony among various groups of people in the village
• Mobilises voluntary labour and contribution in cash and kind for implementation of various development programmes
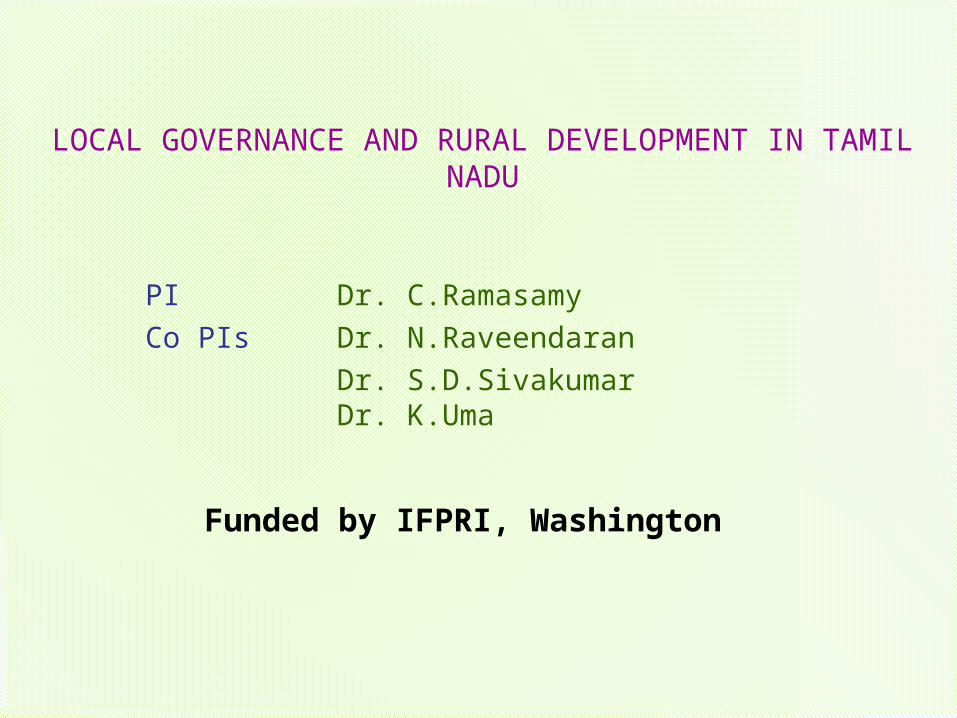
LOCAL GOVERNANCE AND RURAL DEVELOPMENT IN TAMIL NADU
PI Dr. C.RamasamyCo PIs Dr. N.Raveendaran
Dr. S.D.SivakumarDr. K.Uma
Funded by IFPRI, Washington

OBJECTIVES
• to examine the structure and functions of local governance (PRIs) in Tamil Nadu;
to analyse the vertical and horizontal relationships between local bodies and administrative units;
to study of the processes of local governance and implementation of development programmes
to study the extent of empowerment of local leaders and their effectiveness in development planning and implementation;
Cont’d
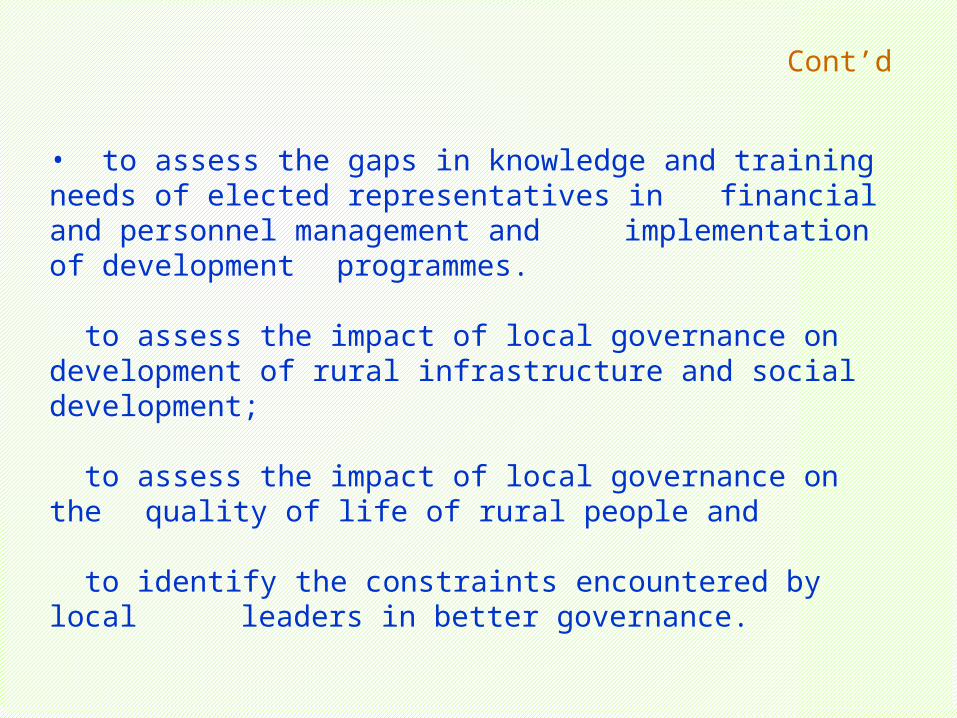
• to assess the gaps in knowledge and training needs of elected representatives in financial and personnel management and implementation of development programmes.
to assess the impact of local governance on development of rural infrastructure and social development;
to assess the impact of local governance on the quality of life of rural people and
to identify the constraints encountered by local leaders in better governance.

WORK DONE
•SAMPLING DESIGN
DISTRICTS SELECTED Coimbatore Well developed region
Vellore Moderately developed regionPudukottai Less developed region
In each districtFour Panchayat Unions – simple random sampling
In each Panchayat union12 Village Panchayats - simple random sampling
( with proportionate representation for Women Presidents and reserved Panchayats)
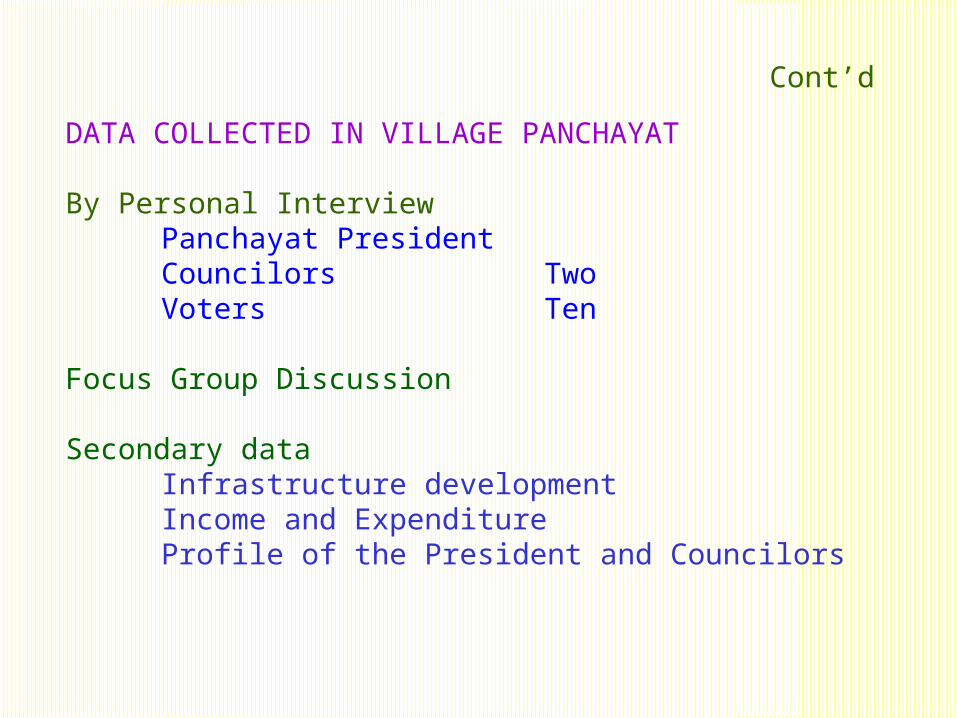
Cont’d
DATA COLLECTED IN VILLAGE PANCHAYAT
By Personal InterviewPanchayat PresidentCouncilors TwoVoters Ten
Focus Group Discussion
Secondary data Infrastructure developmentIncome and ExpenditureProfile of the President and Councilors

FOCUS OF THE PAPER
Local governance and infrastructure development - linkages to poverty reduction

Expenditure in Selected Panchayats (Rs. in hundred thousands)
Figures in the parenthesis indicate percentage to total
Account Developed region
Moderately developed
region
Less developed region
1991-1992
2004-2005
1991-1992
2004-2005
1991-1992
2004-2005
Own funds
4.8(5.4)
193.5(28.1)
9.5(17.3
)
42.6(26.9)
0.05(0.0)
21.9(15.4)
State funds
0 61.6(8.9)
0 8.1(5.1)
0 11.1(7.8)
Scheme Funds
83.5(94.6
)
433.4(62.9)
45.4(82.7
)
107.9(68.0)
55.0(100.0
)
108.3(75.9)
Total 88.3(100.
0)
688.5(100.0
)
54.9(100.
0)
158.6(100.0
)
55.0(100.0
)
142.6(100.0
)
Per village
1.85 14.46 1.15 3.33 1.16 3.00

Investment on Rural Infrastructure (Percentage to total)
Activity Developed region MDR Less developed region
1991-1992
2004-2005
1991-1992
2004-2005
1991-1992
2004-2005
Road 21.7 24.2 14.6 32.3 32.7 39.5
Street light 2.4 4.9 7.3 5.2 0 2.7
Drinking water 4.2 21.8 7.3 18.9 0.4 7.3
Sanitation 3.3 14.5 2.9 4.0 4.7 2.5
Desilting of tanks
1.4 3.9 0.9 2.9 8.5 6.2
Construction of building
0.9 11.2 7.7 1.3 0 0.9
Others 66.1 19.8 59.4 35.3 53.7 40.8Total 88.3
(100.0)
688.5(100.0
)
54.9(100.
0)
158.5(100.
0)
55.1(100.0
)
142.6(100.0
)

Account wise Investment on Rural Infrastructure Developed Region 2004 – 05 (Rs. in hundred thousands)
Activity Panchayat Account Other schemes
1991-92 2004-05 1991-92
2004-05
Road 0 34.6(17.9)
19.2(23.0)
131.8(26.6)
Street light 2.1(43.8)
28.9(14.9)
0 4.8(1.0)
Drinking water 2.3(47.9)
97.9(50.6)
1.4(1.7)
52.1(10.5)
Sanitation 0.1(2.1)
27.8(14.4)
2.8(3.4)
72.0(14.5)
Desilting of tanks 0 0.2(0.1)
1.2(1.4)
26.6(5.4)
Construction of building
0 1.2(0.6)
0.8(1.0)
75.6(15.3)
Others 0.3(6.3)
2.9(1.5)
58.1(69.6)
132.1(26.7)
Total 4.8(100.0)
193.5(100.0)
83.5(100.0)
495.0(100.0)

Account wise Expenditure on Rural Infrastructure by Social Class of Presidents 2004 - 05 (Rs. in hundred
thousands)
Account Developed region
Moderately developed region
Less developed
region
General Reserved
General
Reserved
General
Reserved
Village Panchayat General Account
168.1(29.0)
25.4(23.3)
34.5(25.0)
8.0(34.3)
16.9(14.7)
5.0(18.1)
State Funds 50.3(8.7)
11.3(10.4)
7.8(5.6)
1.4(6.0)
10.1(8.8)
1.0(3.6)
Scheme Funds Account
361.0(62.3)
72.4(66.4)
95.9(69.4)
10.9(46.8)
87.9(76.6)
21.7(78.3)
Total 579.4(100.0
)
109.1(100.0
)
138.2(100.
0)
23.3(100.0)
114.8(100.0
)
27.7(100.0
)
Per village 15.24 10.9 3.54 2.59 2.95 3.11

Account wise Expenditure on Rural Infrastructure by Gender of Presidents2004 - 05 (Rs. in hundred thousands)
Account Developed region
Moderately developed region
Less developed
region
Men Women
Men Women Men Women
Village Panchayat General Account
132.6(30.2)
44.3(25.7)
29.9(27.0)
12.7(26.6)
14.8(16.9)
7.2(13.1)
State funds 46.5(10.6)
15.1(8.7)
6.4(5.8)
1.6(3.4)
10.5(12.0)
0.6(1.1)
Scheme Funds Account
249.7(56.9)
113.2(65.6)
74.5(67.2)
33.4(70.0)
62.5(71.2)
47.1(85.8)
Total 438.8(100.0
)
172.6(100.
0)
110.8(100.
0)
47.7(100.0
)
87.8(100.
0)
54.9(100.
0)
Per village 13.61 10.79 3.44 2.98 2.72 3.43

Literacy Level in Selected Panchayats Percentages
Categories
Developed Region
Moderately developed
region
Less developed
region
1991 Censu
s
2001 Censu
s
1991 Censu
s
2001 Censu
s
1991 Censu
s
2001 Censu
s
Literates 48 73 49 72 40 70
Illiterates 52 27 51 28 60 30
Total 147848
(100)
180773
(100)
128819
(100)
156326
(100)
99627(100)
121609(100)

Percentage of Livestock of High Quality in Selected Panchayats
Livestock
Developed Region
Moderately developed
region
Less developed
region
1991 Cens
us
2002 Censu
s
1991 Cens
us
2002 Cens
us
1991 Cens
us
2002 Censu
s
Cows 29.79 33.23 6.35 85.81 35.41 41.86
Buffaloes 24.04 28.75 3.04 56.90 29.06 33.54
Sheep 8.65 9.06 2.58 12.00 24.17 26.04
Goat 22.71 28.44 2.25 8.65 17.92 18.75
Poultry 29.58 36.35 3.69 38.13 33.54 36.31

Percentage of Livestock Fed with Mixed Feedstuff in Selected Panchayats
Livestock
Developed Region
Moderately developed
region
Less developed
region
1991 Cens
us
2002 Censu
s
1991 Cens
us
2002 Cens
us
1991 Cens
us
2002 Censu
s
Cows 40.10 53.54 44.06 87.92 38.16 45.11
Buffaloes 28.23 49.06 26.81 58.75 39.86 45.93
Sheep 7.50 14.58 19.58 34.33 13.85 12.5
Goat - - 19.06 34.27 8.33 9.27
Poultry 51.38 56.70 9.58 36.98 43.54 49.89

Percentage of population using PHCs
Utilization of PHCs
Developed Region
Moderately developed
region
Less developed
region
1991 2005 1991 2005 1991 2005
None 0 0 0 0 0 0
Less than 25 %
2 0 46 0 54 8
25- 50 % 92 2 54 46 46 46
50-75 % 6 94 0 54 0 46
Almost all 0 4 0 0 0 4
Total 48(100)
48(100)
48(100)
48(100)
48(100)
48(100)
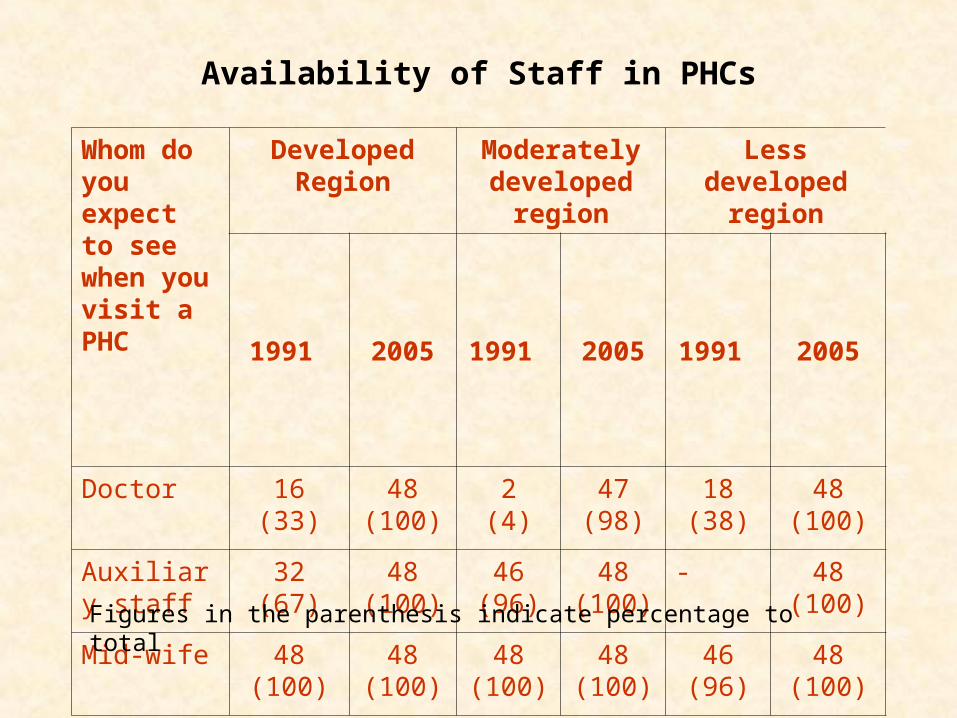
Availability of Staff in PHCs
Whom do you expect to see when you visit a PHC
Developed Region
Moderately developed
region
Less developed
region
1991 2005 1991 2005 1991 2005
Doctor 16(33)
48(100)
2(4)
47(98)
18(38)
48(100)
Auxiliary staff
32(67)
48(100)
46(96)
48(100)
- 48(100)
Mid-wife 48(100)
48(100)
48(100)
48(100)
46(96)
48(100)
Figures in the parenthesis indicate percentage to total

Extent of Immunization
(Number)
Immunization
1991 2005
Developed
region
Moderately
developed
Less develope
d
Developed region
Moderately
developed
Less develope
d
DPT 2011 5188 1544 4360 6822 1690
BCG 2011 5112 1394 4341 6877 1577
MMR 0 0 21 0 4788 0
OPV 2007 6184 1497 4341 8016 1680
Measles 2007 5001 1499 4342 7121 1662
TTV 2202 8612 3095 4940 11482 2647
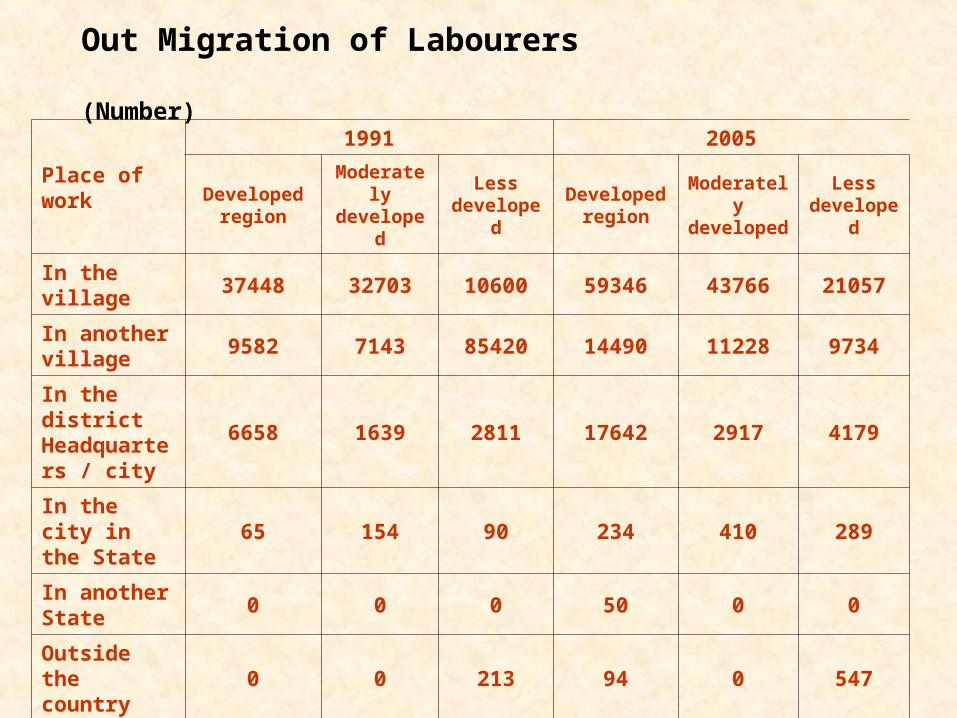
Out Migration of Labourers
(Number)
Place of work
1991 2005
Developed region
Moderately
developed
Less develop
ed
Developed region
Moderately
developed
Less develop
ed
In the village
37448 32703 10600 59346 43766 21057
In another village
9582 7143 85420 14490 11228 9734
In the district Headquarters / city
6658 1639 2811 17642 2917 4179
In the city in the State
65 154 90 234 410 289
In another State
0 0 0 50 0 0
Outside the country
0 0 213 94 0 547
Total 53753 41639 22256 91856 58321 35806

Impact of Improved Rural Governance

Impact of Improved Rural Governance
Particulars Developed Region
Moderately developed
region
Less developed
region
1991
2001
1991
20011991
2001
Poverty reduction (%)
29 18 32 21 34 23
Rate of urbanization (%)
40 48 40 46 39 46
Non farm earnings of small and marginal farmers (%)
36 50 26 57 28 56
Attendance at Primary Schools (%)
80 97 75 96 76 96
Electrical connection to rural poor households (%)
96 98 87 96 89 97

Cont’d
• Mini bus coverage to interior villages – 0 at 1991 to 80 % during 2005
• Reservation for marginalized groups and women highly successful after a decade of Panchayat Raj implementation
• Higher rate of internal revenue generation
• Activities of Self Help Groups of women has expanded very fast
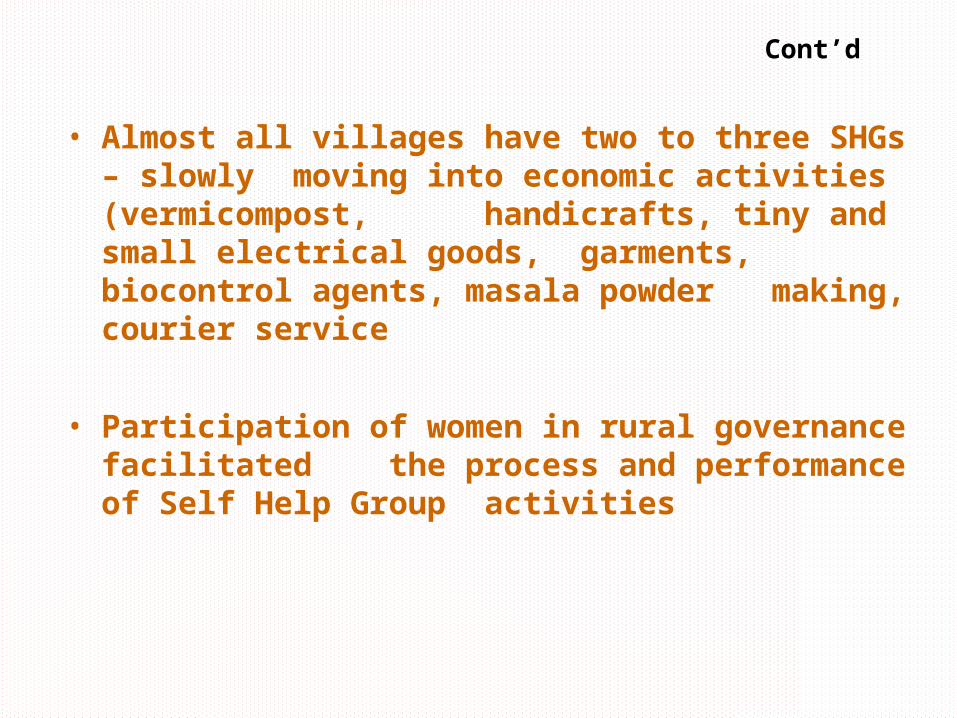
Cont’d
• Almost all villages have two to three SHGs – slowly moving into economic activities (vermicompost, handicrafts, tiny and small electrical goods, garments, biocontrol agents, masala powder making, courier service
• Participation of women in rural governance facilitated the process and performance of Self Help Group activities
Cont’d
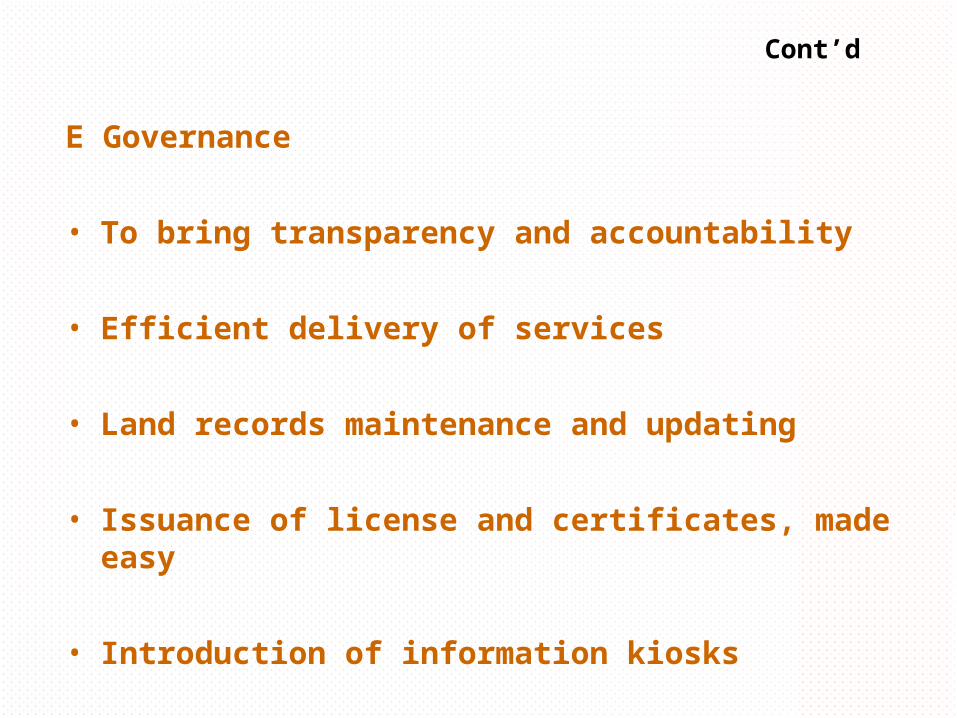
E Governance
• To bring transparency and accountability
• Efficient delivery of services
• Land records maintenance and updating
• Issuance of license and certificates, made easy
• Introduction of information kiosks

THANK YOU