local government finances and financial management in tanzania · authorities’ capacity for...
TRANSCRIPT
Local government finances and financial management in Tanzania Baseline data from six councils, 2000-2003
Odd-Helge Fjeldstad with Florida Henjewele, Geoffrey Mwambe, Erasto Ngalewa and Knut Nygaard
WP 2004: 7
Local government finances and financial management in Tanzania
Baseline data from six councils, 2000-2003
Odd-Helge Fjeldstad
with Florida Henjewele, Geoffrey Mwambe,
Erasto Ngalewa and Knut Nygaard
WP 2004: 7
Chr. Michelsen Institute Development Studies and Human Rights
CMI Working Papers This series can be ordered from: Chr. Michelsen Institute P.O. Box 6033 Postterminalen, N-5892 Bergen, Norway Tel: + 47 55 57 40 00 Fax: + 47 55 57 41 66 E-mail: [email protected] www.cmi.no Price: NOK 50 ISSN 0805-505X ISBN 82-8062-087-7 This report is also available at: www.cmi.no/publications Indexing terms Public finance Local government Financial management Tanzania Project title Formative Process Research on the Local Government Reform Programme in Tanzania Project number 21050 © Chr. Michelsen Institute 2004
iii
Contents PREFACE......................................................................................................................................................................................V EXECUTIVE SUMMARY ..................................................................................................................................................... VI 1 INTRODUCTION.....................................................................................................................................................................1 2 FISCAL AUTONOMY ............................................................................................................................................................2
2.1 REVENUES.............................................................................................................................................................................2 2.1.1 Local revenues............................................................................................................................................................3 2.1.2 Grants...........................................................................................................................................................................6 2.1.3 Total revenues: Grants and own sources...............................................................................................................7
2.2 EXPENDITURE .......................................................................................................................................................................9 2.2.1 Allocations to the education sector...................................................................................................................... 10 2.2.2 Allocations to the health sector............................................................................................................................ 10
3 METHODS OF REVENUE COLLECTION ................................................................................................................. 11 4 FINANCIAL MANAGEMENT ......................................................................................................................................... 13
4.1 ORGANISATION AND STAFFING OF THE TREASURY DEPARTMENTS............................................................................13 4.2 ORGANISATION AND STAFFING OF THE INTERNAL AUDITOR’S OFFICE......................................................................14 4.3 COMPUTERISATION OF THE TREASURY DEPARTMENTS...............................................................................................14 4.4 AUDIT QUERIES..................................................................................................................................................................15
4.4.1 Internal auditing...................................................................................................................................................... 15 4.4.2 External auditing..................................................................................................................................................... 16
4.5 BUDGETS AND ACCOUNTS................................................................................................................................................17 4.5.1 Gap between budgeted and accounted revenues............................................................................................... 17 4.5.2 Gender budgeting.................................................................................................................................................... 17
5 TRANSPARENCY IN FINANCIAL AND FISCAL AFFAIRS................................................................................ 19 6 TAX COMPLIANCE AND FISCAL CORRUPTION ................................................................................................ 21 7 CONCLUSIONS ..................................................................................................................................................................... 27
7.1 SUMMARY...........................................................................................................................................................................27 7.2 IMPLICATIONS FOR POLICY...............................................................................................................................................28
REFERENCES ........................................................................................................................................................................... 30

iv
v
Preface
As part of its support to the Local Government Reform Programme (LGRP), NORAD is financing a Formative Process Research Project to follow closely the development of the LGRP. In consultation with the President’s Office-Regional Administration and Local Government (PO-RALG), the project has been organised on the basis of institutional collaboration between Research on Poverty Alleviation (REPOA), Dar es Salaam, Chr. Michelsen Institute (CMI), Bergen, and the Norwegian Institute for Urban and Regional Studies (NIBR), Oslo. The project runs for the period 2002-2006. The formative process research concentrates on the following three broad dimensions of the local government reform:
(1) Governance: local autonomy and citizen participation. (2) Finance and financial management: accountability, efficiency and local resource
mobilisation. (3) Service delivery and poverty alleviation: criteria of success and operational constraints.
Whereas improved service delivery for poverty alleviation represents the ultimate goal of the reform, the other two themes represent means to this end. Hence, the major focus of the Formative Process Research Programme is to observe changes in local authorities in the provision of basic services to the public. Moreover, the research aims to analyse changes in local authorities’ capacity for financial management and revenue enhancement, and changes relating to governance, including the accountability and responsiveness of the local government. This report provides baseline data on ‘Finance and financial management’ from six councils for the period 2000-2003. The report is written by Odd-Helge Fjeldstad. During the course of the work on the study Erasto Ngalewa organised the data collection in the case councils and provided background information and statistics from PO-RALG. Florida Henjewele and Geoffrey Mwambe were responsible for collecting data from the case councils, while Knut Nygaard systematised relevant information based on the citizens’ survey. Useful comments and suggestions for improvements of a previous draft were received from two anonymous referees. Special thanks to the Local Government Reform Team (PO-RALG) and the contact persons in the case councils for their assistance, and to the many people in the councils visited who took the time to speak with us. Points of view and any remaining errors must be attributed to the author.
vi
Executive summary
1 Introduction This report provides baseline data on local government finance and financial management in six councils in Tanzania: Bagamoyo District Council, Ilala Municipal Council, Iringa DC, Kilosa DC, Moshi DC, and Mwanza City Council. The data cover the period 2000-2003 and represent a reference point for the situation in the six councils with respect to various dimensions of local government finance and financial management in this period. The following key indicators are used as reference points: (i) the degree of fiscal autonomy; (ii) financial management, including budgeting, accounting and auditing; (iii) methods of revenue collection; (iv) transparency in fiscal and financial affairs; and (v) tax compliance and fiscal corruption in the case councils. A brief summary of key findings is presented below. 2 Fiscal autonomy Fiscal autonomy of district councils is limited with respect to both revenues and expenditures. The four rural councils in our sample generated less than 17% of their total revenue from their own sources in 2002. For Moshi DC, the percentage was less than 10%. The rationalisation and abolition of many local revenue sources in June 2003 have most likely reduced the already limited fiscal autonomy of district councils even further. In contrast, the two urban councils, Ilala MC and Mwanza CC, are less dependent on central government grants than the rural councils. In 2002, Ilala MC generated about 64% of its revenue through their own sources and Mwanza CC almost 48%. However, none of the six case councils experienced an increase in their own generated share of total revenues during the three-year period 1999-2002. In Bagamoyo DC, Iringa DC and Mwanza CC, there is a clear downward trend in their own revenue as a percentage of total revenue. A similar picture applies with respect to expenditure since the grants from the central government are conditional and earmarked for specific sectors. In general, we observe a considerable annual increase in total expenditure in the case councils during the period 2000-2002, although the annual fluctuations in some councils are substantial. Hence, from 2000 to 2001, Moshi DC experienced a significant decline in its expenditure level (-18.2%), and Bagamoyo DC saw a decline of 22.8% in total expenditure from 2001 to 2002. But from 2001 to 2002, Moshi DC saw an increase of more than 95% in its level of expenditure. For Iringa DC and Kilosa DC, expenditure levels increased by 78% and 59%, respectively, from 2001 to 2002. The allocation of expenditure between priority sectors shows substantial differences between the case councils. In particular, this is the case for allocations to the education sector, while we observe less difference between the allocations to the health sector. For instance, while Kilosa allocated about 22% of total expenditure to education in 2002, the corresponding figure for Moshi DC was 66%. On average, the allocation to the health sector in the case councils was around 10% of total expenditure in 2002. 3 Methods of revenue collection Local government tax collection is the responsibility of the council staff and is completely separated from the central government. In district councils it is organised around three levels, namely the council headquarters, the wards and the villages. At the council headquarters the responsibility for tax collection rests with the council treasury, headed by the Treasurer. At the ward levels, the responsibility rests with the office of the Ward Executive Officer (WEO). The WEO also handles developmental issues and law-and-order functions at that level. For this purpose the local militia is at their disposal. In wards with greater revenue potential there will
vii
also be a ward revenue collector (WRC) to support the WEO. At the village level, the responsibility rests with the office of the village executive officer (VEO). The VEO is also responsible for supervising village developmental activities and for maintaining law and order. In addition, the VEOs often function as Village Council secretaries. In practice, the organisation of tax collection varies between councils. For instance, in some councils the village level has been excluded from collection, and the task is taken over by the ward level. This is due to incentive problems connected with tax collection at the village level. Most case councils have introduced new methods to increase revenue from existing sources by outsourcing some of the revenue collection. Only in Iringa DC are all their own revenues collected by the council staff. 4 Financial management With respect to the quality of financial management, our research cannot, at this stage, identify any differences between the case councils that were part of the initial LGRP phase 1 and those which were not. Gaps between budgets and accounts provide an indication of the quality and realism of budgeting in the case councils. In Ilala MC and Bagamoyo DC, the annual revenue estimates in the period 2000-2002 are within a 10% range of the reported revenues. For the four other councils, the gaps between accounts and budgets in 2002 were between 13% (Kilosa) and 35% (Iringa). No trend can be derived from the data, as the gaps between reported and projected revenues vary from year to year in all councils. For some councils, and in particular for Moshi DC, the annual fluctuations are substantial and reflect weak budgeting. Budgeting and accounting are still carried out manually in all the six case councils. In practice, only Kilosa applies PLATINUM in combination with a manual system. Ilala MC has started to implement PLATINUM, and Epicor is in place in Mwanza CC. In contrast, Bagamoyo, Iringa and Moshi have not yet started to computerise financial management and planning. The staffing situation in the case councils’ treasury departments differs with respect to both the number of staff members and their qualifications. This partly reflects the size of the councils. For instance, Mwanza CC has 42 staff members in the Treasury Department, compared to 17 in the Treasury in Bagamoyo. To some extent it also reflects the fact that some councils are more attractive to work in than others, for instance llala versus Iringa. However, a general picture from the Treasury Departments is that about one third or less of the staff are trained accountants. The remaining majority of staff have either no formal training in accounting or only certificates. The Internal Auditor’s Offices in the case councils are either weakly staffed or not staffed at all. Bagamoyo has no internal auditor in place, and in Iringa DC the vacant position was not filled until mid-2003. Hence, until recent ly the internal auditing in Iringa DC was carried out by the Treasury staff themselves. This has undermined the credibility of the auditing process. In the most recent report from the Controller and Auditor General (CAG) more councils than before received a ‘clean’ report on their accounts. This applies to Ilala MC, Kilosa DC, Moshi DC and Mwanza CC, which all received ‘clean’ reports in 2001. But it is too early to state whether this is a trend or only accidental. To our knowledge, the quality of the CAG’s reports on local authorities has not been evaluated. Hence, one should be cautious about drawing conclusions based on the CAG’s findings. Preliminary observations from the case councils indicate, however, that no significant improvements have taken place in recent years to curb corruption, with the possible exception of Kilosa DC, which seems to have experienced positive managerial changes since mid-2002.
viii
5 Transparency in financial and fiscal affairs All the case councils report that they disseminate information on financial and fiscal affairs to the public through meetings organised by the council, including full council meetings, and ward and village meetings. Ilala MC, Kilosa DC and Mwanza CC also report that they use newspapers to inform citizens. Moreover, notice boards at ward and council headquarters are used in Ilala MC, Moshi DC and Mwanza CC. However, there are reasons to question the effectiveness of these dissemination mechanisms and whether the information actually reaches the public. Few of the respondents in a recently conducted citizens’ survey, covering 1260 respondents in the case councils, say they have seen any information about local government finance. As many as 86% of all the respondents say they have never received information on the amount of tax revenue and user charges collected in their area. There are, however, large variations across councils. The respondents in Kilosa DC appear to be the relatively best informed, whereas the highest levels of ignorance among citizens with regard to tax collection are found in the urban councils Ilala MC and Mwanza CC. Among those who have received this kind of information from the council, the Village Executive Officers (VEOs) are in general the most likely institution to have issued it. In contrast, the large majority (77.5% of the respondents) have seen posters for HIV/AIDS. Moreover, when asked where they have received information on various government policies, such as tax policy, HIV/AIDS control policy, health policy, education policy, the local government reform etc., radio is the medium the majority of the respondents refer to. Newspapers and other forms of information dissemination used by the local authorities seem to play a minor role. 6 Tax compliance and fiscal corruption In all the case councils, taxpayers’ unwillingness to pay taxes and fees are reported as a major obstacle to enhancing local government revenues. The citizens’ survey provides some indications on factors that impact on taxpayers’ compliance behaviour. Only 28.6% of the respondents see taxpayers’ unwillingness to pay to be a problem. In contrast, too high taxes (47.9% of the respondents) and dishonest tax collectors (45.7%) are perceived to be major problems. However, the most serious problem perceived by a majority of the respondents (58.4%) is that the money collected is not spent on public services. With respect to the urban-rural divide, which has been observed on other issues, the respondents in Ilala MC and Mwanza CC perceive that too many taxes/fees and ha rassment by tax collectors are larger problems than is the case for the respondents in the rural councils. Dissatisfaction on poor linkages between taxes paid and service delivery show no rural-urban divide. In general, taxes are widely perceived to be unfair. Firstly, only 9% of the respondents agree with the statement that ‘most of the tax revenue collected in the area is used for reciprocal services’. Secondly, the majority of all respondents (51%) hold the view that people should stop paying taxes unt il services improve. Thirdly, 73% of the respondents say they would be willing to pay more taxes in exchange for improved services. The respondents in Iringa DC are, however, the least inclined to increase tax payments willingly in exchange for service improvements. Almost 50% of all respondents think that people would evade taxes if they could get away with it. However, we observe some differences between the case councils. While 59% of the respondents in Moshi DC say that they believe most taxpayers would evade taxes if they thought they could get away with it, the corresponding figure for Kilosa DC is 39%. The most cited reason for tax compliance (46%), on the other hand, is that people pay because they ‘will
ix
avoid disturbances’. Only 23% of the respondents say that they believe people pay because they anticipate public services being delivered. Corruption is perceived to be a problem in all the six case councils. However, there are large differences across councils with respect to the extent of corruption. In Kilosa DC, 40% of the respondents view corruption as a serious problem, compared to 72% in Moshi DC. Moreover, in Kilosa 40% of the respondents say they have seen a decline in the level of corruption during the last two years, whereas in Moshi 53% have observed an increase. There is agreement across councils that corruption must be combated at every opportunity. Almost one third (27%) of the respondents think that misuse of tax revenue is unavoidable, though there are large variations across councils. Only 11% of respondents in Iringa DC see misuse as unavoidable, compared to as many as 41% in Moshi DC. In general, respondents favour village authorities over ward, council and parliamentarians to allocate tax revenues honestly. Another interesting observation is the relatively high degree of trust in the Tanzania Revenue Authority (TRA). As many as 64% of all respondents think that reporting misuse of tax revenue to a journalist would help reduce this form of corruption. Some respondents do not think any measures will impact on the extent of tax revenue misuse. The most frequent reason given for this attitude is the view that ‘all civil servants are corrupt and they protect each other’. This attitude indicates that much is still to be done to build relationships of trust between the local authorities and citizens. The most favoured measures to improve the use of tax revenues, as expressed by the respondents, are stronger punishment of government employees and of politicians. These measures apply across all the case councils. More information to the public on the allocation of tax revenues is also perceived to be a potentially important measure to improve the use of revenues. 7 Conclusions For many councils, a major administrative problem today is the ir inability to collect fully the revenue due to them. Fundamental issues to be addressed in this context are the redesign of current local revenue structures and strengthened financial management. Moreover, measures are required to enhance taxpayers’ compliance and to improve the accountability of tax collectors and councillors. A fundamental requirement when further redesigning the local tax system is a greater emphasis on the cost-effectiveness of revenue collection, taking into account not only the direct costs of tax administration, but also the overall costs to the economy, including taxpayers’ compliance costs. In addition, losses through corruption and tax evasion need to be reduced. To achieve these aims, there is a need for further simplification of the licence and fee structures by reducing coverage and the number of rates. Fees and licences that have regulatory functions, such as sand fees, and hunting and business licences, should be harmonised with central government taxes to avoid double taxation and conflicts with national development policies such as employment creation and environmental protection. Furthermore, uniform rates of taxes on agricultural crops (crop cess) are necessary to minimise distortions. In this context it might be worth considering the possibility of centralising the collection of certain local taxes. For instance, cess on export crops could be collected by the Tanzania Revenue Authority at their points of export.
x
More realism is required when it comes to the implementation of a properly functioning property tax system. The municipalities’ capacity and capability to administer the property tax have, in general, proved to be inadequate. Hence, it has been difficult for many councils both to maintain the current property valuation registers and to continue the property valuation exercises. There is therefore a need to reassess the basis of the property tax in urban councils and to implement a simpler and more coherent approach to the valuation provision, which takes into consideration administrative capacity and capability constraints facing the councils. Moreover, the experience of urban councils suggests caution when extending property tax to district councils. Transparency with respect to budgets and accounts is at the heart of local government accountability. Local authorities publish information on revenues collected and allocations of funds, as they are obliged to according to the Local Authority Financial Memorandum 1997. At present, much of this information does not reach or is not understood by the general public. Public notices in newspapers or posted on notice boards at the council headquarters are often presented in a relatively complicated and technical way, which makes them inaccessible to ordinary citizens. Many people do not take an interest in reading notices and newspapers. An important challenge, therefore, is to provide information on fiscal issues in ways which are understandable and which reach the general public. The successful dissemination of information on HIV/AIDS prevention may provide useful lessons on how to design and disseminate information on budgets and accounts to the communities. Written and oral methods of dissemination should be combined, including information posted at service outlets such as schools and dispensaries, and at village and ward offices. More active use of the VEOs and mtaa leaders to communicate such information to citizens may also pay high dividends, as the experience of Kilosa and Iringa indicates. Urban councils will in general require additional measures compared to rural councils. High mobility and resident turnover in urban areas make it more difficult to reach citizens with such information. Improved information to the public on budgets and accounts may improve the opportunities for citizens to exercise their voice and hold local authorities accountable. It is, however, important to stress that encouraging citizens and the civil society to engage in fiscal and financial monitoring at the local level does not imply that such measures should replace formal auditing and accounting mechanisms. Nor does it imply that such measures will weaken the formal accountability mechanisms. On the contrary, it can strengthen the legitimacy and standing of local authorities in the communities by contributing with complementary measures to improved control of revenue collection and expenditure.
1
1 Introduction
The overall objective of the Formative process research project on local government reform in Tanzania is to document the processes of change and impact of the Local Government Reform Programme (LGRP) in Tanzania, and to provide managers and key stakeholders with operationally relevant data and analyses of lessons learned during implementation of the reform. This report presents and analyses data on ‘finance and financial management’ in six councils in Tanzania: Bagamoyo District Council, Ilala Municipal Council, Iringa DC, Kilosa DC, Moshi DC, and Mwanza City Council. The data cover the period 2000-2003, and represent a reference point for the situation in the six councils with respect to various dimensions of local government finance and financial management in this period.1 The following themes are covered by the study: (i) the degree of fiscal autonomy; (ii) financial management, including budgeting, accounting and auditing; (iii) methods of revenue collection; (iv) transparency in fiscal and financial affairs; and (v) tax compliance and fiscal corruption. In essence, a small, common database has been developed for all case councils. The case councils were selected on the basis of the following criteria (see the Inception Report, 30 October 2002):
• variations in resource bases; • rural-urban variations; • degree of inclusion in the LGRP; • degree of donor presence or support; and • composition of political parties.
The rationale for including councils that were not part of the initial phase 1 of the reform (i.e., Bagamoyo DC, Kilosa DC and Moshi DC) was to establish the extent to which changes occur even without the incentives of the Local Government Reform. By individualising or contrasting comparison we wanted to identify other reform or change agents located at the local level or in other sectors than those driving the LGR. The report does not aim to explore causalities (e.g., what specific reform measures led to the specific changes observed), but rather focuses on what changes are or can be observed in each of the case councils with respect to finance and financial management over the period of analysis. The report aims to be a ‘generator of ideas’ for further analysis of processes of change. The data on expenditure, finances and financial management are derived on the basis of a combination of quantitative and qualitative methodologies:
• A citizens’ survey comprising 1260 respondents, i.e. 210 respondents in each case council.
• Quantitative data collected in the case councils and from PO-RALG. • Quantitative data submitted by contact persons in the case councils.
1 This report does not discuss finance and financial management at lower local government levels (i.e. wards and villages/mtaas). Details on these issues are found in URT (2003a). Currently, there are about 2,400 wards (kata) in Tanzania and more than 9,000 registered villages. Villages have at least 250 households (kayas) and are sub-divided into vitongoji. On average there are about 3 vitongoji per village.
2
• Qualitative research in each council, ward and village designed especially to examine events of change due to the LGR (see the Fieldwork Manual 2003 for details on the key informants interviewed).
• Qualitative research at the central level, including ministries, national interest organisations (including ALAT), national NGOs, and large donors in order to explore major changes in the relations between local and central government responsibilities due to the LGR, and variations between central level stakeholders.
The report is organised as follows: Chapter 2 focuses on fiscal autonomy. The councils’ share of their own revenues and grants from the central government is compared, and changes over time discussed, reflecting the degree of fiscal autonomy in the councils. The chapter also presents the status of and recent changes in local government expenditure, and allocations to the priority sectors education and health in each of the six case councils. In Chapter 3, modes of revenue collection are discussed. The focus of chapter 4 is financial management in the case councils. Several indicators of the status of and changes in financial management are applied, including staffing of the councils’ finance departments, the internal auditors’ offices and computerisation of the treasury departments. Moreover, the status of and recent changes in internal and external audit queries are presented. Thereafter, as an indicator of the quality of budgeting, the gap between budgeted and accounted revenues in the case councils is discussed. Finally, the status of gender budgeting is presented. Then, in chapter 5, transparency in financial and fiscal affairs is presented, including the dissemination of fiscal information to the public in the case councils. Chapter 6 provides a detailed account of citizens’ perceptions of tax compliance and fiscal corruption in the case councils. These perceptions provide indications of the level of citizens’ trust in the local governments. Finally, chapter 7 concludes.
2 Fiscal autonomy
2.1 Revenues Local authorities have three major sources of funding: their own revenues, central government transfers, and development aid (Fjeldstad, 2003). In addition, user charges and various forms of self-help activities contribute to the running and maintenance of public services such as primary schools and health facilities. Although data on the extent of user charges and self-help activities is not available, some studies from the late 1990s indicate that these contributions are significant and increasing (Cooksey & Mmuya 1997; Semboja & Therkildsen 1995). A recent update on this development is not available. Local governments’ own revenues represented less than 6% of the total national tax revenues in Tanzania in 2002. This share had then been almost unchanged since 1996. However, the share dropped substantially in FY 2003 following the rationalisation of local taxes, including the abolition of a development levy (URT, 2003b). Self-generated revenues in district councils are mainly used to finance operational costs, in particular salaries for the lower cadre of local government employees and sitting allowances for councillors. The lion’s share of the operational costs in district councils, however, is funded by central government transfers. In 2002, these transfers funded on average 85-90% of the total operational costs in district councils. With respect to investment, many councils are almost completely dependent on transfers from the central level, including donor funding. 2
2 According to information from the LGRT (December 2003), PO-RALG plans to carry out a detailed study to determine the expenditure composition of local authorities (e.g., the allocations to Personal Emoluments and
3
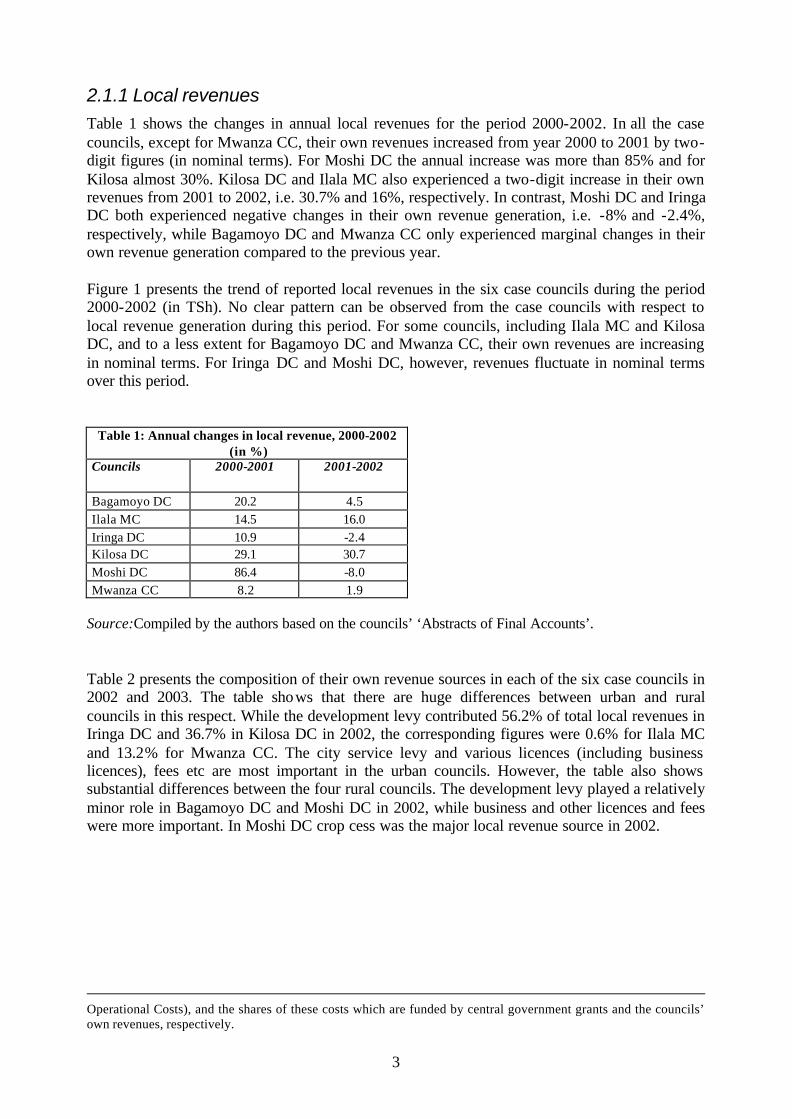
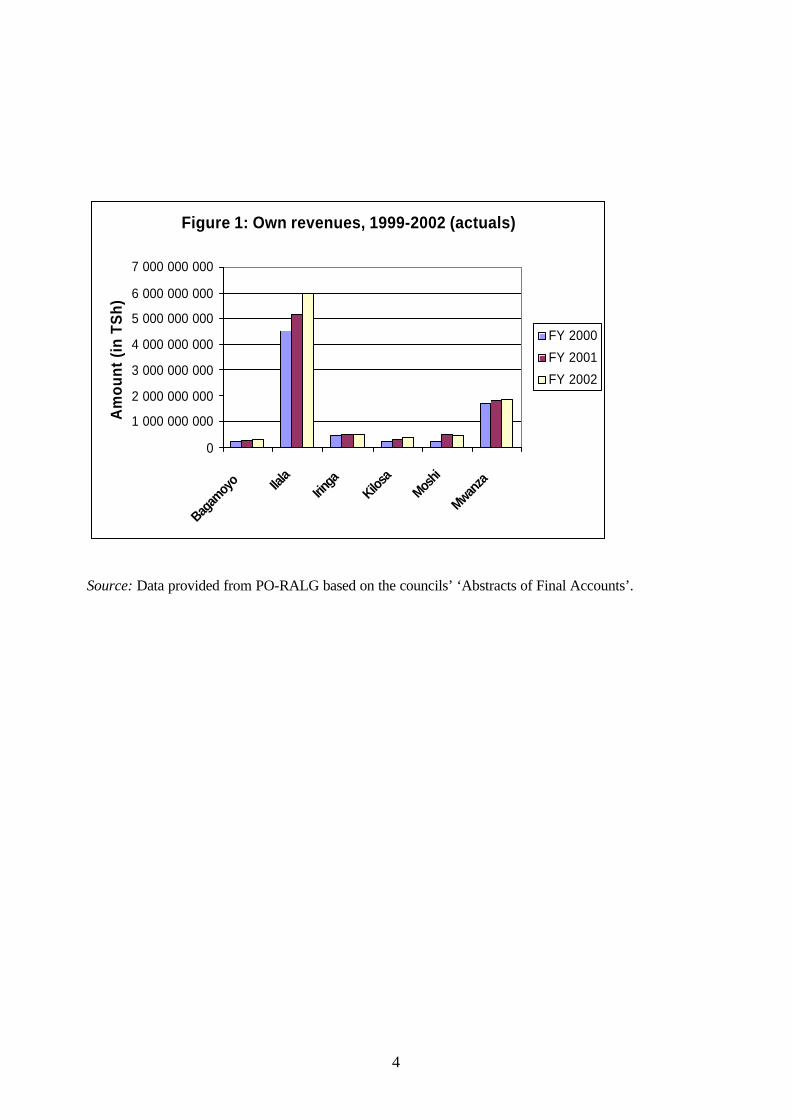
2.1.1 Local revenues Table 1 shows the changes in annual local revenues for the period 2000-2002. In all the case councils, except for Mwanza CC, their own revenues increased from year 2000 to 2001 by two-digit figures (in nominal terms). For Moshi DC the annual increase was more than 85% and for Kilosa almost 30%. Kilosa DC and Ilala MC also experienced a two-digit increase in their own revenues from 2001 to 2002, i.e. 30.7% and 16%, respectively. In contrast, Moshi DC and Iringa DC both experienced negative changes in their own revenue generation, i.e. -8% and -2.4%, respectively, while Bagamoyo DC and Mwanza CC only experienced marginal changes in their own revenue generation compared to the previous year. Figure 1 presents the trend of reported local revenues in the six case councils during the period 2000-2002 (in TSh). No clear pattern can be observed from the case councils with respect to local revenue generation during this period. For some councils, including Ilala MC and Kilosa DC, and to a less extent for Bagamoyo DC and Mwanza CC, their own revenues are increasing in nominal terms. For Iringa DC and Moshi DC, however, revenues fluctuate in nominal terms over this period.
Table 1: Annual changes in local revenue, 2000-2002 (in %)
Councils 2000-2001 2001-2002
Bagamoyo DC 20.2 4.5 Ilala MC 14.5 16.0 Iringa DC 10.9 -2.4 Kilosa DC 29.1 30.7 Moshi DC 86.4 -8.0 Mwanza CC 8.2 1.9
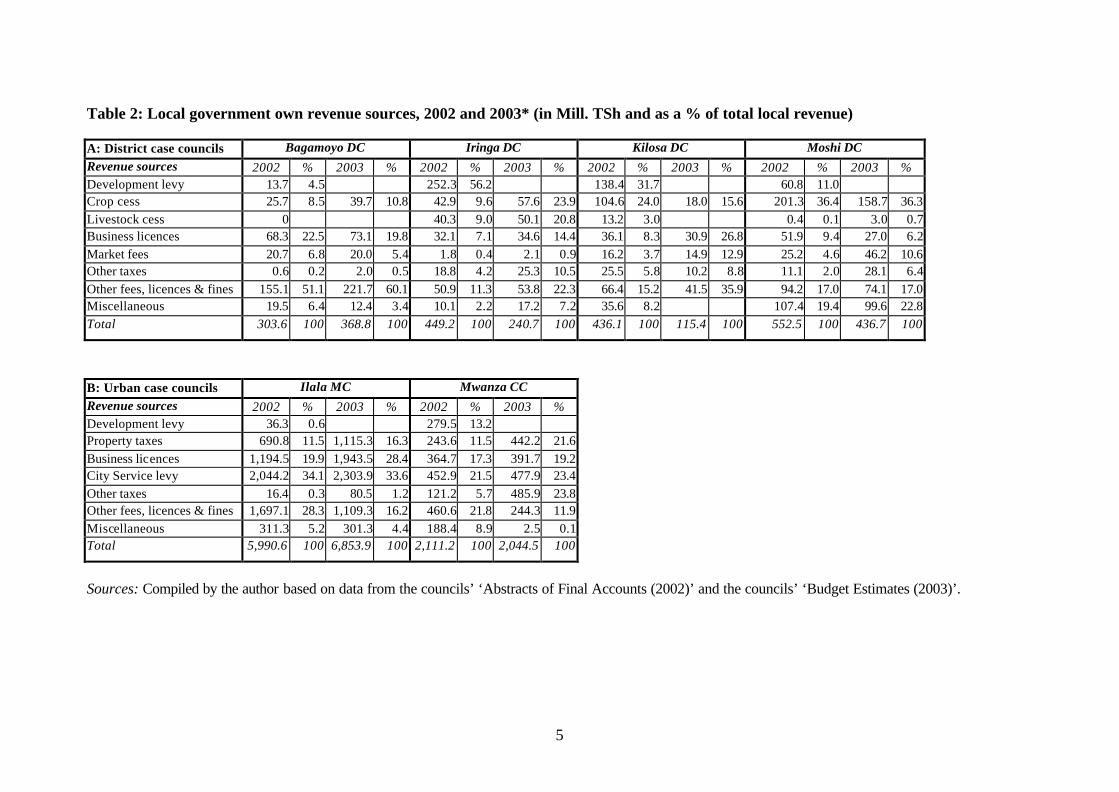
Source: Compiled by the authors based on the councils’ ‘Abstracts of Final Accounts’. Table 2 presents the composition of their own revenue sources in each of the six case councils in 2002 and 2003. The table shows that there are huge differences between urban and rural councils in this respect. While the development levy contributed 56.2% of total local revenues in Iringa DC and 36.7% in Kilosa DC in 2002, the corresponding figures were 0.6% for Ilala MC and 13.2% for Mwanza CC. The city service levy and various licences (including business licences), fees etc are most important in the urban councils. However, the table also shows substantial differences between the four rural councils. The development levy played a relatively minor role in Bagamoyo DC and Moshi DC in 2002, while business and other licences and fees were more important. In Moshi DC crop cess was the major local revenue source in 2002.
Operational Costs), and the shares of these costs which are funded by central government grants and the councils’ own revenues, respectively.
4
Figure 1: Own revenues, 1999-2002 (actuals)
0
1 000 000 000
2 000 000 000
3 000 000 000
4 000 000 000
5 000 000 000
6 000 000 000
7 000 000 000
Bagam
oyo Ila
laIrin
gaKilo
saMos
hi
Mwanza
Am
ount
(in
TS
h)
FY 2000
FY 2001
FY 2002
Source: Data provided from PO-RALG based on the councils’ ‘Abstracts of Final Accounts’.
5
Table 2: Local government own revenue sources, 2002 and 2003* (in Mill. TSh and as a % of total local revenue) A: District case councils Bagamoyo DC Iringa DC Kilosa DC Moshi DC Revenue sources 2002 % 2003 % 2002 % 2003 % 2002 % 2003 % 2002 % 2003 % Development levy 13.7 4.5 252.3 56.2 138.4 31.7 60.8 11.0 Crop cess 25.7 8.5 39.7 10.8 42.9 9.6 57.6 23.9 104.6 24.0 18.0 15.6 201.3 36.4 158.7 36.3 Livestock cess 0 40.3 9.0 50.1 20.8 13.2 3.0 0.4 0.1 3.0 0.7 Business licences 68.3 22.5 73.1 19.8 32.1 7.1 34.6 14.4 36.1 8.3 30.9 26.8 51.9 9.4 27.0 6.2 Market fees 20.7 6.8 20.0 5.4 1.8 0.4 2.1 0.9 16.2 3.7 14.9 12.9 25.2 4.6 46.2 10.6 Other taxes 0.6 0.2 2.0 0.5 18.8 4.2 25.3 10.5 25.5 5.8 10.2 8.8 11.1 2.0 28.1 6.4 Other fees, licences & fines 155.1 51.1 221.7 60.1 50.9 11.3 53.8 22.3 66.4 15.2 41.5 35.9 94.2 17.0 74.1 17.0 Miscellaneous 19.5 6.4 12.4 3.4 10.1 2.2 17.2 7.2 35.6 8.2 107.4 19.4 99.6 22.8 Total 303.6 100 368.8 100 449.2 100 240.7 100 436.1 100 115.4 100 552.5 100 436.7 100
B: Urban case councils Ilala MC Mwanza CC Revenue sources 2002 % 2003 % 2002 % 2003 % Development levy 36.3 0.6 279.5 13.2 Property taxes 690.8 11.5 1,115.3 16.3 243.6 11.5 442.2 21.6 Business licences 1,194.5 19.9 1,943.5 28.4 364.7 17.3 391.7 19.2 City Service levy 2,044.2 34.1 2,303.9 33.6 452.9 21.5 477.9 23.4 Other taxes 16.4 0.3 80.5 1.2 121.2 5.7 485.9 23.8 Other fees, licences & fines 1,697.1 28.3 1,109.3 16.2 460.6 21.8 244.3 11.9 Miscellaneous 311.3 5.2 301.3 4.4 188.4 8.9 2.5 0.1 Total 5,990.6 100 6,853.9 100 2,111.2 100 2,044.5 100
Sources: Compiled by the author based on data from the councils’ ‘Abstracts of Final Accounts (2002)’ and the councils’ ‘Budget Estimates (2003)’.
6
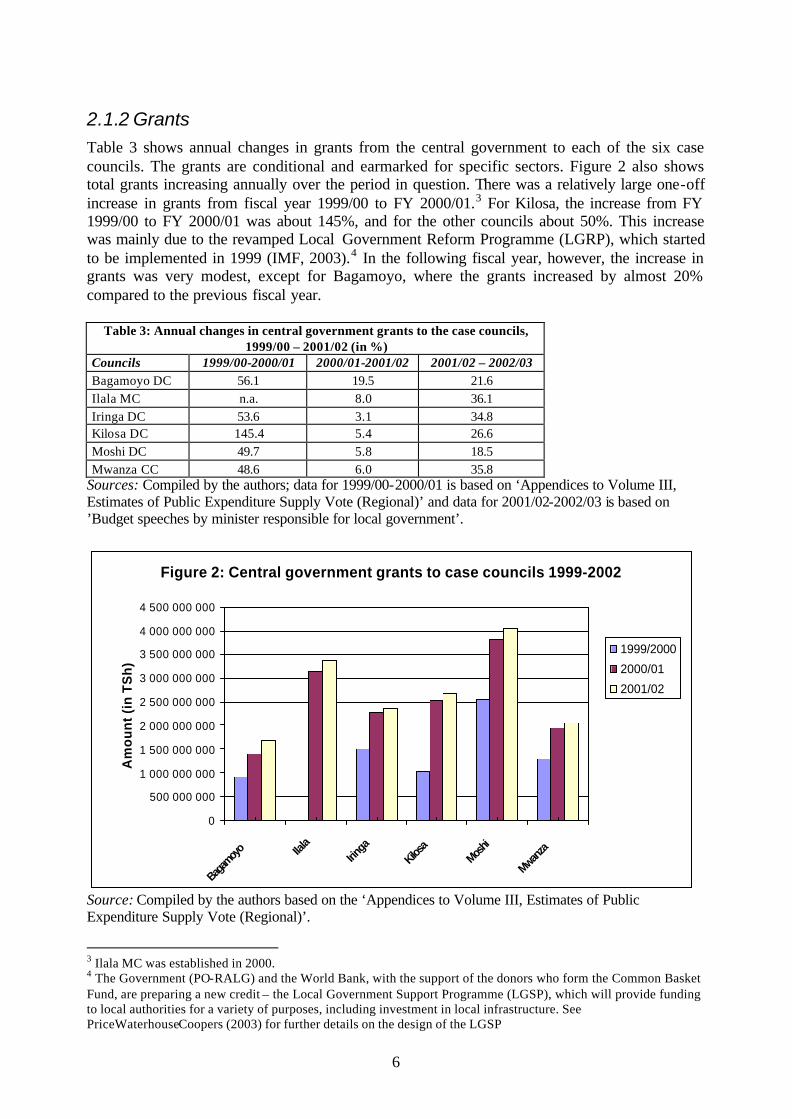
2.1.2 Grants Table 3 shows annual changes in grants from the central government to each of the six case councils. The grants are conditional and earmarked for specific sectors. Figure 2 also shows total grants increasing annually over the period in question. There was a relatively large one-off increase in grants from fiscal year 1999/00 to FY 2000/01.3 For Kilosa, the increase from FY 1999/00 to FY 2000/01 was about 145%, and for the other councils about 50%. This increase was mainly due to the revamped Local Government Reform Programme (LGRP), which started to be implemented in 1999 (IMF, 2003).4 In the following fiscal year, however, the increase in grants was very modest, except for Bagamoyo, where the grants increased by almost 20% compared to the previous fiscal year.
Table 3: Annual changes in central government grants to the case councils, 1999/00 – 2001/02 (in %)
Councils 1999/00-2000/01 2000/01-2001/02 2001/02 – 2002/03 Bagamoyo DC 56.1 19.5 21.6 Ilala MC n.a. 8.0 36.1 Iringa DC 53.6 3.1 34.8 Kilosa DC 145.4 5.4 26.6 Moshi DC 49.7 5.8 18.5 Mwanza CC 48.6 6.0 35.8
Sources: Compiled by the authors; data for 1999/00-2000/01 is based on ‘Appendices to Volume III, Estimates of Public Expenditure Supply Vote (Regional)’ and data for 2001/02-2002/03 is based on ’Budget speeches by minister responsible for local government’.
Figure 2: Central government grants to case councils 1999-2002
0
500 000 000
1 000 000 000
1 500 000 000
2 000 000 000
2 500 000 000
3 000 000 000
3 500 000 000
4 000 000 000
4 500 000 000
Bagam
oyo Ila
laIrin
gaKilos
aMos
hi
Mwanza
Am
ou
nt
(in
TS
h)
1999/2000
2000/01
2001/02
Source: Compiled by the authors based on the ‘Appendices to Volume III, Estimates of Public Expenditure Supply Vote (Regional)’.
3 Ilala MC was established in 2000. 4 The Government (PO-RALG) and the World Bank, with the support of the donors who form the Common Basket Fund, are preparing a new credit – the Local Government Support Programme (LGSP), which will provide funding to local authorities for a variety of purposes, including investment in local infrastructure. See PriceWaterhouseCoopers (2003) for further details on the design of the LGSP
7
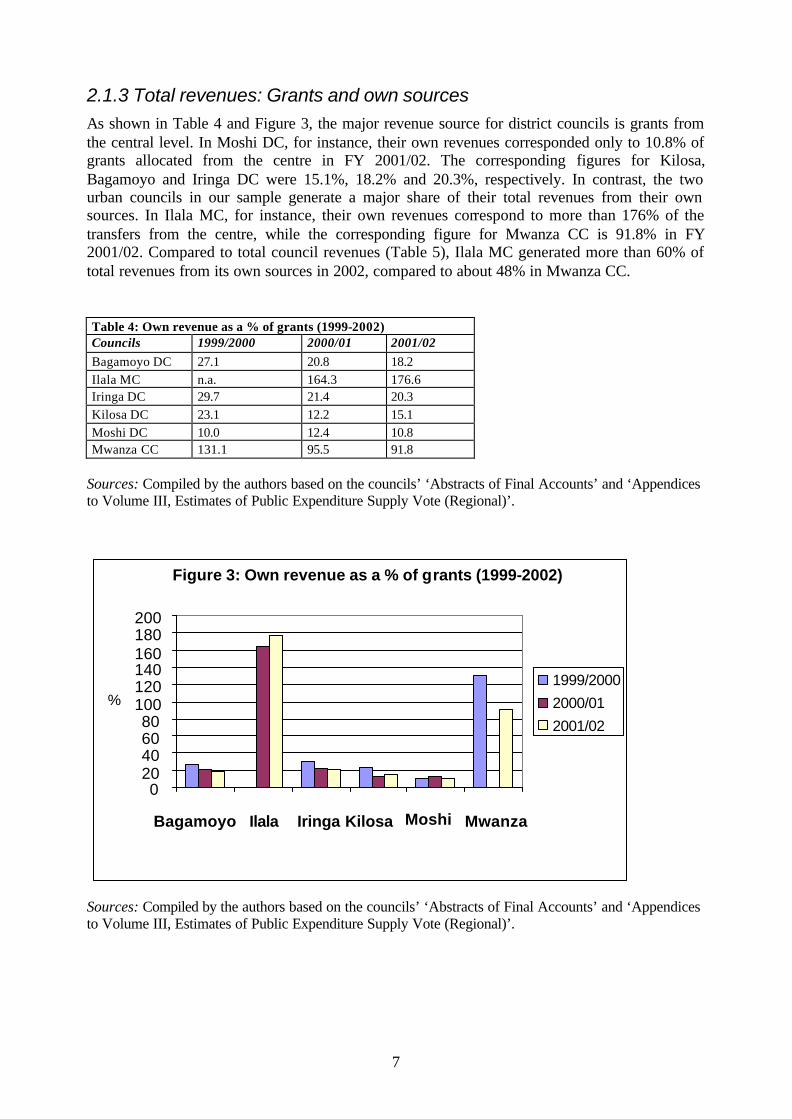
2.1.3 Total revenues: Grants and own sources As shown in Table 4 and Figure 3, the major revenue source for district councils is grants from the central level. In Moshi DC, for instance, their own revenues corresponded only to 10.8% of grants allocated from the centre in FY 2001/02. The corresponding figures for Kilosa, Bagamoyo and Iringa DC were 15.1%, 18.2% and 20.3%, respectively. In contrast, the two urban councils in our sample generate a major share of their total revenues from their own sources. In Ilala MC, for instance, their own revenues correspond to more than 176% of the transfers from the centre, while the corresponding figure for Mwanza CC is 91.8% in FY 2001/02. Compared to total council revenues (Table 5), Ilala MC generated more than 60% of total revenues from its own sources in 2002, compared to about 48% in Mwanza CC. Table 4: Own revenue as a % of grants (1999-2002) Councils 1999/2000 2000/01 2001/02 Bagamoyo DC 27.1 20.8 18.2 Ilala MC n.a. 164.3 176.6 Iringa DC 29.7 21.4 20.3 Kilosa DC 23.1 12.2 15.1 Moshi DC 10.0 12.4 10.8 Mwanza CC 131.1 95.5 91.8
Sources: Compiled by the authors based on the councils’ ‘Abstracts of Final Accounts’ and ‘Appendices to Volume III, Estimates of Public Expenditure Supply Vote (Regional)’.
Sources: Compiled by the authors based on the councils’ ‘Abstracts of Final Accounts’ and ‘Appendices to Volume III, Estimates of Public Expenditure Supply Vote (Regional)’.
Figure 3: Own revenue as a % of grants (1999-2002)
0 20 40 60 80
100 120
180 200
Bagamoyo Ilala Iringa Kilosa Moshi Mwanza
% 1999/2000 2000/01 2001/02
160 140
8
In Table 5 local revenues in percentage of total council revenues are presented. The local revenue trend for the three-year period 1999/00-2001/02 is not encouraging for several of the case councils. Only Ilala MC experienced an increase in the share of local revenue in total revenue during the three year period, from 58.2% in 2000 to 63.8% in 2002. In Bagamoyo, Iringa, and Mwanza there is a clear downward trend in local revenue as a percentage of total revenue, while Kilosa and Moshi have ‘stabilised’ at around 13% and 10%, respectively. These figures reflect the fact that the annual increase in grants from the central government (Table 3) has been larger for most councils than the corresponding annual change in their own revenues (Table 1).
Table 5: Own revenue as a % of total revenue
Council 2000 2001 2002 Bagamoyo DC 21.3 17.2 15.4 Ilala MC 58.2 62.2 63.8 Iringa DC 22.9 17.7 16.9 Kilosa DC 18.8 10.8 13.1 Moshi DC 9.1 11.0 9.8 Mwanza CC 56.7 48,.8 47.9
Source: Compiled by the authors based on the councils’ ‘Abstracts of Final Accounts’ and ‘Appendices to Volume III, Estimates of Public Expenditure Supply Vote (Regional)’.
Table 6: Annual changes (%) in total revenue (grants and own revenue)
Council 2000-2001 2001-2002 Bagamoyo DC 48.4 17.0 Ilala MC 84.2 13.0 Iringa DC 43.8 2.1 Kilosa DC 123.6 8.1 Moshi DC 53.0 4.3 Mwanza CC 25.7 4.0
Sources: Compiled by the authors based on the councils’ ‘Abstracts of Final Accounts’ and ‘Appendices to Volume III, Estimates of Public Expenditure Supply Vote (Regional)’. Table 6 shows the annual percentage changes in total revenue for the case councils. While the councils experienced a quite dramatic annual increase in revenues from 2000 to 2001, mainly due to increased grants from the centre, the annual increase in the following years was quite modest, except for Bagamoyo DC (17%) and Ilala MC (13%). To summarise, fiscal autonomy in district councils is limited with respect to both revenue and expenditure. Of total revenue received by rural councils, 80-90% comprises conditional grants. Moshi DC generated only 9% of its total revenue from its own sources in 2002. The corresponding figure for Kilosa was 10%, of which the development levy was the most important source till June 2003. However, the rationalisation of many local revenue sources in June 2003 has reduced the already limited fiscal autonomy even further. The picture is different in the two urban councils, which generate a substantial portion of their revenues from their own sources, i.e. 64% in Ilala MC and about 48% in Mwanza. The urban-rural divide with respect to
9
local revenue generation reflects the much wider revenue bases available in densely populated urban settings (such as business licences, a city service levy and property taxes). It also reflects the fact that poverty in Tanzania is most widespread in rural areas. Hence, the revenue potential is much more limited in rural settings.
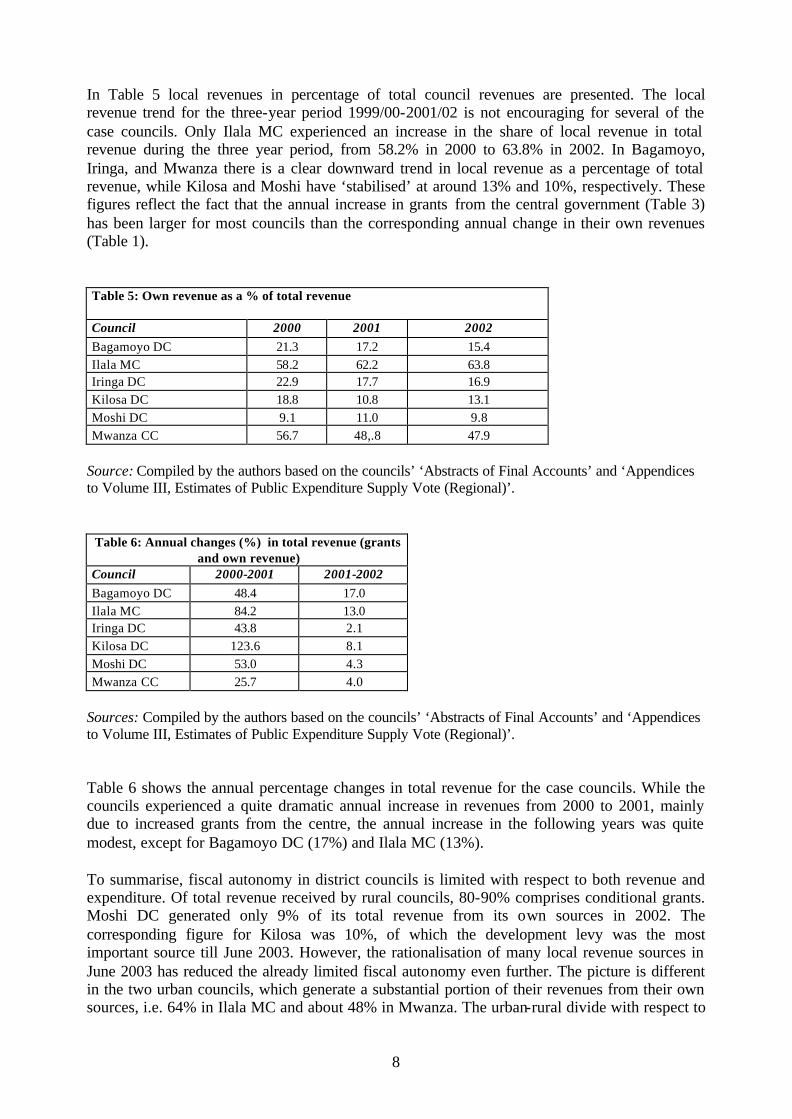
2.2 Expenditure In general, we observe a substantial annual increase in total expenditure in the case councils during the period 2000-2002 (see Table 7). However, in 2000-2001, Moshi DC experienced a significant decline in its expenditure level (-18.2%), and the same applies to Bagamoyo DC, which saw a decline of 22.8% in total expenditure from 2001 to 2002. But from 2001 to 2002, Moshi DC saw an increase in its level of expenditure of more than 95%. For Iringa DC and Kilosa DC, expenditure levels increased from 2001 to 2002 by 78% and 59%, respectively. Table 7: Annual changes in total expenditure as reported by the six case councils (in %) Councils 2000-2001 2001-2002 Bagamoyo DC 25.2 -22.8 Ilala MC 44.6 24.2 Iringa DC 13.6 78.0 Kilosa DC 21.7 59.3 Moshi DC -18.2 95.5
Mwanza CC 21.6 2.6 Source: Compiled by the authors based on the councils’ ‘Abstracts of Final Accounts’. A similar picture is presented in Figure 4, which shows total expenditure in the six case councils as reported in the council accounts (in TSh).
Source: Compiled by the authors based on the councils’ ‘Abstracts of Final Accounts’.
Figure 4: Total expenditure as reported by the case councils (2000-2002)
0
2 000 000 000
4 000 000 000
6 000 000 000
8 000 000 000
10 000 000 000
12 000 000 000
Bagamoyo Ilala Iringa Kilosa Moshi Mwanza
In TSh
FY 2000 FY 2001 FY 2002
10
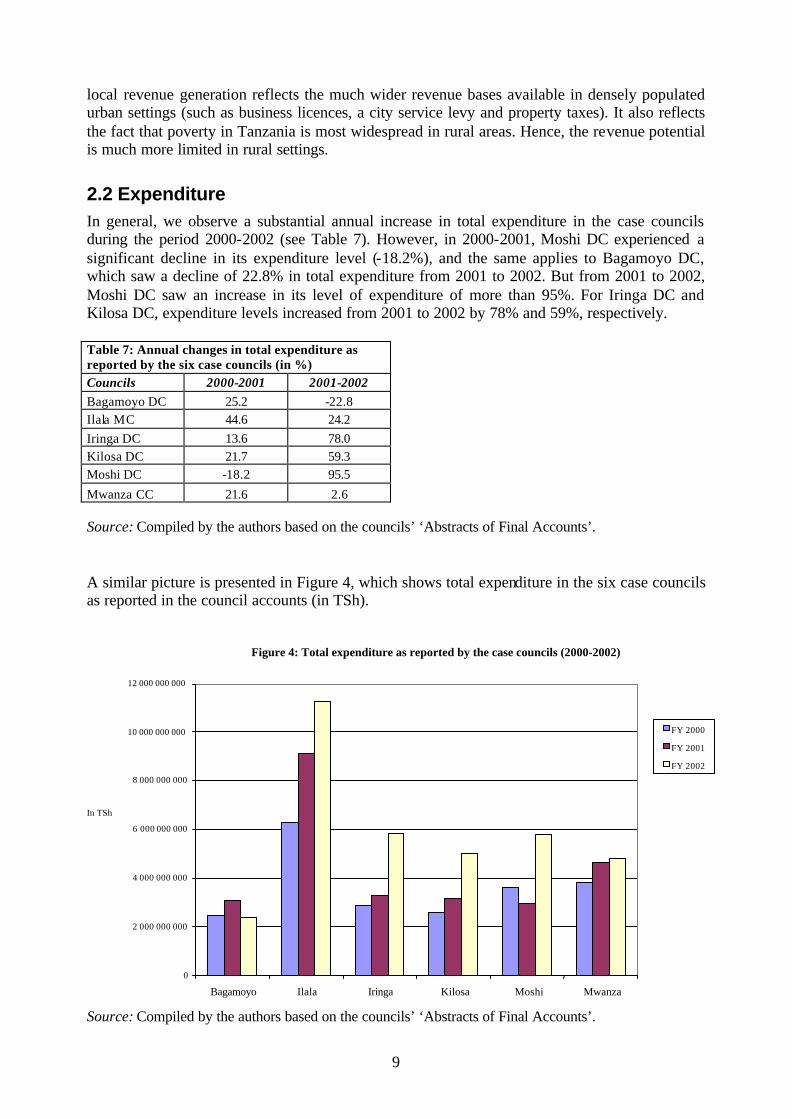
The allocation of expenditure between priority sectors shows substantial differences between the case councils. In particular, this is the case for allocations to the education sector (Table 8), while we observe less difference between the allocations to the health sector (Table 9).
2.2.1 Allocations to the education sector Table 8 shows the allocation to the education sector as a share of total council expenditure. Relatively high differences in the allocations can be observed between the case councils. For instance, while the allocation to the education sector in Kilosa represented about 22% of total expenditure in 2002, the corresponding figure for Moshi is 66%. In Iringa DC about 60% of the total expenditure was allocated to education. The low figure for Kilosa might, however, be connected with a relatively high allocation to education in 2001 (i.e., more than 60% of total expenditure). For the remaining councils (Bagamoyo, Ilala and Mwanza), the education sector receives around 35% of the total expenditure. With the exception of Kilosa DC, the case councils’ annual allocation to education remained relatively stable during the period 2000-2002 (i.e. as a share of total expenditure).
Table 8: Primary education expenditure as a % of total expenditure Council FY 2000 FY 2001 FY 2002 Bagamoyo DC n.a. 32.4 38.4 Ilala MC 34.7 30.6 32.5 Iringa DC 59.5 46.5 59.7 Kilosa DC 55.5 61.4 22.3 Moshi DC 71.0 70.2 66.0 Mwanza CC 39.3 35.7 35.3
Source: Compiled by the authors based on the councils’ ‘Abstracts of Final Accounts’.
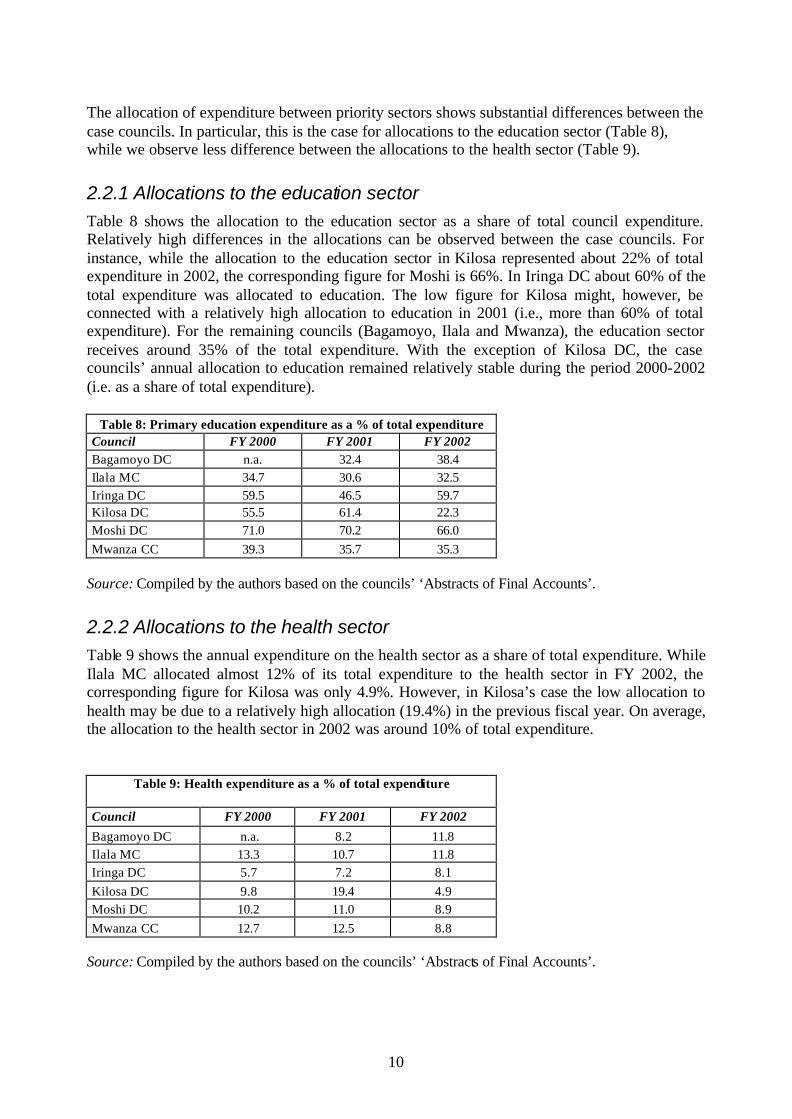
2.2.2 Allocations to the health sector Table 9 shows the annual expenditure on the health sector as a share of total expenditure. While Ilala MC allocated almost 12% of its total expenditure to the health sector in FY 2002, the corresponding figure for Kilosa was only 4.9%. However, in Kilosa’s case the low allocation to health may be due to a relatively high allocation (19.4%) in the previous fiscal year. On average, the allocation to the health sector in 2002 was around 10% of total expenditure.
Table 9: Health expenditure as a % of total expenditure Council FY 2000 FY 2001 FY 2002
Bagamoyo DC n.a. 8.2 11.8 Ilala MC 13.3 10.7 11.8 Iringa DC 5.7 7.2 8.1 Kilosa DC 9.8 19.4 4.9 Moshi DC 10.2 11.0 8.9 Mwanza CC 12.7 12.5 8.8
Source: Compiled by the authors based on the councils’ ‘Abstracts of Final Accounts’.
11
3 Methods of revenue collection
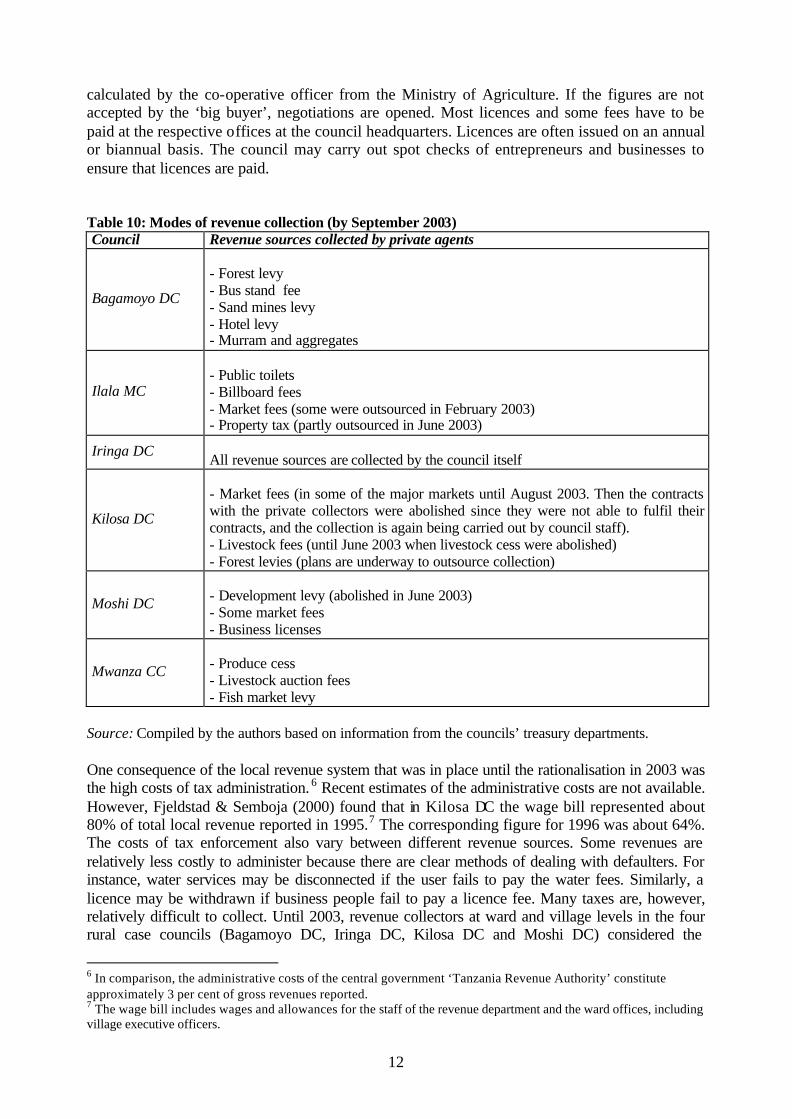
Local government tax collection is the responsibility of the council, and is completely separated from central government. In district councils it is organised around three levels, namely the council headquarters, the wards and the villages. In urban councils collection is organised by the two upper levels. At the council headquarters the responsibility for tax collection rests with the council treasury, headed by the Treasurer. At the ward levels, the responsibility rests with the office of the Ward Executive Officer (WEO). The WEO also handles developmental issues and law-and-order functions at that level. For this purpose the local militia is at their disposal. In wards with greater revenue potential there will also be a ward revenue collector (WRC) to support the WEO. At the village level, the responsibility rests with the office of the village executive officer (VEO). The VEO is also responsible for supervising village developmental activities and maintaining law and order. In addition, the VEOs often function as secretaries of the Village Council. In practice, the organisation of tax collection varies between councils. For instance, in some councils the village level has been excluded from collection, which has been taken over by the ward level. This is partly due to incentive problems connected with tax collection at the village level, arising from the VEOs operating within their areas of domicile. Lack of an arm’s- length relationship between tax collectors and taxpayers introduces ‘economics of affection’ into village tax collection. In many villages, before the abolition of the development levy in June 2003 local politicians often resisted mobilising people to pay taxes, due to the unpopularity of taxation. Most case councils have introduced new methods of increasing revenue from existing sources by outsourcing some of the revenue collection to private collectors (see Table 10). Only in Iringa DC are all local revenues collected by the council staff. Most taxes are paid in cash. One exception, before June 2003, was that civil servants had their head tax (‘development levy’) withheld from their salaries.5 For others, the development levy was paid during office hours at any of the revenue collecting centres mentioned above. The statutory voluntary period was from 1 January to 30 September. All tax payments made after the deadline were subject to a penalty equivalent to 50 percent of the tax rate. From 1 October to 31 December development levy payment ‘campaigns’ were conducted, organised by the ward office and using state organs, i.e. the local militia and judiciary, to ensure compliance. Until the use of force in tax collection was banned by the central government in 2002, tax defaulters were visited in their homes and people were often required to show tax receipts at roadblocks. Manned barriers were also used to control buyers of certain crops, such as cashew nuts, in the Coastal Region. The buyer had to produce receipts before they were allowed to transport the purchase outside the district. Similar checkpoints were used to control people for the ‘development levy’ and bicycle tax. Roadblocks were sometimes also used to collect market fees, implying that the fees had to be paid before the goods entered the market place. Market fees and crop cesses are, in general, collected at the selling points and markets. However, ‘big buyers’ of ‘cessable’ goods (often co-operatives) are expected to pay directly to the council treasury. The buyer then pays the council in advance, based on an estimate
5 See Fjeldstad & Semboja (2000) and Fjeldstad (2003) for further details on local government taxation and tax administration during the period 1995-2002.
12
calculated by the co-operative officer from the Ministry of Agriculture. If the figures are not accepted by the ‘big buyer’, negotiations are opened. Most licences and some fees have to be paid at the respective offices at the council headquarters. Licences are often issued on an annual or biannual basis. The council may carry out spot checks of entrepreneurs and businesses to ensure that licences are paid. Table 10: Modes of revenue collection (by September 2003) Council Revenue sources collected by private agents
Bagamoyo DC
- Forest levy - Bus stand fee - Sand mines levy - Hotel levy - Murram and aggregates
Ilala MC
- Public toilets - Billboard fees - Market fees (some were outsourced in February 2003) - Property tax (partly outsourced in June 2003)
Iringa DC All revenue sources are collected by the council itself
Kilosa DC
- Market fees (in some of the major markets until August 2003. Then the contracts with the private collectors were abolished since they were not able to fulfil their contracts, and the collection is again being carried out by council staff). - Livestock fees (until June 2003 when livestock cess were abolished) - Forest levies (plans are underway to outsource collection)
Moshi DC
- Development levy (abolished in June 2003) - Some market fees - Business licenses
Mwanza CC
- Produce cess - Livestock auction fees - Fish market levy
Source: Compiled by the authors based on information from the councils’ treasury departments. One consequence of the local revenue system that was in place until the rationalisation in 2003 was the high costs of tax administration. 6 Recent estimates of the administrative costs are not available. However, Fjeldstad & Semboja (2000) found that in Kilosa DC the wage bill represented about 80% of total local revenue reported in 1995.7 The corresponding figure for 1996 was about 64%. The costs of tax enforcement also vary between different revenue sources. Some revenues are relatively less costly to administer because there are clear methods of dealing with defaulters. For instance, water services may be disconnected if the user fails to pay the water fees. Similarly, a licence may be withdrawn if business people fail to pay a licence fee. Many taxes are, however, relatively difficult to collect. Until 2003, revenue collectors at ward and village levels in the four rural case councils (Bagamoyo DC, Iringa DC, Kilosa DC and Moshi DC) considered the
6 In comparison, the administrative costs of the central government ‘Tanzania Revenue Authority’ constitute approximately 3 per cent of gross revenues reported. 7 The wage bill includes wages and allowances for the staff of the revenue department and the ward offices, including village executive officers.
13
development levy to be the most problematic tax to collect, followed by crop cess and livestock cess. Tax officials at the district headquarters also ranked the development levy as the most problematic, followed by property and land taxes.8 The many sub-bases, with different rate structures, add to the administrative cost, although the tax rationalisation carried out in 2003 has most likely reduced these costs. However, these administrative costs are largely unrecognised by local authorities. Qualitative data from the six case councils indicate that there is little appreciation of the opportunity costs of the staff already employed by the council. One might even argue that for certain small taxes and charges the collection costs seem to be the reason for the levy. In other words, the purpose is to create employment, or at least an income-earning opportunity, for someone who might otherwise be unemployed. Furthermore, the way in which budgets are compiled, whereby tax revenues appear under one heading and the costs of the local revenue office under another, does not encourage cost-effectiveness. In addition, many costs are simply not made explicit, for instance the use of government-owned buildings, or the use of co-operative officers to collect certain taxes. One major administrative problem for the case councils today is their inability to collect fully the revenue due to them (Fjeldstad, 2003). In most councils there are huge gaps between reported and projected revenues. Recent studies conclude that this is due to: (1) poor administrative capacity to assess the revenue base; (2) poor administrative capacity to enforce the taxes; (3) explicit and intentional tax evasion and resistance from taxpayers; (4) corruption, including embezzlement of revenue; (5) external pressure on the local finance department to provide optimistic projections; and (6) political pressure on the local tax administration to ‘go easy’ on revenue collection.
4 Financial management Sound financial management systems are powerful instruments for preventing, discovering or facilitating the punishment of fraud and corruption. Important elements are the organisation and staffing of local revenue administration, the effectiveness of auditing systems and the realism of budgets (Langlois et al. 1998). Hence, budget reform has become an important element of public sector reform, which in turn incorporates elements of skills building and institutional strengthening.
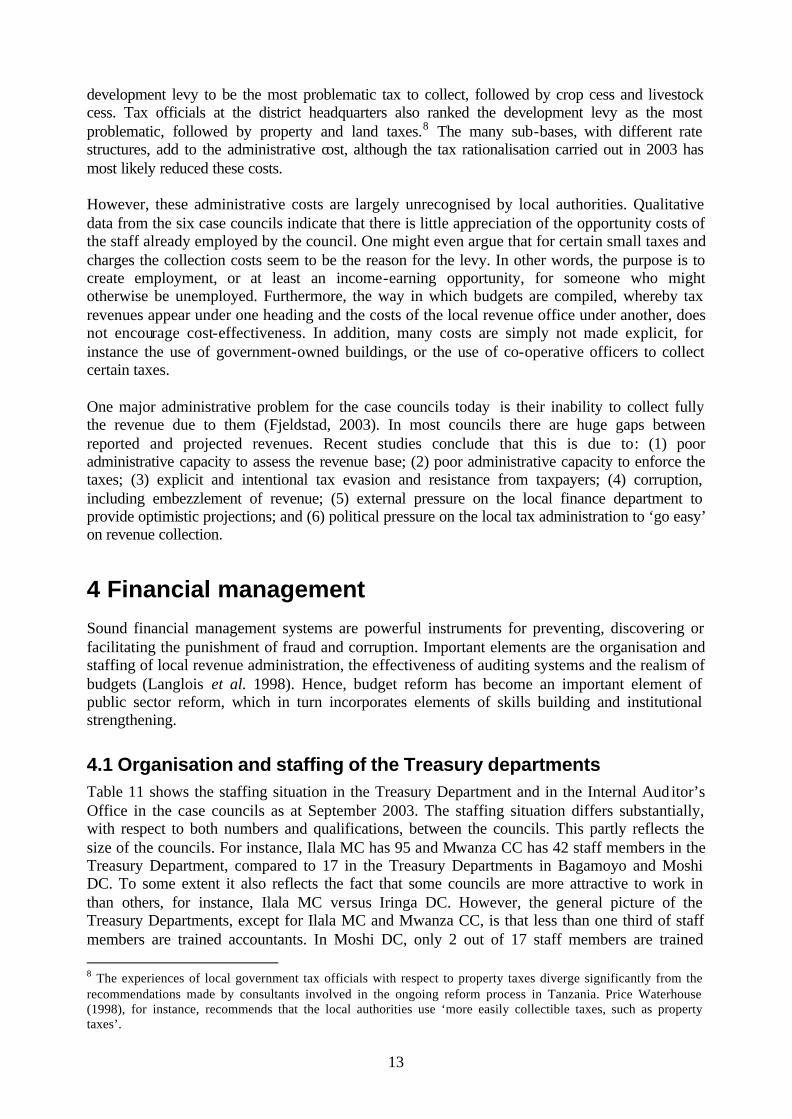
4.1 Organisation and staffing of the Treasury departments Table 11 shows the staffing situation in the Treasury Department and in the Internal Aud itor’s Office in the case councils as at September 2003. The staffing situation differs substantially, with respect to both numbers and qualifications, between the councils. This partly reflects the size of the councils. For instance, Ilala MC has 95 and Mwanza CC has 42 staff members in the Treasury Department, compared to 17 in the Treasury Departments in Bagamoyo and Moshi DC. To some extent it also reflects the fact that some councils are more attractive to work in than others, for instance, Ilala MC versus Iringa DC. However, the general picture of the Treasury Departments, except for Ilala MC and Mwanza CC, is that less than one third of staff members are trained accountants. In Moshi DC, only 2 out of 17 staff members are trained 8 The experiences of local government tax officials with respect to property taxes diverge significantly from the recommendations made by consultants involved in the ongoing reform process in Tanzania. Price Waterhouse (1998), for instance, recommends that the local authorities use ‘more easily collectible taxes, such as property taxes’.
14
accountants. The remaining majority of staff has either no formal training in accounting or only certificates. Table 11: Staffing of the Treasury Department and the Internal Auditor’s office(September 2003)
Council Treasury Department Internal Auditor’s Office Total
staff No. of trained accountants
Training/ workshop/ courses
Total staff
No. of trained auditors
Training/ workshop/ courses
Bagamoyo DC 17 5 - 0 0 - Ilala MC 95 35 - 4 4 1 Iringa DC 15 3 - 1 1 - Kilosa DC 23 7 6 1 1 1 Moshi DC 17 2 - 1 1 1 Mwanza CC 42 14 - 1 1 -
Source: Compiled by the authors based on information from the councils’ management teams.
4.2 Organisation and staffing of the Internal Auditor’s office The Internal Auditor’s Offices in the case councils are either weakly staffed or not staffed at all (see Table 11 above). Bagamoyo, for instance, has no internal auditor in place, and in Iringa DC this position was vacant until mid-2003. Hence, until recently internal auditing in Iringa DC was carried out by the Treasury staff themselves, which has undermined the credibility of the auditing process. A general problem experienced in the case councils is that many Internal Auditors, after having acquired some experience in the local authorities, leave for the private sector, where they are offered substantially higher salaries. Vacancies in both urban and rural councils are often difficult to fill. Lack of response by the Treasury Department (or other departments) to internal audit queries and recommendations also contribute to discouraging auditors from staying in council positions.
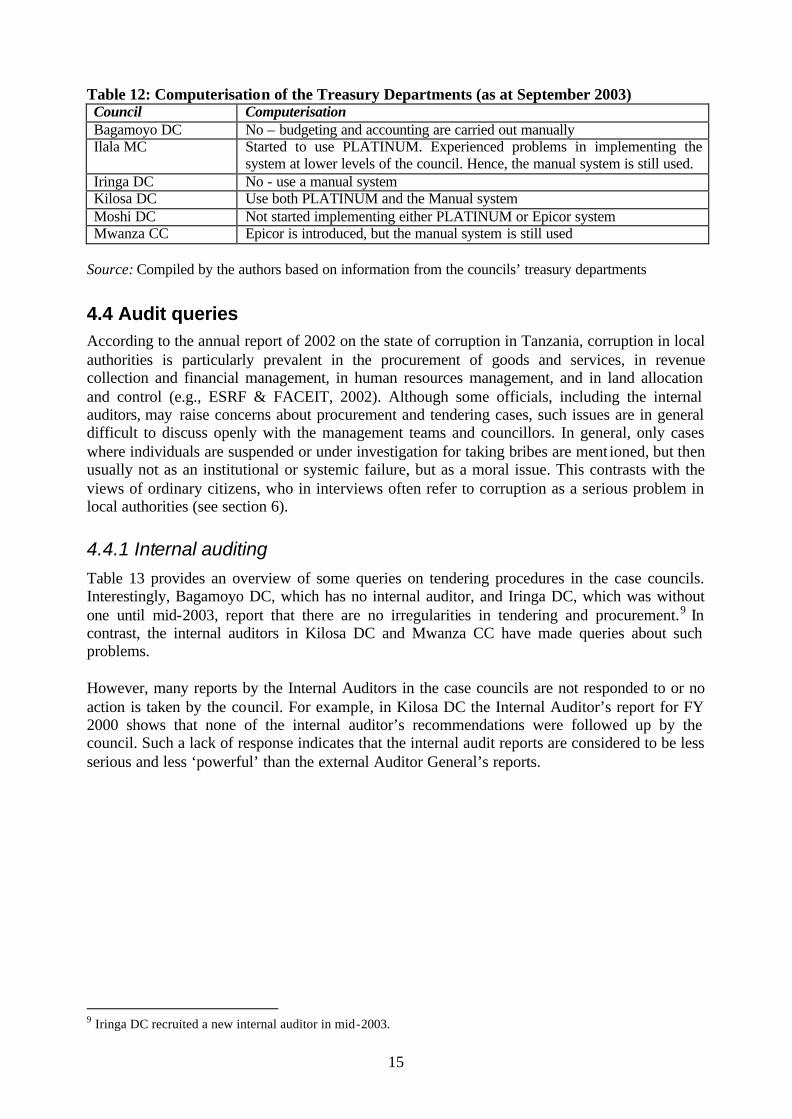
4.3 Computerisation of the Treasury departments Budgeting and accounting are still carried out manually in all the six case councils (as at September 2003). Only Kilosa applies PLATINUM, in practice, in combination with a manual system (see Table 12). Ilala MC has started to implement PLATINUM and Epicor is in place in Mwanza CC. In contrast, Bagamoyo, Iringa and Moshi have not yet started to computerise financial management and planning.
15
Table 12: Computerisation of the Treasury Departments (as at September 2003) Council Computerisation Bagamoyo DC No – budgeting and accounting are carried out manually Ilala MC Started to use PLATINUM. Experienced problems in implementing the
system at lower levels of the council. Hence, the manual system is still used. Iringa DC No - use a manual system Kilosa DC Use both PLATINUM and the Manual system Moshi DC Not started implementing either PLATINUM or Epicor system Mwanza CC Epicor is introduced, but the manual system is still used
Source: Compiled by the authors based on information from the councils’ treasury departments
4.4 Audit queries According to the annual report of 2002 on the state of corruption in Tanzania, corruption in local authorities is particularly prevalent in the procurement of goods and services, in revenue collection and financial management, in human resources management, and in land allocation and control (e.g., ESRF & FACEIT, 2002). Although some officials, including the internal auditors, may raise concerns about procurement and tendering cases, such issues are in general difficult to discuss openly with the management teams and councillors. In general, only cases where individuals are suspended or under investigation for taking bribes are ment ioned, but then usually not as an institutional or systemic failure, but as a moral issue. This contrasts with the views of ordinary citizens, who in interviews often refer to corruption as a serious problem in local authorities (see section 6).
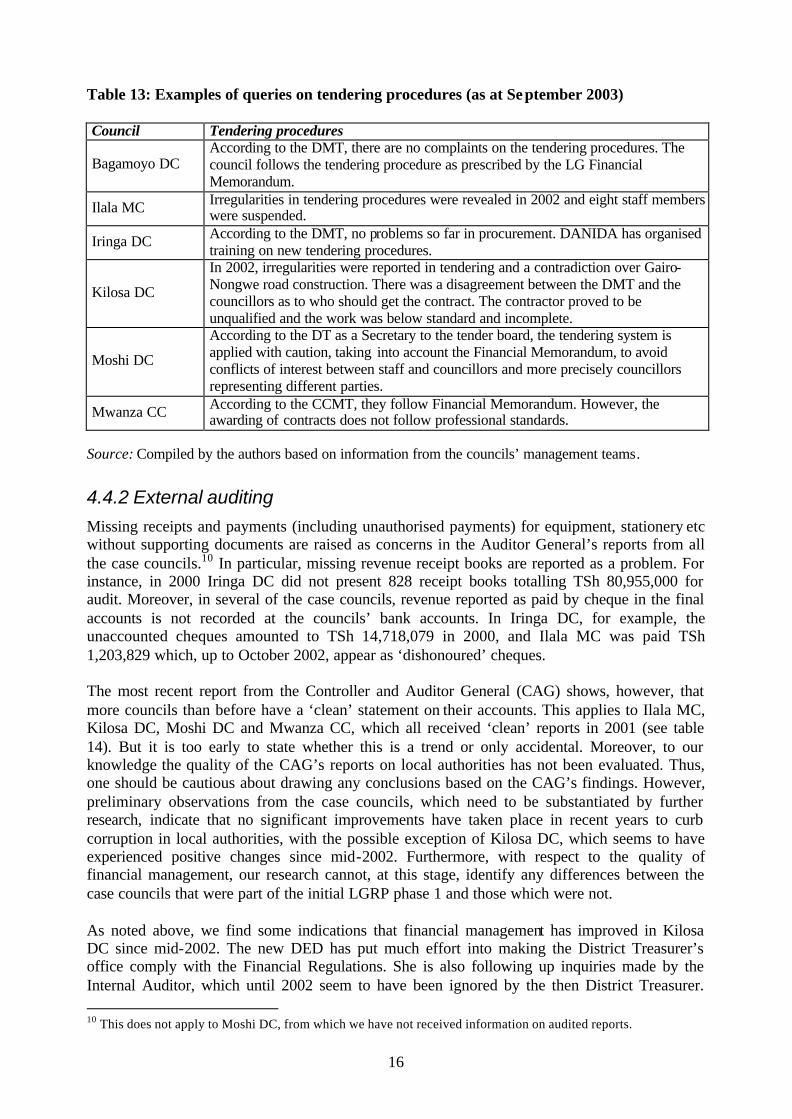
4.4.1 Internal auditing Table 13 provides an overview of some queries on tendering procedures in the case councils. Interestingly, Bagamoyo DC, which has no internal auditor, and Iringa DC, which was without one until mid-2003, report that there are no irregularities in tendering and procurement.9 In contrast, the internal auditors in Kilosa DC and Mwanza CC have made queries about such problems. However, many reports by the Internal Auditors in the case councils are not responded to or no action is taken by the council. For example, in Kilosa DC the Internal Auditor’s report for FY 2000 shows that none of the internal auditor’s recommendations were followed up by the council. Such a lack of response indicates that the internal audit reports are considered to be less serious and less ‘powerful’ than the external Auditor General’s reports.
9 Iringa DC recruited a new internal auditor in mid-2003.
16
Table 13: Examples of queries on tendering procedures (as at September 2003) Council Tendering procedures
Bagamoyo DC According to the DMT, there are no complaints on the tendering procedures. The council follows the tendering procedure as prescribed by the LG Financial Memorandum.
Ilala MC Irregularities in tendering procedures were revealed in 2002 and eight staff members were suspended.
Iringa DC According to the DMT, no problems so far in procurement. DANIDA has organised training on new tendering procedures.
Kilosa DC
In 2002, irregularities were reported in tendering and a contradiction over Gairo-Nongwe road construction. There was a disagreement between the DMT and the councillors as to who should get the contract. The contractor proved to be unqualified and the work was below standard and incomplete.
Moshi DC
According to the DT as a Secretary to the tender board, the tendering system is applied with caution, taking into account the Financial Memorandum, to avoid conflicts of interest between staff and councillors and more precisely councillors representing different parties.
Mwanza CC According to the CCMT, they follow Financial Memorandum. However, the awarding of contracts does not follow professional standards.
Source: Compiled by the authors based on information from the councils’ management teams.
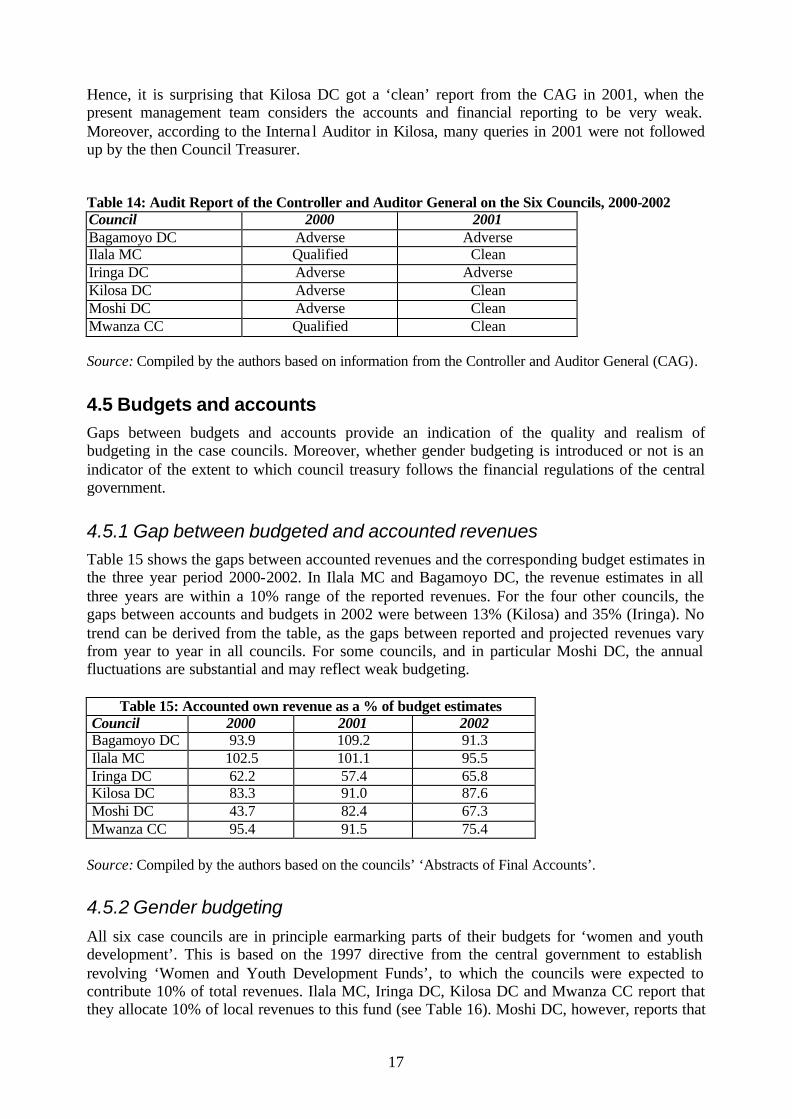
4.4.2 External auditing Missing receipts and payments (including unauthorised payments) for equipment, stationery etc without supporting documents are raised as concerns in the Auditor General’s reports from all the case councils.10 In particular, missing revenue receipt books are reported as a problem. For instance, in 2000 Iringa DC did not present 828 receipt books totalling TSh 80,955,000 for audit. Moreover, in several of the case councils, revenue reported as paid by cheque in the final accounts is not recorded at the councils’ bank accounts. In Iringa DC, for example, the unaccounted cheques amounted to TSh 14,718,079 in 2000, and Ilala MC was paid TSh 1,203,829 which, up to October 2002, appear as ‘dishonoured’ cheques. The most recent report from the Controller and Auditor General (CAG) shows, however, that more councils than before have a ‘clean’ statement on their accounts. This applies to Ilala MC, Kilosa DC, Moshi DC and Mwanza CC, which all received ‘clean’ reports in 2001 (see table 14). But it is too early to state whether this is a trend or only accidental. Moreover, to our knowledge the quality of the CAG’s reports on local authorities has not been evaluated. Thus, one should be cautious about drawing any conclusions based on the CAG’s findings. However, preliminary observations from the case councils, which need to be substantiated by further research, indicate that no significant improvements have taken place in recent years to curb corruption in local authorities, with the possible exception of Kilosa DC, which seems to have experienced positive changes since mid-2002. Furthermore, with respect to the quality of financial management, our research cannot, at this stage, identify any differences between the case councils that were part of the initial LGRP phase 1 and those which were not. As noted above, we find some indications that financial management has improved in Kilosa DC since mid-2002. The new DED has put much effort into making the District Treasurer’s office comply with the Financial Regulations. She is also following up inquiries made by the Internal Auditor, which until 2002 seem to have been ignored by the then District Treasurer. 10 This does not apply to Moshi DC, from which we have not received information on audited reports.
17
Hence, it is surprising that Kilosa DC got a ‘clean’ report from the CAG in 2001, when the present management team considers the accounts and financial reporting to be very weak. Moreover, according to the Interna l Auditor in Kilosa, many queries in 2001 were not followed up by the then Council Treasurer.
Table 14: Audit Report of the Controller and Auditor General on the Six Councils, 2000-2002 Council 2000 2001 Bagamoyo DC Adverse Adverse Ilala MC Qualified Clean Iringa DC Adverse Adverse Kilosa DC Adverse Clean Moshi DC Adverse Clean Mwanza CC Qualified Clean Source: Compiled by the authors based on information from the Controller and Auditor General (CAG).
4.5 Budgets and accounts Gaps between budgets and accounts provide an indication of the quality and realism of budgeting in the case councils. Moreover, whether gender budgeting is introduced or not is an indicator of the extent to which council treasury follows the financial regulations of the central government.
4.5.1 Gap between budgeted and accounted revenues Table 15 shows the gaps between accounted revenues and the corresponding budget estimates in the three year period 2000-2002. In Ilala MC and Bagamoyo DC, the revenue estimates in all three years are within a 10% range of the reported revenues. For the four other councils, the gaps between accounts and budgets in 2002 were between 13% (Kilosa) and 35% (Iringa). No trend can be derived from the table, as the gaps between reported and projected revenues vary from year to year in all councils. For some councils, and in particular Moshi DC, the annual fluctuations are substantial and may reflect weak budgeting.
Table 15: Accounted own revenue as a % of budget estimates Council 2000 2001 2002 Bagamoyo DC 93.9 109.2 91.3 Ilala MC 102.5 101.1 95.5 Iringa DC 62.2 57.4 65.8 Kilosa DC 83.3 91.0 87.6 Moshi DC 43.7 82.4 67.3 Mwanza CC 95.4 91.5 75.4
Source: Compiled by the authors based on the councils’ ‘Abstracts of Final Accounts’.
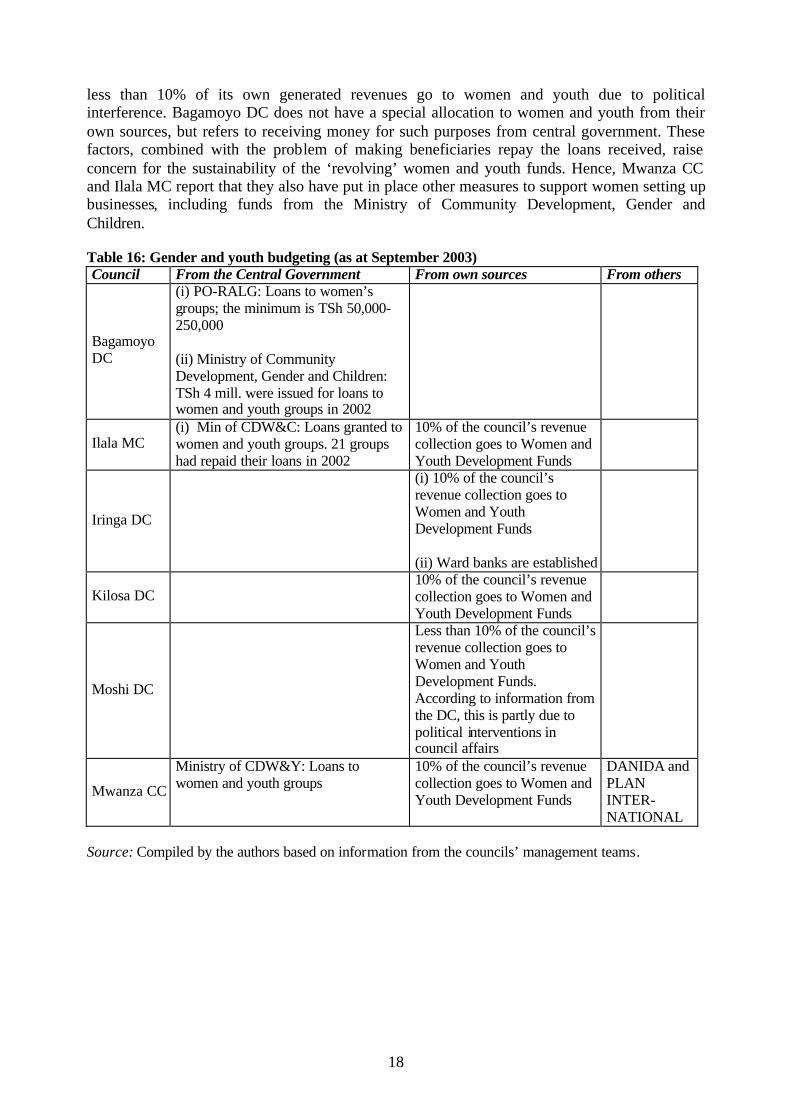
4.5.2 Gender budgeting All six case councils are in principle earmarking parts of their budgets for ‘women and youth development’. This is based on the 1997 directive from the central government to establish revolving ‘Women and Youth Development Funds’, to which the councils were expected to contribute 10% of total revenues. Ilala MC, Iringa DC, Kilosa DC and Mwanza CC report that they allocate 10% of local revenues to this fund (see Table 16). Moshi DC, however, reports that
18
less than 10% of its own generated revenues go to women and youth due to political interference. Bagamoyo DC does not have a special allocation to women and youth from their own sources, but refers to receiving money for such purposes from central government. These factors, combined with the problem of making beneficiaries repay the loans received, raise concern for the sustainability of the ‘revolving’ women and youth funds. Hence, Mwanza CC and Ilala MC report that they also have put in place other measures to support women setting up businesses, including funds from the Ministry of Community Development, Gender and Children. Table 16: Gender and youth budgeting (as at September 2003) Council From the Central Government From own sources From others
Bagamoyo DC
(i) PO-RALG: Loans to women’s groups; the minimum is TSh 50,000-250,000 (ii) Ministry of Community Development, Gender and Children: TSh 4 mill. were issued for loans to women and youth groups in 2002
Ilala MC (i) Min of CDW&C: Loans granted to women and youth groups. 21 groups had repaid their loans in 2002
10% of the council’s revenue collection goes to Women and Youth Development Funds
Iringa DC
(i) 10% of the council’s revenue collection goes to Women and Youth Development Funds (ii) Ward banks are established
Kilosa DC 10% of the council’s revenue
collection goes to Women and Youth Development Funds
Moshi DC
Less than 10% of the council’s revenue collection goes to Women and Youth Development Funds. According to information from the DC, this is partly due to political interventions in council affairs
Mwanza CC
Ministry of CDW&Y: Loans to women and youth groups
10% of the council’s revenue collection goes to Women and Youth Development Funds
DANIDA and PLAN INTER-NATIONAL
Source: Compiled by the authors based on information from the councils’ management teams.
19
5 Transparency in financial and fiscal affairs
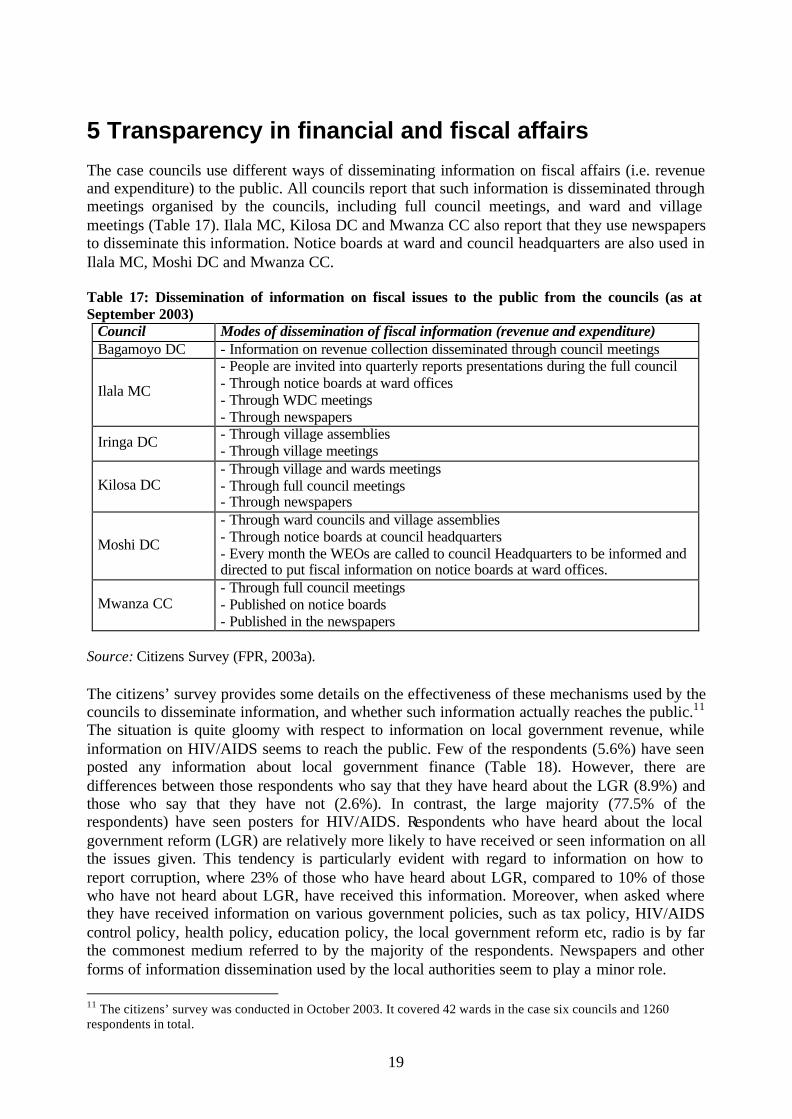
The case councils use different ways of disseminating information on fiscal affairs (i.e. revenue and expenditure) to the public. All councils report that such information is disseminated through meetings organised by the councils, including full council meetings, and ward and village meetings (Table 17). Ilala MC, Kilosa DC and Mwanza CC also report that they use newspapers to disseminate this information. Notice boards at ward and council headquarters are also used in Ilala MC, Moshi DC and Mwanza CC. Table 17: Dissemination of information on fiscal issues to the public from the councils (as at September 2003)
Council Modes of dissemination of fiscal information (revenue and expenditure) Bagamoyo DC - Information on revenue collection disseminated through council meetings
Ilala MC
- People are invited into quarterly reports presentations during the full council - Through notice boards at ward offices - Through WDC meetings - Through newspapers
Iringa DC - Through village assemblies - Through village meetings
Kilosa DC - Through village and wards meetings - Through full council meetings - Through newspapers
Moshi DC
- Through ward councils and village assemblies - Through notice boards at council headquarters - Every month the WEOs are called to council Headquarters to be informed and directed to put fiscal information on notice boards at ward offices.
Mwanza CC - Through full council meetings - Published on notice boards - Published in the newspapers
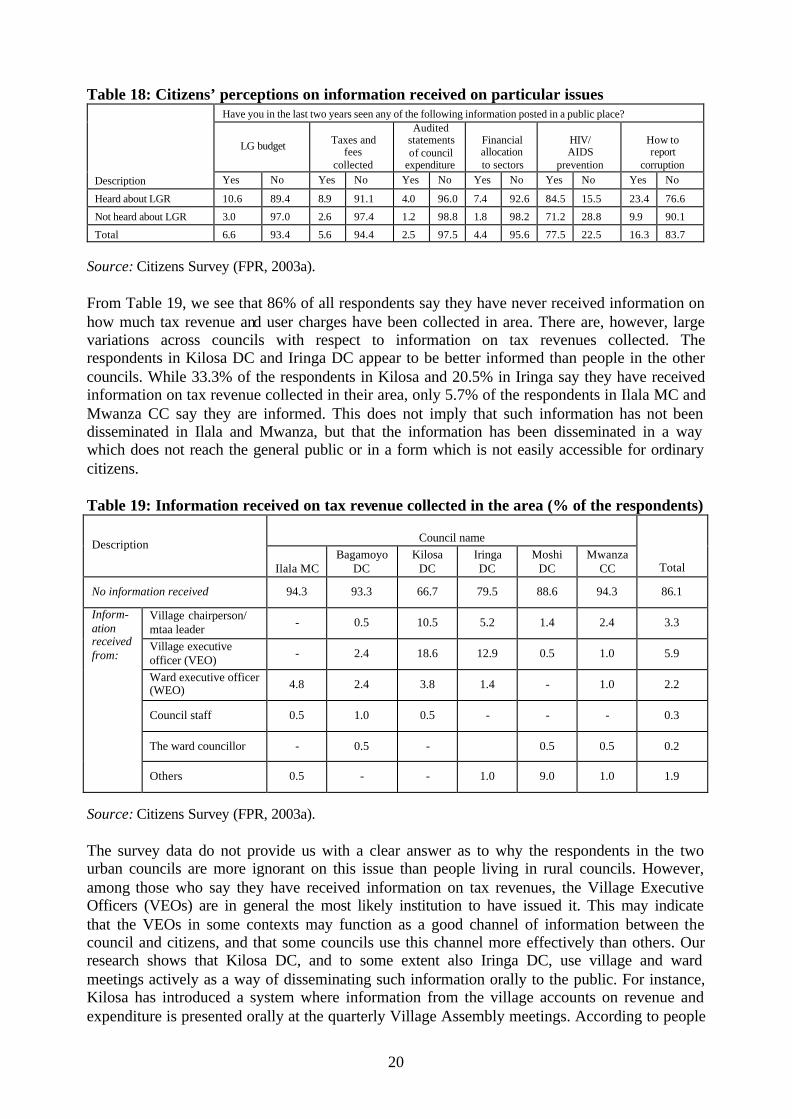
Source: Citizens Survey (FPR, 2003a). The citizens’ survey provides some details on the effectiveness of these mechanisms used by the councils to disseminate information, and whether such information actually reaches the public.11 The situation is quite gloomy with respect to information on local government revenue, while information on HIV/AIDS seems to reach the public. Few of the respondents (5.6%) have seen posted any information about local government finance (Table 18). However, there are differences between those respondents who say that they have heard about the LGR (8.9%) and those who say that they have not (2.6%). In contrast, the large majority (77.5% of the respondents) have seen posters for HIV/AIDS. Respondents who have heard about the local government reform (LGR) are relatively more likely to have received or seen information on all the issues given. This tendency is particularly evident with regard to information on how to report corruption, where 23% of those who have heard about LGR, compared to 10% of those who have not heard about LGR, have received this information. Moreover, when asked where they have received information on various government policies, such as tax policy, HIV/AIDS control policy, health policy, education policy, the local government reform etc, radio is by far the commonest medium referred to by the majority of the respondents. Newspapers and other forms of information dissemination used by the local authorities seem to play a minor role. 11 The citizens’ survey was conducted in October 2003. It covered 42 wards in the case six councils and 1260 respondents in total.
20
Table 18: Citizens’ perceptions on information received on particular issues Have you in the last two years seen any of the following information posted in a public place?
LG budget Taxes and fees
collected
Audited statements of council
expenditure
Financial allocation to sectors
HIV/ AIDS
prevention
How to report
corruption Description Yes No Yes No Yes No Yes No Yes No Yes No
Heard about LGR 10.6 89.4 8.9 91.1 4.0 96.0 7.4 92.6 84.5 15.5 23.4 76.6
Not heard about LGR 3.0 97.0 2.6 97.4 1.2 98.8 1.8 98.2 71.2 28.8 9.9 90.1
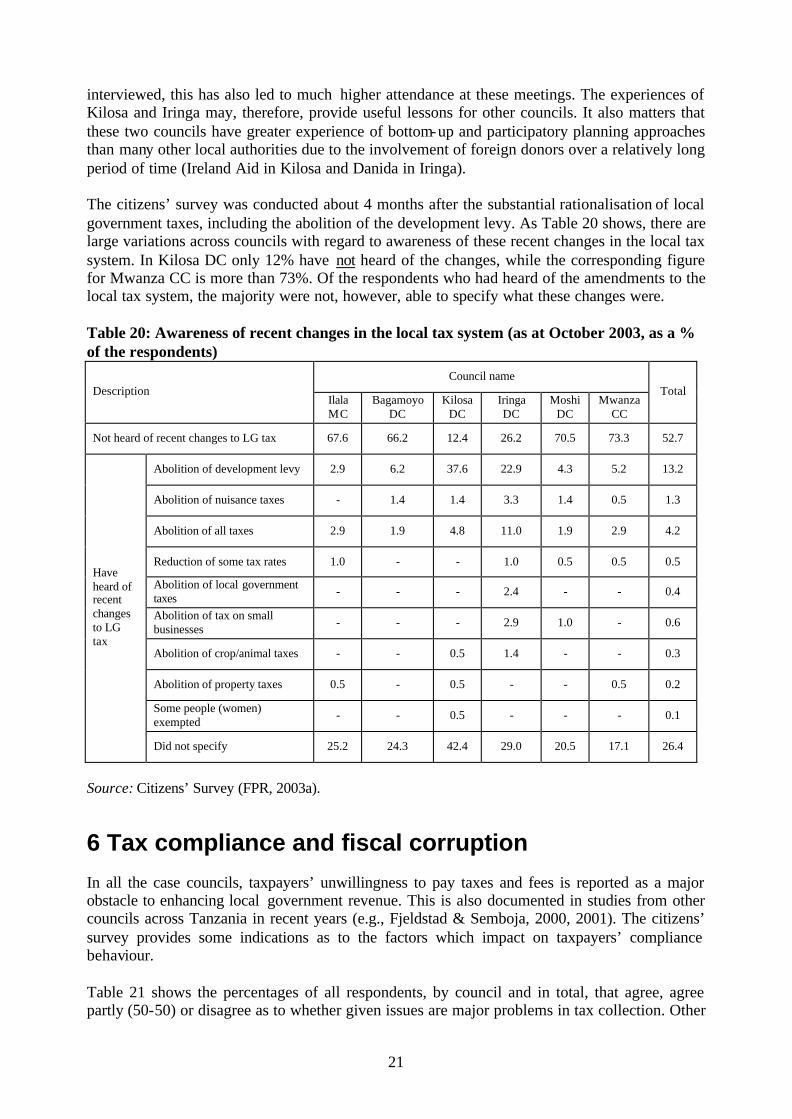
Total 6.6 93.4 5.6 94.4 2.5 97.5 4.4 95.6 77.5 22.5 16.3 83.7 Source: Citizens Survey (FPR, 2003a). From Table 19, we see that 86% of all respondents say they have never received information on how much tax revenue and user charges have been collected in area. There are, however, large variations across councils with respect to information on tax revenues collected. The respondents in Kilosa DC and Iringa DC appear to be better informed than people in the other councils. While 33.3% of the respondents in Kilosa and 20.5% in Iringa say they have received information on tax revenue collected in their area, only 5.7% of the respondents in Ilala MC and Mwanza CC say they are informed. This does not imply that such information has not been disseminated in Ilala and Mwanza, but that the information has been disseminated in a way which does not reach the general public or in a form which is not easily accessible for ordinary citizens. Table 19: Information received on tax revenue collected in the area (% of the respondents)
Council name Description
Ilala MC Bagamoyo
DC Kilosa
DC Iringa DC
Moshi DC
Mwanza CC Total
No information received 94.3 93.3 66.7 79.5 88.6 94.3 86.1
Village chairperson/ mtaa leader - 0.5 10.5 5.2 1.4 2.4 3.3
Village executive officer (VEO) - 2.4 18.6 12.9 0.5 1.0 5.9
Ward executive officer (WEO) 4.8 2.4 3.8 1.4 - 1.0 2.2
Council staff 0.5 1.0 0.5 - - - 0.3
The ward councillor - 0.5 - 0.5 0.5 0.2
Inform-ation received from:
Others 0.5 - - 1.0 9.0 1.0 1.9
Source: Citizens Survey (FPR, 2003a). The survey data do not provide us with a clear answer as to why the respondents in the two urban councils are more ignorant on this issue than people living in rural councils. However, among those who say they have received information on tax revenues, the Village Executive Officers (VEOs) are in general the most likely institution to have issued it. This may indicate that the VEOs in some contexts may function as a good channel of information between the council and citizens, and that some councils use this channel more effectively than others. Our research shows that Kilosa DC, and to some extent also Iringa DC, use village and ward meetings actively as a way of disseminating such information orally to the public. For instance, Kilosa has introduced a system where information from the village accounts on revenue and expenditure is presented orally at the quarterly Village Assembly meetings. According to people
21
interviewed, this has also led to much higher attendance at these meetings. The experiences of Kilosa and Iringa may, therefore, provide useful lessons for other councils. It also matters that these two councils have greater experience of bottom-up and participatory planning approaches than many other local authorities due to the involvement of foreign donors over a relatively long period of time (Ireland Aid in Kilosa and Danida in Iringa). The citizens’ survey was conducted about 4 months after the substantial rationalisation of local government taxes, including the abolition of the development levy. As Table 20 shows, there are large variations across councils with regard to awareness of these recent changes in the local tax system. In Kilosa DC only 12% have not heard of the changes, while the corresponding figure for Mwanza CC is more than 73%. Of the respondents who had heard of the amendments to the local tax system, the majority were not, however, able to specify what these changes were. Table 20: Awareness of recent changes in the local tax system (as at October 2003, as a % of the respondents)
Council name Description
Ilala MC
Bagamoyo DC
Kilosa DC
Iringa DC
Moshi DC
Mwanza CC
Total
Not heard of recent changes to LG tax 67.6 66.2 12.4 26.2 70.5 73.3 52.7
Abolition of development levy 2.9 6.2 37.6 22.9 4.3 5.2 13.2
Abolition of nuisance taxes - 1.4 1.4 3.3 1.4 0.5 1.3
Abolition of all taxes 2.9 1.9 4.8 11.0 1.9 2.9 4.2
Reduction of some tax rates 1.0 - - 1.0 0.5 0.5 0.5
Abolition of local government taxes - - - 2.4 - - 0.4
Abolition of tax on small businesses - - - 2.9 1.0 - 0.6
Abolition of crop/animal taxes - - 0.5 1.4 - - 0.3
Abolition of property taxes 0.5 - 0.5 - - 0.5 0.2
Some people (women) exempted - - 0.5 - - - 0.1
Have heard of recent changes to LG tax
Did not specify 25.2 24.3 42.4 29.0 20.5 17.1 26.4
Source: Citizens’ Survey (FPR, 2003a).
6 Tax compliance and fiscal corruption
In all the case councils, taxpayers’ unwillingness to pay taxes and fees is reported as a major obstacle to enhancing local government revenue. This is also documented in studies from other councils across Tanzania in recent years (e.g., Fjeldstad & Semboja, 2000, 2001). The citizens’ survey provides some indications as to the factors which impact on taxpayers’ compliance behaviour. Table 21 shows the percentages of all respondents, by council and in total, that agree, agree partly (50-50) or disagree as to whether given issues are major problems in tax collection. Other
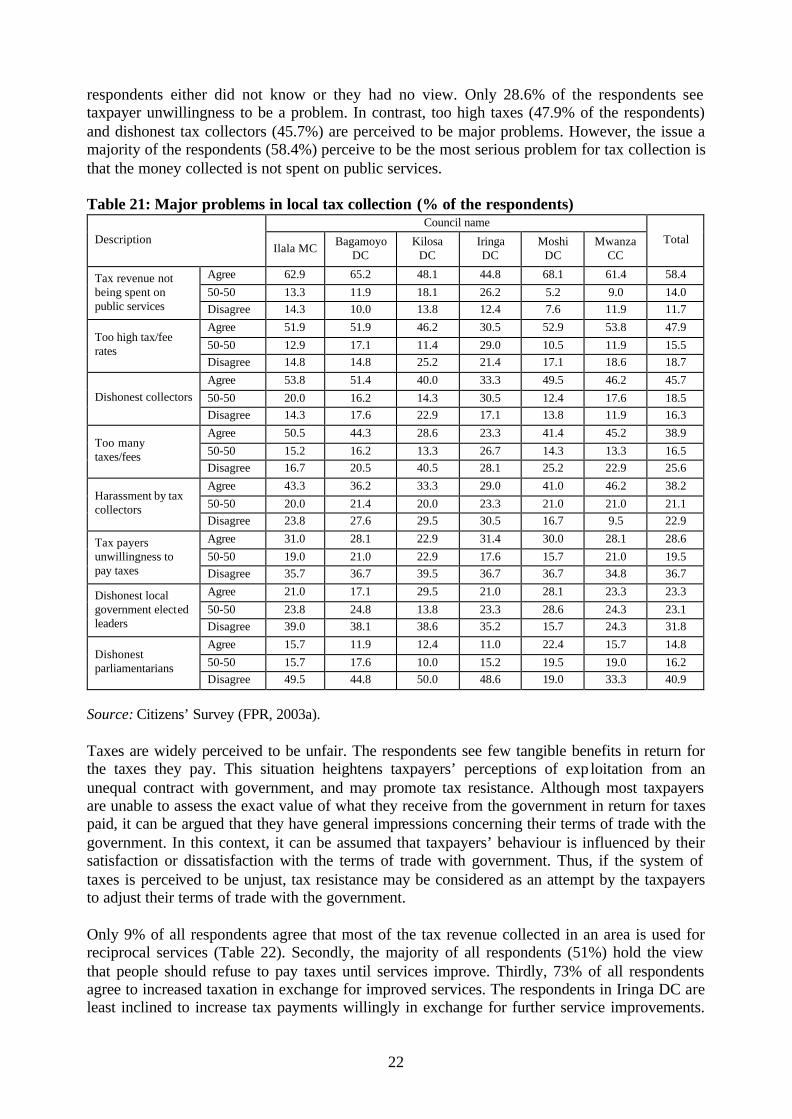
22
respondents either did not know or they had no view. Only 28.6% of the respondents see taxpayer unwillingness to be a problem. In contrast, too high taxes (47.9% of the respondents) and dishonest tax collectors (45.7%) are perceived to be major problems. However, the issue a majority of the respondents (58.4%) perceive to be the most serious problem for tax collection is that the money collected is not spent on public services. Table 21: Major problems in local tax collection (% of the respondents)
Council name Description
Ilala MC Bagamoyo DC
Kilosa DC
Iringa DC
Moshi DC
Mwanza CC
Total
Agree 62.9 65.2 48.1 44.8 68.1 61.4 58.4 50-50 13.3 11.9 18.1 26.2 5.2 9.0 14.0
Tax revenue not being spent on public services Disagree 14.3 10.0 13.8 12.4 7.6 11.9 11.7
Agree 51.9 51.9 46.2 30.5 52.9 53.8 47.9 50-50 12.9 17.1 11.4 29.0 10.5 11.9 15.5
Too high tax/fee rates
Disagree 14.8 14.8 25.2 21.4 17.1 18.6 18.7 Agree 53.8 51.4 40.0 33.3 49.5 46.2 45.7 50-50 20.0 16.2 14.3 30.5 12.4 17.6 18.5 Dishonest collectors Disagree 14.3 17.6 22.9 17.1 13.8 11.9 16.3 Agree 50.5 44.3 28.6 23.3 41.4 45.2 38.9 50-50 15.2 16.2 13.3 26.7 14.3 13.3 16.5
Too many taxes/fees
Disagree 16.7 20.5 40.5 28.1 25.2 22.9 25.6 Agree 43.3 36.2 33.3 29.0 41.0 46.2 38.2 50-50 20.0 21.4 20.0 23.3 21.0 21.0 21.1
Harassment by tax collectors
Disagree 23.8 27.6 29.5 30.5 16.7 9.5 22.9 Agree 31.0 28.1 22.9 31.4 30.0 28.1 28.6 50-50 19.0 21.0 22.9 17.6 15.7 21.0 19.5
Tax payers unwillingness to pay taxes Disagree 35.7 36.7 39.5 36.7 36.7 34.8 36.7
Agree 21.0 17.1 29.5 21.0 28.1 23.3 23.3 50-50 23.8 24.8 13.8 23.3 28.6 24.3 23.1
Dishonest local government elected leaders Disagree 39.0 38.1 38.6 35.2 15.7 24.3 31.8
Agree 15.7 11.9 12.4 11.0 22.4 15.7 14.8 50-50 15.7 17.6 10.0 15.2 19.5 19.0 16.2
Dishonest parliamentarians
Disagree 49.5 44.8 50.0 48.6 19.0 33.3 40.9
Source: Citizens’ Survey (FPR, 2003a). Taxes are widely perceived to be unfair. The respondents see few tangible benefits in return for the taxes they pay. This situation heightens taxpayers’ perceptions of exp loitation from an unequal contract with government, and may promote tax resistance. Although most taxpayers are unable to assess the exact value of what they receive from the government in return for taxes paid, it can be argued that they have general impressions concerning their terms of trade with the government. In this context, it can be assumed that taxpayers’ behaviour is influenced by their satisfaction or dissatisfaction with the terms of trade with government. Thus, if the system of taxes is perceived to be unjust, tax resistance may be considered as an attempt by the taxpayers to adjust their terms of trade with the government. Only 9% of all respondents agree that most of the tax revenue collected in an area is used for reciprocal services (Table 22). Secondly, the majority of all respondents (51%) hold the view that people should refuse to pay taxes until services improve. Thirdly, 73% of all respondents agree to increased taxation in exchange for improved services. The respondents in Iringa DC are least inclined to increase tax payments willingly in exchange for further service improvements.
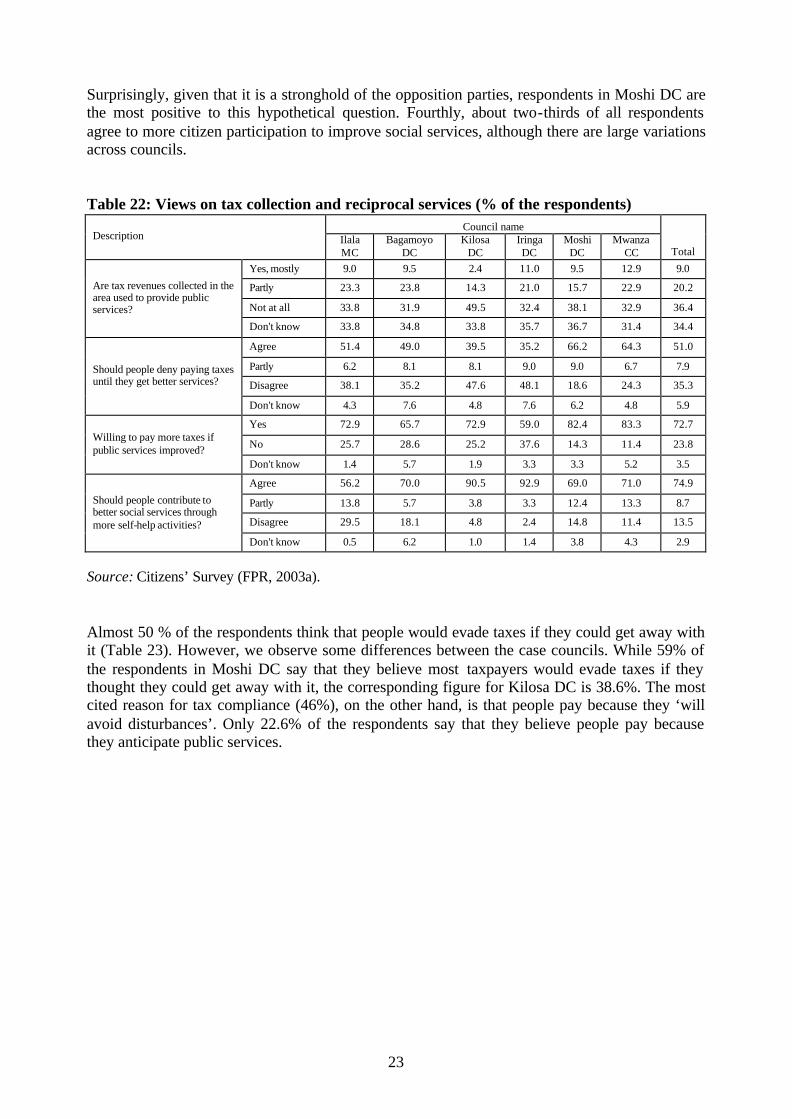
23
Surprisingly, given that it is a stronghold of the opposition parties, respondents in Moshi DC are the most positive to this hypothetical question. Fourthly, about two-thirds of all respondents agree to more citizen participation to improve social services, although there are large variations across councils. Table 22: Views on tax collection and reciprocal services (% of the respondents)
Council name Description Ilala
MC Bagamoyo
DC Kilosa
DC Iringa DC
Moshi DC
Mwanza CC Total
Yes, mostly 9.0 9.5 2.4 11.0 9.5 12.9 9.0
Partly 23.3 23.8 14.3 21.0 15.7 22.9 20.2
Not at all 33.8 31.9 49.5 32.4 38.1 32.9 36.4
Are tax revenues collected in the area used to provide public services?
Don't know 33.8 34.8 33.8 35.7 36.7 31.4 34.4
Agree 51.4 49.0 39.5 35.2 66.2 64.3 51.0
Partly 6.2 8.1 8.1 9.0 9.0 6.7 7.9
Disagree 38.1 35.2 47.6 48.1 18.6 24.3 35.3 Should people deny paying taxes until they get better services?
Don't know 4.3 7.6 4.8 7.6 6.2 4.8 5.9
Yes 72.9 65.7 72.9 59.0 82.4 83.3 72.7
No 25.7 28.6 25.2 37.6 14.3 11.4 23.8 Willing to pay more taxes if public services improved?
Don't know 1.4 5.7 1.9 3.3 3.3 5.2 3.5
Agree 56.2 70.0 90.5 92.9 69.0 71.0 74.9
Partly 13.8 5.7 3.8 3.3 12.4 13.3 8.7
Disagree 29.5 18.1 4.8 2.4 14.8 11.4 13.5
Should people contribute to better social services through more self-help activities?
Don't know 0.5 6.2 1.0 1.4 3.8 4.3 2.9
Source: Citizens’ Survey (FPR, 2003a). Almost 50 % of the respondents think that people would evade taxes if they could get away with it (Table 23). However, we observe some differences between the case councils. While 59% of the respondents in Moshi DC say that they believe most taxpayers would evade taxes if they thought they could get away with it, the corresponding figure for Kilosa DC is 38.6%. The most cited reason for tax compliance (46%), on the other hand, is that people pay because they ‘will avoid disturbances’. Only 22.6% of the respondents say that they believe people pay because they anticipate public services.
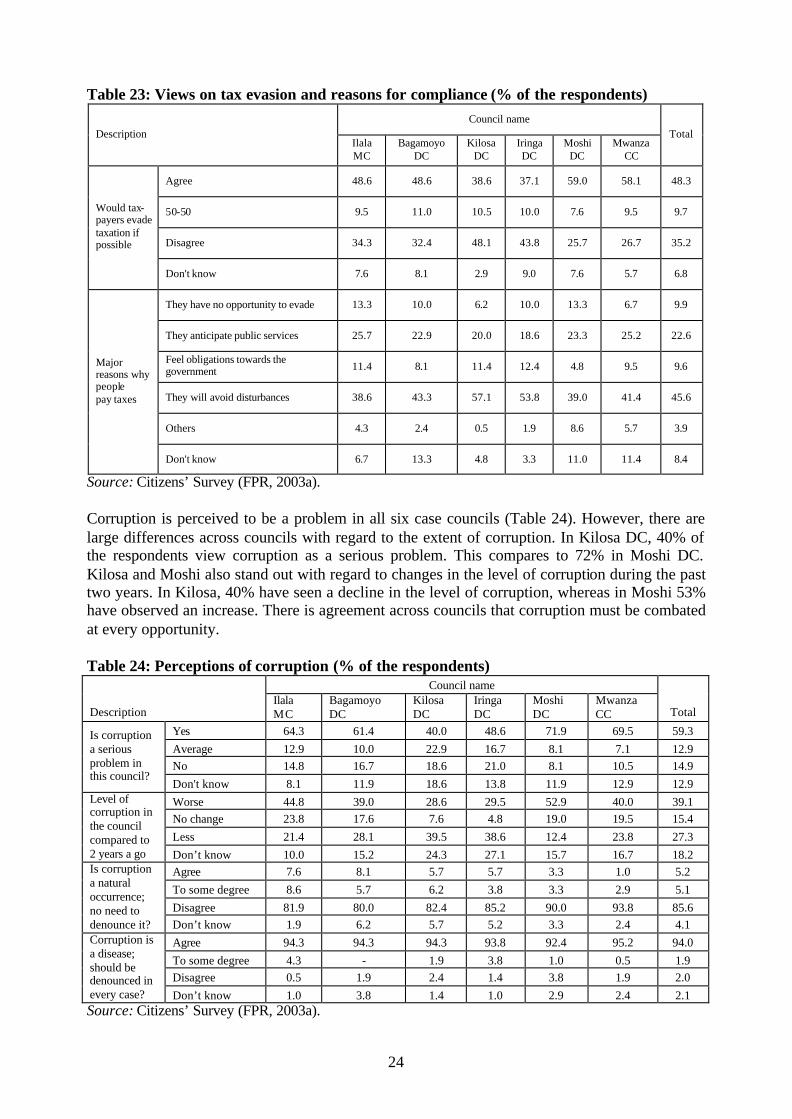
24
Table 23: Views on tax evasion and reasons for compliance (% of the respondents) Council name
Description Ilala MC
Bagamoyo DC
Kilosa DC
Iringa DC
Moshi DC
Mwanza CC
Total
Agree 48.6 48.6 38.6 37.1 59.0 58.1 48.3
50-50 9.5 11.0 10.5 10.0 7.6 9.5 9.7
Disagree 34.3 32.4 48.1 43.8 25.7 26.7 35.2
Would tax- payers evade taxation if possible
Don't know 7.6 8.1 2.9 9.0 7.6 5.7 6.8
They have no opportunity to evade 13.3 10.0 6.2 10.0 13.3 6.7 9.9
They anticipate public services 25.7 22.9 20.0 18.6 23.3 25.2 22.6
Feel obligations towards the government 11.4 8.1 11.4 12.4 4.8 9.5 9.6
They will avoid disturbances 38.6 43.3 57.1 53.8 39.0 41.4 45.6
Others 4.3 2.4 0.5 1.9 8.6 5.7 3.9
Major reasons why people pay taxes
Don't know 6.7 13.3 4.8 3.3 11.0 11.4 8.4
Source: Citizens’ Survey (FPR, 2003a). Corruption is perceived to be a problem in all six case councils (Table 24). However, there are large differences across councils with regard to the extent of corruption. In Kilosa DC, 40% of the respondents view corruption as a serious problem. This compares to 72% in Moshi DC. Kilosa and Moshi also stand out with regard to changes in the level of corruption during the past two years. In Kilosa, 40% have seen a decline in the level of corruption, whereas in Moshi 53% have observed an increase. There is agreement across councils that corruption must be combated at every opportunity. Table 24: Perceptions of corruption (% of the respondents)
Council name
Description Ilala MC
Bagamoyo DC
Kilosa DC
Iringa DC
Moshi DC
Mwanza CC Total
Yes 64.3 61.4 40.0 48.6 71.9 69.5 59.3 Average 12.9 10.0 22.9 16.7 8.1 7.1 12.9 No 14.8 16.7 18.6 21.0 8.1 10.5 14.9
Is corruption a serious problem in this council?
Don't know 8.1 11.9 18.6 13.8 11.9 12.9 12.9 Worse 44.8 39.0 28.6 29.5 52.9 40.0 39.1 No change 23.8 17.6 7.6 4.8 19.0 19.5 15.4 Less 21.4 28.1 39.5 38.6 12.4 23.8 27.3
Level of corruption in the council compared to 2 years a go Don’t know 10.0 15.2 24.3 27.1 15.7 16.7 18.2
Agree 7.6 8.1 5.7 5.7 3.3 1.0 5.2 To some degree 8.6 5.7 6.2 3.8 3.3 2.9 5.1 Disagree 81.9 80.0 82.4 85.2 90.0 93.8 85.6
Is corruption a natural occurrence; no need to denounce it? Don’t know 1.9 6.2 5.7 5.2 3.3 2.4 4.1
Agree 94.3 94.3 94.3 93.8 92.4 95.2 94.0 To some degree 4.3 - 1.9 3.8 1.0 0.5 1.9 Disagree 0.5 1.9 2.4 1.4 3.8 1.9 2.0
Corruption is a disease; should be denounced in every case? Don’t know 1.0 3.8 1.4 1.0 2.9 2.4 2.1 Source: Citizens’ Survey (FPR, 2003a).
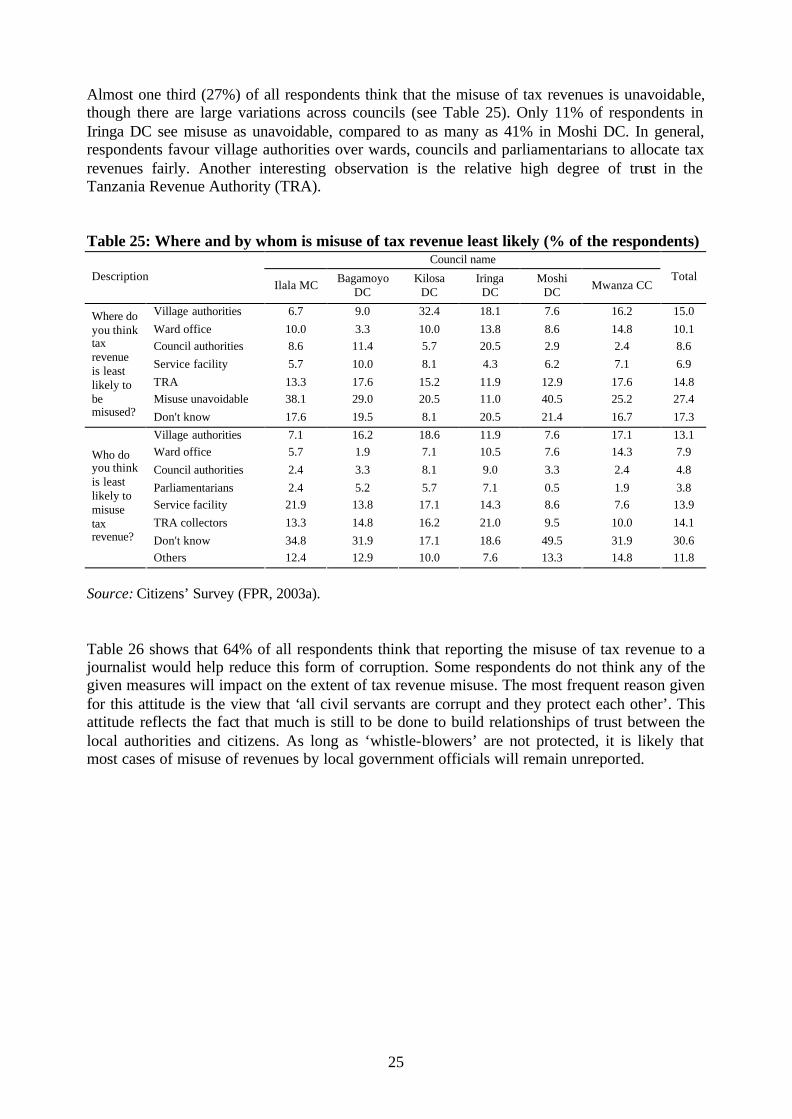
25
Almost one third (27%) of all respondents think that the misuse of tax revenues is unavoidable, though there are large variations across councils (see Table 25). Only 11% of respondents in Iringa DC see misuse as unavoidable, compared to as many as 41% in Moshi DC. In general, respondents favour village authorities over wards, councils and parliamentarians to allocate tax revenues fairly. Another interesting observation is the relative high degree of trust in the Tanzania Revenue Authority (TRA). Table 25: Where and by whom is misuse of tax revenue least likely (% of the respondents)
Council name Description
Ilala MC Bagamoyo DC
Kilosa DC
Iringa DC
Moshi DC Mwanza CC
Total
Village authorities 6.7 9.0 32.4 18.1 7.6 16.2 15.0 Ward office 10.0 3.3 10.0 13.8 8.6 14.8 10.1 Council authorities 8.6 11.4 5.7 20.5 2.9 2.4 8.6 Service facility 5.7 10.0 8.1 4.3 6.2 7.1 6.9 TRA 13.3 17.6 15.2 11.9 12.9 17.6 14.8 Misuse unavoidable 38.1 29.0 20.5 11.0 40.5 25.2 27.4
Where do you think tax revenue is least likely to be misused? Don't know 17.6 19.5 8.1 20.5 21.4 16.7 17.3
Village authorities 7.1 16.2 18.6 11.9 7.6 17.1 13.1 Ward office 5.7 1.9 7.1 10.5 7.6 14.3 7.9 Council authorities 2.4 3.3 8.1 9.0 3.3 2.4 4.8 Parliamentarians 2.4 5.2 5.7 7.1 0.5 1.9 3.8 Service facility 21.9 13.8 17.1 14.3 8.6 7.6 13.9 TRA collectors 13.3 14.8 16.2 21.0 9.5 10.0 14.1 Don't know 34.8 31.9 17.1 18.6 49.5 31.9 30.6
Who do you think is least likely to misuse tax revenue?
Others 12.4 12.9 10.0 7.6 13.3 14.8 11.8
Source: Citizens’ Survey (FPR, 2003a). Table 26 shows that 64% of all respondents think that reporting the misuse of tax revenue to a journalist would help reduce this form of corruption. Some respondents do not think any of the given measures will impact on the extent of tax revenue misuse. The most frequent reason given for this attitude is the view that ‘all civil servants are corrupt and they protect each other’. This attitude reflects the fact that much is still to be done to build relationships of trust between the local authorities and citizens. As long as ‘whistle-blowers’ are not protected, it is likely that most cases of misuse of revenues by local government officials will remain unreported.
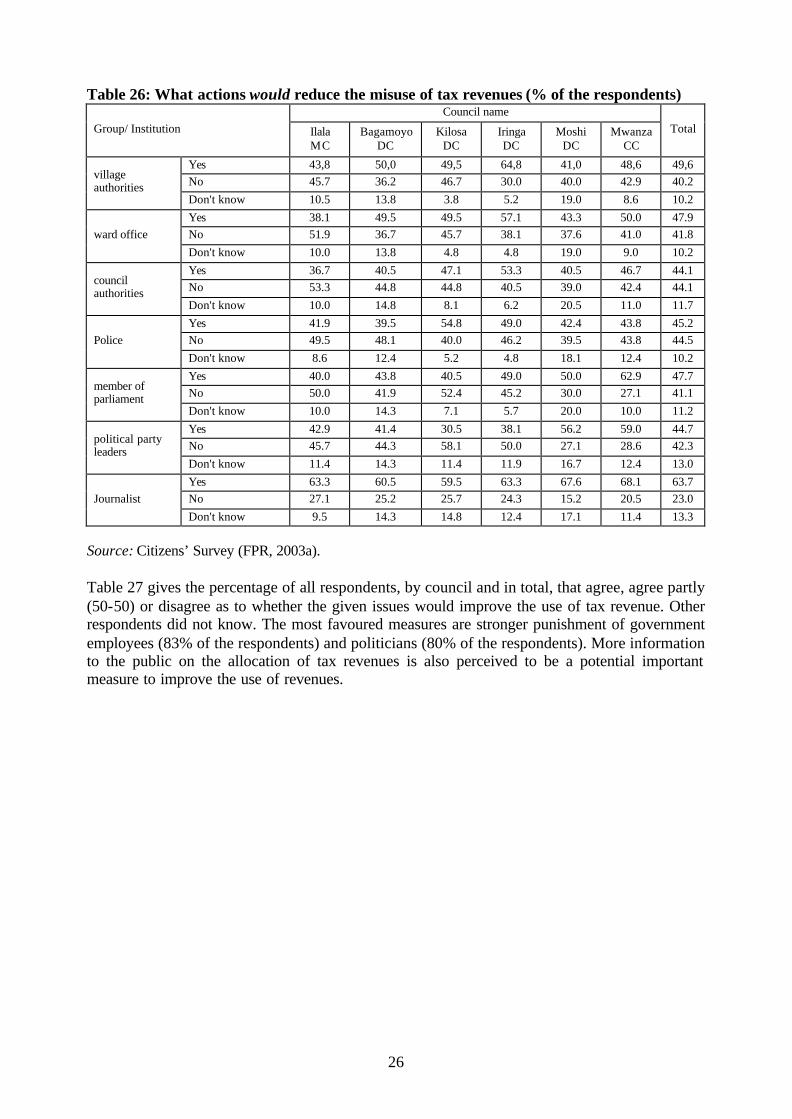
26
Table 26: What actions would reduce the misuse of tax revenues (% of the respondents) Council name
Group/ Institution Ilala MC
Bagamoyo DC
Kilosa DC
Iringa DC
Moshi DC
Mwanza CC
Total
Yes 43,8 50,0 49,5 64,8 41,0 48,6 49,6 No 45.7 36.2 46.7 30.0 40.0 42.9 40.2 village
authorities Don't know 10.5 13.8 3.8 5.2 19.0 8.6 10.2 Yes 38.1 49.5 49.5 57.1 43.3 50.0 47.9 No 51.9 36.7 45.7 38.1 37.6 41.0 41.8 ward office Don't know 10.0 13.8 4.8 4.8 19.0 9.0 10.2 Yes 36.7 40.5 47.1 53.3 40.5 46.7 44.1 No 53.3 44.8 44.8 40.5 39.0 42.4 44.1 council
authorities Don't know 10.0 14.8 8.1 6.2 20.5 11.0 11.7 Yes 41.9 39.5 54.8 49.0 42.4 43.8 45.2 No 49.5 48.1 40.0 46.2 39.5 43.8 44.5 Police Don't know 8.6 12.4 5.2 4.8 18.1 12.4 10.2 Yes 40.0 43.8 40.5 49.0 50.0 62.9 47.7 No 50.0 41.9 52.4 45.2 30.0 27.1 41.1 member of
parliament Don't know 10.0 14.3 7.1 5.7 20.0 10.0 11.2 Yes 42.9 41.4 30.5 38.1 56.2 59.0 44.7 No 45.7 44.3 58.1 50.0 27.1 28.6 42.3 political party
leaders Don't know 11.4 14.3 11.4 11.9 16.7 12.4 13.0 Yes 63.3 60.5 59.5 63.3 67.6 68.1 63.7 No 27.1 25.2 25.7 24.3 15.2 20.5 23.0 Journalist Don't know 9.5 14.3 14.8 12.4 17.1 11.4 13.3
Source: Citizens’ Survey (FPR, 2003a). Table 27 gives the percentage of all respondents, by council and in total, that agree, agree partly (50-50) or disagree as to whether the given issues would improve the use of tax revenue. Other respondents did not know. The most favoured measures are stronger punishment of government employees (83% of the respondents) and politicians (80% of the respondents). More information to the public on the allocation of tax revenues is also perceived to be a potential important measure to improve the use of revenues.
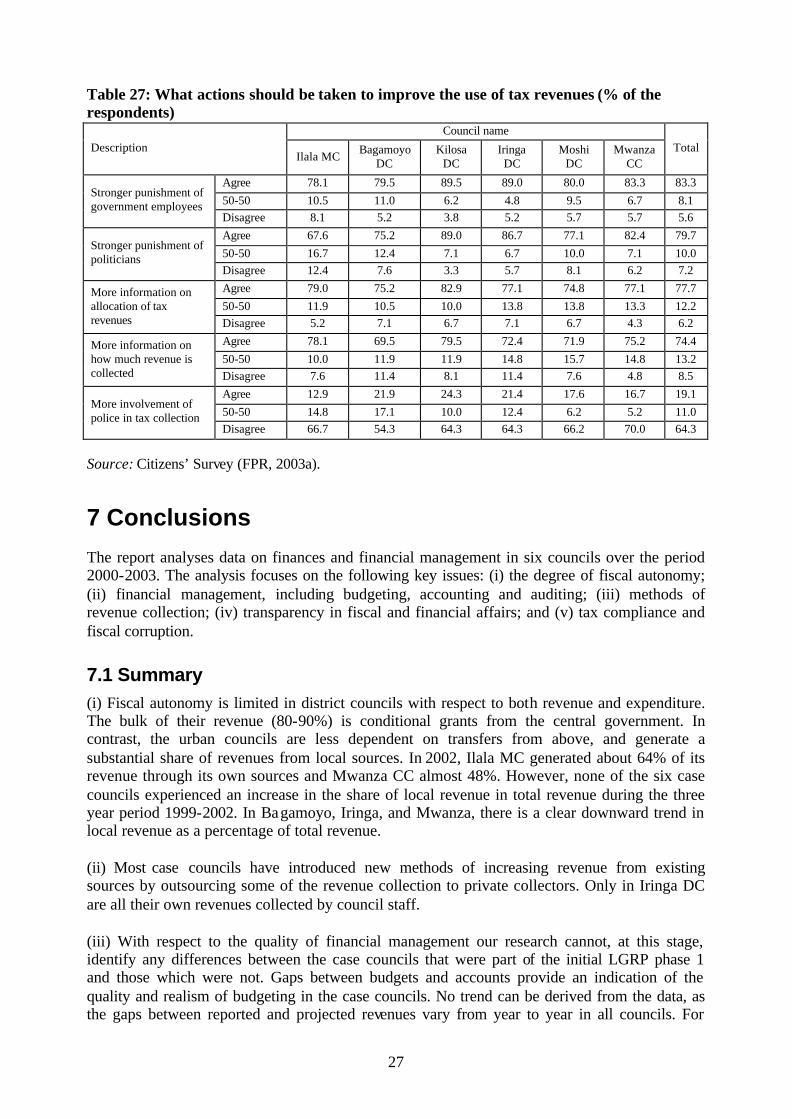
27
Table 27: What actions should be taken to improve the use of tax revenues (% of the respondents)
Council name Description
Ilala MC Bagamoyo DC
Kilosa DC
Iringa DC
Moshi DC
Mwanza CC
Total
Agree 78.1 79.5 89.5 89.0 80.0 83.3 83.3 50-50 10.5 11.0 6.2 4.8 9.5 6.7 8.1
Stronger punishment of government employees
Disagree 8.1 5.2 3.8 5.2 5.7 5.7 5.6 Agree 67.6 75.2 89.0 86.7 77.1 82.4 79.7 50-50 16.7 12.4 7.1 6.7 10.0 7.1 10.0
Stronger punishment of politicians
Disagree 12.4 7.6 3.3 5.7 8.1 6.2 7.2 Agree 79.0 75.2 82.9 77.1 74.8 77.1 77.7 50-50 11.9 10.5 10.0 13.8 13.8 13.3 12.2
More information on allocation of tax revenues Disagree 5.2 7.1 6.7 7.1 6.7 4.3 6.2
Agree 78.1 69.5 79.5 72.4 71.9 75.2 74.4 50-50 10.0 11.9 11.9 14.8 15.7 14.8 13.2
More information on how much revenue is collected Disagree 7.6 11.4 8.1 11.4 7.6 4.8 8.5
Agree 12.9 21.9 24.3 21.4 17.6 16.7 19.1 50-50 14.8 17.1 10.0 12.4 6.2 5.2 11.0
More involvement of police in tax collection
Disagree 66.7 54.3 64.3 64.3 66.2 70.0 64.3
Source: Citizens’ Survey (FPR, 2003a).
7 Conclusions
The report analyses data on finances and financial management in six councils over the period 2000-2003. The analysis focuses on the following key issues: (i) the degree of fiscal autonomy; (ii) financial management, including budgeting, accounting and auditing; (iii) methods of revenue collection; (iv) transparency in fiscal and financial affairs; and (v) tax compliance and fiscal corruption.
7.1 Summary (i) Fiscal autonomy is limited in district councils with respect to both revenue and expenditure. The bulk of their revenue (80-90%) is conditional grants from the central government. In contrast, the urban councils are less dependent on transfers from above, and generate a substantial share of revenues from local sources. In 2002, Ilala MC generated about 64% of its revenue through its own sources and Mwanza CC almost 48%. However, none of the six case councils experienced an increase in the share of local revenue in total revenue during the three year period 1999-2002. In Bagamoyo, Iringa, and Mwanza, there is a clear downward trend in local revenue as a percentage of total revenue. (ii) Most case councils have introduced new methods of increasing revenue from existing sources by outsourcing some of the revenue collection to private collectors. Only in Iringa DC are all their own revenues collected by council staff. (iii) With respect to the quality of financial management our research cannot, at this stage, identify any differences between the case councils that were part of the initial LGRP phase 1 and those which were not. Gaps between budgets and accounts provide an indication of the quality and realism of budgeting in the case councils. No trend can be derived from the data, as the gaps between reported and projected revenues vary from year to year in all councils. For
28
some councils, and in particular Moshi DC, the annual fluctuations are substantial and reflect weak budgeting. Moreover, the staffing situation in the case councils’ treasury departments differs with respect to both the number of staff members and their qualifications. The urban councils are better staffed than the rural ones. However, a general picture from the Treasury Departments is that about one third or less of the staff are trained accountants. The remaining majority of staff have either no formal training in accounting or only certificates. Furthermore, while more councils than before have a ‘clean’ statement on their accounts from the Controller and Auditor General (this applies to Ilala MC, Kilosa DC, Moshi DC and Mwanza CC, which all received clean reports in 2001), it is too early to state whether this is a trend or only accidental. Hence, one should be cautious about drawing conclusions on this basis. (iv) There are reasons to question the effectiveness of the mechanisms used by the councils to disseminate information on financial and fiscal affairs to the public, and whether such information actually reaches the public. Very few of the respondents (5.6%) in the citizens’ survey, which covered 1260 respondents in the case councils, say they have seen any information about local government finances. 86% of all respondents say they have never received information on the amount of tax revenue and user charges collected in area. There are, however, large variations across councils. The respondents in Kilosa DC appear to be the best informed, whereas the highest levels of ignorance among citizens with regard to tax collection are found in the urban councils Ilala MC and Mwanza CC. (v) In all the case councils, taxpayers’ unwillingness to pay taxes and fees is reported as a major obstacle to enhancing local government revenues. The most serious problem perceived by a majority of the respondents (58.4%) in the citizens’ survey is that the money collected is not spent on public services. With respect to the urban-rural divide which is observed on other issues, respondents in Ilala MC and Mwanza CC report that too many taxes/fees and harassment by tax collectors are larger problems than those reported by respondents in rural councils. However, dissatisfaction on poor linkages between taxes paid and service delivery shows no rural-urban divide. In general, taxes are widely perceived to be unfair. Only 9% of respondents agree with the statement that ‘most of the tax revenue collected in the area is used for reciprocal services’. The most cited reason for tax compliance (46%), on the other hand, is that people pay because they ‘will avoid disturbances’. Interestingly, 73% of the respondents say they would be willing to pay more taxes in exchange for improved services. Corruption is also perceived to be a problem in all six case councils. However, there are large differences across councils with respect to the extent of corruption. In Kilosa DC, 40% of the respondents view corruption as a serious problem, compared to 72% in Moshi DC. Moreover, in Kilosa 40% have seen a decline in the level of corruption during the past two years, whereas in Moshi 53% have observed an increase. There is agreement across councils that corruption must be combated at every opportunity, but many respondents think that no measures will impact on the extent of tax revenue misuse. The most frequent reason given for this attitude is the view that ‘all civil servants are corrupt and they protect each other’. This attitude reflects the fact that much is still to be done to build relationships of trust between the local authorities and citizens.
7.2 Implications for policy One major administrative problem today for many councils is their inability to collect fully the revenue due to them. In most councils there are huge gaps between reported and projected revenues. This is due to: (1) poor administrative capacity to assess the revenue base; (2) poor administrative capacity to enforce the taxes; (3) explicit and intentional tax evasion and resistance from taxpayers; (4) corruption, including embezzlement of revenues; (5) external pressure on the local finance department to provide optimistic projections; and (6) political pressure on the local

29
tax administration to go easy on revenue collection. In this setting, fundamental issues to be addressed in the context of local government fiscal reforms are to redesign the current revenue structure and to strengthen financial management. Moreover, measures are required to enhance taxpayers’ compliance and to improve the accountability of tax collectors and councillors. This cannot be achieved without substantial and consistent political support from the central government. A fundamental requirement when further redesigning the local tax system is greater emphasis on the cost-effectiveness of revenue collection, taking into account not only the direct costs of tax administration, but also the overall costs to the economy, including the compliance costs to the taxpayers. In addition, losses through corruption and tax evasion need to be reduced. To achieve these aims, there is a need to further simplify the licence and fee structures by reducing the number of rates and coverage. Fees and licences that have regulatory functions, such as sand fees, hunting and business licences, should be harmonised with central government taxes, to avoid double taxation and conflicts with national development policies such as employment creation and environmental protection. Furthermore, uniform rates on agricultural taxes (crop cess) are necessary to minimise distortions. In this context it might be worth considering the possibility of centralising the collection of certain local taxes. For instance, cess on export crops could be collected by the Tanzania Revenue Authority at their points of export. More realism is required when it comes to the implementation of a properly functioning property tax system. An important element of the fiscal decentralisation process has been to give municipalities the power to value, assess, bill, collect and enforce property taxes (see McCluskey et al, 2003). Property tax has many attractions as a local revenue base since it is imposed on immobile assets and therefore is difficult to avoid - at least in principle. However, it has some obvious weaknesses which need to be taken into consideration before heavy reliance is placed on it. In particular, problems of valuation and tax enforcement often occur due to political interventions and administrative weaknesses. The municipalities’ capacity and capability to administer the property tax have in general proved to be inadequate. Hence, it has been difficult for many councils to maintain the current property valuation registers, let alone to continue the property valuation exercises. There is therefore a need to reassess the basis of the property tax in urban councils and to implement a more simple and coherent approach to the valuation provision, which takes into consideration administrative capacity and capability constraints facing the councils. Moreover, the experience of urban councils implies a need for caution when extending property tax to district councils. Some councils have started to explore methods of reducing the financial gap caused by the tax rationalisation in June 2003 by: (1) outsourcing revenue collection to private collectors to increase revenue from existing sources (e.g. natural resource products, including charcoal, wood and other forest products, and livestock auction fees); (2) reducing costs (e.g. by limiting the number of meetings and workshops and by retrenching surplus staff); and (3) imposing more cost-effective spending (e.g. on electricity and stationery). Current attempts at economic diversification will also help to expand the tax base (e.g. a longer-term strategy of introducing new cash crops). Moreover, co-production of services by councils and local communities is on the rise. For instance, in several councils recently visited by the research team an increasing number of primary schools are maintained and expanded via self-help schemes combined with technical support from the council. Transparency with respect to budgets and accounts is at the heart of local government accountability. Local authorities publish information on revenues collected and allocations of funds, as they are obliged to, according to the Local Authority Financial Memorandum of 1997.
30
However, at present much of this information does not reach or is not understood by the general public. Public notices gazetted in newspapers or posted on notice boards at council headquarters are often presented in a relatively complicated and technical way which is hard for ordinary citizens to understand. Many people do not take an interest in reading notices and newspapers. It should be added that the literacy level of many citizens is low. A main challenge is therefore to provide information on fiscal issues in ways which are understandable and which reach the general public. The successful dissemination of information on HIV/AIDS prevention may provide useful lessons on how to design and disseminate information on budgets and accounts to the communities. Written and oral methods of dissemination should be combined, including information submitted at service outlets suc h as schools and dispensaries, and at village and ward offices. More active use of the VEOs and mtaa leaders to communicate such information to citizens may also pay high dividends, as the experience of Kilosa and Iringa indicates. Urban councils will in general require additional measures compared to rural councils, due to the often high mobility and turnover of residents, which makes it more difficult to reach citizens with such information. Improved information to the public on budgets and accounts may improve the opportunities for citizens to raise their voices and demand accountability from local authorities. It is, however, important to stress that encouraging citizens and civil society to engage in fiscal and financial monitoring at the local level does not imply that such measures should replace formal auditing and accounting mechanisms. Nor does it imply that such measures will weaken the formal accountability mechanisms. On the contrary, it can strengthen the legitimacy and standing of local authorities in the communities by contributing, with complementary measures, to improved control of revenue collection and expenditure.
References
Cooksey, B. & M. Mmuya 1997: The use and quality of health services in rural Tanzania. Dar es Salaam: TADREG. (Working Paper 6: 97)
Economic and Social Research Foundation [ESRF] & Front Against Corrupt Elements in Tanzania [FACEIT] 2002: The state of corruption in Tanzania. Annual report 2002. Final Report October 2002. Dar es Salaam.
Fjeldstad, O.-H. 2003: Fiscal decentralisation in Tanzania. For better or for worse? Journal of Public Administration, Vol. 38, No. 2 (June), pp. 133-149.
Fjeldstad, O.-H. 2003: New challenges for local government revenue enhancement. Formative Process Research on the Local Government Reform in Tanzania. Dar es Salaam: REPOA (Project Brief No. 2 (2003).
Fjeldstad, O.-H. & J. Semboja 2001: Why people pay taxes. The case of the development levy in Tanzania. World Development, Vol. 29, No. 12, pp. 2059-2074 (December).
Fjeldstad, O.-H. & J. Semboja 2000: Dilemmas of fiscal decentralisation: A study of local government taxation in Tanzania. Forum for Development Studies, Vol. 27, No. 1, pp. 7-41.
Formative Process Research on the Local Government Reform in Tanzania [FPR] 2003a: Citizens survey report. Bergen: Chr. Michelsen Institute (November).
Formative Process Research on the Local Government Reform in Tanzania [FPR] 2003b: Fieldwork manual. Bergen/Oslo/Dar es Salaam: CMI/NIBR/REPOA (February).
Formative Process Research on the Local Government Reform in Tanzania [FPR] 2002: Inception report. Bergen/Oslo/Dar es Salaam: CMI/NIBR/REPOA (October).
International Monetary Fund [IMF] 2003: Tanzania: Selected issues and statistical appendix. (January, p. 7) (IMF Country Report No. 03/2).
31
Langlois, L.A. & R. Beschel Jr. with R. Stapenhurst 1998: Public expenditure analysis and management in the Republic of Kariba: A case study. Developing more effective ways to control and manage government resources. Washington DC: The Economic Development Institute of the World Bank.
McCluskey, W., R. Franzsen, T. Johnstone & D. Johnstone 2003: Property tax reform: The experience of Tanzania. London: RICS Foundation.
PriceWaterhouseCoopers 2003: Local government support programme. Design of capital grants programme and capacity building programme for local governments. Final report (December). Dar es Salaam.
PriceWaterhouseCoopers 1998: Local government finance reform. A system for the financing of local government. Report Prepared for the Prime Minister’s Office, United Republic of Tanzania, Dar es Salaam (October).
Semboja, J. & O. Therkildsen, (eds.) 1995: Service provision under stress in East Africa. London: James Currey.
United Republic of Tanzania [URT] 2003a: Local & lower local government revenue sharing and management of finances at the village, ward and mtaa levels. Final Main Report, Volume I (December). Dar es Salaam: President’s Office – Regional Administration and Local Government, UNCDF/DFID.
United Republic of Tanzania [URT] 2003b: Speech by the Minister for Finance Hon. Basil P. Mramba (MP), Introducing to the National Assembly the estimates of government revenue and expenditure for the financial year 2003/2004 (12th June, 2003). Dar es Salaam: Government Printer.
World Bank 2003: Sustainable development in a dynamic world. Transforming institutions, growth and quality of life. Washington DC: Oxford University Press for the World Bank.
Summary
This report provides baseline data on local government finance
and financial management in six councils in Tanzania:
Bagamoyo District Council, Ilala Municipal Council, Iringa
DC, Kilosa DC, Moshi DC, and Mwanza City Council. The
data cover the period 2000-2003 and represent a reference
point for the situation in the six councils with respect to various
dimensions of local government finance and financial
management in this period. The following themes are covered
by the study: (a) the degree of fiscal autonomy; (b) methods of
revenue collection; (c) financial management, including
budgeting, accounting and auditing; (d) transparency in fiscal
and financial affairs; and (e) tax compliance and fiscal
corruption. In essence, a small, common database has been
developed for all the case councils.
ISSN 0804-3639 ISBN 82-8062-087-7
Recent Working Papers
WP 2004: 5 TOSTENSEN, Arne Towards feasible social security systems in sub-Saharan Africa. Bergen, 2004, 14 pp.
WP 2004: 4 TOSTENSEN, Arne Rural-urban linkages in sub-Saharan Africa: Contemporary debates and implications for Kenyan urban workers in the 21st century. Bergen, 2004, 13 pp.
WP 2004: 3 KOLSTAD, Ivar What constitutes a convention? Implications for the coexistence of conventions. Bergen, 2004, 25 pp.
WP 2004: 2 KOLSTAD, Ivar and Espen Villanger Determinants of foreign direct investment in services. Bergen, 2004, 25 pp. WP 2004: 1 KNUDSEN, Are License to kill. Honour killings in Pakistan. Bergen, 2004. WP 2003: 13 RAKNER, Lise Uncertainty as a strategy: Electoral processes in Zambia 1991-2001. Bergen, 2003, 21 pp. WP 2003:12 FJELDSTAD, Odd-Helge What has trust got to do with it? Non-payment of service charges in local authorities in South
Africa. Bergen, 2003, 26 pp. WP 2003:11 BJORVATN, Kjetil and Carsten Eckel Winners and losers from an international investment agreement. Bergen, 2003, 20 pp. WP 2003:10 KNUDSEN, Are Islamism in the diaspora : Palestinian refugees in Lebanon. Bergen, 2003, 23 pp. WP 2003: 9 GLOPPEN, Siri, Lise Rakner and Arne Tostensen Responsiveness to the concerns of the poor and accountability to the commitment to poverty
reduction. Bergen, 2003, 25 pp. WP 2003: 8 WIIG, Arne and Ivar Kolstad Lowering barriers to agricultural exports through technical assistance. Bergen, 2003, 15 pp. WP 2003: 7 SØREIDE, Tina and Kjetil Bjorvatn Corruption and market reform. Bergen, 2003, 23 pp. WP 2003: 6 VILLANGER, Espen The effects of disasters on income mobility: Bootstrap inference and measurement error
simulations. Bergen, 2003, 27 pp. WP 2003: 5 VILLANGER, Espen Company interests and foreign aid policy: Playing donors out against each other. Bergen, 2003,
40 pp. WP 2003: 4 VILLANGER, Espen Company influence on foreign aid disbursement: Is conditionality credible when donors have
mixed motives? Bergen, 2003, 36 pp. CMI’s publications, Annual Report and quarterly newsletters are available on CMI’s homepage www.cmi.no.