local government gis demonstration grant
TRANSCRIPT

Prepared under the:
Local Government GIS Demonstration Grant
Supported by:
Local Government Records Management Improvement FundLocal Government Records ServicesState Archives and Records Administration
Project Team:
Erie County Water AuthorityMr. Paul Becker, Project Manager
National Center for Geographic Information and AnalysisState University of New York at BuffaloDr. Hugh Calkins, Project DirectorMs. Carmelle J. CôtéMs. Christina Finneran
GIS Resource Group, Inc.Mr. Graham Hayes, PresidentMr. Thomas Murdoch, Vice-President
For More Information, Contact:
Local Government Technology ServicesState Archives And Records Administration9B38 Cultural Education CenterAlbany, New York 12230Phone: (518) 474-4372Fax: (518) 473-4941

GIS DEVELOPMENT GUIDE
Volume 1
Table of Contents
MANAGER'S OVERVIEW
Introduction ......................................................................................... 1Geographic Information Systems: Definitions and Features......................... 3Enterprise-wide GIS: The Corporate Database........................................... 5Policy Issues in GIS Development ............................................................. 6Management Issues in GIS Development .................................................... 7Geographic Information Systems: The Development Cycle ......................... 9Tasks for GIS Development and Use.........................................................10Summary ........................................................................................16References ........................................................................................17Glossary ........................................................................................19
Figures1 - GIS Development Process.........................................................112 - Life-Cycle of a GIS Database ....................................................13
NEEDS ASSESSMENT
Introduction...........................................................................................27Conducting a Needs Assessment ..............................................................28Local Government Uses of GIS................................................................29Data Used by Local Government..............................................................32Documenting GIS Needs..........................................................................33Documenting an Activity-Type Use of the GIS ..........................................36Master Data List.....................................................................................37Conducting Interviews ............................................................................38Preparing the Needs Assessment Report....................................................40Summary...............................................................................................44
AppendicesA - GIS Application Description Forms .........................................A-1B - Full-Page Sample of Master Data List ......................................B-1C - Sample GIS Application Description ........................................C-1D - Data Flow Diagraming Symbols ..............................................D-1E - Sample Application Descriptions and Summary Tables...............E-1

Needs Assessment cont'd
Figures1 - GIS Application Descriptions ....................................................332 - Data Flow Diagram Example ....................................................363 - Master Data List ......................................................................374 - Interviewing and Documenting Needs ........................................395 - List of GIS Applications ...........................................................406 - Table Summarizing Applications Example..................................417 - GIS Applications/Data Matrix....................................................418 - GIS Functions List ...................................................................429 - Compiling Results of Needs Assessment Example........................43
CONCEPTUAL DESIGN OF THE GIS
Part 1 Data Modeling
Introduction ........................................................................................46Nature of Geographic Data......................................................................48Entity Relationship (E-R) Data Modeling..................................................49Geographic Data Models .........................................................................53Methodology for Modeling......................................................................55Developing a Spatial Data Model (Entity-Relationship Diagram) .................58Summary of Conceptual Data Modeling....................................................59
Part 2: Spatial Data Standards and Metadata Requirements
Metadata Tables......................................................................................61Additional Reading.................................................................................64Appendix A ......................................................................................A-1
Figures 1 - GIS Development Process.........................................................45 2 - Life-Cycle of a GIS Database ....................................................46 3 - Entities ...................................................................................49 4 - Example of a Firm's Database...................................................50 5 - Example of Simple E-R Diagrams .............................................50 6 - Simple E-R Diagrams...............................................................52 7 - Spatial Relationships.................................................................54 8 - Entity Symbol for Spatial Objects..............................................56 9 - Entity Relationship Symbols......................................................57
10 - Diagramming a Spatial Relationship...........................................5811 - Example of Entity Relationship Diagram for Local Government...59


GIS DEVELOPMENT GUIDE: MANAGER'S OVERVIEW
11 INTRODUCTION
This guide is the first of a set of technical support documents to assist local governmentsindeveloping a GIS. The set of guides describes procedures and methods for planning theGIS,evaluating potential data sources, testing available hardware and software and planning foritsacquisition, building the GIS data base, developing GIS applications, and planning for the longtermmaintenance of the GIS system and data base. These guides are intended to provide adviceon howbest to accomplish the GIS development tasks for all levels of local government - fromlarge,urbanized counties to small rural towns to special-purpose districts.
Realistically, large comprehensive GISs will be developed by the larger units of government(counties and cities) individually or, most likely as the leader in a cooperative multi-participanteffort. These would involve the individual operating units within that government and/or thesmaller units of local government within the common land area of the larger leading unit.Typically, we would expect to see county government taking the lead, but also covering the interestof all other governmental units within the county. Occasionally, there will be situations wheresmaller units of government (town, special purpose district, or limited purpose GIS application)may have to "go-it-alone" in developing the GIS. These guidelines have been written to mainlyaddress the first case - a county leading a consortium or cooperative effort. Thus, we wouldexpect the GIS development team of a county to be the primary user of these guidelines, in thesense of actually performing the tasks outlined in each document. However, this does notmean the other participants in a GIS should stop reading these guidelines at thispoint. It is critically important for all expected participants in a cooperative GISventure to fully understand the development process. If a smaller unit ofgovernment is to reap the benefits of a county-level GIS, they must activelyparticipate in the planning and development effort.
The procedures are applicablefor use in first-time creation of a GIS, for restructuring an on-goingGIS development project, andfor the review and further development of an existing GIS. Thesubject matter of the guidesidentifies the necessary tasks in a GIS development program,describes appropriate methods toaccomplish each task and, where applicable, provides examplesand illustrations of documents orother products that result from each task.
The guidelines are designed for use by general-purpose local governments (city, county, town, orvillage), special purpose governments (utilities, school districts, etc.), and by those who provideassistanceto local governments (consultants, academic units, etc.). The guides address thetechnical stepsrequired to create a GIS, the management tasks required to ensuresuccessfuldevelopment of the GIS, and the policy issues that should be considered for theeffective use of theGIS.
The Role Of Management
Although GIS is often viewed as an arena for the technically sophisticated computerprofessional,the development of a successful government-based multi-participant GIS is very dependent on
2 GIS Development Guide
propermanagement participation and supervision. Normal, common-sense management practicesare asnecessary in a GIS project as in any other major undertaking. In fact, our experience hasshown thatthe recommended management actions may be the most critical aspect of the GISdevelopmentprocess. GIS development is a process of technological innovation andrequires managementattention appropriate to this type of activity - active as opposedto passive management involvement in theproject. Historically, much of the disillusions anddisappointment with GIS projects stems not froma failure of the technical components of the GISbut rather from a lack of understanding of theprocess of technology innovation and the lack ofrealistic expectations of all parties associated withthe project (GIS technicians, potential users,managers, and elected/appointed officials).
Applying The GIS Development Guides By Local Governments In New YorkState
The overall procedure contained in the GIS Development Guides is very comprehensive andcanrequire considerable time, effort and dollars to complete. This raises the questions:
• Does all ofthis have to be done?• What level of detail is appropriate?• How can smaller governments,villages and towns, special purpose districts,
or a single department in a larger jurisdiction, get through this process?
Does everything have to be done? . . level of detail?
Basically, yes. However, the steps in the GIS development process are frequently done inan iterative manner over an extended time period. Also, the steps are not completelyindependent of one another and so some back-and-forth does happen. It is often useful tomake a "first-cut" run through the entire process, writing down what is already known andidentifying the major questions that need to be answered. The person who will bemanaging the development process may be able to do this "first-cut" description in 1 to 2days. This can be very helpful in getting a feel for the scope of the whole process andthen can be used as a decision tool for continuing. The number of times the process isconducted, the amount of detail, and the resources needed to complete the study can bebalanced in this way. If the intended implementation will be limited or small, theplanning effort and documents can be sized accordingly. It is important, however, thateach step be considered and completed at some level. The companion GIS Designsoftware package that accompanies these guides provides a structure and makes it easy torecord the information developed during the planning process - application descriptions,data model, data dictionary, metadata, logical database design, and record retentioninformation.
How can smaller units of local government, such as villages and small towns complete aGIS Plan?
The best situation for a village, small town, or even a smaller, rural county is to be apartner with a larger unit of government, a county, regional agency or utility company thatis conducting and/or leading a GIS planning exercise. Participating in a regional GIScooperative, or joining an existing one, will provide access to GIS technical expertise andspatial data created by other agencies. Additionally, if one is a partner in a larger group,

Manager's Overview 3
the activities directed toward the evaluation and selection of the GIS hardware andsoftware may not need to be completed. One would simply use the same GIS system inuse by the larger agency or group. Only the activities aimed at defining applications (uses)and identifying the needed data would need to be done by the smaller unit of government.In such a situation, the larger unit of government assumes the leadership role for the area-wide GIS and should have the technical expertise to assist the smaller unit. In situationswhere a larger effort does not exist, a village or town government may want to look at aGIS installation in a similar village or town elsewhere in the state. Given the similarities inlocal governments within the state, the adoption of the GIS plan of another unit is notunreasonable. That plan should be carefully reviewed by the intended participants in theGIS to ensure applicability. After modifying and validating the plan, a schedule for GIShardware, software and data acquisition can be prepared consistent with availableresources. If a good plan is prepared, there is no reason data acquisition (the mostexpensive part of a GIS) cannot be stretched over a long time period. Significant dataalready is available from state and federal agencies at reasonable costs. These data canform the initial GIS database, with locally generated data added later. A list of state andfederal data sources is contained in the Survey of Available Data Guide.
Content Of This Guide
This guide presents an overview of the GIS development process. This process is presented asasequence of steps conducted in a specific order. Each step is important in itself, butmoreimportantly, information needed to complete subsequent steps is assembled and organized ineachprevious step. The underlying philosophy of the entire series of documents isto concentrate on the GIS data. As well as being the most expensive part of any GIS, thedata must be collected, stored, maintained, and archived under an integrated set of activities inorder to ensure continued availability and utility to the initial users as well as future users,including the general public. Defining and documenting data elements from their initial definitionin the needs assessment through to proper archiving of the GIS database according to staterequirements is the constant theme of these guidelines.
22 GEOGRAPHIC INFORMATION SYSTEMS: DEFINITIONS AND FEATURES
Basic Definition Of A Geographic Information System (GIS)
A geographic information system (GIS) may be defined as "...a computer-basedinformationsystem which attempts to capture, store, manipulate, analyze and display spatiallyreferenced andassociated tabular attribute data, for solving complex research, planning andmanagement problems"(Fischer and Nijkamp, 1992). GISs have taken advantage of rapiddevelopments inmicroprocessor technology over the past several decades to address the specialchallenges of storingand analyzing spatial data. Geographers have referred to GISs assimultaneously providing "...thetelescope, the microscope, the computer and the Xerox machine"for geographic and regionalanalysis (Abler, 1987).

4 GIS Development Guide
Unique Features Of A GIS - Why Planning Process Is Needed
GIS belongs to the class of computer systems that require the building of large databasesbeforethey become useful. Unlike many micro-computer applications where a user can begin useafterthe purchase of the hardware and software, the use of a GIS requires that large spatialdatabasesbe created, appropriate hardware and software be purchased,applications be developed, and allcomponents be installed, integrated and testedbefore users can begin to use the GIS. These tasks are large and complex, so large infact,as to require substantial planning before any data, hardware or software is acquired. Thefocus ofthe GIS Development Guides is to describe the GIS planning process and to provideexamples ofhow to accomplish the recommended planning tasks.
History Of Technology Innovations - GIS Is A Technology Innovation
It is useful to note that GIS is, at present, a technological innovation. The adoption oftechnologicalinnovations (i.e., the development of a GIS for a local government) is not always astraightforwardprocess, such as one might expect with the installation of something that is notnew. Severalproblems are likely to occur such as:
• Staff not fully understanding the technology prior toextensive training• Development time estimates differing from actual task times• Greateruncertainty about costs• A greater likelihood that programmatic changes will be needed duringthe development
phases, etc.
The significant management point here is that these are normalconditions in theadoption of a new technology. Management needs to anticipate that sucheventswill happen, and when they do, take appropriate management actions.
The adoption of computer technology by an organization either GIS or other applications,introduces fundamental change into the organization in its thinking about data. Priorinformationtechnology allowed data to be collected and related to activities and projectsindividually. Organized stores of data were the exception rather than common practice. This ledto duplicate datacollection and storage (as in different departments) and to the possibility oferroneous data existing in one ormore locations. One of the goals of computer systems anddatabase development is to eliminateredundant data collection and storage. The principle is thatdata should be collected only once andthen accessed by all who need it. This not only reducesredundancy; it also allows for more accuratedata and a greater understanding of how the samedata is used by multiple departments. The necessary condition for successful computer system anddatabase development is fordifferent departments and agencies to cooperate in the development ofthe system. A databasebecomes an organization-wide resource and is created and managedaccording to a set of databaseprinciples.

Manager's Overview 5
3 3 ENTERPRISE-WIDE GIS: THE CORPORATE DATABASE
The role of a GIS in a local government setting is more than simply automating a few obvioustasksfor the sake of efficiency. A local government (or several cooperating governments) shouldviewthe GIS project as an opportunity to introduce fundamental change into theway its business isconducted. As with the adoption of management and executiveinformation systems in the businessworld, the adoption of GIS effectively reorganizes the dataand information the government collects,maintains and uses to conduct it affairs. This can, andarguably should, lead to major changes inthe institution, to improve both effectiveness andefficiency of operations.
A key factor in the success of computer system adoption in the business world is the concept ofthe"enterprise" or "corporate" database. As implied by the name, the corporate database is asingle,organization-wide data resource. The advantages of the corporate database arefirst, that all usershave immediate and easy access to up-to-date information and, secondly that theconstruction of thedatabase is done in the most efficient manner possible. Typically, thecorporate database eliminatesredundant collection and storage of information and the keeping ofextra copies of data and extrareference lists by individual users. Here, we are recommending theuse of corporate database concept to integrate GIS data for all units of local governmentparticipating in a cooperative GIS program.
An effective corporate database does require cooperation on the part of all users, both forthecollection and entry of data in the database and in developing applications in a shared datacontext. This may result in some individual applications or uses being less efficient, however theoverallbenefits to the organization can easily outweigh these inefficiencies. Greater emphasismust,however, be placed on maintaining a high quality of data and services to users, mainly tooffset theperceived loss of control that accompanies sharing an individual's data to another part oftheorganization.
The corporate database concept can be used in the governmental situation, for either single unitsofgovernment or between several governmental entities in the same region. The benefitsassociatedwith the corporate database can be achieved if governmental units are willing tocooperate andshare a multi-purpose regional GIS database. Such an arrangement has sometechnicalrequirements; however, establishing the corporate database is much more aquestion of policy , management cooperation and coordination.
44 POLICY ISSUES IN GIS DEVELOPMENT

6 GIS Development Guide
There are several policy issues that need to be addressed early in the GIS planning process:
GIS Project Management
Adequate management attention has already been mentioned in this document. As GIS is stillanevolving new technology, the individuals involved (management, users, GIS staff) may haveverydifferent expectations for the project, some based on general perceptions of computing,which mayor may not be correct. This, along with the long time period for developing the GIS,makes it veryimportant for substantial involvement of management in the project. Several factorsassociated withsuccessful GIS projects are:
• Emphasize advantages of GIS to individual users and entire organization• Require high level of competency by all participants• Ensure high level of management commitment from all management levels in the
organization• Require participation in team building and team participation within & between
departments• Ensure minimum data quality and access for all users• Require development team to set realistic expectations• Minimize time between user needs assessment and availability of useful products.• Develop positive attitude toward change within organization• Ensure level of technology is appropriate for intended uses• Highly visible Pilot Project that is successful
Data Sharing
The sharing of data among government agencies is a virtual necessity for asuccessful, long-term GIS. Not even the most affluent jurisdictionswill be able to justify "going-their-own-way" and not taking advantage of what data areavailable from other sources or notsharing their database with other governmental units. This, then, raises several questions that mustbeconsidered during the planning of the GIS:
• What will be the source for each data item?• How will sharing be arranged? . . purchase? . . license? . . other agreement?• Who will own the data?• How will new GIS data be integrated with existing data files (legacy systems)?• Who will be responsible for updates to the data?• How will the cost of the data (creation and maintenance) be allocated?• Who will provide public access to the data?• Who will be responsible for data archiving and retention? . . of the original? ..of
copies?
These questions do not, at this time, have good answers. Currently, the Freedom ofInformationregulations require that all government data be made available to thepublic at minimal cost (cost ofmaking a copy of the data). No distinction is made onthe basis of the format of the data (eye-readable or digital), the amount of data, or theintended use of data. Thus, the question of sharingthe cost of a GIS database cannotbe addressed in general. If data can be obtained free from

Manager's Overview 7
another agency, why enter into anagreement to pay for it? The answer is, of course, that thecreating agency will not beable to sustain the GIS database under these circumstances. However,at this time , the set of state laws and regulations applicable to GIS data are notadequate to resolvecost issues and to facilitate regional data sharingcooperatives. New legislation willbe required. The New York State Temporary GIS Councildid submitrecommendations on these issues to the Legislature in March 1996. Additionally,theNew York State Archives and Records Administration is currently in the process ofpreparingrecord management and retention schedules suitable for GIS data, both inindividual agencies andfor shared databases. The New York State Office of Real Property Services has been designatedas the GIS representative on the Governor's Task Force for Information Resource Management.One of the charges that has been given to the Task Force is to design a cohesive policy for thecoordination of geographic information systems within New York building on the work of theTemporary GIS Council. Further information should be availablein late-1996 that should clarifythe issues associated with arranging for data sharingamong governments.
55 MANAGEMENT ISSUES IN GIS DEVELOPMENT
Expected Benefits From The GIS
Local government need for, and use of, a GIS falls into several categories: maintainingpublicrecords, responding to public inquiries for information, conductingstudies and makingrecommendations to elected officials (decision-makers), andmanaging public facilities and services(utilities, garbage removal,transportation, etc.). The GIS tasks that meet these uses are:
• Providing regular maps• Conducting spatial queries and displaying the results• Conductingcomplex spatial analyses
Many of these tasks are already done by local government, althoughby manual means. The GISis able to perform these tasks much more efficiently. Some of theanalytical tasks cannot beperformed without a computer due to their size and complexity. In thesecases, the GIS improveslocal government effectiveness by providing better information to plannersand decision-makers.
Benefits from using a GIS fall into the two categories of: efficiency and effectiveness.Existingmanual tasks done more efficiently by the GIS result in a substantial savings of stafftime. In thelocal government context, the largest savings come from answering citizen inquiriesof many types. Depending on the size of the government, savings using the query function ofa GIS can rangefrom 2 person-years for a smaller town, to 5-8 person years for a large town, to10 or more person-years for a large county. Estimates of potential time savings can be derived bymeasuring the timeto respond to a query manually and by GIS and multiplying the difference bythe number ofexpected queries. This information is usually gathered during the NeedsAssessment. Effectivenessbenefits are more difficult to estimate. The GIS may be used toaccomplish several tasks that werenot previously done due to their size and complexity (e.g.,flow analysis in water and sewer systems,traffic analysis, etc.). As these are essentially newtasks, a comparison between manual and GISmethods is not possible. While not measurable, thebenefits from these applications can besubstantial. Generally categorized as better planning,better or more effective decision-making,these applications support more effective

8 GIS Development Guide
investment of government resources in physicalinfrastructure where relatively small performanceimprovements can translate into large dollarsavings. GIS also provides an effective way tocommunicate the problem and solution to the general public and other interested parties
Resources Required To Develop A GIS
Developing a GIS involves investment in five areas: computer hardware,computer software,geographic data, procedures and trained staff. The acquisitionof the computer hardware andsoftware are often incorrectly viewed as the most expensive activityin a GIS program. Research, someconducted at the National Center for Geographic Informationand Analysis at SUNY-Buffalo, hasdemonstrated that developing the geographic database(which includes some of the procedure andstaff costs) can account for 60% to80% of the GIS development costs. Continuing costs foroperation and maintenance arealso dominated by the data costs. Coordination of GIS programs,particularly among several localgovernment agencies, can minimize the cost of databaseconstruction and maintenance, and canprovide for the greatest use of the database, which givesmaximum benefits from the investment.
Staffing Requirements For A GIS
Staffing for a GIS is a critical issue. In general, it is not easily feasible to directly expand thelocalgovernment staff positions to fill the GIS need. There are three areas where expertise isneeded:
• Management of the GIS project (GIS project manager)• GIS database skills (usually called a database administrator)• Application development for database and users (a GIS software analyst)
Initial creation of the GIS database (digitizing) will require an appropriatelysized clerical staff,dependent on the amount of data to be converted. Alternatives to staff expansionareconsultants and data conversion firms. GIS database conversion is a front-end staff needthatcan easily be contracted-out (good quality specifications need to be written for this task). If atallpossible, the three functions of GIS manager, GIS software analyst and GISdatabaseadministrator should be fulfilled by staff personnel, either by hiring or by retrainingexistingprofessionals. When necessary, during the start-up phases of GIS development, the GISanalyst anddatabase administrator functions can be done under consultancy arrangements,PROVIDED THATA FULL-TIME GIS MANAGER IS AVAILABLE ON STAFF.
The second need is for training of users in general computing, database principles, and GIS use.These topics are covered in training courses offered by most GIS vendors, and after theGISsoftware has been selected, they are the best source for user training.
Management Decision Points in the GIS Development Program

Manager's Overview 9
The "decision" to develop a GIS is made incrementally. The information needed to determinethefeasibility and desirability of developing a GIS is not available until several of the planningstepshave been completed. The key decision points are:
• Decision to investigate GIS for the organization - the initial decision to begin theprocess. This is an initial feasibility decision and is based on the likelihood that a GISwill be useful and effective. It is fairly important to identify the major participants atthis point - both departments within agencies and the group of agencies, particularlykey agencies, the agencies who represent a majority of the uses and who willcontribute most of the data.
• Decision to proceed with detailed planning and design of the database - at this time,theapplications, data required, and sources of the data have been identified.Applications can be prioritized and scheduled and the benefits stream determined.Also, applications to be tested during the pilot study and the specific questions to beanswered by the pilot study will have been determined. A preliminary decision willneed to be made as to which GIS software will be used to conduct the pilot study.
• Decision to acquire the GIS hardware and software - this decision follows thepreparation of the detailed database plan, the pilot study and, if conducted, thebenchmark test. This is the first point in the development process where the costs ofthe GIS can reasonably be estimated, the schedule for data conversion developed, andtargets for users to begin use determined.
66 GEOGRAPHIC INFORMATION SYSTEMS: THE DEVELOPMENT CYCLE
Developing a GIS is more than simply buying the appropriate GIS hardware and software.Thesingle most demanding part of the GIS development process is building thedatabase. This tasktakes the longest time, costs the most money, and requires the most effort interms of planning andmanagement. Therefore the GIS development cycle presented hereemphasizes database planning. Most local governments will acquire the GIS hardware andsoftware from a GIS vendor. Choosingthe right GIS for a particular local government involvesmatching the GIS needs to thefunctionality of the commercial GIS. For many agencies,especially smaller local governments, choosing a GIS will require help from larger, moreexperienced agencies, knowledgeable university persons and from qualified consultants. Bycompleting selected tasks outlined in these guidelines local governments can prepare themselves toeffectively interact and use expertise from these other groups.
The GIS development cycle starts with the needs assessment where the GIS functionsandthe geographic data needed are identified. This information is obtained throughinterviewingpotential GIS users. Subsequently, surveys of available hardware, software and dataare conductedand, based in the information obtained, detailed GIS development plans areformulated.
It is important to involve potential users in all stages of GIS development. They benefit fromthisinvolvement in several ways:

10 GIS Development Guide
• Describing their needs to the GIS analysts• Learning what the GISwill be capable of accomplishing for them• Understanding the nature of the GIS developmentcycle - the time involved and the
costs.
Potential users need to understand that there may besignificant time lags betweenthe first steps of Needs Assessment and the time when the GIS canactually beused. Mostly, this is due to the size of the database building task, which can take up toseveralyears in a large jurisdiction.
In addition to understanding that database development takes substantial time, users andmanagersneed to appreciate that GIS is a new technology and its adoption often involves someuncertaintythat can cause time delays, on-going restructuring the development program, and theneed to resolveunforeseen problems. This set of guideline documents describes the GISdevelopment process in away that will minimize problems, time delays, cost overruns, etc.;however, the occurrence of thesesituations cannot be completely avoided. The GIS projectteam and management simply have to beaware that some unforeseen events willhappen. GIS development must be viewed as a process rather than a distinct project.
Estimating and planning for the cost of the GIS is a somewhat difficult task. First, it isnecessaryto recognize that the GIS database will likely be the single most costly item - if a localgovernmentdevelops all of the data itself from maps, etc., this cost can be as much as 70 - 80 %of the totalsystem cost. Thus, acquiring digital data from other GIS systems,government sources or the privatesector can be very cost effective. Participatingin, or organizing a regional data sharing cooperativeor district, can also lead to reduced data costs.When planning for the GIS database, long term datamaintenance and retention costsmust be estimated as well as the initial start-up costs. Cooperation betweenagencieswith similar data needs may provide the most effective way to achieve long-term datamaintenance,retention, and archiving.
77 TASKS FOR GIS DEVELOPMENT AND USE
The GIS development cycle is a set of eleven steps starting with the needs assessment andendingwith on-going use and maintenance of the GIS system. These steps are presented here as alogicalprogression with each step being completed prior to the initiation of the next step. Whilethis viewis logical, it is not the way the world always works. Some of the activities in theprocess mayhappen concurrently, may be approached in a iterative manner, or may need to berestructureddepending on the size and character of the local government conducting the study andthe resourcesavailable to plan for the GIS. The GIS development cycle is based on thephilosophy that one firstdecides what the GIS should do and then as a secondactivity decides on how the GIS will accomplisheach task. Under this philosophy,the needs are described first, available resources are inventoriedsecond (data, hardware, software,staff, financial resources, etc.), preliminary designs are createdand tested as a third major set ofactivities, and lastly the GIS hardware and software are acquiredand the database is built.

Manager's Overview 11
NeedsAssessment
ConceptualDesign
AvailableData Survey
H/W & S/WSurvey
Pilot/Benchmark
DatabasePlanningand Design
DatabaseConstruction
Aquisition ofGIS Hardwareand Software
GIS SystemIntegration
ApplicationDevelopment
GIS Use andDatabaseMaintenance
Figure 1 - GIS Development Process
Figure 1 shows the GIS development cycle, which is described in terms of 11 major activities.Prior to initiating these studies, the responsible staff in local governments should attendintroductory GIS seminars and workshops, GIS conferences, and meetings of specific GIS users'groups, to obtain a broad overview of what GIS is and how others are using these systems.
The 11 steps of the GIS development cycle are:
1. Needs Assessment 2. Conceptual Design of the GIS 3. Survey of Available Data 4. Survey of GIS Hardware and Software 5. Detailed Database Planning and Design 6. Database Construction 7. Pilot Study/Benchmark Test 8. Acquisition of GIS Hardware and Software 9. GIS System Integration10. GIS Application Development11. GIS Use and Maintenance
These tasks are one way of dividing up the entire set of activities that must be accomplished tobuilda successful GIS. While there are other ways of expressing and organizing these activities,thisparticular structure has been chosen because it emphasizes data development - data definition,datamodeling, data documentation, data capture and storage, and data maintenance and retention.

12 GIS Development Guide
Theimportant point to be made here is not the order or structure of the tasks, but rather that, onewayor another, all of these tasks must be completed to have a successful GIS.
In some situations, different methods may be more appropriate than those presented in theseguides,or a different level of detail may fit the particular situation of a unit of local government.Nomatter how simple or complex a given GIS environment is, all of the above tasks shouldbecompleted at an appropriate level of detail. In the specific guides of this set, examples ofdifferentlevels of detail will be provided.
The starting point is the needs assessment. It is assumed that the local government has decidedthata GIS may be justified and it is reasonable to expend the resources to further study theproblem. Afinal assessment of the costs and benefits will not be made until several tasks havebeen completedand the nature and size of the resulting GIS can be estimated. In the processpresented here, thisfinal feasibility assessment is made as part of the detailed database planningand design activity.
Each of the major portions of the development cycle identified and briefly described below isfurtherdescribed in a subsequent guideline document.
Needs Assessment
The GIS needs assessment is designed to produce two critical pieces of information:
• Thelist of GIS functions that will be needed• A master list of geographic data.
These twoinformation sets are extracted from a set of GIS application descriptions, a list ofimportant data,and a description of management processes. Standard forms are used to documentthe results ofuser interviews. The information gained in the needs assessment activity goesdirectly intothe Conceptual GIS Design activity.
Conceptual Design of the GIS System
The conceptual design of the GIS system is primarily an exercise in database design. Itincludesformal modeling (preparation of a data model) of the intended GIS database and the initialstagesof the database planning activity. Database planning is the single most importantactivity inGIS development. It begins with the identification of the needed data and goes onto cover severalother activities collectively termed the data life cycle - identification of data inthe needs assessment,inclusion of the data in the data model, creation of the metadata, collectionand entry of the data into thedatabase, updating and maintenance, and, finally, retention accordingto the appropriate recordretention schedule (Figure 2). A complete data plan facilitates all phasesof data collection,maintenance and retention and as everything is considered in advance, dataissues do not becomemajor problems that must be addressed after the fact with considerabledifficulty and aggravation. Theproduct of the conceptual design activity is a data model whichrigorously defines the GIS databaseand supports the detailed database planning activity.

Manager's Overview 13
Data ObjectsIdentified DuringNeeds Assessment
Preparation ofData Model
Create InitialMetadata
Add RecordRetention Schedulesto Metadata
Archives
Continuing GISDatabase Maintenance
GIS Database
Prepare DetailedDatabase Plan
Match Needed Datato Available Dataand Sources
Source Documents:Maps, Images, AirPhotos, etc.
Survey and Evaluationof Available Data
Map and TabularData Conversion
Database QA/QC Editing
Database Backups
Figure 2 - Life Cycle of a GIS Database

14 GIS Development Guide
The conceptual design of the GIS also includes identification of the basic GIS architecture (typeofhardware and GIS software), estimates of usage (derived from the Needs Assessment), andscopingthe size of the GIS system. All of this is done with reference to the existing dataprocessingenvironments (legacy systems) that must interface with the GIS. This guideline alsoincludes a section on metadata and data standards.
Survey Of Available Data
A survey of available data can commence once needed data have been identified in theNeedsAssessment. This task will inventory and document mapped, tabular and digital datawithin thelocal government as well as data available from other sources, such as federal, state, orother localgovernments and private sector organizations. The entries in this inventory mayinclude other GISsystems within the local area from which some of the needed data may beobtained. If there existsan organized data sharing cooperative or other mechanism forgovernment data sharing, it shouldbe investigated at this time. There also exists the possibilitythat one or more of the commercial GISdatabase developers may be able to supply some of theneeded data and should therefore beinvestigated. The documentation prepared at this point will besufficient to evaluate each potentialdata source for use in the GIS. Information collected at thispoint will also form part of themetadata for the resulting GIS database.
Survey Of Available GIS Hardware And Software
Almost all local government GIS programs will rely on commercially available GIS software.Asa result, a survey of the available GIS systems needs to be conducted. During this activity,the GISfunctionality of each commercial GIS system can be documented for later evaluation.
Detailed Database Design And Planning
The detailed database planning and design task includes the following activities: developingalogical or physical database design based on the data model prepared earlier, evaluating thepotentialdata sources, estimating the quantities of geographic data, estimating the cost of buildingthe GISdatabase and preparing the data conversion plan. Concurrent with the detailed planningfor thedatabase, pilot studies and/or benchmark testing that are desired can be executed.Informationgained from these studies and tests will be needed to estimate the size of theequipment (disk space,main memory etc.) and to determine how much application developmentwill be necessary. Subsequently, plans for staffing, staff training, equipment acquisition andinstallation, and usertraining must be completed. After the preparation of all these plans, theentire cost of the GIS willbe known and the final feasibility assessment can be made.
Pilot Study And Benchmark Tests
Pilot studies and benchmark tests are intended to demonstrate the functionality of the GIS software-simply put, what the commercial GIS from the vendor can do. These tests are useful todemonstrate to potential users andmanagement what the GIS will do for them. Also, performancedata of the GIS system can bedetermined.
Manager's Overview 15
GIS Database Construction
Database construction (sometimes referred to as "database conversion") is the process ofbuildingthe digital database from the source data - maps and tabular fi les. Thisprocess would have beenplanned during the previous activity and the main emphasis here ismanagement of the activity andquality assurance/quality control of the converted data. Theconversion process is often "contracted-out" and involves large quantities of source maps anddocuments. Close and effective managementis the critical factor in successful data conversion.
GIS System Integration
Unlike many other computer applications, a GIS is not a "plug and play" type system. Theseveralcomponents of a GIS must be acquired according to well documented specifications. Thedatabasemust be created in a careful and organized manner. Once all the individualcomponents have beenacquired, they must be integrated and tested. Users must be introduced tothe system, trained asnecessary, and provided with adequate assistance to begin use of the GIS.Parts of the GIS which may appear to work fine individually may not work properly whenputtogether. The GIS system staff must resolve all the problems before users can access the GIS.
GIS Application Development
"Application" is a general term covering all things that "go on" in a GIS. First,there are "databaseapplications." These are all the functions needed to create, edit, build, andmaintain the database,and are usually carried out by the GIS systems staff. Some users may haveresponsibility forupdating selected parts of the GIS database, however the entire database shouldbe under the controlof a "database administrator." Other applications are termed "userapplications." ContemporaryGISs provide many simple applications as part of the initialsoftware package (e.g., map display,query, etc.). More complex applications, or onesunique to a particular user, must be developedusing a macro-programming language.Most GISs have a macro-programming language for thispurpose (e.g., Arc Macro Language(AML) in ARC/INFO™. and Avenue in ArcView™). Theapplications needing development bythe GIS systems staff will have been described during theNeeds Assessment on the GISApplication forms.
GIS System Use And Maintenance
After having described the rather large task of creating a GIS, we can now say that useandmaintenance of the GIS and its database will likely require as much attention as was needed toinitiallybuild it. Most GIS databases are very dynamic, changing almost daily, and users willimmediatelythink of additional applications that they would like to have developed. Formalprocedures forall the maintenance and updating activities need to be created and followed by theGIS system staffand by all users to ensure continued successful operation of the GIS.

16 GIS Development Guide
88 SUMMARY
This document has presented an overview of the GIS development process, with anemphasis ondata and database issues. All of the tasks and issues identified in thisdocument will be describedin detail in the remaining eleven guidelines of this series. Theprocedures are presented as"guides," and not as a "cookbook recipe" which must berigorously followed. Each of the majortasks in the GIS development process and theinformation generated within the task should beaddressed in any specific project. Themethods and forms used in this series can be used, oralternatives can be developed,as appropriate to the situation. The one matter to always keep inmind is that the GISplan is a document to communicate user needs to a GISanalyst. The componentsof the plan must contain:
• Descriptions of applications that are understandable to theuser• A logical translation of user requirements to system specifications• Detailed specification suitable for system development
Following the recommendations in these guidelines cannot, unfortunately, guarantee success.Many of the factors, outside the control of the GIS development team, will affect the ultimatesuccess of the GIS - success being defined as use of the GIS by satisfied users. However, theauthors of these guidelines believe that attempting to develop a GIS without following these, orsimilar procedures, substantially raises the probability of an unsuccessful GIS project - either onethat is not useful or one that substantially exceeds both cost and development time estimates.
Finally, although presented here as an independent activity, GIS development must recognize andinterface with other computer systems in local government, such as E911, police and fire dispatch,facilities management systems, etc. . The GIS must not be viewed as independent of the othersystems, but integrated with them, no matter how difficult, to form a true corporate databasefor local government.

Manager's Overview 17
REFERENCES
1) Fischer, Manfred M. and Nijkamp, Peter, "Geographic Information System, Spatial Modeling,and Policy Evaluation," Berlin & New York: Springer-Verlag, 1993, pg 42.
2) Abler, R.F., 1987, "The National Science Foundation National Center for GeographicInformation and Analysis" International Journal of Geographical Information Systems, 1, no. 4,303-326.
SUGGESTED READINGS
1. Antenucci, John C., et.al., Geographic Information Systems: A Guide to theTechnology, New York: Van Nostrand Reinhold, 1991 (ISBN 0-442-00756-6)
2. Aronoff, Stan, Geographic Information Systems: A Management Perspective,Ottawa: WDL Publications, 1989 (ISBN 0-921804-00-8)
3. Burrough, P.A., Principles of Geographical Information Systems for LandResources Assessment, Oxford: Oxford University Press, 19865. (ISBN 0-19-854563-0);ISBN 0-19-854592-4 paperback).
4. Huxhold, William E., An Introduction to Urban Geographic Information Systems,Oxford: Oxford University Press, 1991 (ISBN 0-19-506534-4)
5. Korte, George B., A Practioner's Guide: The GIS Book, Sante Fe: OnWord Press,1992 (ISBM 0-934605-73-4)
6. Laurini, Robert and Derek Thompson, Fundamentals of Spatial Information Systems,London: Academic Press Limited (ISBN: 0-12-438380-7)
7. Montgomery, Glenn E., and Harold C. Schuck, GIS Data Conversion Handbook, FortCollins: GIS World, Inc. (ISBN 0-9625063-4-6)
GIS INFORMATION SOURCES
Scholarly journalsThere are a number of scholarly journals that deal with GIS. These are published on an on-goingbasis.
Cartographica - Contact: Canadian Cartographic AssociationCartography and Geographic Information Systems - Contact: American Cartographic
AssociationInternational Journal of Geographical Information Systems - Contact: Keith Clark at
CUNY Hunter College, New York CityURISA Journal - Contact: Urban and Regional Information Systems Association

18 GIS Development Guide
Trade magazinesThere are a number of trade magazines that are focused on GIS. They are:
GIS WorldGIS World Inc.155 E. Boardwalk DriveSuite 250, Fort Collins, CO 80525.Phone: 303-223-4848Fax: 303-223-5700Internet: [email protected]
Business GeographicsGIS World, Inc.155 E. Boardwalk Drive, Suite 250Fort Collins, CO 80525.Phone: 303-223-4848Fax: 303-223-5700.Internet: [email protected].
Geo Info SystemsAdvanstar Communications859 Williamette St.Eugene, OR., 97401-6806Phone: 541-343-1200Fax: 541-344-3514Internet:[email protected] site:http://www.advanstar.com/geo/gis
GPS WorldAdvanstar Communications859 Williamette St.Eugene, OR., 97401-6806Phone: 541-343-1200Fax: 541-344-3514Internet:[email protected]
WWWsite:http://www.advanstar.com/geo/gis
Conference Proceedings
American Congress on Surveying and Mapping (ACSM)5410 Grosvenor LaneBethesda, MD, 20814Phone: 301-493-0200Fax: 301-493-8245
American Society for Photogrammetry and Remote Sensing(ASPRS) & (GIS/LIS)5410 Grosvenor LaneBethesda, MD, 20814Phone: 301-493-0290Fax: 301-493-0208
Association of American Geographers (AAG)1710 Sixteenth St. N.W.Washington D.C., 20009-3198Phone: 202-234-1450Fax: 202-234-2744
Automated Mapping/Facility Management International (AM/FM International)14456 East Evans Ave.Aurora, CO, 80014Phone: 303-337-0513Fax: 303-337-1001
Canadian Association of Geographers (CAG)Burnside Hall, McGill UniversityRue Sherbrooke St. WMontreal, Quebec H3A 2K6Phone: 514-398-4946Fax: 514-398-7437
Canadian Institute of Geomatics (CIG)206-1750 rue Courtwood CrescentOttawa, Ontario, K2C 2B5Phone: 613-224-9851Fax: 613-224-9577
Urban And Regional Information Systems Association (URISA)900 Second St. N.E., Suite 304Washington, D.C. 20002Phone: 202-289-1685Fax: 202-842-1850
GlossaryAccuracy - Degree of conformity with a standard, or the degree of correctness attained in a measurement. Accuracy relatesto the quality of a result. If accuracy is relative, the position of a point is defined in relation to another point. It is lessexpensive to build a GIS in the context of relative accuracy. If accuracy is absolute, the position of a point is defined by acoordinate system. Building a GIS in the context of absolute accuracy requires use of the global positioning system.
Accuracy Requirement - statement of how precise the desired results must be to support a particular application.
Adjoin ing Sheets - Maps that are adjacent to one another at the corners and on one or more sides.

20 GIS Development Guide
Aerial - Relating to the air atmosphere, being applicable in a descriptive sense to anything in space above the ground andwithin the atmosphere.
Aerial Photography - The method of taking photographs from an aerial platform (aircraft). (1.) Vertical photography,some times called orthophotography (see entry) is used for photogrammetric mapping and requires a high degree ofaccuracy. (2.) Oblique photography is used for general information, sometimes to verify certain attributes, but does notprovide accurate measurements for photogrammetric mapping.
Aerial Survey - A survey utilizing aerial photography or from remote sensing technology using other bands of theelectromagnetic spectrum such as infrared, gamma or ultraviolet.
Algori thm - A set of instructions; ordered mathematical steps for solving a problem like the instructions in a computerprogram.
Al ignment - Relates to survey data transposed to maps. The correct position of a line or feature in relation to other linesor features. Also the correct placement of points along a straight line.
Alphanumeric - A combination of alphabetic letters, numbers and or special characters. A mailing address is analphanumeric listing.
Analog Data - Data represented in a continuous form, not readable by a computer.
Area - level of spatial measurement referring to a two-dimensional defined space; for example, a polygon on the earth asprojected onto a horizontal plane.
Attribute - 1. A numeric, text, or image data field in a relational data base table that describes a spatial feature such as apoint, line, node, area or cell. 2. A characteristic of a geographic feature described by numbers or characters, typicallystored in tabular format, and linked to the feature by an identifier. For example, attributes of a well (represented by a point)might include depth, pump type, location, and gallons per minute.AM/FM - Automated mapping/facilities management. A GIS designed primarily for engineering and utility purposes,AM/FM is a system that manages databases related to spatially distributed facilities.
Base Data - set of information that provides a baseline orientation for another layer of primary focus, e.g., roads,streams, and other data typically found on USGS topographic and/or planimetric maps.
Base Line - A surveyed line established with more than usual care upon which surveys are based.
Base Map - A map showing planimetric, topographic, geological, political, and/or cadastral information that mayappear in many different types of maps. The base map information is drawn with other types of changing thematicinformation. Base map information may be as simple as major political boundaries, major hydrographic data, or majorroads. The changing thematic information may be bus routes, population distribution, or caribou migration routes.
Base Station - a GPS receiver on a known location that may broadcast and/or collect correction information for GPSreceivers on unknown locations.
Bench Mark - A relatively permanent point whose elevation above or below an adopted datum is known.
Beta Test - Hardware or software testing performed by users in a normal operating environment; follows alpha testing,which is generally done in the developer's facility.
Bezier - (computer graphics) A curve generated by a mathematical formula in CAD (see entry) programs that maintainscontinuity with other Bezier curves.
Binary - The fundamental principal behind digital computers. Binary means two, computer input is converted into binarynumbers made up of O and 1 (see bit).
BIT: (computers) a binary digit with a value of either 1 or 0.
Block (Tax) - A group of municipal tax lots that can be isolated from other parcels by a boundary, usually a roadway,waterway or properly labeled lot line.
Boundary Line - A line along which two areas meet. In specific cases, the word "boundary" is sometimes omitted, as in"state line", sometimes the word "line" is omitted, as in "international boundary", "county boundary", etc. The term

"boundary line" is usually applied to boundaries between political territories, as "state boundary line", between two states.A boundary line between privately owned parcels of land is termed a property line by preference, or if a line of the UnitedStates public land surveys, is given the particular designation of that survey system, as section line, township line, etc.
BPS - Bits per second, the speed of data transfer.
Buffer A zone of a given distance around a physical entity such as a point, line, or polygon.
CAD/CADD - (Computers) Computer-Aided Design/ Computer-Aided Design and Drafting. Any system for Computer-Aided rather than manual drafting and design. Displays data spatially. on a predefined coordinate grid system, allowing datafrom different sources to be connected and referenced by location. Speeds conventional map development process by 1.permitting replication of shapes, floor plans, etc. from an electric library rather than requiring every component to bedrawn from scratch. 2. Plotters and terminal screens are faster and more accurate than manual drafting. 3. Portions ofdrawings can be edited, enlarged, etc. quickly. 4. Related information can be stored in files and added to drawings in layers.
CAD - (Communication) Computer-Aided Dispatching. Used with emergency vehicles, CAD can be very sophisticated.Online maps of a city can display emergency vehicles as moving dots on the map, their status (enroute to an emergency,awaiting a call, call completed, returning to base, etc.) indicated by different colors. (The acronym for computer-aideddispatch is sometimes confused with computer-aided design.)
Cadastre - a record of interests in land, encompassing both the nature and extent of interests. Generally, this means mapsand other descriptions of land parcels as well as the identification of who owns certain legal rights to the land (such asownership, liens, easements, mortgages, and other legal interests). Cadastral information often includes other descriptiveinformation about land parcels.
Cadastral - Relating to the value, extent and ownership of land for tax purposes. Cadastral maps describe and recordownership. Also called property map.
Cadastral Survey - A survey relating to land boundaries and subdivisions, made to create units suitable for transfer or todefine the limitations to title. Derived from "cadastre", and meaning register of the real property of a political subdivisionwith details of area, ownership, and value. The term cadastral survey is now used to designate the surveys for theidentification and resurveys for the restoration of property lines; the term can also be applied properly to correspondingsurveys outside the public lands, although such surveys are usually termed land surveys through preference. See alsoboundary, survey.
Cartographic (Planimetric) Features - Objects like trees or buildings shown on a map or chart.
Cartography - The technology of mapping or charting features of Earth's topography.
Centroid - The "center of gravity" or mathematically exact center of an irregular shaped polygon; often given as an x, ycoordinate of a parcel of land.
Clearinghouse - a physical repository structure used to accumulate and disseminate digital data and informationconcerning that data. In the GIS context a clearinghouse can contain all or a portion of spatial, metadata and informationaldata.
Cl ient - A software application that works on your behalf to extract some service from a server somewhere on the network.Basic idea, think of your telephone as a client and the telephone company as a server.
COGO - Acronym for Coordinate Geometry achieved via a computer program.
Computer-aided Design or Drafting (CAD) - A group of computer software packages for creating graphicdocuments.
Control Point - A point in a network, identifiable in data or a photograph, with a given horizontal position and aknown surface elevation. It is correlated with data in data set or photograph.
Contour - An imaginary outline of points on the ground which are at the same altitude relative to mean sea level.
Contour Line - A line on a map or chart that connects to points which are at the same elevation.
22 GIS Development Guide
Contour Map - A map that defines topography (hypsography) by interpreting contour lines as relief.
Control - Also called ground control. A system of survey marks or objects called control points that have establishedpositions and/or elevations verified by ground survey. The marks, or control points, serve as a reference correlating otherdata such as contour lines (see entry) determined from aerial surveys.
Convers ion - 1. The translation of data from one format to another (e.g., TIGER to DXF; a map to digital files).S 2. Dataconversion when transferring data from one system to another (E.g., SUN to IBM).s
Coordinate - The position of point is space in respect to a Cartesian coordinate system (x, y and/or z values). In GIS, acoordinate often represents locations on the earth's surface relative to other locations.
Coordinate System - The system used to measure horizontal and vertical distances on a planimetric map. In a GIS, it isthe system whose units and characteristics are defined by a map projection. A common coordinate system is used tospatially register geographic data for the same area. See map projection
CRT - Cathode Ray Tube. A computer screen or monitor.
CTG - Center for Technology in Government
Data Capture - series of operations required to encode data in a computer-readable digital form (digitizing, scanning, etc.)
Data Dictionary - description of the information contained in a data base, e.g., format, definition, structure, and usage.It typically describes and defines the data elements of the data base and their interrelationships within the larger context ofthe data base.
Data Element - specific item of information appearing in a set of data, e.g. well site locations.
Data Model 1. A generalized, user-defined view of the data related to applications. 2. A formal method for arranging datato mimic the behavior of the real world entities they represent. Fully developed data models describe data types, integrityrules for the data types, and operations on the data types. Some data models are triangulated irregular networks, images, andgeorelational or relational models for tabular data.
Data Quality - refers to the degree of excellence exhibited by the data in relation to the portrayal of the actual phenomena
Data Sets - a collection of values that all pertain to a single subject.
Data Standardization - the process of achieving agreement on data definitions, representation, and structures to whichall data layers and elements in an organization must conform.
Data Structure - organization of data, particularly the reference linkages among data elements.
Database -usually a computerized file or series of files of information, maps, diagrams, listings, location records,abstracts, or references on a particular subject or subjects organized by data sets and governed by a scheme of organization."Hierarchical" and relational" define two popular structural schemes in use in a GIS. For example, a GIS database includesdata about the spatial location and shape of geographic entities as well as their attributes.
Database Management System (DBMS) - 1. The software for managing and manipulating the whole GIS includingthe graphic and tabular data. 2. Often used to describe the software for managing (e.g., input, verify, store, retrieve, query,and manipulate) the tabular information. Many GlSs use a DBMS made by another software vendor, and the GIS interfaceswith that software.
Datum - a mathematical reference framework for geodetic coordinates defined by the latitude and longitude of an initialpoint, the azimuth of a line from this point, and the parameters of theellipsoid upon which the initial point is located.
DEC - Department of Environmental Conservation
Differential Correction - the method (usually done through post processing) of using two GPS receivers, one on aknown location and one on an unknown location, using information from the one on the known location to correct theposition of the unknown location.
Digital Accuracy - refers to the accuracy of digital spatial data capture.

Digital Elevation Model (DEM) - a file with terrain elevations recorded at the intersections of a fine grid andorganized by quadrangle to be the digital equivalent of the elevation data on a topographic base map.
Digital Data - a form of representation in which distinct objects, or digits, are used to stand for something in the realworld--temperature or time--so that counting and other operations can be performed precisely. Data represented digitally canbe manipulated to produce a calculation, a sort, or some other computation. In digital electronic computers, two electricalstates correspond to the Is and Os of binary numbers, which are manipulated by computer programs.
Digital Exchange Format (DXF) 1. ASCII text files defined by Autodesk, Inc. (Sausalito, CA) at first for CAD, nowshowing up in third-party GIS software . 5 2. An intermediate file format for exchanging data from one software package toanother, neither of which has a direct translation for the other but where both can read and convert DXF data files into theirformat. This often saves time and preserves accuracy of the data by not reautomating the original.
Digi ta l Line Graph (DLG) 1. In reference to data, the geographic and tabular data files obtained from the USGS forexchange of cartographic and associated tabular data files. Many non-DLG data may be formatted in DLG format. 2. Inreference to data, the formal standards developed and published by the USGS for exchange of cartographic and associatedtabular data files. Many non-DLG data may be formatted in DLG format.
Digital Map - A machine-readable representation of a geographic phenomenon stored for display or analysis by a digitalcomputer; contrast with analog map.
Digital Orthophoto - A geographically correct digital image with the same accuracy as a vector digital map, butpreserving the information content of the original photography.
Digital Orthophoto Quarter-Quad (DOQ) - a 3.75 minute square distortion free image of the surface of the earth. Theimagery has been geographically and photographically rectified to remove all distortion, and meet requirements of theUSGS.
Digital Terrain Model (DTM) - A computer graphics software technique for converting point elevation data into aterrain model displaced as a contour map, sometimes as a three-dimensional "hill and valley" grid view of the groundsurface.
Dig i t i ze - A means of converting or encoding map data that are represented in analog form into digital information of xand y coordinates.
Digitized Terrain Data - Transposed elevation information from maps or photographs to X-Y-Z digital coordinates forstorage on magnetic media.
Digi t izer - A device used to capture planar coordinate data, usually as x and y coordinates, from existing analogmaps fordigital use within a computerized program such as a GIS; Also called a digitizing table.
D i g i t i z i n g - refers to the process of manually converting an analog image or map or other graphic overlay into numericalformat for use by a computer with the use of a digitizing table or tablet and tracing the input data with a cursor (see alsoscanning).
DIME - Dual Independent Map Encoding Provides vector data such as streets to census data addresses. Superseded byTopologically Integrated Geographic Encoding and Referencing (see TIGER).
DIME File - A geographic base file produced by the U.S. Census Bureau with Dual Independent Map Encoding. Now beingsuperseded by TIGER files (see below).
DLG - See Digital Line Graph
DOB - Division of the Budget
DOQ - See Digital Orthophoto Quarter-quad
DOT - Department of Transportation
DTF - Department of Taxation and Finance
Edge Match - An editing procedure to ensure that all features crossing adjacent map sheets have the same edge locations,attribute descriptions, and feature classes.

24 GIS Development Guide
Federal Information Processing Standards (FIPS) - official source within the federal government forinformation processing standards. They were developed by the Institute for Computer Sciences and Technology, at theNational Institute of Standards and Technology (NIST), formerly the National Bureau of Standards.
Federal Geographic Data Committee (FGDC) - established by the Federal Office of Management and Budget, isresponsible for the coordination of development, use, sharing, and dissemination of surveying, mapping, and relatedspatial data.
Fifth Generation Computer - A computer designed for applications of artificial intelligence (Al). Some elements ofspatial data management, especially the CADD output side, are beginning to integrate Al computing.
FOIL - Freedom of Information Law
Format - 1. The pattern in which data are systematically arranged for use on a computer. 2. A file format is the specificdesign of how information is organized in the file. For example, DLG, DEM, and TIGER are geographic data sets inparticular formats that are available for many parts of the United States 6File Transfer Protocol (FTP) - a standard protocol that defines how to transfer files from one computer to another.
Fortran - A high-level programming language and compiler originally designed to express math formulas. Developed in1954 by IBM it is still the most widely used language for scientific and engineering programming.
GBF/DIME - See Geographic base file/dual independent map encoding
Geocode - The process of identifying a location as one or more x, y coordinates from another location description such asan address. For example, an address for a student can be matched against a TIGER street network to locate the student'shome.
Geodetic Monumentation - a permanent structure that marks the location of a point taking into account the earth'scurvature.
Geographic - Pertains to the study of the Earth and the locations of living things, humans and their effects.
Geographic Base File/dual Independent Map Encoding (GBF/DIME) - A data exchange format developed bythe US Census Bureau to convey information about block-face/street address ranges related to 1980 census tracts. Thesefiles provide a schematic map of a city's streets, address ranges, and geostatistical codes relating to the Census Bureau'stabular statistical data. See also TIGER, created for the 1990 census.
Geographic Database - Efficiently stored and organized spatial data and possibly related descriptive data.
Geographic Information Retrieval and Analysis (GIRAS) - Data files from the US Geological survey. GIRASfiles contain information for areas in the continental United States, including attributes for land use, land cover, politicalunits, hydrologic units, census and county subdivisions, federal land ownership, and state land ownership. These data setsare available to the public in both analog and digital form.
Geographic Information System (GIS) - An organized collection of computer hardware, software, geographic data,and personnel designed to efficiently capture, store, update, manipulate, analyze, and display all forms of geographicallyreferenced information. Certain complex spatial operations are possible with a GIS that would be very difficult, time-consuming, or impractical otherwise.
Geographic Object - A user-defined geographic phenomenon that can be modeled or represented using geographic datasets. Examples include streets, sewer lines, manhole covers, accidents, lot lines, and parcels.
Geographical Resource Analysis Support System (GRASS) - 1. A public-domain raster GIS modeling productof the US Army Corps of Engineers Construction Engineering Research Laboratory. 2. A raster data format that can be usedas an exchange format between two GlSs.
Georect i fy - the process of referencing points on an image to the real world coordinates.
Georeference - To establish the relationship between page coordinates on a paper map or manuscript and known real-world coordinates

Geospat ia l - a term used to describe a class of data that has a geographic or spatial nature.
Geostat ionary Sate l l i te : An earth satellite that remains in fixed position in sync with the earth's rotation.
GIS - Geographic information system. A computer system of hardware and software that integrates graphics with databasesand allows for display, analysis, and modeling.
Grid-Cell Data - Grid-cell data entry places a uniform grid over a map area, and the area within the cell is labeled withone attribute or characteristic, such as elevation averaged over all points. Grid cells can be layered with differing types ofinformation.
Global Pos i t ion ing System (GPS) - a system developed by the U.S. Department of Defense based on 24 satellitesorbiting the Earth. Inexpensive GPS receivers can accurately determine ones position on the Earth's surface.
Ground Truth - Information collected from a survey area as remote sensing data is being collected from the same area (seecontrol).
Hierarchical - A way of classifying data, starting with the general and going to specific labels.
Hydrography - Topography pertaining to water and drainage feature.
Hypsography - 1 ) The science or art of describing elevations of land surfaces with reference to a datum, usually sea level.2) That part of topography dealing with relief or elevation of terrain.
Image - A graphic representation or description of an object that is typically produced by an optical or electronic device.Common examples include remotely sensed data such as satellite data, scanned data, and photographs. An image is stored asa raster data set of binary or integer values representing the intensity of reflected light, heat, or another range of values onthe electromagnetic spectrum. Remotely sensed images are digital representations of the earth.
Imagery - a two dimensional digital representation of the earth's surface. Examples are a digital aerial photograph, asatellite scene, or an airborne radar scan.Index - A specialized lookup table or structure within a database and used by an RDBMS or GIS to speed searches fortabular or geographic data.
Infrastructure - The fabric of human improvements to natural settings that permits a community, neighborhood, town,city metropolis, region, state, etc., to function.
Init ial Graphics Exchange Specification (IGES) An interim standard format for exchanging graphics Polygondata among computer systems.'
Internet - a system of linked computer networks, worldwide in scope, that facilitates data communication services such asremote login, file transfer, electronic mail, and newsgroups. The Internet is a way of connecting existing computernetworks that greatly extends the reach of each participating system.
Internet Protocol (IP) - the most important of the protocols on which the Internet is based. It allows a packet totraverse multiple networks on the way to its final destination.
Interpolate - Applied to logical contouring by determining vertical distances between given spot elevations.
IT - Information Technology
Land Information System (LIS) - the sum of all the elements that systematically make information about landavailable to users including: the data, products, services, the operating procedures, equipment, software, and people.
Land Information System (LIS) - NJ State 45:8-28(e) - Any computer coded spatial database designed for multi-purpose public use developed from or based on property boundaries.
Latitude - The north-south measurement parallel to the equator.
Layer- A logical set of thematic data, usually organized by subject matter.
Layers - refers to the various "overlays" of data each of which normally deals with one thematic topic. These overlays areregistered to each other by the common coordinate system of the database.
26 GIS Development Guide
Longitude - The angular distance, measured in degrees, cast or west from the Greenwich meridian, or by the difference intime between two reference meridians on a globe or sphere.
Lot Number - A numerical parcel designation, that when combined with a block number is unique to a single parcel ofland within a given municipality.
Manual Digitizing - Conversion of an analog measurement into a digital form by using a manual device such as acalculator.
Map - A representation of a portion of the earth, usually drawn on a flat surface. (From Latin mappa, a napkin, sheet orcloth upon which maps were drawn.)
Map Projection - A mathematical model for converting locations on the earth's surface from spherical to planarcoordinates, allowing flat maps to depict three dimensional features. Some map projections preserve the integrity of shape;others preserve accuracy of area, distance, or direction.
Map Units - The coordinate units in which the geographic data are stored, such as inches, feet, or meters or degrees,minutes and seconds.
Metadata - data describing a GIS database or data set including, but not limited to, a description of a data transfer mediums,format, and contents, source lineage data, and any other applicable data processing algorithms or procedures .
NCGIA - National Center for Geographic Information Analysis
Network Analysis - Addresses relationships between locations on a network. Used to calculate optimal routes, andoptimal locations for facilities.
NSGIC - National States Geographic Information Council
NSDI - National Spatial Data Infrastructure
OPRHP - Office of Parks, Recreation and Historical Preservation
ORPS - Office of Real Property Services
Orthophoto - A photograph of the earth's surface in which geographic distortion has been removed.
Overlay - A layer of data representing one aspect of related information.
Parcel - Generally refers to a piece of land that can be designated by number.
Photogrammetry - The system of gathering information about physical objects through aerial photography andsatellite imagery.
Plane-Coordinate System A system for determining location in which two groups of straight lines intersect at rightangles and have as a point of origin a selected perpendicular intersection.
Planimetric Map - A map which presents the horizontal positions only for the features represented; distinguished from atopographic map by the omission of relief in measurable form. The natural features usually shown on a planimetric mapinclude rivers, lakes and seas; mountains, valleys and plains; and forests, prairies, marshes and deserts. The culture featuresinclude cities, farms, transportation routes and public-utility facilities; and political and private boundary lines. Aplanimetric map intended for special use may present only those features which are essential to the purpose to be served.Plat : A scale diagram void of cultural, drainage and relief features, showing only land boundaries and subdivisions togetherwith data essential to its legal description.
Plotter - Equipment that can plot a graphic file using multiple line weights and colors. Types available today are: pen,laser, and electrostatic plotters.
Point Data - level of spatial definition referring to an object that has no dimension, e.g., well or weather station.
P o i n t s - Items such as oil wells, utility poles, etc. Specific objects with exact location noted.
P o l y g o n - A vector representation of an enclosed region, described by a sequential list of vertices or mathematicalfunctions.

Posit ional Accuracy - term used in evaluating the overall reliability of the positions of cartographic features relativeto their true position.
Prec is ion - refers to the quality of the operation by which the result is obtained, as distinguished from accuracy.
Protoco l - a definition for how computers will perform when talking to each other. Protocol definitions range from howbits are placed on a wire to the format of an electronic mail message. Standard protocols allow computers from differentmanufacturers to communicate; the computers can use completely different software, providing that the programs runningon both ends agree on what the data means.
Quadrangle - A four-sided region, usually bounded by a pair of meridians and a pair of parallels.
Quality Control - process of taking steps to ensure the quality of data or operations is in keeping with standards set forthe system.
Raster - A grid-type data format used to interpret gray-scale photographs and satellite imagery. Imagery is stored as dots orpixels, each with a different shade or density.
Raster Data - Machine-readable data that represent values usually stored for maps or images and organized sequentiallyby rows and columns. Each "cell" must be rectangular but not necessarily square, as with grid data.
RDBMS - See relational database management systems.
Recti f ied - referencing points, lines, and/or features of two dimensional images to real world geographic coordinates, tocorrect distortion in the image.
Rectify - The process by which an image or grid is converted from image coordinates to real-world coordinates.Rectification typically involves rotation and scaling of grid cells, and thus requires resampling of values.
Regis trat ion - the procedure used to bring two maps or data layers into concurrence via known ground location controlpoints or the procedure of bringing a map or data layers into concurrence with the earth's surface.
Relational Database Management System (RDBMS) - A database management system with the ability to accessdata organized in tabular files that may be related together by common field (item). An RDBMS has the capability torecombine the data items from different files, thus providing powerful tools for data usage.
Remote Sensing - Recording imagery or data and information from a distance. Photography is a form of remotesensing. Satellites provide a remote sensing platform for developing geology and soils analysis with sensors sensitive tovarious bands of the electromagnetic spectrum.
Resolut ion - 1. The accuracy at which the location and shape of map features can be depicted for a given map scale. Forexample, at a map scale of 1:63,360 (1 inch=1 mile), it is difficult to represent areas smaller than 1/10 of a mile wide or1/10 of a mile in length because they are only 1/1 0-inch wide or long on the map. In a larger scale map, there is lessreduction, so feature resolution more closely matches real world features. As map scale decreases, resolution also diminishesbecause feature boundaries must be smoothed, simplified, or not shown at all. 2. The size of the smallest feature that can berepresented in a surface. 3. The number of points in x and y in a grid (e.g., the resolution of a USGS one-degree DEM is1.201 x 1.201 mesh points).2
Rubber-sheet - A procedure to adjust the entities of a geographic data set in a non-uniform manner. From- and to-coordinates are used to define the adjustment.
SARA - State Archives and Records Administration
Scale - the relationship between a distance on a map and the corresponding distance on the earth. Often used in the form I:24,000, which means that one unit of measurement on the map equals 24,000 of the same units on the earth's surface.

28 GIS Development Guide
Scanner - A scanner is an optical device that recognizes dark and light dots on a surface and converts this recognitioninto a digital file. However, scanners generally do not create a map database in a logically correct format, so additionalcomputer-aided manipulation and often manual editing are used to add intelligence required by a specific GIS platform.
Scanning - Also referred to as automated digitizing or scan digitizing. A process by which information originally in hardcopy format (paper print, mylar transparencies, microfilm aperture cards) can be rapidly converted to digital raster form(pixels) using optical readers.
Schematic Map - A map prepared by electronically scanning or digitizing in which the lines are not dimensionally orpositionally accurate.
SDTS - Spatial Data Transfer Standard
SED - State Education Department
SEMO - State Emergency Management Office
Server - software that allows a computer to offer a service to another computer. Other computers contact the serverprogram by means of matching client software. Also a computer using server software.
Source Material - data of any type required for the production of mapping, charting, and geodesy products including, butnot limited to, ground-control aerial and terrestrial photographs, sketches, maps, and charts; topographic, hydrographic,hypsographic, magnetic, geodetic, oceanographic, and meteorological information; intelligence documents; and writtenreports pertaining to natural and human-made features.
Spat ia l Data - data pertaining to the location of geographical entities together with their spatial dimensions. Spatialdata are classified as point, line, area, or surface.
Spatial Index - A means of accelerating the drawing, spatial selection, and entity identification by generatinggeographic-based indexes. Usually based on an internal sequential numbering system
Spatial Model - Analytical procedures applied with a GIS. There are three categories of spatial modeling functions thatcan be applied to geographic data objects within a GIS: (1) geometric models (such as calculation of Euclidian distancebetween objects, buffer generation area, and perimeter calculation); (2) coincidence models (such as a polygon overlay); and(3) adjacency models (pathfinding, redistricting, and allocation). All three model categories support operations ongeographic data objects such as points, lines, polygons, TlNs, and grids. Functions are organized in a sequence of steps toderive the desired information for analysis.
Stakeholders - Any constituency in the environment that is affected by an organization's decisions and policies.Standards - In computing, a set of rules or specifications which, taken together, define the architecture of a hardwaredevice, program, or operating system.
State Plane Coordinate System - The plane-rectangular coordinate systems established by the United States Coastand Geodetic Survey (now known as National Ocean Survey), one for each state in the United States, for use in definingpositions of geodetic stations in terms of plane-rectangular (X and Y) coordinates. Each state is covered by one or morezones, over each of which is placed a grid imposed upon a conformal map projection. The relationship between the grid andthe map projection is established by mathematical analysis. Zones of limited east-west dimension and indefinite northsouth extent have the transverse Mercator map projection as the base for the state coordinate system, whereas zones forwhich the above order of magnitude is reversed have the Lambert conformal conic map projection with two standardparallels. For a zone having a width of 158 statute miles, the greatest departure from exact scale (scale error) is 1 part in10,000. Only adjusted positions on the North American datum of 1927 and NAD 1983 may be properly transformed intoplane coordinates on a state system. All such geodetic positions which are determined by the National Ocean Survey aretransformed into state plane-rectangular coordinates on the proper grid, and are distributed by that bureau with the geodetic

positions. State plane coordinates are extensively used in recording land surveys. and in many states such use has receivedapproval by legislative enactment.
SUNY - State University of New York
Sys tem - A group of related or interdependent elements that function as a unit.
Tax Map - An accurate map of a municipal territory prepared for the purpose of taxation. Showing among other things, thelocation and width of streets, roads, avenues and each individual lot of land within the municipality.
Text Data - Information in a GIS system such as property owners' names and lot dimensions.
Thematic Layer - mapping categories, consisting of a single type of data such as population, water quality, or timberstands, intended to be used with base data.
Thematic Map A map that illustrates one subject or topic either quantitatively or qualitatively.
Theme - A collection of logically organized geographic objects defined by the user. Examples include streets, wells,soils, and streams.
TIGER - supersedes DIME (see entry) files.
TIGER - See Topologically Integrated Geographic Encoding and Referencing
Topographic Map - A map of land-source features including drainage lines, roads, landmarks, and usually relief, orelevation.Topologically Integrated Geographic Encoding and Referencing data (TIGER) - A format used by the USCensus Bureau to support census programs and surveys. It is being used for the 1990 census. TIGER files contain streetaddress ranges along lines and census tract/block boundaries. These descriptive data can be used to associate addressinformation and census/demographic data to coverage features.
T o p o l o g y - The spatial relationships between connecting or adjacent coverage features (e.g., arcs, nodes, polygons, andpoints). For example, the topology of an arc includes its from- and to- nodes and its left and right polygons. Topologicalrelationships are built from simple elements into complex elements: points (simplest elements), arcs (sets of connectedpoints), areas (sets of connected arcs), and routes (sets of sections) that are arcs or portions of arcs). Redundant data(coordinates) are eliminated because an arc may represent a linear feature, part of the boundary of an area feature, or both.Topology is useful in GIS because many spatial modeling operations don't require coordinates, only topologicalinformation. For example, to find an optimal path between two points requires a list of which arcs connect to each other andthe cost of traversing along each arc in each direction. Coordinates are only necessary to draw the path after it is calculated .
Transformation - The process of converting data from one coordinate system to another through translation, rotation,and scaling .
Transmiss ion Control Protocol (TCP) - One of the protocols on which the Internet is based.
Vectors - Lines defined by "x", "y" and "z" coordinate endpoints. Roads, rivers, contour lines, etc. presented as vectorlines.
Vector Data - A coordinate-based data structure commonly used to represent map features. Each linear feature isrepresented as a list of ordered x, y coordinates. Attributes are associated with the feature (as opposed to a raster datastructure, which associates attributes with a grid cell). Traditional vector data structures include double-digitized polygonsand arc-node models.
Vector Display : A vector display on a computer screen is produced by drawing vectors on the screen. A raster display, incontrast, is produced on a screen as rows of dots of "on" or "off' which produce the picture.
Wide Area Network (WAN) - a network that uses high-speed, long distance communications networks or satellites toconnect computers over distances greater than those traversed by local area networks (LANs)--about 2 miles.
Workstations and Terminals A workstation is a device or a combination of devices integrated to provide the userwith graphic data entry, display, and manipulation. These devices are used for map digitizing and map-related applications,geographic analysis and ad hoc query. Most systems still use some type of inexpensive edit-query workstations orterminals to provide low-cost access to both maps and related data.
30 GIS Development Guide
GIS DEVELOPMENT GUIDE: NEEDS ASSESSMENT
11 INTRODUCTION
A needs assessment is the first step in implementing a successful GIS within anylocalgovernment. A needs assessment is a systematic look at how departments function and thespatial data needed to do their work. In addition to the final needs assessment report that isgenerated, intangible benefits are realized by an organization. Conducting a GIS needs assessmentfosters cooperation and enhanced communication among departments by working together on acommon technology and new set of tools. Finally, the needs assessment activity itself serves as alearning tool where potential users in each participating department learns about GIS and how itcan serve the department.
A needs assessment is required if the local government will be adopting a GIS throughout theorganization. Without a complete needs assessment each department might proceed to adopt theirown system and database which may or may not be compatible with those of another department.The largest benefit for a local government adopting a GIS is to realize efficiencies from common"base data" and the sharing of data among departments.
At the conclusion of a needs assessment, an organization will have all of the information needed toplan the development of a GIS system. This information can be grouped into the followingcategories:
• Applications to be developed. - In evaluating the responsibilities and work flow within adepartment, certain tasks are identified that can be done more efficiently or effectively in a GIS.These tasks will form the basis of GIS applications. Application descriptions prepared as partof the needs assessment will describe these tasks.
• GIS Functions required. - For each application identified, certain GIS functions will berequired. These will include standard operations such as query and display, spatial analysisfunctions such as routing, overlay analysis, buffering, and possibly advanced analysisrequiring special programming.
• Data needed in the GIS database. - Most departments in local government use data thathas a spatial component. Much of this data are hardcopy maps or tabular data sets that have aspatial identifier such as addresses and zip codes or X-Y values (latitude-longitude, state planecoordinates, or other coordinate system). A needs assessment will identify how thisinformation will be used by GIS applications.
• Data maintenance procedures. - By looking at the work flow and processes within andbetween departments, responsibility for data creation, updates and maintenance will becomeapparent.
Note: The needs assessment procedure refers to a local government and its departments as the organizational units.In a multi-agency GIS cooperative, the same activities described would be carried out by all participants, at theappropriate level of detail as determined by the role each participant would play in the resulting GIS cooperative.

Needs Assessment 31
Once all of this information is collected and analyzed for each department and published in a report,it can be used as a blueprint for implementing the GIS. The GIS coordinating group within theorganization will use it to:
• Design the GIS database• Identify GIS software that will meet the government's needs• Prepare an implementation plan• Start estimating the benefits and costs of a GIS
A common mistake in performing a needs assessment is to simply take an inventory of the mapsand spatial data currently used in each department. There are two major problems with thisapproach. First, this does not allow the GIS coordinating group to evaluate how a GIS could beused to enhance the work of each department and the agency as a whole . By looking at thedepartment functions and what the department does or produces, the GIS coordinating group andpotential users develop an understanding of the role GIS can play in the organization. The existingdata and maps do need to be inventoried and may well be used in building the GIS, however suchan inventory should be separate from the needs assessment.
The second major problem with the "data inventory" approach is that it tends to focus only on datainternal to the organization. Local governments rely heavily on data from outside sources - federalagencies, state agencies, business, etc. The need for these data is better determined by looking atthe potential GIS applications and how data will be used by each application. It can then bedetermined what data should be acquired from other sources.
22 CONDUCTING A NEEDS ASSESSMENT
The most significant aspect of a needs assessment is to document the findings in a standard andstructured manner. It is very important to adopt (or develop) a standard method to be used for thedescription of all the GIS tasks, processes and data that will be included in the needs assessment.These forms will be used in needs assessment to identify the three kinds of GIS requirements:
• GIS applications - these will be tasks that can be performed by the GIS when a userrequires them, such as preparing a map, processing a query, or conducting some particularGIS analysis. GIS applications can be described using the five page GIS Applications formsincluded with this guide as Appendix A.
• GIS activity - these are situations where information needs to be kept on some activity orprocess important to the user, such as issuing building permits, conducting public healthinspections, etc. A GIS activity can be described using pages 1 and 4 of the GIS Applicationsforms - the main application form and the data flow diagraming (DFD) form.
• GIS data - there will be certain categories of spatial data that are important to keep, but whichwill not appear in any GIS application or activity identified in any application description. Aseparate method must be developed to systematically record the need for such data. Other GISdata needed but not included in either of the above categories, can be entered directly into themaster data list.

32 GIS Development Guide
The main method used to collect the information to enter onto the forms is individual interviews.Potential users of the GIS can be identified by management and by examination of the organizationchart. A series of one-on-one interviews is the best way to identify the users needs. During theinterview, the user can usually identify documents that can provide additional information to theGIS analyst.
• The needs assessment activity is composed of two main parts• Interviewing and documenting the needs of potential GIS users• Compiling the results of the needs assessment into the master data list and the list
of GIS functions. These two lists respectively are used to prepare the GIS datamodel and the GIS specifications (activities described under Conceptual Design).
The interview process should identify and describe all anticipated uses of the GIS. The nextsection briefly describes the major categories of GIS use, followed by a detailed description onhow to complete the needs assessment forms.
33 LOCAL GOVERNMENT USES OF GIS
The use of geographic information systems by local government falls into five major categories:
• Browse• Simple display (automated mapping);• Query and display;• Map analysis; and• Spatial modeling.
Browse
This function is equivalent to the human act of reading a map to find particular features or patterns.Browsing usually leads to identification of items of interest and subsequent retrieval andmanipulation by manual means. For single maps, or relatively small areas, the human brain is veryefficient at browsing. However, as data volumes increase, automated methods are required toeffectively extract and use information from the map.
Simple Display
This GIS function is the generation of a map or diagram by computer. Such maps and diagrams areoften simple reproduction of the same maps used in a previous manual orientedGIS environment.Examples of this type of use are preparation of a 1:1000-scale town map, a sketch of an approvedsite plan, maps of census data, etc.

Needs Assessment 33
Query And Display
This function supports the posing of specific questions to a geographic database, with the selectioncriteria usually being geographic in nature. A typical simple query would be: "draw a map of thelocation of all new residential units built during 1989" A more complex query might be: "draw amap of all areas within the town where actual new residential units built in 1989 exceeds growthpredictions." Such a query could be part of a growth management activity within the town. Queriesmay be in the form of regular, often asked questions or may be ad hoc, specific purpose questions.The ability to respond to a variety of questions is one of the most useful features of a GIS in itsearly stages of operation. In the long run, other more sophisticated applications of the GIS mayhave a higher value or benefit, but to achieve these types of benefits, users must be familiar withthe GIS and its capabilities. Such familiarization is achieved through the use of a GIS for thesimpler tasks of query and display.
Map Analysis (Map Overlay)
This involves using the analytical capabilities of GIS to define relationships between layers ofspatial data. Map analysis is the super-imposition of one map upon another to determine thecharacteristics of a particular site (e.g., combining a land use map with a map of flood prone areasto show potential residential areas at risk for flooding). Map analysis (often termed overlay ortopological overlay) was one of the first real uses of GIS. Many government organizations,particularly those managing natural resources, have a need to combine data from different maps(vegetation, land use, soils, geology, ground water, etc.). The overlay function was developed toaccomplish the super-imposition of maps in a computer. The data are represented as polygons, orareas, in the GIS data base, with each type of data recorded on a separate "layer." The combinationof layers is done by calculating the logical intersection of polygons on two or more map layers. Inaddition to combining multiple "layers" of polygon-type data, the map overlay function alsopermits the combination of point data with area data (point-in-polygon). This capability would bevery useful in a town for combining street addresses (from the Assessor's files) with other datasuch as parcel outlines, census tract, environmental areas, etc. Many facility siting problems,location decisions, and land evaluation studies have successfully used this procedure in the past.
Spatial Modeling
This application is the use of spatial models or other numerical analysis methods to calculate avalue of interest. The calculation of flow in a sewer system is an example of spatial modeling.Spatial modeling is the most demanding use of a GIS and provides the greatest benefit. Mostspatial modeling tasks are very difficult to perform by hand and are not usually done unless acomputerized system, such as a GIS, is available. These models allow engineers and planners toevaluate alternate solutions to problems by asking "what if" type questions. A spatial model canpredict the result expected from a decision or set of decisions. The quality of the result is only asgood as the model, but the ability to test solutions before decisions have to be made usuallyprovides very useful information to decision makers. Once again, this type of use of a GIS willevolve over time, as the GIS is implemented and used.
A closely related computer capability is a CAD system (computer aided design). CAD systems areused to prepare detailed drawings and plans for engineering and planning applications. While CADsystems functions are different from GIS functions, many commercial CAD products have some of

34 GIS Development Guide
the functionality normally found in a GIS. There are, however, significant differences between aCAD system and a GIS, mainly in the structure of the data base. There may be some need forCAD-type capabilities in a particular local government, so this forms another category of use.
In general, geographic information in local government is used to:
• Respond to public inquiries,• Perform routine operations such as application reviews and permit approvals, and• Provide information on the larger policy issues requiring action by the town board.
These are typical local government activities which benefit from a geographic information system.The development of GIS will facilitate the present geographic information handling tasks andshould lead to the development of additional applications of benefit to the local government.
There are also other computer systems in local governments that perform GIS-like functions, suchas Emergency 911, underground utility locator systems, school bus routing systems, etc. Thevariety and diversity of GIS applications are what make the definition of a GIS very difficult.Basically, any computer system where the data have one or more spatial identifiers or that performspatial operations can be classed as a GIS. For example, a system containing street addresses andcensus tract codes and that has the ability to place a given street address in the proper census tract isa GIS whether or not map boundaries are part of the system. There are two important points here:
• A large proportion of local government data does have one of more spatial identifiers,and therefore has the potential of being part of a GIS.
• Other, existing systems with GIS data or performing GIS-like functions must beintegrated into the overal system design. GIS should not be developed as a separatesystem.
Whether a local government unit is considering or planning a "full, multi-purpose GIS" or is onlyinterested in a limited or single function system, the database planning and design considerationsare the same. Only the magnitude of the analysis and design activities differ. Some GIS usersbelieve that smaller and simpler applications, such as a school bus routing system, do not require aformal planning activity. There are, however, several reasons to conduct such a planning activityfor the smaller applications:
• To ensure that the user requirements will be fully met
• To develop documentation, especially data documentation (metadata), needed to useand maintain the GIS
• To be in a position to participate in data sharing programs with other agencies asadditional applications are developed
• To create a permanent record of the data and its use to document agency plans anddecisions, and to meet data retention and archiving requirements.
• To use as a base for building a larger, multi-function at some later date.

Needs Assessment 35
The level of effort needed to complete a GIS plan can be kept commensurate with the scope andsize of the intended GIS. Further, the GIS planning software tool that accompanies theseguidelines provides an easy and convenient way to create the recommended documentation.
44 DATA USED BY LOCAL GOVERNMENT
There are many kinds of data used by local government that can be included in a GIS. Data in aGIS can be one of two types: spatial data and non-spatial data. Spatial data is that data which istaken from maps, aerial photographs, satellite imagery, etc. It is composed of spatial entities,relationships between these entities, and attributes describing these entities. Non-spatial data isusually tabular data taken from tables, lists, etc. Most of the time, the non-spatial data will belinked to one or more spatial entities by keys (unique identifiers associated with the spatial data andnon-spatial data). For example, the tax map would represent the spatial data while the real propertyinventory is non-spatial data, which is linked to the entities(parcels) on the tax map.
Spatial data is commonly represented by geometric objects (points, line, and polygons). Non-spatial data containing a spatial reference is also considered spatial data. One of the most commonforms of this type of data in local government are records and files referenced by street address. Examples of local government data that have been used with GIS include:
Tax parcels Land use mapsReal property inventories Zoning mapsInfrastructure data Planimetrics
Water system Right-of-way Sewer system Waterways (streams)
Electric Building OutlinesCensus data Permit records
The operations required in a GIS must meet the data handling requirements of the spatial data aswell as those of the non-spatial data. The most common use of a GIS in local government is thequery based on attribute keys and then displayed in map form.

36 GIS Development Guide
55 DOCUMENTING GIS NEEDS
The GIS needs are documented using the following forms (full-page sized copies of all forms areincluded in Appendix A):
The GIS Application Description (5 pages) used to:• Describe products (mostly map displays) produced by the GIS• Describe activities supported by the GIS
The Master Data List
Most GIS applications can be described using the GIS Application Description. In cases wherethese forms are not appropriate, any other systematic description of the need can be used. If moreappropriate, different forms can be developed as long as the same information can besystematically recorded: the data required and the GIS functions need to develop the GIS product.
GIS Application Description
The set of forms used to document a GIS contains five pages:
Figure 1 - GIS Application Descriptions
Name of Government
Geographic Information SystemRequirements Analysis
GIS Application Description
Application Identification #:Application Name:Department:Defined by:
Type of Application:Display Display/Map Scale:Query Query Key:Query & Display Response Time:Map Analysis Frequency:Spatial Model
Data Required: Features (entities): Attributes:
Prepared by: Approved by: Date:
Purpose and Description:
GIS Application Description (Page A- 1)
Use to enter:- Application identification- Description of purpose- Type of application, map scale, query key, frequency, and required response time- Data needed by the application - Entities (features) - Attributes of entites

Needs Assessment 37
Name of GovernmentGeographic Information System
Requirements Analysis
Map Display
Application Identification #:Application Name:Department:Defined by:
Prepared by: Approved by: Date:
Graphical Output Sample: Screen: Hard Copy:
Symbols/Legend
Map Display (Page A- 2)
Used to draw a sample of any maps to be produced by the application (including the legend showing symbols for each feature). This can be a hand sketch, although it should be drawn to the scale of the output desired.
Name of GovernmentGeographic Information System
Requirements Analysis
Table Display
Application Identification #:Application Name:Department:Defined by:
Prepared by: Approved by: Date:
Report Layout/Format: Screen: Hard Copy:
HEADINGS
SUB-HEADINGS
SUB-TOTALS/TOTALS:
Table Display (Page A- 3)
Used to show samples of any tables to be produced by the application (used only if tables are needed in the application). If any entries in the table involve complex calculations, these should be described using either a Data Flow Diagram (page 4) or other separate pages.

38 GIS Development Guide
Name of GovernmentGeographic Information System
Requirements Analysis
Data Flow Diagram
Application Identification #:Application Name:Department:Defined by:
Prepared by: Approved by: Date:
Process Description: Data Flow Diagram or Flow Chart
Data Flow Diagram (Page A-4)
Used to draw a data flow diagram or flow chart when an application is complex. This chart is usually drawn by the GIS analyst or someone else familiar with the diagraming techniques, and is used to document complex calculations or descriptions of activities that will need GIS support.
Name of GovernmentGeographic Information System
Requirements Analysis
Entity-Relationship Diagram
Application Identification #:Application Name:Department:Defined by:
Prepared by: Approved by: Date:
Data Description: Entity - Relationship Diagram
N
1
1 1
1N
M
Entity-Relationship Diagram (Page A- 5)
Used to draw an entity-relationship (E-R) diagram of the data used in the application. This drawing is usually done by the GIS analyst or someone else familiar with the E-R technique, and is only done for more complex GIS applications.

Needs Assessment 39
66 DOCUMENTING AN ACTIVITY-TYPE USE OF THE GIS
Some GIS applications in local government do not involve the production of maps and tables. Forexample, a GIS may be used to record and store information about a building permit application, asubdivision plat, a site plan, etc. Many activities of local government are simply the processing ofpermits from individuals or firms. If any of these activities will also generate GIS data, they shouldbe described for the needs assessment. Two techniques available for describing processes are flowcharts and data flow diagrams.
A completed application description for a local government activity of this type can be entered onpages 1 and 4 of the GIS Application Description forms. Page 4 - Data Flow Diagram wouldappear as follows:
Data Flow Diagram Example
Zoning Map
TownResident
LocateParcel
DetermineZoning
TownResident
AssessorOffice
PlanningDepartment
LocateParcel
SBL # Index
Tax Map
Figure 2 - Data Flow Diagram Example
This example shows a data flow diagram that has three participants (town resident, planningdepartment, and assessor's department) that uses three parts of the database (zoning map, section-block-lot number index, and tax map), to answer a zoning inquiry. Appendix D contains a briefdescription of the data flow diagraming method.

40 GIS Development Guide
77 THE MASTER DATA LIST
The master data list is a composite of all data entities (features) and their attributes that have beenentered in the data section of the GIS Application Description (Page 1). Other data identified byusers as "needed," but not included in any application description may be entered directly into themaster data list.
Master Data List
Entity Attributes SpatialObject
--------------------------------------------------------------------------------------------------------------------Street_segment name, address_range LineStreet_intersection street_names LineParcel section_block_lot#, Polygon owner_name, owner_address, site_address, area, depth, front_footage, assessed_value, last_sale_date, last_sale_price, size owner_name, owner_address, assessed_value (as of previous January 1st)Building building_ID, date_built, Footprint building_material, building_assessed_valueOccupancy occupant_name, occupant_address, None occupancy_type_codeStreet_segment name, type, width, Polygon length, pavement_typeStreet_intersection length, width Polygon, traffic_flow_conditions, intersecting_streetsWater_main type, size, material, installation_date LineValve type, installation_date NodeHydrant type, installation_date, Node pressure, last_pressure_test_dateService name, address, type, invalid_indicator NoneSoil soil_code, area PolygonWetland wetland_code, area PolygonFloodplain flood_code, area PolygonTraffic_zone zone_ID#, area PolygonCensus_tract tract#, population PolygonWater_District name, ID_number PolygonZoning zoning_code, area PolygonFigure 3 - Master Data List

Needs Assessment 41
88 CONDUCTING INTERVIEWS
Individual interviews are the most effective way of finding out from users their potential GISapplications. Before starting interviews, a briefing session for all potential users should be held.During this meeting, the interviewers should describe the entire needs assessment procedure to allparticipants. The main activities will be:
• Conduct "start-up" seminar or workshop• Interview each potential user• Prepare documentation (forms) for each application, etc• Review each application description with the user• Obtain user approval of and sign-off for each application description
An introductory seminar or workshop with all potential users in attendance is useful to prepare theway for user interviews. At the beginning of a project, many users may not have much knowledgeabout GIS or how it might help them. Also, the interview team may be from outside theorganization and may not be very familiar with the structure of the particular local government.The start-up seminar should address the following topics:
• Definitions: What is a GIS?How is a GIS used by local government? (Typical applications)
• Interview procedure to be followed:What the interviewee will do?What is expected from the interviewee?Who approves the application descriptions?How the information from the application descriptions will be used?
• Group discussion: It is often useful to have the group identify an initial set of GISapplications as candidates for further documentation. The discussion of possibleapplications between interviewers and users will start to reveal what is suitable for aGIS application. One or more applications can be described in the process by the groupso everyone sees how the process will work.
It is preferable to interview users individually rather than in groups. This provides a betteropportunity to explore the ideas of each person and also prevents other individuals fromdominating any particular meeting. Group meetings easily lose focus on specific GIS applicationsand therefore do not provide the detailed information needed to adequately describe the GISapplications.
Conducting an interview is not an easy task. Some potential users may have a good grasp of GISand how they might use one. However, often potential users do not have complete knowledge ofthe capabilities of a GIS and therefore may not be able to readily identify GIS applications. In thesecases, the interviewer (GIS analyst) needs to help the user explore his/her job activities andresponsibilities to identify GIS opportunities. The GIS analyst should usually begin an interviewwith a review of the procedure, then ask the user to identify and describe potential applications.When specific GIS applications cannot be easily identified, it is helpful if potential users describe,in general, his/her job functions and responsibilities and the role their department plays in thewhole organization. From this discussion, the GIS analyst can usually identify potential GISapplications and then explore these for possible inclusion in the needs assessment.

42 GIS Development Guide

Needs Assessment 43
How canI use a GIS?
Need to make a mapNeed to answer a query
Need to saveimportant data
Need to describean activity
Prepare Application Description
Add to Master Data ListPrepare DataFlow Diagram
Name of GovernmentGeographic Information System
Requirements Analysis
Data Flow Diagram
Application Identification #:Application Name:Department:Defined by:
Prepared by: Approved by: Date:
Process Description: Data Flow Diagram or Flow Chart
Name of GovernmentGeographic Information System
Requirements Analysis
GIS Application Description
Application Identification #:Application Name:Department:Defined by:
Type of Application:Display Display/Map Scale:Query Query Key:Query & Display Response Time:Map Analysis Frequency:Spatial Model
Data Required: Features (entities): Attributes:
Prepared by: Approved by: Date:
Purpose and Description:
Master Data List
Entity Attributes SpatialObject
Street_segment name, address_range LineStreet_intersection street,_names LineParcel section_block_lot#, Polygon
owner_name, owner_address,site_address, area, depth, front_footage, assessed_value,last_sale_date, last_sale_price, size (owner_name, owner_address,assessed_value as of previousJanuary 1st)
Building building_ID, date_built, Footprintbuilding_material, building_assessed_value
Occupancy occupant_name, Noneoccupant_address, occupancy_type_code
Street_segment name, type, width, length, Polygonpavement_type
Street_intersection length, width, traffic_flow_conditions Polygonintersecting_streets
Water_main type, size, material, installation_date LineValve type, installation_date NodeHydrant type, installation_date, pressure Node
last_pressure_test_dateService name, address, type, invalid_indicator NoneSoil Soil_code, area PolygonWetland wetland_code, area PolygonFloodplain flood_code, area PolygonTraffic_zone zone_ID#, area PolygonCensus_tract tract#, populationPolygonWater_district name, ID_number PolygonZoning zoning_code, area Polygon

44 GIS Development Guide
Figure 4 - Interviewing and Documenting Needs of a Potential GIS User

Needs Assessment 45
99 PREPARING THE NEEDS ASSESSMENT REPORT
The needs assessment report consists of the application descriptions, the master data list, andseveral summary tables. A list of all applications summarizing the type and frequency of use is thefirst table.
App # Application Name Type Frequency1 Zoning Query Query & Display 85 / day2 Customer Phone Inquiry Query & Display 100/day3 Fire Dispatch Map Query & Display 86/day4 Fire Redistricting Map Map Analysis 1/year5 Crime Summary Map Query & Display 12/month6 Patrol Dispatch Map Query & Display 133/day7 Complaint Summary Map Query & Display 624/year8 Subdivision Development Map Query & Display No estimate9 Counter Query Map Query & Display 85/day10 Land Use/Land Value Map Display 1/year11 Assessed Value Map Query & Display 144/year12 Grievance Map Query & Display 2500/year13 Comparable Value Map Query & Display No estimate14 Built/Vacant Map Display 1/year15 Water and Sewer Line Map Query & Display 30/month16 Hydrologic Profile Map Spatial Model 1440/year17 Sewer System Flow Analysis Spatial Model 12/year18 Emergency Repair Map Query & Display 110/year19 Storm Drainage Map Spatial Model 700/year20 Fire Flow Test Map Spatial Model 260/year21 Easement Map Query & Display 520/year22 Zoning Map Query & Display 50/day23 Floodplain Map Query & Display 50/day24 Youth League Residency Check Query & Display 3500/year25 Mosquito Control Area Map Query & Display 50/year26 Site Plan Approval Process Query & Display 200/year27 Census Data Map Display 48/year28 Population Density Map Map Analysis 50/year29 Land Use Inventory Display 24/year30 Retail Space Projection Spatial Model 24/year31 Office Space Projection Spatial Model 12/year32 Traffic Volume Map Query & Display 24/yearFigure 5 List of GIS Applications
This table contains selected GIS applications from the Town of Amherst, N.Y. Needs Assessment

46 GIS Development Guide
GIS Application by Department by Type
Department Display Query & Display Map Analysis Spatial Model Total
FireDispatch
Police
Assessor
Engineering
Building
Recreation
Highway
Planning
Total
0
0
2
3
2
0
0
10
17
3
4
5
7
2
2
10
12
45
1
0
0
0
0
0
0
3
4
1
0
0
0
0
0
1
3
10
5
4
7
15
4
2
11
28
76
GIS Application by Dept. by Frequency
Department Display Query & Display Map Analysis Spatial Model Total
FireDispatch
Police
Assessor
Engineering
Building
Recreation
Highway
Planning
Total
0
0
2
18
250
0
0
718
988
94,170
49,637
23,894
2,049
25,000
3,520
1,475
2,536
202,281
1
0
0
0
0
0
0
80
81
100
0
0
3,452
0
0
10
40
3,602
94,271
49,637
23,896
5,519
25,250
3,520
1,485
3,374
206,952
Figure 6 - Table Summarizing Applications ExampleThe data from the first table can be used to prepare tables summarizing applications by departmentand the frequency of applications by department.
Numbers in these tables are from the Town of Amherst, N.Y. needs assessment and represent the estimates of GISuse per year. These numbers will be used during the database Planning and Design phase to estimate usage andbenefits, of the GIS. In this example, for the Town of Amherst, it is estimated that 2.5 minutes of staff time will besaved for each query giving a total savings of 4.03 years staff time/year (202,281 times 2.5 minutes divided by 60minutes/hour divided by 2088 hours per year).
The last table relates GIS applications to the data used by each application.Application/Data Item Matrix:
# 1 Leak Detection Map
#2 Customer Service Report
#3 Pressure Test Map
#4 Hydraulic Model Analysis
#5 Work Crew Schedule
Land Parce
ls
RoadsBuil
dings
Water M
ains
Fire H
ydra
nts
Wetla
nd Areas
X X X
X X X
X X X
X
X X X
X
This matrix is very useful in planning and scheduling data conversion. If applications are prioritized, then data needed by high priority applications can be scheduled for conversion early in the conversion process. Also, if some data is not available for some reason, it is possible to determine the affected applications.
Figure 7 - GIS Applications/Data MatrixThe last step in compiling the needs assessment report is to extract the list of GIS functions neededfrom the application descriptions. This list will include the standard function types of display andquery and display plus any other functions included in a data flow diagram or flow chart. Typicalexamples of such GIS functions are: calculate distance between objects, determine the shortest paththrough a network, etc. Figure 8 is an example of a GIS functions list.

Needs Assessment 47
GIS Functions/Procedures List
GIS Functions Needed:
GIS Functions(from Applic. Desc.)
Generic GISFunctions
Candidate GISs
ARC/INFO INTERGRAPH SYSTEM 9
Basic Macro Basic Macro Basic Macro
DISPLAY SCREEN DISPLAY ARCPLOT YES YES
PLOTTER DISPLAY ARCPLOT YES YES
GENERATE REPORT INFO YES YES
QUERY ATTRIBUTE QUERY INFO YES YES
SPATIAL QUERY SPATIAL SEARCH IDENTIFY YES YES
MAP ANALYSIS OVERLAY ARC YES YES
SHORTEST PATH SHORTEST PATH NETWORK NO YES
ROUTE ROUTE NETWORK NO YES
HYDRAULIC AML YES YESMODEL
BUFFER ARC YES YES
RECLASSIFY ARC YES YES
Figure 8 - GIS Function List

48 GIS Development Guide
ApplicationDescription
List ofImportantData
Data FlowDiagram
Name of Government
Geographic Information SystemRequirements Analysis
Data Flow Diagram
Application Identification #:Application Name:Department:Defined by:
Prepared by: Approved by: Date:
Process Description: Data Flow Diagram or Flow Chart
Name of GovernmentGeographic Information System
Requirements Analysis
GIS Application Description
Application Identification #:Application Name:Department:Defined by:
Type of Application:Display Display/Map Scale:Query Query Key:Query & Display Response Time:Map Analysis Frequency:Spatial Model
Data Required:
Features (entities): Attributes:
Prepared by: Approved by: Date:
Purpose and Description:
Master Data List
List of GISFunctions
Master Data List
Entity Attributes SpatialObject
Street_segment name, address_range Line
Street_intersection street,_names LineParcel section_block_lot#, Polygon
owner_name, owner_address,site_address, area, depth, front_footage, assessed_value,last_sale_date, last_sale_price, size (owner_name, owner_address,assessed_value as of previousJanuary 1st)
Building building_ID, date_built, Footprintbuilding_material, building_assessed_value
Occupancy occupant_name, Noneoccupant_address, occupancy_type_code
Street_segment name, type, width, length, Polygonpavement_type
Street_intersection length, width, traffic_flow_conditions Polygonintersecting_streets
Water_main type, size, material, installation_date Line
Valve type, installation_date NodeHydrant type, installation_date, pressure Node
last_pressure_test_dateService name, address, type, invalid_indicator NoneSoil Soil_code, area PolygonWetland wetland_code, area PolygonFloodplain flood_code, area PolygonTraffic_zone zone_ID#, area PolygonCensus_tract tract#, populationPolygonWater_district name, ID_number PolygonZoning zoning_code, area Polygon
Figure 9 - Compiling Results of Needs Assessment ExampleThe list of GIS functions and the master data list will be used in subsequent tasks to design thedatabase and prepare the GIS specifications.

Needs Assessment 49
1 01 0 SUMMARY
The procedure presented in the guideline for preparing a needs assessment is based ondocumenting GIS applications in a standard format. The components of this format are structuredto facilitate communication between potential GIS users and the GIS analyst, and to providespecific and detailed information to the GIS analyst for designing the GIS. The first page of theapplication description is the most critical to the GIS analyst as it contains the list of data and anindication of the GIS functionality required by the application. If additional information on theGIS functionality is needed, than a flow chart or data flow diagram can be developed (page 4 of theapplication description). For the potential user, the map display and report format describe outputhe/she will receive. These pages should be sufficiently detailed for the user to approve or sign-offas to the correctness of the application description. It is, of course, very important that the entireGIS application description be internally consistent.
The entity-relationship diagram (page 5) is mainly useful in the next phase of the GIS design -Conceptual Design, where the data model for the entire system will be defined. If entity-relationship diagrams are prepared for individual applications, they will than be available for theConceptual Design phase. Otherwise, these diagram can be prepared during the Conceptual Designphase.
Figure 9 is a diagrammetric representation of the flow of information from the elements of theapplication description to the master data list and the list of GIS functions.

Appendix Table of Contents
Appendix A - GIS Application Description Forms
GIS Application Description.............................................................A-1Map Display ...................................................................................A-2Table Display..................................................................................A-3Data Flow Diagram .........................................................................A-4Entity-Relationship Diagram.............................................................A-5
Appendix B
Master Data List.............................................................................. B-1
Appendix C - Sample GIS Application Descriptions
Customer Phone Inquiry, Erie County Water Authority...................... C-1Erie County Map Guide, Erie County Public Works Dept.................... C-4Job Training Site Selection, Erie County Social Services Dept.............. C-5
Appendix D
Data Flow Diagraming.....................................................................D-1
Appendix E
List of Application Name, Type, & Frequency ................................... E-1Application Descriptions .................................................................. E-2Master Data List.............................................................................E-17Summary Table of Depts. & Counts of Application Type....................E-21Summary Table of Depts. & Annual Frequencies of Application Type.E-22

Name of GovernmentGeographic Information System
Requirements Analysis
GIS Application Description
Application Identification #:Application Name:Department:Defined by:
Type of Application:Display Display/Map Scale:Query Query Key:Query & Display Response Time:Map Analysis Frequency:Spatial Model
Data Required: Features (entities): Attributes:
Prepared by: Approved by: Date:
Purpose and Description:
A-1

Name of GovernmentGeographic Information System
Requirements Analysis
Map Display
Application Identification #:Application Name:Department:Defined by:
Prepared by: Approved by: Date:
Graphical Output Sample: Screen: Hard Copy:
Symbols/Legend
A-2

Name of GovernmentGeographic Information System
Requirements Analysis
Table Display
Application Identification #:Application Name:Department:Defined by:
Prepared by: Approved by: Date:
Report Layout/Format: Screen: Hard Copy:
HEADINGS
SUB-HEADINGS
SUB-TOTALS/TOTALS:
A-3

Name of GovernmentGeographic Information System
Requirements Analysis
Data Flow Diagram
Application Identification #:Application Name:Department:Defined by:
Prepared by: Approved by: Date:
Process Description: Data Flow Diagram or Flow Chart
A-4

Name of GovernmentGeographic Information System
Requirements Analysis
Entity-Relationship Diagram
Application Identification #:Application Name:Department:Defined by:
Prepared by: Approved by: Date:
Data Description: Entity - Relationship Diagram
N
1
1 1
1N
M
A-5

Master Data List
Entity Attributes SpatialObject
Street_segment name, address_range LineStreet_intersection street,_names LineParcel section_block_lot#, Polygon
owner_name, owner_address,site_address, area, depth, front_footage, assessed_value,last_sale_date, last_sale_price, size (owner_name, owner_address,assessed_value as of previousJanuary 1st)
Building building_ID, date_built, Footprintbuilding_material, building_assessed_value
Occupancy occupant_name, Noneoccupant_address, occupancy_type_code
Street_segment name, type, width, length, Polygonpavement_type
Street_intersection length, width, traffic_flow_conditions Polygonintersecting_streets
Water_main type, size, material, installation_date LineValve type, installation_date NodeHydrant type, installation_date, pressure Node
last_pressure_test_dateService name, address, type, invalid_indicator NoneSoil Soil_code, area PolygonWetland wetland_code, area PolygonFloodplain flood_code, area PolygonTraffic_zone zone_ID#, area PolygonCensus_tract tract#, populationPolygonWater_district name, ID_number PolygonZoning zoning_code, area Polygon
B-1
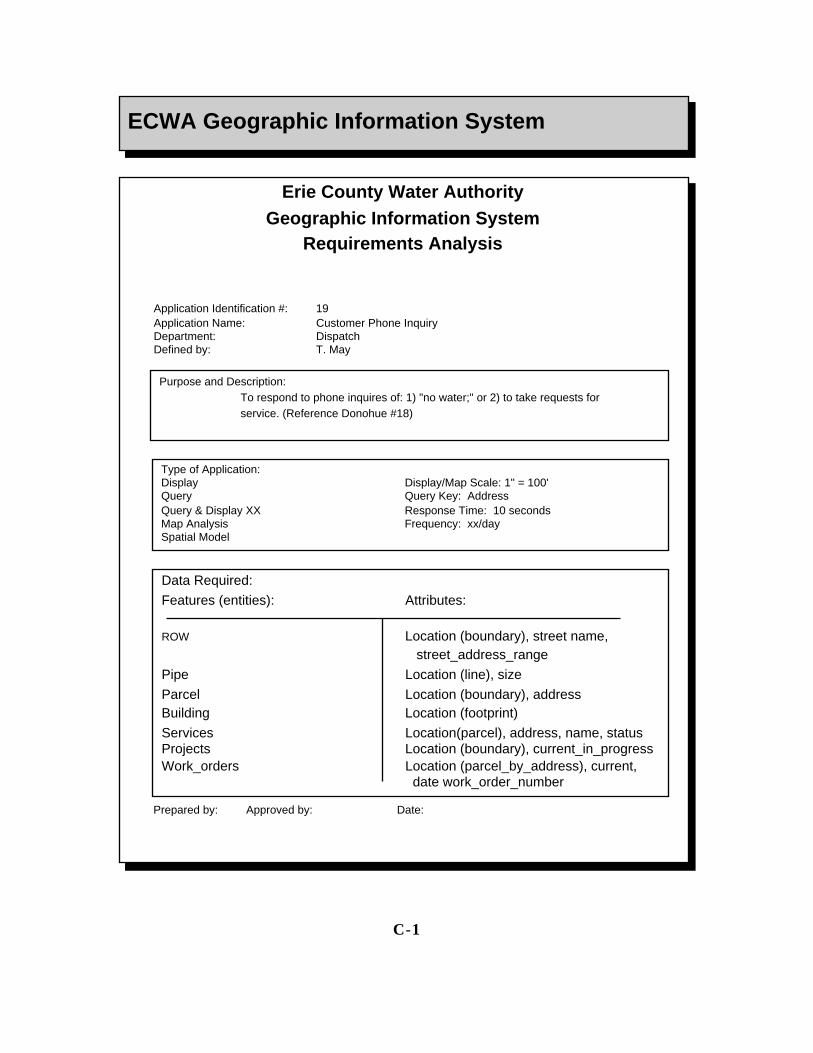
Erie County Water AuthorityGeographic Information System
Requirements Analysis
ECWA Geographic Information System
Application Identification #: 19Application Name: Customer Phone InquiryDepartment: Dispatch Defined by: T. May
Type of Application:Display Display/Map Scale: 1" = 100'Query Query Key: AddressQuery & Display XX Response Time: 10 secondsMap Analysis Frequency: xx/daySpatial Model
Data Required:
Features (entities): Attributes:
ROW Location (boundary), street name, street_address_range
Pipe Location (line), size
Parcel Location (boundary), addressBuilding Location (footprint)
Services Location(parcel), address, name, statusProjects Location (boundary), current_in_progressWork_orders Location (parcel_by_address), current,
date work_order_number
Prepared by: Approved by: Date:
Purpose and Description:To respond to phone inquires of: 1) "no water;" or 2) to take requests forservice. (Reference Donohue #18)
C-1

Erie County Water AuthorityGeographic Information System
Requirements Analysis
ECWA Geographic Information System
Application Identification #: 19 Application Name: Customer Phone InquiryDepartment: DispatchDefined by: T. May
Prepared by: Approved by: Date:
Graphical Output Sample: Screen: XX Hard Copy:
Symbols/Legend
30 31 1 2 3 4 5 6 7
8
7
6
5
4
3
41
40
39
42 43 44
18
BuildingParcel Water Main
ROW Service Connection
51 ST AVE
Map
le R
oad
C-2

Erie County Water AuthorityGeographic Information System
Requirements Analysis
ECWA Geographic Information System
Application Identification #: 19Application Name: Customer Phone InquiryDepartment: DispatchDefined by: T. May
Prepared by: Approved by: Date:
Report Layout/Format: Screen: XX Hard Copy:
Customer Service Inquiry
Name Address Status Pipe Size Project Work Order
J.J. Jones 1551 51st Ave. Active 4 in. None None
C-3

County of ErieGeographic Information System
Requirements Analysis
Erie County Geographic Information System
Application Identification #: 1Application Name: Erie County Map GuideDepartment: Public WorksDefined by: Roger Fik
Type of Application:Display X Display/Map Scale: 1"=2 milesQuery Query Key: N/AQuery & Display Response Time: 5 to 10 minutesMap Analysis Frequency: Yearly publicationSpatial Model
Data Required: Features (entities): Attributes:County Boundary Location, Name (line)Townships Location, Name (Polygon)Cities Location, Name (Polygon)Villages Location, Name (Polygon)Communities Location, Identifier (Node)County Roads Location, Name (Line)City, Town, & Village Roads Location, Name (Line)State Highways Location, Name (Line)Interstate, State Thruway, & Expressways Location, Name (Line)Interstate Route Numbers Route Identifier, LocationState Route Numbers Route Identifier, LocationUS Route Numbers Route Identifier, LocationReservations Location, Name (Polygon)State Parks Location, Name (Polygon)County Parks Location, Name (Polygon)County Forests Location, Name (Polygon)Streams, Rivers, & Creeks Location, Name (Line)Water Bodies Location, Name (PolygonAirports Location, Name (Node)County Jurisdiction Designation Location, Name (Node)
Prepared by J. Volpe: Approved by: Date: 3/15/94
Purpose and Description:To provide a general multi-purpose map of Erie County for public use.
C-4

County of ErieGeographic Information System
Requirements Analysis
Erie County Geographic Information Systems
Application Identification #: 48Application Name: Job Training Site LocationDepartment: Social ServicesDefined by: Jeff Embury (C/O Jim Kubacki)
Type of Application:Display Display/Map Scale: MultipleQuery Query Key: Trainee AddressQuery & Display X Response Time: < 1 MinuteMap Analysis Frequency: DailySpatial Model
Data Required: Features (entities): Attributes:
ROADS XY_Location, Name, Address_Range
TRAINEE Trainee_Address, Trainee_Name
TRAINING SITE Site_Name, Site_Address, Site_Phone #
SUBWAY XY_Location, Subway_Stop_Name,Subway_Stop_Location
BUS ROUTES XY_Location, Busroute_Number,Bus_Stop_Name, Bus_Stop_Location
Prepared by: Approved by: Date:
Purpose and Description: To provide trainees with an adequate training site whileminimizing the distance they must travel to reach that site.
C-5

County of ErieGeographic Information System
Requirements Analysis
Erie County Geographic Information System
Application Identification #: 48Application Name: Job Training Site LocationDepartment: Social ServicesDefined by: Jeff Embury/Jim Kubacki
Prepared by: Eric Covino Approved by: Date: 5/5/94
Graphical Output Sample: Screen: X Hard Copy:
Symbols/LegendTrainee Job Training Site Road Bus Subway
C-6

Name of GovernmentGeographic Information System
Requirements Analysis
Data Flow Diagram
Application Identification #: 48Application Name: Job Training Site LocationDepartment: Social ServicesDefined by: Jeff Embury (C/O JimKubacki)
Prepared by: Approved by: Date:
Process Description: Data Flow Diagram or Flow ChartStart
Dept. of Social Services
QueryTraineeAddress
OverlayTrainingSites
ChooseTrainingSite
File of Trainee Placement
C-7

Name of GovernmentGeographic Information System
Requirements Analysis
Data Flow Diagram
Application Identification #: 48Application Name: Job Training Site LocationDepartment: Social ServicesDefined by: Jeff Embury (C/O Jim Kubacki)
Prepared by: Approved by: Date:
Process Description: Data Flow Diagram or Flow Chart
Bus Stop NamesBus Route No.
Bus Stop Coordinates
XY Location
Point
TRAINEE
Line
SUBWAY
Line
ROAD
T
T
Line
BUS ROUTE
T C
Point
JOB SITE
T C
T C
C
C
On
On
XY Location
Name
Address Range
XY Location
Subway Stop Name Subway Stop Coordinates
AddressMatch
AddressMatch
Site Address Site Address
Site Phone #
Trainee Name
Trainee Address
C-8

Data Flow Diagraming
A square represents people, organizations, things,or sources or destinations of data or information
A cylindrical shape to represent a process or activity
An open rectangle to represent a data stored fromwhich data can be added or removed
An arrow to represent data flows. Arrow can beannotated as necessary to describe nature or content flow.
Data flow diagrams offer a standardized method of portraying processes, data stores, andparticipants that make up a logical activity potential GIS application). Four symbols are usedin a data flow diagram:
D-1

List of Application Name, Type, and Frequency
Appl# Application Name Type Frequency11 Subdivision Development Map Query & Display 1 per month12 Counter Query Map Query 50 per day13 Land Use/Land Value Map Display 1 per year14 Assessed Value Map Query & Display 3 per year15 Grievance Map Query & Display 1650 per year16 Comparable Property Map Query & Display 1 per month17 Built/Vacant Map Display 1 per year19 Sanitary Sewer Line Map Query & Display 2 per week28 Public Improvement Map Query & Display 10 per week29 Total Committed Flow Map Spatial Model 20 per week36 Storm Sewer Map Display 10 per day37 Youth League and Residency Check Map Query 1500 per year41 Optimal Snow Removal Route Map Spatial Model 10 per month63 Population Density Map Browse 50 per year70 Population Projection Spatial Model 4 per year
E-1

Geographic Information SystemRequirements Analysis
Application Identification #: 11
Application Name: Subdivision Development Map
Department: Assessor
Defined by: H. Williams
Purpose and Description:
To monitor the progress of development of an approved subdivision (how many lots are built andthe rate of the building).
Type of Application: Display/Map Scale: 100;200;400 Query & Display Response Time:
Frequency: 1 per month
Data Required:Feature Spatial Object
AttributeParcel Polygon
locationStreet (double line) Polygon
namelocation
Subdivision Polygonnamelocation
Prepared by: Approved by: Date: 03-June-96
E-2

Geographic Information SystemRequirements Analysis
Application Identification #: 12
Application Name: Counter Query Map
Department: Assessor
Defined by: H. Williams
Purpose and Description:
To provide a quick query of one or more parcels and the associated parcel data (mostly ARLM filedata) for answering inquiries at the counter or over the telephone.
Type of Application: Display/Map Scale: 50;100;200;400 Query Response Time:
Frequency: 1 per month
Data Required:Feature Spatial Object
AttributeBuilding Polygon
assessed valuebuilding #
Parcel Polygonsubdivision lotSBL #location
Street (center line) Linelengthaddress rangenamelocation
Prepared by: Approved by: Date: 03-June-96
E-3

Geographic Information SystemRequirements Analysis
Application Identification #: 13
Application Name: Land Use/Land Value Map
Department: Assessor
Defined by: H. Williams
Purpose and Description:
To produce a display of the value of land per square foot and/or front footage by land use type.
Type of Application: Display/Map Scale: 200;400 Display Response Time: 1 week
Frequency: 1 per year
Data Required:Feature Spatial Object
AttributeParcel Polygon
depthfront footagesizelast sale priceland use codelocation
Street (center line) Linenamelocation
Prepared by: Approved by: Date: 03-June-96
E-4

Geographic Information SystemRequirements Analysis
Application Identification #: 14
Application Name: Assessed Value Map
Department: Assessor
Defined by: H. Williams
Purpose and Description:
To produce a map showing the assessed values (by range) for a small area; or for designatedneighborhoods.
Type of Application: Display/Map Scale: 400 Query & Display Response Time: Interactive
Frequency: 3 per year
Data Required:Feature Spatial Object
AttributeNeighborhood Polygon
namelocation
Parcel Polygonassessed valuelocation
Street (double line) Polygonnamelocation
Prepared by: Approved by: Date: 03-June-96
E-5
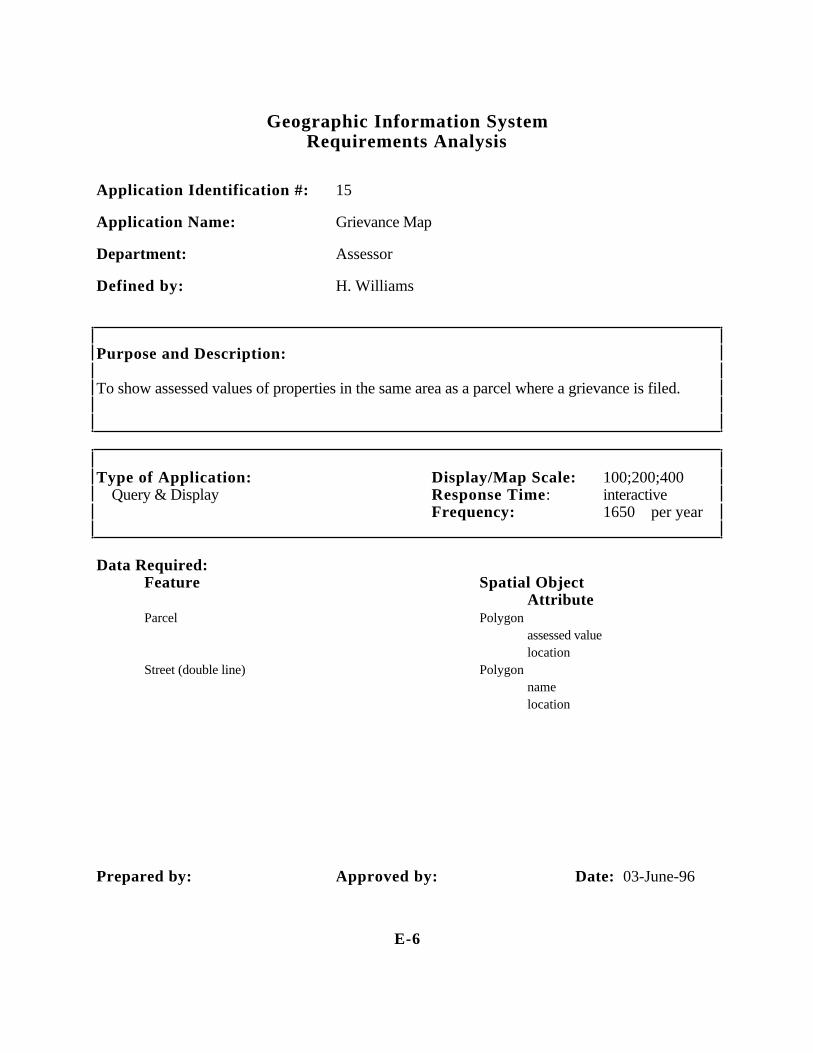
Geographic Information SystemRequirements Analysis
Application Identification #: 15
Application Name: Grievance Map
Department: Assessor
Defined by: H. Williams
Purpose and Description:
To show assessed values of properties in the same area as a parcel where a grievance is filed.
Type of Application: Display/Map Scale: 100;200;400 Query & Display Response Time: interactive
Frequency: 1650 per year
Data Required:Feature Spatial Object
AttributeParcel Polygon
assessed valuelocation
Street (double line) Polygonnamelocation
Prepared by: Approved by: Date: 03-June-96
E-6

Geographic Information SystemRequirements Analysis
Application Identification #: 16
Application Name: Comparable Property Map
Department: Assessor
Defined by: H. Williams
Purpose and Description:
Show the comparable properties selected to determine the assessed value of a given property.
Type of Application: Display/Map Scale: 100;200;400 Query & Display Response Time:
Frequency: 1 per month
Data Required:Feature Spatial Object
AttributeParcel Polygon
addressassessed valuelocation
Street (double line) Polygonnamelocation
Prepared by: Approved by: Date: 03-June-96
E-7

Geographic Information SystemRequirements Analysis
Application Identification #: 17
Application Name: Built/Vacant Map
Department: Assessor
Defined by: H. Williams
Purpose and Description:
To display the built and vacant parcels
Type of Application: Display/Map Scale: 400 Display Response Time: Interactive
Frequency: 1 per year
Data Required:Feature Spatial Object
AttributeOccupancy Node
occupant type codeoccupant addressOccupant name
Parcel Polygonbuilt/vacant codelocation
Street (double line) Polygonnamelocation
Prepared by: Approved by: Date: 03-June-96
E-8

Geographic Information SystemRequirements Analysis
Application Identification #: 19
Application Name: Sanitary Sewer Line Map
Department: Assessor
Defined by: H. Williams
Purpose and Description:
To show the location of sanitary sewer lines for the purpose of approving digging activities.
Type of Application: Display/Map Scale: 50;1000 Query & Display Response Time: 5 min.
Frequency: 2 per week
Data Required:Feature Spatial Object
AttributeBuilding footprint Polygon
business namebuilding nameaddress
Manhole Nodedepthlocation
Sanitary sewer line Linelocation
Sidewalk Linelocation
Storm sewer line Linelocation
Street (double line) Polygonnamelocationaddress range
Wye hook ups (new only) Nodedistance from manholeslocation
Prepared by: Approved by: Date: 03-June-96
E-9
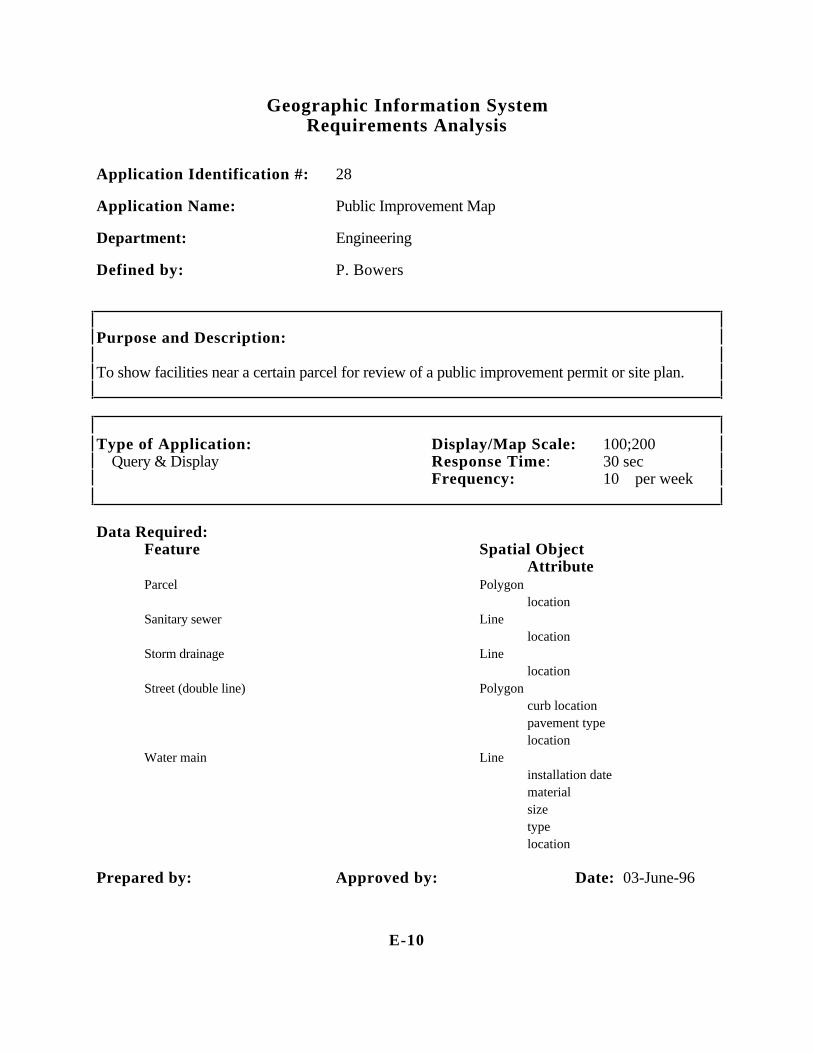
Geographic Information SystemRequirements Analysis
Application Identification #: 28
Application Name: Public Improvement Map
Department: Engineering
Defined by: P. Bowers
Purpose and Description:
To show facilities near a certain parcel for review of a public improvement permit or site plan.
Type of Application: Display/Map Scale: 100;200 Query & Display Response Time: 30 sec
Frequency: 10 per week
Data Required:Feature Spatial Object
AttributeParcel Polygon
locationSanitary sewer Line
locationStorm drainage Line
locationStreet (double line) Polygon
curb locationpavement typelocation
Water main Lineinstallation datematerialsizetypelocation
Prepared by: Approved by: Date: 03-June-96
E-10

Geographic Information SystemRequirements Analysis
Application Identification #: 29
Application Name: Total Committed Flow Map
Department: Engineer
Defined by: P. Bowers
Purpose and Description:
To keep track of the total committed flow of sanitary and storm sewers.
Type of Application: Display/Map Scale: 1000 Spatial Model Response Time: 1 min
Frequency: 20 per week
Data Required:Feature Spatial Object
AttributeDetention pond Polygon
capacitysizelocation
Ditches Polygoncapacitysizelocation
Monitoring point Nodelocation
Sanitary sewer line Linecapacitysizelocation
Storm sewer line Linecapacitysizelocation
Street (center line) Linelocation
Prepared by: Approved by: Date: 03-June-96
E-11

Geographic Information SystemRequirements Analysis
Application Identification #: 36
Application Name: Storm Sewer Map
Department: Building Department
Defined by: T. Ketchum
Purpose and Description:
To display the location of storm sewers.
Type of Application: Display/Map Scale: 100;200 Display Response Time: 12 sec
Frequency: 10 per day
Data Required:Feature Spatial Object
AttributeContours Line
locationelevation
Easement Polygonlocationtype
Manhole Nodelocationinvert elevationrim/surface elevation
Parcel Polygonlocation
Storm sewer line Linelocation
Street (double line) Polygonnamelocation
Prepared by: Approved by: Date: 03-June-96
E-12

Geographic Information SystemRequirements Analysis
Application Identification #: 37
Application Name: Youth League and Residency Check Map
Department: Recreation Department
Defined by: J. Bloom
Purpose and Description:
To determine the appropriate league for a resident (by parcel) and discover non-residentapplications.
Type of Application: Display/Map Scale: 1000 Query Response Time: 30 sec
Frequency: 1500 per year
Data Required:Feature Spatial Object
AttributeLeague Polygon
typelocation
Parcel Polygonowner addressowner nameland useaddresslocation
Prepared by: Approved by: Date: 03-June-96
E-13

Geographic Information SystemRequirements Analysis
Application Identification #: 41
Application Name: Optimal Snow Removal Route Map
Department: Highway Department
Defined by: F. Jurgens
Purpose and Description:
To calculate the most efficient routes for snow removal and salting.
Type of Application: Display/Map Scale: 1000 Spatial Model Response Time: 1 week
Frequency: 10 per month
Data Required:Feature Spatial Object
AttributeStreet (center line) Line
lengthclasswidthlocation
Street intersections Nodetraffic flow conditionsstreet names
Traffic zone Polygonareazone code
Prepared by: Approved by: Date: 03-June-96
E-14
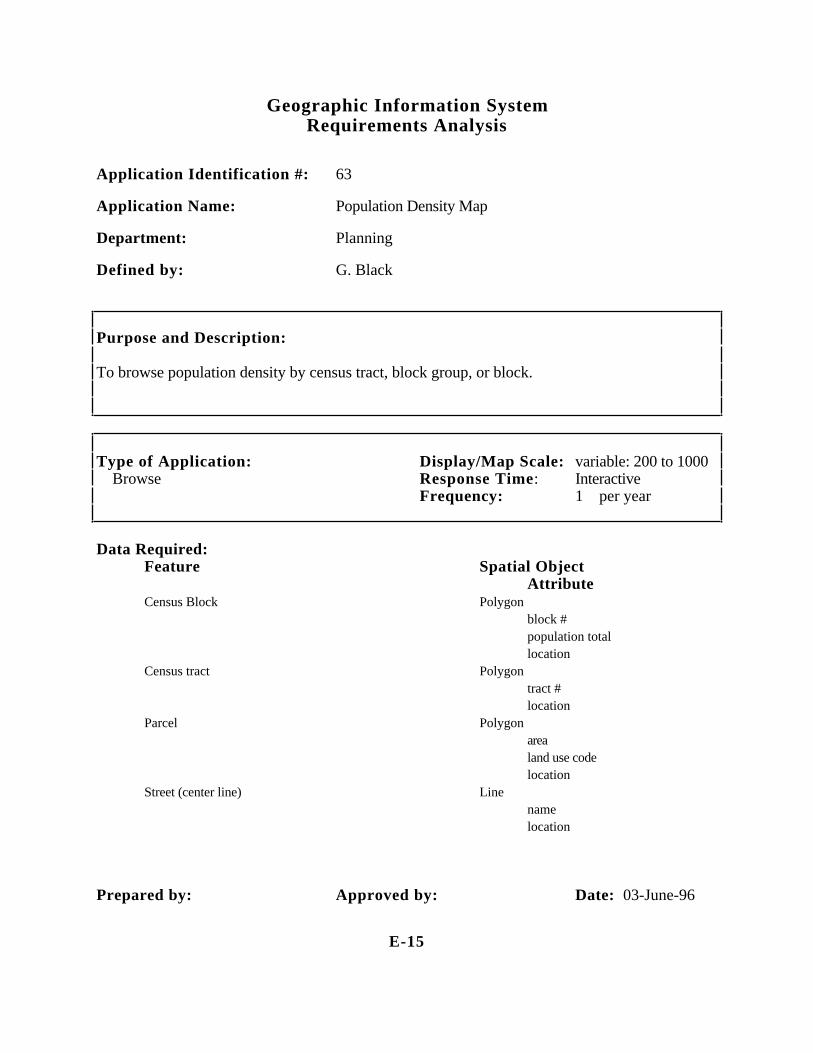
Geographic Information SystemRequirements Analysis
Application Identification #: 63
Application Name: Population Density Map
Department: Planning
Defined by: G. Black
Purpose and Description:
To browse population density by census tract, block group, or block.
Type of Application: Display/Map Scale: variable: 200 to 1000 Browse Response Time: Interactive
Frequency: 1 per year
Data Required:Feature Spatial Object
AttributeCensus Block Polygon
block #population totallocation
Census tract Polygontract #location
Parcel Polygonarealand use codelocation
Street (center line) Linenamelocation
Prepared by: Approved by: Date: 03-June-96
E-15

Geographic Information SystemRequirements Analysis
Application Identification #: 70
Application Name: Population Projection
Department: Planning
Defined by: C. Brown
Purpose and Description:
To estimate future population of the Town, by small area (census tract, block group, and possiblyblock).
Type of Application: Display/Map Scale: 1000 Spatial Model Response Time: 1 day
Frequency: 4 per year
Data Required:Feature Spatial Object
AttributeCensus Block Polygon
block #sizelocation
Census tract Polygontract #sizelocation
Net migration Noneapplication #69
Wetland Polygonareawetland code
Zoning Polygonareazoning code
Prepared by: Approved by: Date: 03-June-96
E-16
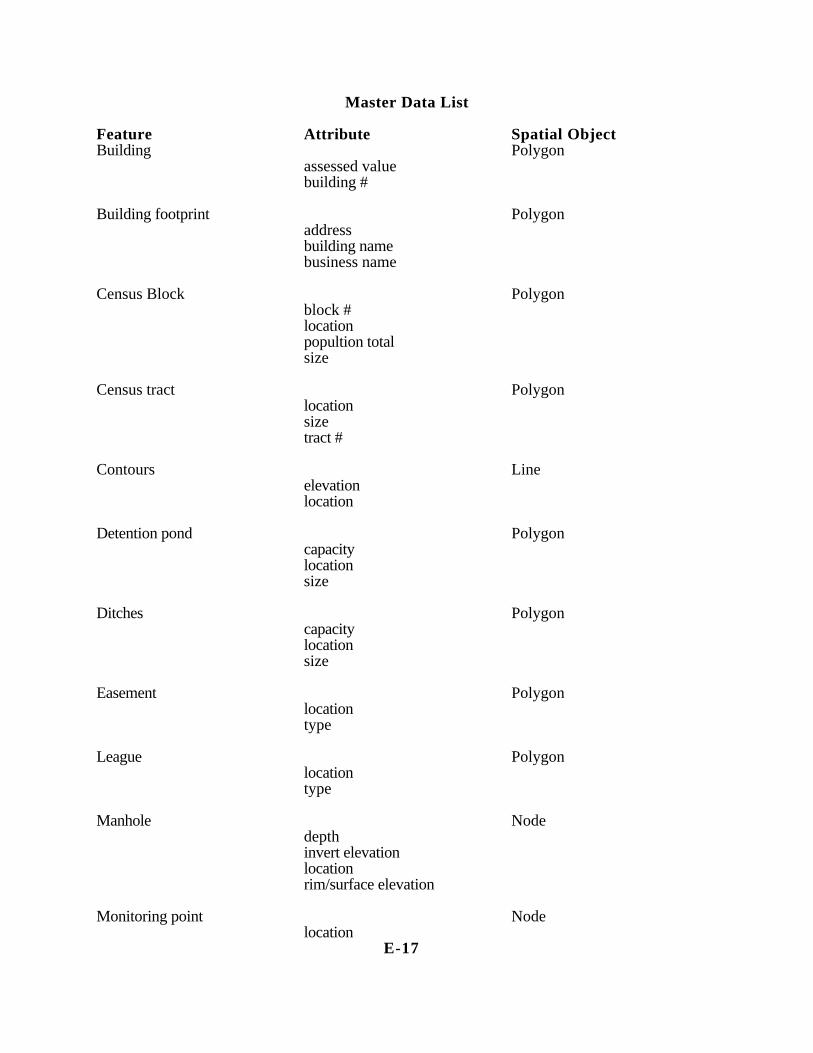
Master Data List
Feature Attribute Spatial ObjectBuilding Polygon
assessed valuebuilding #
Building footprint Polygonaddressbuilding namebusiness name
Census Block Polygonblock #locationpopultion totalsize
Census tract Polygonlocationsizetract #
Contours Lineelevationlocation
Detention pond Polygoncapacitylocationsize
Ditches Polygoncapacitylocationsize
Easement Polygonlocationtype
League Polygonlocationtype
Manhole Nodedepthinvert elevationlocationrim/surface elevation
Monitoring point Nodelocation
E-17

Master Data List Cont'd
Neighborhood Polygonlocationname
Net migration Noneapplication # 69
Occupancy Nodeoccupant addressoccupant nameoccupant type code
Parcel Polygonaddressareaassessed valuebuilt/vacant codedepthfront footageland useland use codelast sale pricelocationowner addressowner nameSBL #sizesubdivision lot
Sanitary sewer line Linecapacitylocationsize
Sidewalk Linelocation
Storm drainage Linelocation
Storm sewer line Linecapacitylocationsize
E-18

Master Data List Cont'd
Street (center line) Lineclasslengthlocationnamewidthaddress range
Street (double line) Polygonaddress rangecurb locationlocationnamepavement type
Street intersections Nodestreet namestraffic flow conditions
Subdivision Polygonboundaryname
Traffic zone Polygonareazone code
Water main Lineinstallation datelocationmaterialsizetype
Wetland Polygonareawetland code
Wye hook ups (new only)distance from manholes nodelocation
Zoning Polygonareazoning code
E 19

GIS Application by Department by Type
Department Browse Display Query Query Spatial Total& Display Model
Assessor 0 2 1 4 0 7
Building Dept. 0 1 0 0 0 1
Engineering 0 0 0 2 1 3
Highway Dept. 0 0 0 0 1 1
Planning 1 0 0 0 1 2
Recreation Dept. 0 0 1 0 0 1
Total 1 3 2 6 3 15
GIS Application by Department by Frequency
Department Browse Display Query Query Spatial Total& Display Model
Assessor 0 2 18250 1677 0 19929
Building Dept. 0 3650 0 0 0 3650
Engineering 0 0 0 624 1040 1664
Highway Dept. 0 0 0 0 120 120
Planning 50 0 0 0 4 54
Recreation Dept. 0 0 1500 0 0 1500
Total 50 3652 19750 2301 1164 26917
E-20
GIS DEVELOPMENT GUIDE: CONCEPTUAL DESIGN OF THE GIS

86 GIS Development Guide
PART 1 - DATA MODELING
11 INTRODUCTION
This guide describes data modeling in general, spatial data modeling in specific, the setting ofGISspecifications, and an introduction to spatial data and metadata standards. These activitiesarecollectively called conceptual design of the GIS system (Figure 1). This activity takestheinformation developed during the Needs Assessment and places it a structured format. Theresultof this activity will be a GIS data model and functional specifications for theGIS system.
NeedsAssessment
ConceptualDesign
AvailableData Survey
H/W & S/WSurvey
Pilot/Benchmark
DatabasePlanningand Design
DatabaseConstruction
Aquisition ofGIS Hardwareand Software
GIS SystemIntegration
ApplicationDevelopment
GIS Use andDatabaseMaintenance
Figure 1 - GIS Development Process
Conceptual design is the first step in database design where the contents of the intendeddatabase are identified and described. Database design is usually divided into three major activities
• Conceptual data modeling: identify data content and describe data at an abstract, orconceptual, level. This step is intended to describe what the GIS must do and doesnot deal with how the GIS will be implemented - the "how" question is thesubject of logical and physical database design;
• Logical database design: translation of the conceptual database model into the datamodel of a specific software system; and

Conceptual Design of the GIS 87
• Physical database design: representation of the logical data model in the schema of thesoftware.
Data ObjectsIdentified DuringNeeds Assessment
Preparation ofData Model
Create InitialMetadata
Add RecordRetention Schedulesto Metadata
Archives
Continuing GISDatabase Maintenance
GIS Database
Prepare DetailedDatabase Plan
Match Needed Datato Available Dataand Sources
Source Documents:Maps, Images, AirPhotos, etc.
Survey and Evaluationof Available Data
Map and TabularData Conversion
Database QA/QC Editing
Database Backups
Figure 2 - Life Cycle of a GIS DatabaseThe conceptual design of the GIS system is primarily an exercise in database design. Databaseplanning is the single most important activity in GIS development. It begins with theidentification of the needed data and goes on to cover several other activities collectively termed the

88 GIS Development Guide
data life cycle - identification of data in the needs assessment, inclusion of the data in the datamodel, creation of the metadata, collection and entry into the database, updating and maintenance,and, finally, retained according to the appropriate record retention schedule (Figure 2). Acomplete data plan facilitates all phases of data collection, maintenance and retention and aseverything is considered in advance, data issues do not become major problems that must beaddressed after the fact with considerable difficulty and aggravation.
The conceptual design of the GIS also includes identification of the basic GIS architecture(functions ofhardware and GIS software), estimates of usage (derived from the needsassessment), and scopingthe size of the GIS system. All of this is done with reference to theexisting data processingenvironments (legacy systems) that must interface with the GIS.
Preparing A GIS Data Model
A data model is a formal definition of the data required in a GIS. The data model can take one ofseveral forms, the two used in this guideline are a structured list and an entity-relationshipdiagram. The purpose of the data model, and the process of specifying the model, is to ensurethat the data has been identified and described in a completely rigorous and unambiguousfashion and that both the user and GIS analyst agree on the data definitions. Thedata model is then the formal specification for the entities, their attributes and allrelationships between the entities for the GIS.
Building a data model is not necessarily an easy task. Most professionals in local government willnot have had experience in this task. The GIS analyst of the project is the individual who eithershould build the data model or acquire assistance, such as a qualified consultant, to complete thistask. If the opportunity exists for the GIS analyst to attend a database design course or seminar,this would enhance this person's ability to build the model but, more importantly, provide theknowledge for using the final data model in building the GIS. To the extent that data modelsprepared for other local governments match the needs of a particular GIS development program, orcan be easily adapted, they can be modified for use as the data model. However, the GIS analystmust have a good understanding of the resulting model and how it is used to build and manage theGIS database.
The next sections of the guideline first discuss the nature of geographic data, then presentthemethodology used for data modeling, and lastly describe the development of a GIS datamodelfrom the information collected during the Needs Assessment. The example provided in thelast section is actually a sample local government GIS data model and is suitable for direct use,withappropriate modification to specific situations.
22 NATURE OF GEOGRAPHIC DATA

Conceptual Design of the GIS 89
Geographic data describe entities which have a location. The geographic data includes thelocationinformation and other information about the entity of interest. This other information willbereferred to as attributes of the entities. Historically several terms have been used to describethedata in a GIS database, among them features, objects, or entities. The term featurederives fromcartography and is commonly used to identify "features shown on a map," whileentity and object are terms from computer science used to identify the elements in a database.The normal dictionarydefinitions of these terms are:
Object: a thing that can be seen or touched; material thing that occupies space
Entity: a thing that has definite, individual existence in reality
Feature: the make, shape, form or appearance of a person or thing
A good GIS database design methodology requires the use of terms in a clear anunambiguousmanner. This guideline will use the term entity to represent objects or things to beincluded in thedatabase and attribute will be the term for representing the characteristics ormeasurements to berecorded for the entities. Other terms have commonly been used to describethe organization ofentities and attributes in a GIS, such as layer, coverage, base map,theme, and others. Each of thesewill usually refer to a collection of one or more entitiesorganized in some useful way which isspecific to the GIS software in use. These terms willbecome important during the logical/physicaldatabase design activities where decisions abouthow the GIS data are to be stored in the GISdatabase are made. The conceptual database designactivity is focused solely on specifying whatis to be included in the GIS database and shouldprovide clear and unambiguous representation ofthe entire GIS database.
In addition to a clear and concise definition of entities and their attributes, data modeling describesrelationships between entities. An example of a relationship between an employee and acompany would be "works for."
Employee - Works For - Company
Relationships may be bi-directional, thus:
Company - Has - Employees
An important aspect of a relationship is "cardinality," that is if the relationship is between only oneof each entity or if either entity may be more than one. For example, one company usually hasmany employees whereas one employee works for only one company. The possible cardinalitiesare: one-to-one; one-to-many; and many-to-many. Thus:
--- Has --->Company (One) <--- Work For ------ (Many) Employees
There are many variations of the notation used to express these facts. The notation recommendedfor local government will be described later.

90 GIS Development Guide
Geographic, or spatial data, differs from other "regular" data that are included incomputerdatabases in how entities are defined and in the relationships between entities. Entityidentificationfor spatial data includes the definition of a physical or abstract entity (e.g., abuilding) and thedefinition of a corresponding spatial entity (i.e., a polygon torepresent the building footprint). This latter, or second entity does not exist for other typesof computer databases. The existence ofthe corresponding spatial entity is one of the majorfactors that distinguishes GIS from other types ofsystems and is what makes it very important toutilize proper planning and design techniques whenbuilding a GIS. An example will be used toillustrate this difference.
Entities:Entity:
Physical orConceptual
Entity and Its Attributes
Spatial Entityand Attributes
Parcel (owner_name, owner_address)
Street_segment (name, type, width)
Building (date_built, assessed_value)
Soil-type (soil_code, area)
Landuse_area (land_use, code, area)
Polygon (coordinates, topology)
Line_segment (coordinates, topology)
Footprint (coordinates)
Polygon (coordinates, topology)
Grid_cell (coordinates)
Figure 3 - Examples of Physical or Conceptual Entities and Their CorrespondingSpatial Entities
33 ENTITY-RELATIONSHIP (E-R) DATA MODELING
To start the discussion of entity-relationship modeling, two examples will be shown. One, aregular database and the second, a simple GIS database. The personnel database inany localgovernment could have entities of employee, dependent and department.Relationshipsbetween these entities would be employee " works in" department and dependent "isa member of"the employee's family. Some of the attributes for each entity would be as follows:
Employee (name, age, sex, job title)Dependent (name, age, relationship_to _employee, i.e., spouse, child, etc.)Department (department_name, function, size)
A diagrametric representation of the example would be as follows:

Conceptual Design of the GIS 91
Name
Age
Sex
Name
Function
Size
Employee Works in Department
Has
DependentsOccupant_Name
Unit_Number
Job Title
Name
Age
Relationshlip to employer
Figure 4 - Example of a Firm's Database
An example of a simple spatial database would be a follows:
Parcel ID#, owner_name, owner_address, site_address PolygonBuilding Building_name, height, floor_area FootprintOccupant Occupant_name, unit_number None
The diagrammatic form of this spatial database would be as follows:
Building_Name
Height
Floor_area
Owner_Name
Owner_Address
Situs_Address
Building Located on Parcel
Has
OccupantOccupant_Name
Unit_Number
ID #
Figure 5 - Example of a Simple GIS Database
This example has been presented using two standard notational forms for conceptualdatabasedesign: a relation, the entity name followed by a list of attributes; and an entity-relationshipdiagram showing entities, their attributes, and the relationships between entities.On figure 5, there are two things to notice:
• The standard entity - relationship diagram has no provision for representing thecorresponding spatial entity (point, line, polygon) of the data; and
• The representation of the attributes (ellipses) can be somewhat awkward due todifferent name lengths and the number of attributes to be shown.

92 GIS Development Guide
The two notational forms modified to accommodate GIS data will be used as the primary tools forconceptual database design in this guideline; however, modifications will be made to adequatelyrepresent GIS data.The next section will provide the formal definition of the basic entity-relationship data modelingmethod, the modifications needed to represent GIS data, followed byexamples of GIS data entities and attributes typical for local government andthe by a descriptionof how to model these data using the modified entity-relationship data modelingtechnique.
Basic Entity-Relationship Modeling
The basic entity-relationship modeling approach is based on describing data in terms of the threeparts noted above (Chen 1976):
• Entities• Relationships between entitles• Attributes of entitles or relationships
Each component has a graphic symbol and there exists a set of rules for building a graph (i.e., anE-R model) of a database using the three basic symbols. Entities are represented as rectangles,relationships as diamonds and attributes as ellipses.
The normal relationships included in a E-R model are basically those of:1. Belonging to;2. Setand subset relationships;3. Parent-child relationships; and4. Component parts of an object.
Theimplementation rules for identifying entities, relationships, and attributes include anEnglishlanguage sentence structure analogy where the nouns in a descriptive sentences identifyentities,verbs identify relationships, and adjectives identify attributes. These rules have beendefined byChen (1983) as follows:
Rule 1: A common noun (such as person, chair), in English corresponds to an entity typeon an E-R diagram.
Rule 2: A transitive verb in English corresponds to a relationship type in an E-R diagram.
Rule 3: An adjective in English corresponds to an attribute of an entity in an E-R diagram.
English statement: Mr. Joe Jones resides in the Park Avenue Apartments which is located on landparcel #01-857-34 owned by the Apex Company.
Analysis: .. "Joe Jones"," "Park Avenue Apartments," "land parcel" and "Apex Company" arenouns and therefore can be represented as entities "occupant," "building," "parcel," and "owner.""resides," "located on" and "owned by" are transitive verbs (or verb phrases) and therefore definerelationships.
Example of Simple E-R diagrams

Conceptual Design of the GIS 93
Building
Resides
Occupant
Located on
Name: Joe Jones
Owned by
Parcel
Owner
Owner_name: Apex Co.
Name ApexCo..
Figure 6 Shows a Simple E-R Diagrams of the Previous Example
Many times it is possible to build different E-R diagrams for the same data. For example, insteadof creating the entity "owner" in the above example, the owner's name could be an attribute ofparcel (shaded areas of figure 6). During the process of building an E-R diagram (i.e., theconceptual model) for a database, the analyst must make decisions as to whether something is bestrepresented as an entity or as an attribute of some other entity.
The process of constructing an E-R diagram uncovers many inconsistencies or contradictions in thedefinition of entities, relationships, and attributes. Many of these are resolved as the initial E-Rdiagram is constructed while others are resolved by performing a series of transformations on thediagram after its initial construction. The final E-R diagram should be totally free from definitionalinconsistencies and contradictions. If properly constructed, an E-R diagram can be directlyconverted to the logical and physical database schema of the relational, hierarchical or network typedatabase for implementation.
Unique Aspects of Geographic Data
In the simplest terms, we think of geographic data as existing on maps as points, lines and areas.Early GIS systems were designed to digitally encode these spatial objects and associate one ormorefeature codes with each spatial feature. Examples would be a map of land use polygons, aset ofpoints showing well locations, a map of a stream shown as line segments. For the purposesofplotting (redrawing the map) a simple data structure linking (x,y) coordinates to afeature codewas sufficient.
Topology
A distinguishing feature of a modern GIS is that some spatial relationships between spatial entitieswill be coded in the database. This coding is termed topologically coding. Topologyisbased on graph theory, where a diagram can be expressed as a set of nodes and links in amannerthat shows logical relationships. Applied to a map, this concept is used to abstract thefeaturesshown on the map and to represent these features as nodes and arcs (point and lines).Nodes are the end-points of arcs and areas are formed by a set of arcs. If the concept anddefinitions of topologic data structures are not familiar to the reader, the following readings arerecommended:

94 GIS Development Guide
• Geographic Information Systems: A Guide to the Technology, by JohnAntenucci, et. al, pages 98-99.
• Fundamentals of Spatial Information Systems, by Robert Lauring and DerekThompson, pages 206-211.
• ARC/INFO Data Model, Concepts, & Key Terms, by Environmental SystemsResearch Institute, Inc., pages 1-12 to 1-15.
Coordinate strings without topology with associated feature codes were called "spaghetti" filesbecause there was not any relationship between any two coordinate strings formally encoded in thedatabase. For example, the "GIS system" would not "know" if two lines intersect or not orwhether they had common end points. These relationships could be seen by the human eye if aplot were to be made or alternatively could be calculated (often a time consuming process). Typicalof this type of geographic data file are those produced by computer-aided drafting systems (CAD),or known as .dxf, .dwg, or .dgn files.
44 GEOGRAPHIC DATA MODELS
The data models in most contemporary GISs are still based on the cartographic view. Other datamodels have begin to evolve, but are still very limited. Current and potential geographic datamodels include:
• The cartographic data model: points, lines and polygons (topologically encoded) withone, or only a few, attached attributes, such as a land use layer represented as polygonswith associated land used code
• Extended attribute geographic data mode: geometric objects as above but with manyattributes, such as census tract data sets;
• Conceptual object/spatial data model: explicit recognition of user defined objects, zeroor more associated spatial objects, and sets of attributes for reach defined object(example: user objects of land parcel, building, and occupant, each having its own setof attributes but with different associated spatial objects: polygon for land parcel,footprint for building, and no spatial object of occupant).
• Conceptual objects/complex spatial objects: multiple objects and multiple associatedspatial objects (example: a street network with street segments having spatialrepresentations of both line and polygon type and street intersections having spatialrepresentations of both point and polygon type).
Current GIS are based on the cartographic and extended attribute data models. The trend to object-oriented computer systems and databases will require that GIS planners view their databases froman "object viewpoint."
Spatial Relationships

Conceptual Design of the GIS 95
GISs also differ from other systems in that they include spatial relationships. These relationshipsare included in the GIS either by the topologic coding or by means of calculations based on the(x,y) coordinates. One common calculation is whether or not two lines intersect. Table 1 showsthe spatial relationships, associated descriptive verbs, and the common implementation of eachrelationship by a GIS.
Spatial Relationships
Spatial Descriptive Common GIS E-R Model Relationship Verbs Implementation Symbol
Connectivity
Contiguity
Containment
Proximity
Coincidence
Connect, link
Adjacent,abutt
Contained,containing,within
Closest,nearest
Coincident,Coterminous
Topology
Topology
X, Y coord.operation
X,Y coord.operation
X,Y coord.operation
Figure 7 - Spatial Relationships in a GIS
Connectivity and contiguity are implemented through topology: the link-node structure forconnectivity through networks and the arc-polygon structure for contiguity. Containment andproximity are implemented through x,y coordinates and related spatial operations: containment isdetermined using the point-, line-, and polygon-on-polygon overlay spatial operation andproximity is determined by calculating the coordinate distance between two or more x,y coordinatelocations. The spatial relationship of coincidence may be complete coincidence or partialcoincidence. The polygon-on-polygon overlay operation in ARC/INFO™ calculates partialcoincident of polygons in two different coverages. The System 9™ Geographic InformationSystem recognizes coincident features through a "shared primitive" concept (the geometry of apoint or line is stored only once and then referenced by all features sharing that piece of geometry).Future versions of commercial GISs will likely implement coincident features through either the

96 GIS Development Guide
"belonging to" database relationship or through x,y coordinates and related spatial operations,whichever is more efficient within the particular GIS.
In summary, there are three types of relationships that will be represented in a geographic databasewith an "object view" orientation:
• Normal database relationships, which are represented in a relational database by meansof keys (primary and secondary)
• Spatial relationships represented in the GIS portion of the database by topology
• Spatial relationships that exist only after a calculation is made on the (x,y) coordinates
55 METHODOLOGY FOR MODELING
Modeling a geographic database using the E-R approach requires an expanded or extended conceptfor:
• Entity identification and definition; and• Relationship types and alternate representational forms for spatial relationships.
There are three considerations in the identification and definition of entities in a geographicdatabase:
Correct identification and definition of entities
Entities in a geographic database are defined as either discrete objects (e.g., a building, a bridge, ahousehold, a business, etc.) or as an abstract object defined in terms of the space it occupies (e.g.,a land parcel, a timber stand, a wetland, a soil type, a contour, etc.). In each of these cases we aredealing with entities in the sense of "things" which will have attributes and which will have spatialrelationships between themselves. These "things" can be thought of as "regular" entities.
Defining a corresponding spatial entity for each "regular" entity
A corresponding spatial entity will be one of the spatial data types normally handled in a GIS, e.g.,a point, line, area, volumetric unit, etc. The important distinction here is that we have a singleentity, its spatial representation and a set of attributes; we do not have two separate objects(Figure 3 illustrates this concept). A limited and simple set of spatial entitles may be used, oralternatively, depending on the anticipated complexity of the implemented geographic informationsystem, an expanded set of spatial entities may be appropriate. The corresponding spatial entity forthe regular entity may be implied in the definition of the regular entity, such as abstract entities likea wetland where the spatial entity would normally be a polygon, or a contour where the spatialentity would be a line. Other regular entitles may have a less obvious corresponding spatial entity.Depending on the GIS requirements, the cartographic display needs, the implicit map scale of thedatabase and other factors, an entity may be reasonably represented by one of severalcorresponding spatial entities. For example, a city in a small-scale database could have a point asits corresponding spatial entity, while the same city would have a polygon as its correspondingspatial entity in a large-scale geographic database.

Conceptual Design of the GIS 97
Recognize multiple instances of geographic entities, both multiple spatialinstances and multiple temporal instances
Multipurpose (or corporate) geographic databases may need to accommodate multiplecorresponding spatial entities for some of the regular entities included in the GIS. For example,the representation of an urban street system may require that each street segment (the length ofstreet between two intersecting streets) be held in the GIS as both a single-line street network tosupport address geocoding, network based transportation modeling, etc., and as a double-line (orpolygon) street segment for cartographic display, or to be able to locate other entities within thestreet segment (such as a water line), etc. In each of these instances the "regular" entity is the streetsegment, although each instance may have a different set of attributes and different correspondingspatial entities. Also, there may be a need to explicitly recognize multiple temporal instances ofregular entities. The simple case of multiple temporal instances will be where the correspondingspatial entity remains the same, however, future GISs will, in all likelihood, have to deal withmultiple temporal instances where the corresponding spatial entity changes over time.
Three symbols are defined to represent entities: entity (simple); entity (multiple spatialrepresentations); and entity (multiple time periods). The internal structure of the entity symbolcontains the name of the entity and additional information indicating the corresponding spatialentity (point, line or polygon), a code indicating topology, and a code indicating encoding of thespatial entity by coordinates (Figure 8). The coordinate code is, at the present time, redundant inthat all contemporary GISs represent spatial entities with x,y coordinates. However, it is possiblethat future geographic databases may include spatial entities where coordinates are not needed.Similarly, topological encoding is normally of only one type and can, for the present, be indicatedby a simple code. However, different spatial topologies have been defined and may requiredifferent implementations in a GIS (Armstrong and Densham, 1990). In the future, the topologycode may be expanded to represent a specific topologic structure particular to a GIS application.
G TSpatial Object
Object(entity)
Regular Object Name
Topology Indicator
XY Coordinate Indicator
AssociatedSpatial ObjectType
Figure 8 - Entity Symbol for Spatial Objects
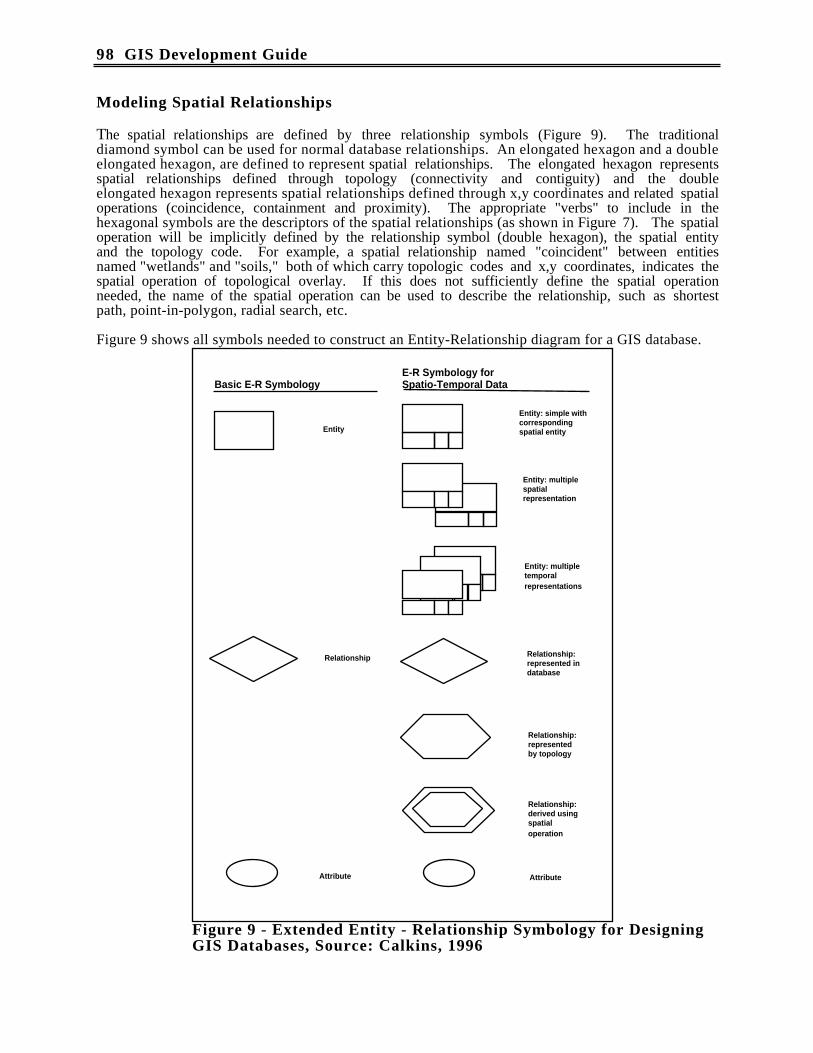
98 GIS Development Guide
Modeling Spatial Relationships
The spatial relationships are defined by three relationship symbols (Figure 9). The traditionaldiamond symbol can be used for normal database relationships. An elongated hexagon and a doubleelongated hexagon, are defined to represent spatial relationships. The elongated hexagon representsspatial relationships defined through topology (connectivity and contiguity) and the doubleelongated hexagon represents spatial relationships defined through x,y coordinates and related spatialoperations (coincidence, containment and proximity). The appropriate "verbs" to include in thehexagonal symbols are the descriptors of the spatial relationships (as shown in Figure 7). The spatialoperation will be implicitly defined by the relationship symbol (double hexagon), the spatial entityand the topology code. For example, a spatial relationship named "coincident" between entitiesnamed "wetlands" and "soils," both of which carry topologic codes and x,y coordinates, indicates thespatial operation of topological overlay. If this does not sufficiently define the spatial operationneeded, the name of the spatial operation can be used to describe the relationship, such as shortestpath, point-in-polygon, radial search, etc.
Figure 9 shows all symbols needed to construct an Entity-Relationship diagram for a GIS database.
Basic E-R SymbologyE-R Symbology forSpatio-Temporal Data
Entity
Entity: simple withcorrespondingspatial entity
Entity: multiplespatialrepresentation
Entity: multipletemporalrepresentations
Relationship Relationship:represented indatabase
Relationship:representedby topology
Relationship:derived usingspatialoperation
Attribute Attribute
Figure 9 - Extended Entity - Relationship Symbology for DesigningGIS Databases, Source: Calkins, 1996

Conceptual Design of the GIS 99
66 DEVELOPING A SPATIAL DATA MODEL (ENTITY-RELATIONSHIP DIAGRAM)
The information needed to develop the E-R diagram representing the spatial data model comes fromthe Needs Assessment activity as:
• The GIS application descriptions• The master data list: Lists, entities, corresponding spatial entities and attributes• The list of functional capabilities (spatial operations)
The process of building the E-R diagram involves taking entities from the master data list one at atime and placing each one on the diagram. For each new entity, any relationship to any previouslyentered entity should be entered. Relationships are found by examining the ApplicationDescriptions and determining if the GIS processes require a specified operation. For example, ifan Application Description indicated that land parcels needed to be compared to a flood plain area,then a spatial relationship of "coincident area" (or topological overlay operation) should be definedbetween the two entities.
Land Parcel Flood PlainCoincident
AreaPolygon G T Polygon G T
Figure 10 - Diagramming a Spatial Relationship
As each entity is added to the E-R diagram, the list of attributes should be reviewed and checked todetermine if the attribute is appropriate for the entity, does not duplicate any other attribute orentity, and can be rigorously defined for entry to create the metadata (metadata is discussed in thenext section of this guideline).
Figure 11 is a sample E-R diagram for data commonly used by local government. This examplecontains 16 entities and 15 relationships. Attributes have not been included in the diagram in orderto reduce the size of the diagram for inclusion in this document.

100GIS Development Guide
STREETSEGMENT
COINCIDENTAREA
POLYGON G T
WETLANDS
COINCIDENTAREA
COINCIDENTAREA
CONTAINS
HAS
OCCUPANT
ADJACENT
HAS
CONTAINS
WITHIN
LINE G T
WATERMAIN
LINE G T
WATER SERVICECONNECTION
LINK
LINK
LINE G T
COINCIDENTLINE
INTERSECT
NODE G TLINK
ABUTTING
NEARESTADDRESS
HYDRANT
NODE G T
VALVE
NODE G T
STREET SYSTEM
POLYGON G T
FLOODPLAIN
POLYGON G T
SOILS
POLYGON G T
POLYGON G
BUILDING
POLYGON G T
POLYGON G T
POLYGON G T POLYGON G T
POLYGON G T
STREETSEGMENT
POLYGON G T
INTERSECTION
PARCEL
ZONING
CENSUSTRACT
CENSUSBLOCK
TRAFFICZONE
Figure 11 - Entity Relationship Diagram for Selected Local Government Data
77 SUMMARY OF CONCEPTUAL DATA MODELING
The E-R diagram shown in Figure __ will be used to verify with the expected users the datacontent of the GIS and, by additional reference to the GIS needs analysis, the required spatialoperations. Once verified by the users, the E-R representation can be mapped into a detaileddatabase design (as will be described in the Database Planning and Design Guideline)where:
1) Each entity and its attributes map into:(a) One or more relational tables with appropriate primary and secondary keys (thisassumes the desired level of normalization has been obtained);(b) The corresponding spatial entity for the "regular" entity. As most commercial GISsrely on fixed structures for the representation of geometric coordinates and topology, thisstep is simply reduced to ensuring that each corresponding spatial entity can be handled bythe selected GIS package;
2) Each relationship into:(a) Regular relationships (diamond) executed by the relational database system's normalquery structure. Again, appropriate keys and normalization are required for this mapping.(b) Spatial relationships implemented through spatial operations in the GIS. Thefunctionality of each spatial relationship needs to be described, and if not a standardoperation of the selected GIS, specifications for the indicated operation need to be written.
Conceptual Design of the GIS101
PART 2: SPATIAL DATA STANDARDS ANDMETADATA REQUIREMENTS
Introduction
Spatial data standards cover a variety of topics including the definition of spatial data entities(including a formal data model), methods of representation of the spatial entities in a GIS,specifications for the transfer of spatial data between different organizations, and the definition ofthe attributes of the spatial entities and the values these attributes may assume. Metadata is"information about data," and should describe the characteristics of the data such as identifyingentities and attributes by their standard names and provide information on such items as dataaccuracy, data sources and lineage, and data archiving provisions.
Much of the work on spatial data standards to date as been done under the auspices of the FederalGeographic Data Committee and only concerns federal spatial data directly. The relationshipbetween the existing federal data standards and state and local spatial data standards have yet to bedeveloped. Appendix A contains a list of current and pending reports on federal spatial datastandards. Work towards New York State spatial data standards will be conducted under theproposed GIS Standing Committee of the Information Resources Management Task Force.
Metadata for Local Governments in New York State
Metadata can serve many purposes. Some of the more important functions of metadata are:
• Provide a basic description of a dataset
• Provide information for data transfers to facilitate data sharing
• Provide information for entries into clearinghouses to catalogue the availability of data
The metadata structure and content for local government recommended in this guideline has beenprepared according to the following criteria:
• The metadata must first, and primarily, serve as a documentation and data managementtool for the data administrator in an agency or department
• Secondly, the metadata must encompass and support the data manager and recordsmanagement officer in a local agency in all aspects of data management including datadefinition, source documentation, management and updating, and data archiving andretention requirement.
• Thirdly, the metadata information must be able to generate and supply databasedescriptions for spatial data clearinghouses such as the prototype New York StateSpatial Data Clearinghouse developed under the GIS Demonstration Project conductedby the Center for Technology in Government, SUNY - Albany and any relevant federalspatial data clearinghouses.

102GIS Development Guide
The following metadata information is a prototype for a New York State Local Government SpatialMetadata Standard. This metadata is represented in a set of tables listed below and has beenimplemented in Microsoft Access™. A working copy of this metadata program is available to alllocal governments in the state. The structure and information on how to use the software aredescribed in a user's guide available with the program. The content of the metadata tables is asshown in the following lists.
Metadata Tables
1. Organization InformationName Of OrganizationDepartmentRoom/Suite #Number And Street NamesCityStateZip CodePhone NumberFax NumberContact PersonPhone Number/ExtensionEmail AddressOrganization Internet AddressComments
2. Reference InformationFilenameFile FormatAvailabilityCostFile Internet AddressMetadata Created ByDate Metadata CreatedMetadata Updated ByDate Metadata UpdatedMetadata Standard NameComments
3. Object/File Name InformationFilenameData Object Name
4. Data Object InformationDistribution Filename (Same as Filename in Reference Information)Data Object NameTypeData Object DescriptionSpatial Object TypeComments

Conceptual Design of the GIS103
5. Attribute InformationData Object NameData Attribute NameAttribute DescriptionAttribute FilenameCodeset Name/DescriptionMeasurement UnitsAccuracy DescriptionComments
6. Data Dictionary InformationData Object NameData Attribute NameData TypeField LengthRequiredComments
7. Spatial Object InformationData Object NameSpatial Object TypePlace NameProjection Name/DescriptionHCS NameHCS DatumHCS X-OffsetHCS Y-OffsetHCS XminHCS XmaxHCS YminHCS YmaxHCS UnitsHCS Accuracy DescriptionVCS NameVCS DatumVCS ZminVCS ZmaxVCS UnitsVCS Accuracy DescriptionComments
8. Source document informationData Object NameSpatial Object TypeSource Document NameTypeScaleDate Document CreatedDate Digitized/ScannedDigitizing/Scanning Method DescriptionAccuracy DescriptionComments

104GIS Development Guide
9. Lineage InformationData Object NameData Object 1Data Object 2Description of Spatial Operation and ParametersAccuracy DescriptionComments
10. Update InformationData Object NameUpdate FrequencyDateUpdated ByComments
11. Archive InformationData Object NameRetention ClassRetention PeriodData ArchivedArchived ByDate to be Destroyed
12. Source DocumentsSource Document NameSource Document ID#Source OrganizationType of DocumentNumber of Sheets (map, photo)Source Material (paper, mylar)Projection NameCoordinate SystemDate CreatedLast UpdatedControl/Accuracy (map, photo)ScaleReviewed byReview dateSpatial extentFile formatComments
13. Entities Contained in SourceSource ID#Entity NameSpatial EntityEstimated Volume of Spatial EntitySymbolAccuracy Description of Spatial EntityReviewed byReview DateScrub Needed (yes/no)Comments

Conceptual Design of the GIS105
14. Attributes by EntitySource ID#Entity NameAttribute DescriptionCode Set NameAccuracy Description of AttributeReviewed ByReview DateComments
Additional Reading(the following material is quite technical, but a good set of sources on conceptual database design.)
Armstrong, M.P. and P.J. Densham, 1990, Database organization strategies for spatial decisionsupport systems, International Journal of Geographical Information Systems, vol. 4, no. 1, 3-20.
Calkins, Hugh W., Entity Relationship Modeling of Spatial Data for Geographic InformationSystems, International Journal of Geographical Information Systems, January 1996.
Chen, P.P., 1976, The entity-relationship model - toward a unified view of data, ACMTransactions on Database Systems, vol. 1, no. 1, March 1976, pp. 9-36
Chen, P.P., 1984, English sentence structure and entity-relationship diagrams, InformationSciences, 29, 127-149
Davis, C., et. al., eds., 1983, Entity-Relationship Approach to Software Engineering, Amsterdam,Netherlands: Elsevier Science Publishers B.V.
Elmasri, R. and S.B. Navathe, 1989, Fundamentals of Database Systems, Redwood City,California: The Benjamin/Cummings Publishing Company, Inc.
Jajodia, S. and P. Ng, 1983, On representation of relational structures by entity-relationshipdiagrams, Entity-Relationship Approach to Software Engineering, P. Ng and R. Yeh (eds.),Amsterdam, Netherlands: Elsevier Science Publishers B.V., pp. 249-263.
Liskov, B. and S. Zilles, 1977, An introduction to formal specifications of data abstractions,Current Trends in Programming Methodology - Vol. 1: Software Specification and Design, R.T.Yeh (ed), Prentice Hall, pp 1-32.
Loucopoulos, P. and R. Zicari, 1992, Conceptual Modeling, Databases, and CASE: An integratedview of information systems development, New York: John Wiley & Sons, Inc.
Teorey, T.J. and J.P. Fry, 1982, Design of Database Structures, Englewood Cliffs, NJ: Prentice-Hall, Inc.
Ullman, J.D., 1988, Principles of Database and Knowledge-base Systems, 2 vols. (Rockville,Maryland: Computer Science Press, Inc.)

106 GIS Development Guide
Appendix A
Developing Standards for Spatial Data and Metadata
Spatial data standards are needed in order to facilitate the exchange of spatial data betweengeographic information systems. We refer to data as "spatial" because the common factor is ageographic reference (a reference in space) which allows the data to be accessed through a GIS. Inorder to accomplish the goal of facilitating data exchange, spatial data standards should provide:
• Definitions of terms for spatial objects or features included in GIS;• A structure (or format) for the exchange of spatial data;• A method for describing the accuracy and lineage of the data; and• The definition of metadata (the data that describes the spatial data).
The primary purpose for spatial data standards is to facilitate data sharing and exchange, thus thefocus only on data issues. The Council concluded that It is not necessary to develop standards forGIS hardware or software at this time. as these standards are expected to evolve from groups suchas the Open GIS Consortium, a non-profit trade association formed to implement the OpenGeodata Interoperability Specification .
The Current Status of Standards
At present, spatial data standards exist only at the Federal government level. Under the FederalGeographic Data Committee, three standards documents have been prepared:
The Spatial Data Transfer Standard (SDTS - FIPS 173)
This standard defines a method for the exchange of spatial data between different GIS softwaresystems. It also contains definitions of terms for the spatial objects of interest to Federalgovernment agencies.
Content Standards for Digital Geospatial Metadata (proposed)
This standard defines the content for digital geospatial metadata, the information about spatial datathat would be entered into a clearinghouse or repository to form a catalog of spatial data available toother users.
Cadastral Standards for the National Spatial Data Infrastructure (draft)
This is a draft standard for cadastral (land ownership) data, one of twelve theme standardsdocuments under preparation.The Federal Geographic Data Committee has also established a National Spatial Data Infrastructure(NSDI) for the purpose of coordinating geographic data acquisition and access. The mechanism forthis will be a National Spatial Data Clearinghouse, a distributed network of geospatial dataproducers, managers, and users linked electronically. It is envisioned that this network ofclearinghouses would contain information about available spatial data. Potential users would searchthis clearinghouse to find data of interest, access the metadata for a description of data of interest,and could acquire the data from the distributing agency. Spatial data may be deposited directly witha clearinghouse or retained by the originator.
A-1

Manager's Overview107
The Federal effort towards standards development started in 1981 and The National Spatial DataInfrastructure and Federal spatial data standards are still evolving at this time. The remainingsubject area (theme) standards reports are scheduled for release during the Spring of 1996 ( themesare: base cartographic, bathymetric, cultural and demographic, geodetic, geologic, groundtransportation, international boundaries, soils, vegetation, water, and wetlands). The table belowshows the current status of federal spatial data standards development.Implementation of the Federal geospatial data standards is through Executive Order 12906 signedby the President on April 11, 1994. The FGDC is directed to " ...seek to involve State, local, andtribal governments in the development and implementation of the initiatives continued in thisorder." The Order provides that:
"Federal agencies collecting or producing geospatial data, either directly or indirectly ~e.g. throughgrants, partnerships, or contracts with other entities) shall ensure, prior to obligating funds forsuch activities, that data will be collected in a manner that meets all relevant standards adoptedthrough the FGDC process. "
Status of Federal Geographic Data Committee Standards
Currently in development: Completed public review:
National Spatial Data Accuracy Standard Cadastral Content StandardStandards for Digital Orthoimagery Federal Domain of Values for Data Content StandardDraft Standards for Digital Elevation Data Cadastral Collection Standard (Cadastral)Hydrographic and Bathymetric Accuracy Standard Clearinghouse Metadata Profile (Cadastral)Standards for Geodetic Control Networks Classification of Wetlands and Deepwater HabitatsTransportation Network Profile for of the United StatesSpatial Data Transfer StandardTransportation-related Spatial Feature DictionarySoils Data Transfer StandardVegetation Classification StandardsRiver Reach Standards and Spatial FeatureDictionaryFacility ID CodeContent Standard for Cultural and DemographicData Metadata
Source: Federal Geographic Data Committee Newsletter, November 1995.
A-2

108 GIS Development Guide