local government support for children, young people and ...€¦ · web view*includes 8 councils...
TRANSCRIPT

Victorian Local Government Support for Children, Young People and Their Families
May 2011

Published by the Department of Education and Early Childhood Development and Municipal Association of Victoria
MelbournePublished May 2011
© State of Victoria 2011
The copyright in this document is owned by the State of Victoria and the Municipal Association of Victoria. No part may be reproduced by any process except in accordance with the provisions of the Copyright Act 1968, NEALS (see below) or with permission.
An educational institution situated in Australia which is not conducted for profit, or a body responsible for administering such an institution, may copy and communicate the materials, other than third-party materials, for the educational purposes of the institution.
Authorised by the Department of Education and Early Childhood Development,2 Treasury Place, East Melbourne, Victoria 3002.
Also published on http://www.education.vic.gov.au
Foreword
Dear Colleagues
Local Government support for children, young people and their families
This report documents the contribution made by Local Government in helping families to
raise their children, and assisting young people to make their own way in the world.
This contribution attracts little publicity and can be easily underestimated. Yet it can have a
crucial impact on whether or not support is known and available to parents. Victorian
councils have embraced responsibility for the planning or provision of local human services
to facilitate community wellbeing, and have actively partnered with State and Commonwealth
Governments in the development of services and promotion of shared policy objectives.
In 2009 the Municipal Association of Victoria (MAV) — as the peak body for Victorian Local
Government — and the Department of Education and Early Childhood Development
(DEECD) signed a partnership agreement, formally recognising the importance of their
partnership in promoting the wellbeing of children and young people. An important
immediate action under this partnership agreement was a survey of all Victorian councils on
the extent of their involvement in supporting children and young people — a key step to
improve the evidence base on which future planning will depend.
All 79 councils completed the survey, a testament to the strong partnership formed between
the Victorian Government and local government.
This report provides a snapshot of the extent of local government support for young children
and their families. This updates information collected four years earlier, in a 2006 survey of
early childhood activity, and provides us with some evidence of how things are changing.
The 2010 survey, however, includes a broader focus than the 2006 survey. This time there
are also questions related to support for older children (ages 8 to 12 years) and their
families; questions around support for children with disabilities, and questions on councils’
contribution to coordination and planning.
Foreword 3

For the first time, the report of this survey also provides a snapshot of the many supports
provided by local councils to young people (ages 13 to 25 years). Some key trends can be
determined from the survey results:
High levels of local government involvement in direct provision of supports for
children, young people and their families.
Wide variability in support for children and young people across the full range of
councils, in comparison between metropolitan and rural councils and amongst other
groupings of councils.
Increased involvement and investment in some areas of early childhood, such as
kindergarten, long day care provision and playgroups.
Reduced involvement and investment by some councils in out-of-school hours care,
occasional care, family day care and neighbourhood houses with early years
programs (though not neighbourhood houses themselves).
Increased involvement and investment in supporting young people by over two-fifths
of councils.
High levels of council involvement and interest in coordinating services and supports
for children and young people including the use of data to support
coordination/planning efforts.
Acknowledgement that more needs to be done to improve coordination efforts,
including the better use of data.
Victorian local government has a long and proud history of supporting children, young
people and their families, characterised by an independent and locally responsive approach
to supporting the needs of local families. The Municipal Association of Victoria and the
Department of Education and Early Childhood Development see this survey as another
important step in developing an evidence base from which to further develop the critical role
of local government in this key area.
Rob SpenceChief Executive OfficerMunicipal Association of Victoria
Jeff RosewarneActing SecretaryDepartment of Education and Early Childhood Development
4 Victorian Local Government Support for Children, Young People and Their Families

ContentsForeword 3
List of Figures and Tables 6
Glossary 7
List of Programs and Services 9
Executive Summary 13
1. Introduction 20
1.1 Policy context 20
1.2 Method and content of survey 20
1.3 Data presentation in the report 21
1.4 Governance of the survey 21
1.5 Strengths and limitations of survey 21
2. Part A: Services for Children (0–12 years)
2.1 Overview of findings 25
2.2 Detailed findings 29
2.3 Discussion of findings: services for children 62
3. Part B: Services for Young People (13–25 years)
3.1 Overview of findings 64
3.2 Investment in youth services 70
3.3 Communication, consultation and participation in decision-makingstrategies 74
3.4 Coordination and planning of services for young people 76
3.5 Use of data to support coordination and planning 82
3.6 Discussion of findings: Services for young people 85
4. Conclusion 86
Contents 5

List of Figures and Tables Figures
Part A: Services for children (0–12 years)1. Early childhood settings supported by local government
2. Children’s services supported by local government
3. Major changes in council support for early childhood settings and services for children (0–12)
4. Council ownership of facilities in 2006 and 2010 surveys
5. Rural and metropolitan council involvement in early childhood settings
6. Rural and metropolitan council involvement in children’s services
7. Rural and metropolitan council ownership of buildings operating as early childhood settings
8. Comparing Best Start councils with other councils on support for children’s settings and services
9. Comparing Best Start councils with other councils on involvement in coordination and planning mechanisms
10. Comparing Best Start councils with other councils in supporting vulnerable children
11. Middle years initiatives and council views on whether more work was needed
Part B: Services for young people (13–25 years)12. Programs and services supported by local government
13. Targeted groups in programs and services supported by local government
14. Major changes in council involvement in supporting young people over the past three years
15. Metropolitan and rural council support for youth services
16. Recurrent 2010–11 expenditure on youth services and infrastructure
17. Recurrent 2010–11 expenditure on youth services and infrastructure, by metropolitan andrural councils
18. Proportion of recurrent expenditure on youth services and infrastructure from council funds
19. Proportion of council recurrent expenditure on youth services and infrastructure from different funding sources
20. Number of effective full-time staffing positions for youth services and infrastructure
21. Changes in investment in youth services and infrastructure over the past three years
Tables
Part A: Services for children (0–12 years)1. Types of council involvement in four-year-old kindergarten
2. Types of council involvement in central enrolment
3. Types of three-year-old provision in municipalities
4. Staff qualifications in council-supported three-year-old programs
5. Council involvement in neighbourhood houses with early years programs
6. Council involvement in long day care
7. Council involvement in occasional care
List of Figures and Tables 6
8. Council involvement in family day care
9. Council involvement in outside-school-hours care
10. Types of outside-school-hours care supported by councils
11. Council involvement in playgroups
12. Funding sources of council-supported playgroups
13. Focus in playgroups on higher-needs children and families
14. Employment of staff with specialist roles in relation to child disability
15. Provision of specialist services in relation to child disability
16. Council involvement in services for families with children (0–12 years)
17. Extent of support in coordinating early childhood (0–8 years) service provision
18. Council views on effectiveness of local early childhood (0–8 years) coordination efforts
19. Council mechanisms used in coordination of services for families with young children
20. Council partnerships with primary schools
21. Council rating of importance of local population data for planning/coordination
22. Council rating of importance of access to evidence-based interventions
23. Types of data accessed by councils
24. Council rating of access to skills and knowledge to use data
25. Mechanisms/sources used to access data
26. Council provides or funds targeted programs for higher needs groups of children
Part B: Services for young people (13–25 years)27. Council rating of their role in education and training support for young people (13–25 years)
28. Council views on the extent of their current involvement in education and training support for young people
29. Strategies used by councils to communicate with young people
30. Strategies used by councils to consult with young people
31. Strategies used by councils to involve young people in the decision-making processes of council
32. Extent of support to coordinate youth services
33. Council views on effectiveness of coordination of local youth services
34. Council mechanisms to coordinate or integrate services for young people
35. Council partnerships to provide services and supports for young people
36. Council views on importance of access to local data for youth service planning.
37. Council rating of importance of access to evidence-based interventions
38. Data used by councils to support local youth service planning
39. Sources of data expertise used by councils
40. Council access to skills/knowledge to make good use of available data
List of Figures and Tables 7

GlossaryCALD community Culturally and linguistically diverse
Cluster management arrangements
Kindergarten cluster management brings together a group of community managed kindergartens under the management of a single organisation. This organisation has responsibility for employment of staff, licensing requirements and financial management.
Commonwealth Priority Access guidelines
Where there are waiting lists for child care services, the Commonwealth Government has priority of access guidelines for allocating places, as part of providing fair access. These guidelines only apply to approved child care.
Growth corridor councils
Growth corridor councils are those that have been identified by government as being located in areas of significant population growth. They are Cardinia, Casey, Hume, Melton, Whittlesea and Wyndham.
Interface councils Interface councils are defined as the growth corridor councils plus three additional councils: Casey, Hume, Cardinia, Melton, Whittlesea and Wyndham, plus Mornington Peninsula, Yarra Ranges and Nillumbik.
Mainstream services Services available to all children but not used by all e.g. childcare. (See also universal services and targeted services.)
Metropolitan fringe councils
Metropolitan fringe councils are those located immediately outside the boundaries of Melbourne city: Baw Baw, Hepburn, Macedon Ranges, Mitchell, Moorabool and Murrindindi shires.
Municipal Early Years Plans (MEYPs)
MEYPs are local area strategic plans for development and coordination of early education, care and health services, activities and other local developments for young children.
Targeted services Services available only to particular groups of children, e.g. disability programs. (See also mainstream services and universal services.)
Universal services Services that all children are expected to use, e.g. maternal and child health services, primary school. (See also mainstream services and targeted services.)
Use and Development (U&D) Agreement with schools
Agreements are made between schools and local councils for communities to use school facilities and buildings. These partnerships range from hiring out school basketball courts on weekends to schools and communities working together to develop new shared facilities.
Victorian Local Government Support for Children, Young People and Their Families 8

List of Programs and ServicesAustralian Bureau of Statistics (ABS)
The ABS is Australia’s national statistics service.
Australian Early Development Index (AEDI)
The AEDI is a population measure of children’s health and development in communities across Australia.
Access for All Abilities Access for All Abilities is a Victorian government initiative coordinated by Sport and Recreation Victoria, which supports and develops inclusive sport and recreation opportunities for people with a disability throughout Victoria.
Best Start Best Start is a Victorian government early years initiative. It supports families, caregivers and communities to provide the best possible environment, experiences and care for young children in the important years from pregnancy to school.
Better Youth Services Pilot (BYSP)
In 2008, by the Victorian Government funded six local councils as Better Youth Services Pilots (BYSP). Each pilot aimed to improve the current arrangements for early identification of risk for vulnerable young people, collection of youth services data and youth service delivery at the local level.
Building Bridges Cultural Games Program
This program promotes cultural awareness and tolerance in primary schools.
Child FIRST Child FIRST provides a single-entry point into family services for vulnerable children and their families, with the aim of preventing reports to Department of Human Services, Child Protection Unit.
Centrelink A Commonwealth Government’s statutory agency, delivering a range of services, including welfare payments and pensions to Australians.
Communities for Children
A Commonwealth Government program spanning urban, regional and remote areas across Australia. Communities have been selected on the basis of a range of information, including population data, community, consultations with state and territory governments and indicators of disadvantage. There are eight funded sites in Victoria: Bendigo, Brimbank, Cranbourne, East Gippsland, Frankston North, Greater Dandenong, Hume/Broadmeadows and Swan Hill/Robinvale.
Early Childhood Intervention Services (ECIS)
ECIS are funded by the Victorian Government to support children with a disability or developmental delay and their families from the child’s birth to school entry. They provide special education, therapy, counselling, service planning and coordination, assistance and support to access services such as kindergarten and child care.
Early Start Kindergarten
The Victorian Government funds organisations, including councils, to provide free kindergarten programs for 3-year-old children known to Child Protection and 3-year-old Indigenous children.
List of Programs and Services 9

Family day care Family day care is a home-based childcare service providing care for children in the homes of family day care carers, supported by a local specialist coordination and resource team.
FReeZA FReeZA is a youth development program providing young people aged 12–25 years with the opportunity to attend affordable and accessible music and cultural events in safe, fully supervised drug, alcohol and smoke-free venues across Victoria.
How R U? survey A DEECD-administered health and wellbeing survey completed in 2010 by 10,000 Victorian secondary school students in Years 7, 9 and 11.
Kindergarten In Victoria, kindergarten has traditionally been a 10 hours per week/40 weeks per annum education program provided in the year prior to school entry. Over recent years, kindergarten has also included an unfunded year, usually referred to as three-year-old kindergarten. Reference is often made to three-year-old programs rather than three-year-old kindergarten on the basis that there is no government requirement that this is delivered by a qualified kindergarten teacher.
Local Learning and Employment Networks (LLENs)
LLENs have operated throughout Victoria from 2002 to better connect local groups to improve education, training and employment options for 10–19 year olds. They connect employers, education and training providers, government groups, agencies and individuals to help turn business and community needs and ideas into new and innovative programs for young people.
Long day care Long day care is a centre-based form of child care service. Long day care services provide all day or part-time care for children of working families and the general community. Private operators, local councils, community organisations, employers or non-profit organisations may run these services. Long day care services may also provide care for school children before and after school and during school holidays.
Maternal and Child Health Services
A free support service for all mothers and babies from birth to age 6 living in Victoria. Locally based maternal and child health nurses provide parents with support, information and access to professional advice on everything from child behaviour and nutrition to breastfeeding and family planning. The service is jointly funded by the Victorian government and local councils and is usually operated by local councils.
Municipal Association of Victoria (MAV)
The MAV works to represent, promote and advance the interests of Victorian local government.
National Early Years Learning Framework
The Early Years Learning Framework is part of the Council of Australian Government’s (COAG) reform agenda for early childhood education and care and is a key component of the Commonwealth Government’s National Quality Framework for early childhood education and care.
Neighbourhood houses
Neighbourhood houses are local organisations that provide social, educational and recreational activities for their communities sometimes, sometimes providing early years programs.
Neighbourhood Renewal
Neighbourhood Renewal is a Victorian government initiative aiming to narrow the gap between disadvantaged communities and the rest of the state. It brings together residents, governments, businesses and community groups to tackle
10 Victorian Local Government Support for Children, Young People and Their Families

disadvantage in areas with concentrations of public housing and aims to create vibrant and liveable communities.
Occasional care Occasional care is centre-based child care that supports families by providing flexible care for children. Families can access occasional care regularly on a sessional basis, or irregularly. It allows the flexibility to leave children for short periods of time in an early childhood learning environment to socialise and interact with other children.
Office for Youth (OFY) The Office for Youth is a key government agency driving a whole-of-government agenda in relation to Victorians aged 12–25 years. It is responsible for policy advice, research and strategic planning relating to government policies, programs and service delivery for young Victorians. At the time of the survey, it was located in the Department of Planning and Community Development (DPCD) and post-November 2010 became part of the Department of Human Services (DHS).
Outside-school-hours care (OSHC)
Outside-school-hours care (OSHC) programs provide care for primary school age children outside school hours and during school vacations. Care is also often provided on student-free days. OSHC programs may also be offered in locations such as community centres, halls, neighbourhood houses or recreation centres.
Playgroups Playgroups are for infants, toddlers and preschoolers and their parents or caregivers. Around 50,000 children from 40,000 families go to playgroup in all corners of Victoria at community venues, such as maternal and child health centres, kindergartens, halls, community centres, primary schools and aged care facilities. Playgroups are informal, low cost and run by the parents and caregivers. Supported playgroups can include a paid facilitator. Adults stay with their children at playgroup, which gives them the chance to meet other people going through similar experiences and ease the isolation that can come with caring for young children. Families can be gently introduced to community, health and support services while they are at playgroup (Source: Playgroup Victoria website).
Preschool field officers (PSFOs)
The main role of the Preschool Field Officer is to support the access and participation of children with additional needs in kindergarten. They support children with a range of developmental concerns and additional needs who are usually not receiving supports from Early Childhood Intervention Services or kindergarten inclusion support service packages.
Primary Care Partnerships
Primary Care Partnerships (PCPs) are voluntary alliances of primary care providers usually covering two or three local government areas. PCPs aim to improve the health and wellbeing of their catchment’s population by better coordination of planning and service delivery in response to identified needs.
Reconnect Program The Reconnect program is a Commonwealth government program that uses community-based early intervention services to assist young people aged 12–18 years who are homeless, or at risk of homelessness, and their families. Reconnect assists young people stabilise their living situation and improve their level of engagement with family, work, education, training and their local community.
List of Programs and Services 11

Regional Youth Affairs Networks (RYANS)
The Victorian Government’s Regional Youth Affairs Networks (RYANS) gives young people the opportunity to have a say about keeping government services and programs relevant and useful to young people. It’s a way for young people to express their views and ideas, be heard by the community and take part in decision-making and change.
Services for families with children
These services include parenting education, counselling, outreach and home support, among others.
School-focused Youth Services (SFYS)
School Focused Youth Service is a statewide initiative supporting prevention and early intervention strategies for vulnerable young people 10–18 years (with a focus on 10–16 years).
Supported Parents and Playgroup (SPPI)
The Supported Playgroups and Parent Groups initiative is a Victorian government initiative aiming to provide quality play opportunities at a critical time in a child’s development. These opportunities foster children’s language development, develop motor skills, expose them to sensory experiences and enhance their social skills. It also provides families with opportunities to establish friendships and long-term social support structures and develop parenting skills, capacity and confidence.
Take a Break This program provides a two or three day holiday for people with a disability, while giving respite for families/carers at the same time.
Universal access to preschools
Universal access to preschools is a COAG initiative for ensuring the national provision of 15 hours of preschool per week/40 weeks in the year prior to school entry. It is to be implemented by 2013.
Victorian Child and Adolescent Monitoring System (VCAMS)
VCAMS provides a comprehensive overview of the way in which the service system, the community and the family all interact to determine the wellbeing of children, and provides an evidence base for government planning and intervention.
Victorian Early Years Learning and Development Framework
Released by DEECD in 2009, it provides both a framework and guidelines to advance children’s learning and development from birth to eight years by early childhood professionals working together, and with, families, to achieve common outcomes for children.
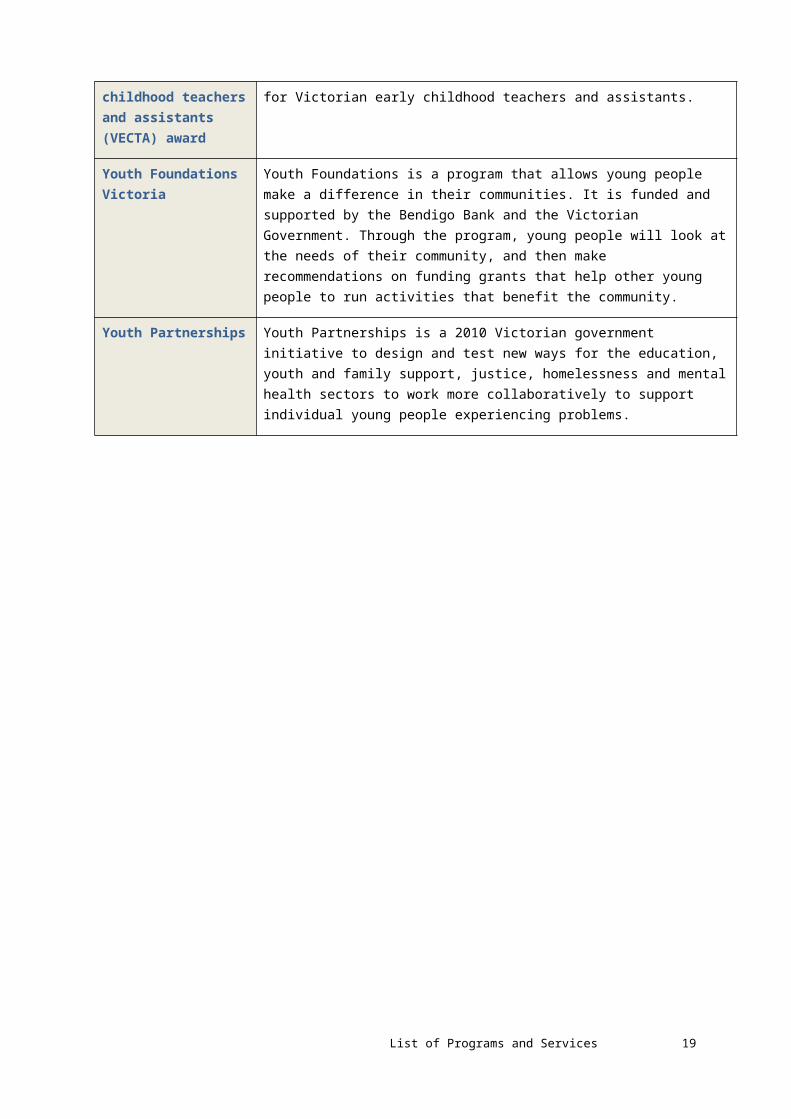
Victoria early childhood teachers and assistants (VECTA) award
VECTA is the industrial award covering pay and conditions for Victorian early childhood teachers and assistants.
Youth Foundations Victoria
Youth Foundations is a program that allows young people make a difference in their communities. It is funded and supported by the Bendigo Bank and the Victorian Government. Through the program, young people will look at the needs of their community, and then make recommendations on funding grants that help other young people to run activities that benefit the community.
Youth Partnerships Youth Partnerships is a 2010 Victorian government initiative to design and test new ways for the education, youth and family support, justice, homelessness and mental health sectors to work more collaboratively to support individual young people experiencing problems.
12 Victorian Local Government Support for Children, Young People and Their Families

Executive SummaryThis MAV–DEECD survey provides a snapshot of the extent of local government support for children and young people (0-25). It was undertaken to improve the evidence base for future state and local government planning. All 79 Victorian councils completed the survey. This report:
updates information on council support for young children (0–8 years) collected in the 2006 MAV–DEECD survey
extends the collection of data on council support to children 0–12 years, including support for children with disabilities, families with children and coordination and planning activities
provides a statewide picture of local government support for young people for the first time.
The findings are presented in two parts: Services for children 0–12 years (Part A) and Services for young people 13–25 years (Part B). Data is mainly presented according to overall trends across all 79 councils. Additional analysis is provided in the report on any differences in five groupings of councils:
comparing metropolitan with rural councils growth area with other metropolitan councils interface with other metropolitan councils metropolitan fringe with other councils Best Start councils compared to other councils.
Both Parts A and B of this report begin with an overview of the findings followed by more detailed data presentation, usually in the order in which the survey questions were organised.
Children 0–12 years (Part A)A distinction is made between early childhood settings attended by children, including kindergarten and child care, and other types of services provided to children and their families.
Early childhood settingsData was collected on the following early childhood settings:
four-year-old kindergarten three-year-old kindergarten neighbourhood houses that operate early years programs long day care occasional (limited hours) care family day care outside-school-hours care (OSHC) playgroups.
Victorian Local Government Support for Children, Young People and Their Families 13

The main issues covered in relation to these settings were:
whether councils provided any support the type of support provided, including ownership of the premises, licensee status,
provision of central enrolment, training and resourcing of staff, maintenance of facilities, financial grants and, in the case of four-year-old kindergartens, cluster management
any changes in support, drawing on 2006 survey data when available and on councils’ responses to a question in this 2010 survey on any major changes in support over the past three years.
The detailed findings in relation to each early childhood setting are provided in the report. Overall, the survey findings reinforced the 2006 survey finding that councils have a major involvement in supporting these settings, ranging from 95 percent of councils for four-year-old kindergarten to 40 percent of councils supporting outside-of-school hours care.
Councils reported a mixture of decreased and increased support. Decreased support was most notable in the withdrawal of support for outside-school-hours care, occasional care and family day care. There was also a reduction in the number of councils supporting neighbourhood houses with early years programs, but it is not clear whether this was a result of neighbourhood houses withdrawing from early years programs or councils withdrawing support from neighbourhood houses.
In contrast, an increased number of councils reported involvement with three-year-old programs and playgroups. Councils also reported increased involvement in kindergarten and child care related to council taking on additional responsibilities in what they reported as an increasingly complex environment. Changes were driven by shifts in government policies (such as universal access to preschool and changed children’s services regulations) and increases in local demand due to population changes.
Other services for children (0–12 years)Data was collected on a range of other services provided to children and their families, with a particular focus on the following groupings:
early childhood intervention services (ECIS) for children with disabilities or developmental delay
support services and programs for families with children services and supports for children in the middle years.
This was largely new data, with detailed questions on these services not covered in the 2006 survey; again, this data is reported in the body of the report.
Early childhood intervention services Disability support data collection was in the areas of employment of staff with specialist roles, specialist service provision, in-home support/respite and major changes over the past three years.
Overall, just over half of councils reported that they provide some level of support for children with disability/developmental delay and their families. There was considerable variety in the type and level of support reported. For example, in-home/respite support was provided by 44 percent of councils. The 11 councils able to report an allocated maximum number of hours of care provided per week per family reported maximum hours varying from 1.5 hours per month to 14 hours per week.
14 Victorian Local Government Support for Children, Young People and Their Families

Twelve councils reported changes in support over the past three years, highlighting shifts in auspice/administrative arrangements, growth in demand for support and areas of increased council involvement.
Families with children (0–12 years)This is new data and covers main types of support, language groupings provided with language support, policies to support vulnerable families (including linking with universal early years services) and major changes in council support over the past three years.
Most councils (82 percent) reported some level of support. The two activities supported by a majority of councils were active linking of vulnerable families to universal early years services and parenting education. Just under one-third of councils indicated an increased involvement by councils in this area.
Children in the middle years (8–12 years)The purpose of questions in this section was to get an overview of the extent to which local government had initiatives in this area and the extent to which they felt they needed to be more involved.
Just under half of councils had initiatives in this area, while just under two-thirds indicated that this was an area where more work needed to be done. Initiatives included extending youth services to a younger age group, for example down to 10 years, and provision of a range of services that covered both children in the middle years age group and younger children, such as school holiday programs.
Major concerns identified by councils included a lack of programs, insufficient funding/resources, lack of strategic service planning and transition to secondary school being problematic for some young people.
Coordination and planning activities Data was collected in relation to the extent of coordination and planning, mechanisms used, co-location and integration of services, partnerships with primary schools, access to data for planning, high needs groups, Best Start networks and major changes over the past three years.
Seventy percent of councils reported that they had a major role in coordinating early childhood settings and services, with 40 percent of councils also reporting that coordination presented major challenges. Most councils identified the importance of local population data to support planning efforts for children as being high, but just over 25 percent rated their skills and knowledge to use the data as being high. Just under half of councils also identified gaps in the available data.
Over 40 percent of councils identified major changes in their coordination roles over the past three years, citing changes in local demands, new government demands and opportunities arising from State and Commonwealth government funding.
Executive Summary 15

Young people 13–25 years (Part B)A summary of findings is provided under the following headings:
Main service areas supported by local government Investment in youth services Communication, consultation and participation strategies Coordination and planning of services for young people.
Main service areas supported by local governmentCouncils were asked to report on their support for 25 different services for young people. The findings ranged from most councils providing support for music/cultural events for young people to a minority (11 percent) providing support for the Reconnect Program. In addition to music/cultural events, a majority of councils also reported supporting education and training, programs at recreational facilities, leadership programs and youth festivals (not music/cultural). A majority of councils also reported providing support for young people disengaged from education and work and young people in the youth justice system.
Councils in rural Victoria were much less likely than metropolitan councils to provide support for the range of services, in some service areas being two or three times more likely to do so. There were also some differences identified among the other three groupings of councils: growth corridor, interface and metropolitan fringe.
Investment in youth servicesCouncils reported on their recurrent/operational expenditure for providing or funding specific services for young people for 2010–11, which included funding from all sources. Their level of expenditure was reported in $250,000 ranges, beginning with $0–$250,000 as the bottom category of expenditure and finishing with $2m+ as the top range. They also reported on the number of effective full-time (EFT) positions involved in supporting young people, in categories beginning with 1–2 staff, progressing in increments of two staff and finishing with the category of more than 10 staff.
Over two-fifths of councils (34) reported annual expenditure in the $0–250,000 range, with all being rural councils. Fewer than 5 percent of councils had recurrent annual expenditure over $1.25m. There was a related pattern in employment of effective full-time staff, with just over a half of councils employing 1–2 staff and a minority of councils with staffing numbers of three or more. Some 15 percent of councils employed more than 10 staff.
The largest contributors to annual recurrent expenditure on youth services were councils themselves, with about two-thirds of councils reporting provision of more than half the expenditure. The Victorian Government was the next major source, while the Commonwealth Government and other sources provided minor levels of funding.
The majority of councils reported no change in investment over the past three years; over two-fifths of councils reported that investment had increased; and only one council reported a decrease in investment.
16 Victorian Local Government Support for Children, Young People and Their Families

Communication, consultation and participation in decision-making strategiesCouncils reported on their strategies in three areas: communication, consultation, and participation in council decision-making.
They reported on nine main forms of communication strategies, including the use of flyers, website, social networking media (including Facebook and Twitter), text messaging, service directories, noticeboards, youth information centre, fact sheets and youth newsletters. Most councils (83 percent) reported that they had some strategies for communicating with young people. A majority of councils reported the use of flyers, websites, social networking media and text messaging.
Councils reported on whether they engaged in four main types of consultation strategies with young people: forums, surveys, focus groups and the use of suggestion boxes.Overall, most councils (85 percent) reported the use of consultation strategies, with the majority using forums, surveys and focus groups.
Councils reported on five main participation strategies for engaging young people in decision-making in council: organising events, youth councils, youth advisory groups, youth working groups and youth reference groups. Just under three-quarters of councils reported they had strategies in place to actively involve young people in their decision-making processes. The majority of councils also used the strategy of involving young people in events and a minority of councils used the other strategies listed in the survey.
A majority of councils reported increases in communicating and engaging with young people over the past three years. The most commonly mentioned strategies were use of social networking media, youth advisory processes and the development of a youth charter, plan or strategy.
Coordination and planning of services for young peopleCouncil reports of their coordination and planning efforts are summarised under the following headings:
Overall assessment of local coordination efforts Mechanisms to promote coordination Data to support planning/coordination.
Overall assessment of coordination effortsCouncils rated the extent of their support for coordination and a view of the effectiveness of local coordination efforts (not the effectiveness of council coordination efforts).
A majority of councils reported that they had a major role in coordinating youth service provision. Only four councils said they had no role, and the remaining councils reported a minor role. A majority of councils also reported that coordination presented minor challenges, just under one-third reporting major challenges, and 15 percent reported that it was well done. Major challenges identified included coordination itself as a complex task, lack of funds/resources and problems in delivering to a diverse population.
Executive Summary 17

Mechanisms to promote coordinationCouncils reported on 17 different types of coordination mechanisms, ranging from broad processes (e.g. facilitating community connections) to more narrow mechanisms (e.g. formal contracts with service providers and service protocols for intake and referral).
Most councils reported the use of multiple mechanisms, with facilitation of community connections, fostering local service networking and adoption of a strategic or broad action plan the three most commonly cited.
Councils were also asked to identify whether they collaborated with 14 different types of partners. Most identified secondary schools, Local Learning and Employment Networks (LLENS) and Victoria Police; and a majority nominated DEECD, non-government organisations, alcohol and other drug services, Department of Human Services (DHS), mental health services and TAFEs.
Over 40 percent of councils reported increased involvement in coordination activity over the past three years, including new staffing positions, development of an updated youth strategy, introduction of new consultation and planning groups, new programs and services and participation in Victorian government funded better youth service pilots.
Data to support local planning/coordinationCouncil reports of their use of data to support local planning/coordination are provided under the following headings:
Importance of data Sources of data Data access Gaps in data.
Importance of dataMost councils (80 percent) rated data as being of high importance. Similarly, a majority of councils rated access to evidence on types of interventions that work as being of high importance.
Sources of dataCouncils reported on the data sources they accessed to support local planning for youth services. Most councils (95 percent) nominated ABS data, while sizeable minorities also identified Centrelink, Victorian Child and Adolescent Health System (VCAMS) population data, other Victorian government data sources and local sources.
Data accessCouncils reported on access to the skills/knowledge to make good use of available data. Most councils (95 percent) nominated reliance on the expertise of council employees, but also nominated partners, consultants and Victorian government departments.
Councils rated their level of access to data for planning services for young people as high, medium or low. The majority reported only medium access, with over one-third reporting high level access.
18 Victorian Local Government Support for Children, Young People and Their Families
Gaps in data Just under half of councils reported major gaps in the data available, nominating lack of information on specific topics, not being well tailored to the particular local government area, not being up-to-date and problems in using it.
Conclusion The data presented in this report highlights:
the broad extent of council support for children and young people the variability in council support across councils, with rural councils also being less
involved in the full range of services for children and young people a mixed picture of increased and decreased involvement in council support for
children, with increased involvement linked to changes in local demands and Victorian and Commonwealth government requirements
increased involvement in providing services to young people by about two-fifths of councils.
Executive Summary 19

1. Introduction This is a research report by the Victorian Department of Education and Early Childhood Development (DEECD) and the Municipal Association of Victoria (MAV) on the extent of local government support for children and young people 0–25 years of age. It is based upon a survey completed by all 79 Victorian councils in the second half of 2010, and supplemented by additional information held by the Victorian Government.
A 2006 survey conducted by MAV and the Department of Human Services (DHS) established for the first time a broad picture of the extent of local government support for young children (0–8 years) and their families. The 2010 survey replicated questions asked in 2006 in relation to early childhood, while seeking additional data in relation to children 0–12 years in the following areas:
children with disabilities services to families with children planning and coordination functions.
In addition, and for the first time, the survey set out to establish the extent of local government support for young people (13–25 years).
The remainder of this introductory section covers the policy context in which this survey was undertaken; method and content of survey; data presentation in this report, governance arrangements for the study; and strengths and limitations of the survey.
1.1 Policy contextIn Victoria, local government is a major provider, planner and coordinator of services for children and their families, though there is wide variation between councils in the nature and degree of that support. Some councils also provide significant support for young people and their families, though traditionally this has been less extensive and even more variable across councils than has been support for children.
Planning efforts between local councils and the Victorian Government have intensified over the past five years with the establishment of a forum for the purpose of fostering improved planning. As noted in the foreword, a partnership agreement between the MAV and DEECD was signed in 2009 as a formal recognition of the increasingly close planning relationship between the Victorian and local government. As part of developing a stronger evidence base for joint planning, this survey was identified as one of a list of actions to be undertaken as part of the agreement.
1.2 Method and content of surveyThe survey itself was conducted by DEECD as a web-based questionnaire that was completed by local council staff. Consultation on survey content and delivery involved the following processes:
an MAV–DEECD Steering Committee was established to oversee the project and provide initial advice
meetings were held with key personnel in DEECD, the Department of Planning and Community Development (DPCD) and DHS to gain their input into the scope of the survey
Introduction 20

representatives of the five councils on the project Steering Committee reviewed a draft of the survey
the five councils represented on the Steering Committee conducted two pilots:o a paper version of the survey to finalise survey content
o an online version of the survey to finalise the online version and to test its ease of use.
1.3 Data presentation in the reportData is reported on in two parts – children 0–12 years and young people 13–25 years – with both parts providing an overview of the data, followed by more detailed reporting in individual sections.
In the overview sections the data is presented in relation to:
trends in the data across all councils rural–metropolitan comparison growth and interface groupings compared to other metropolitan councils metropolitan fringe councils compared to other councils.
This report also includes data on two services not included in the survey as government already held the data: Maternal and Child Health Service and the FReeZA program.
1.4 Governance of the surveyThe survey was overseen by a Steering Committee, chaired by MAV, comprising MAV, DEECD, DPCD (Office for Youth), DHS and five councils nominated by MAV. Its role was to provide oversight of the development and implementation of the survey, the final report and planning of knowledge dissemination/translation activities.
1.5 Strengths and limitations of surveyAs with the 2006 survey of local government, survey questions were deliberately restricted to those where councils were likely to have ready access to the data to provide responses. The advantage of this approach was a fairly quick turnaround of this request for information. The limitation was that the survey does not provide data at the level needed for detailed planning. Overall, the data is best perceived as being indicative of the broad level of activity of councils in supporting children, young people and their families.
The strength of using an online survey was the ease of completion and the built-in feature that all questions needed to be answered before proceeding to a next section of the survey. Four councils, however, experienced technical difficulties in completing the survey online and completed a paper version.
In addition, there is inevitably a small margin of error in reporting data from a self-completion survey, either because of ambiguities in the phrasing of questions or errors in completing the survey. Every care has been taken to minimise such errors, including pilot testing of the survey and cross-checking survey data with government records where possible. An example of this last quality control measure was to cross-check councils indicating in the survey that they had a Best Start initiative against government records of funding councils for Best Start.
Executive Summary 21

2. Part A: Services for children (0–12 years)2.1 Overview of findings This overview presents overall research findings in relation to council support for children (0-12) under the following headings:
Main areas of council involvement Changes in council involvement Council ownership of facilities Rural and metropolitan differences Growth corridor, interface and metropolitan fringe councils.
Main areas of council involvementCouncils were asked to provide information on the extent of their involvement in supporting children in the following areas:
four-year-old kindergarten three-year-old programs neighbourhood houses that operate early years programs long day care occasional (limited hours) care family day care outside-school-hours care playgroups early Intervention Services (ECIS) for children with disabilities/developmental delay support services and programs for families with children coordination and planning of services for children and their families services and supports for children in the middle years.
Figure 1 presents an overview of the extent of local government involvement in the main early childhood settings attended by children other than schools, from most to least frequent. Most councils provide some level of support for kindergartens and playgroups. The majority of councils also provide support for long day care and occasional care. Fewer than 50 percent of them provide support for neighbourhood houses with early years programs, outside-school-hours care and family day care.
Figure 2 presents an overview of other services for children provided and supported by local government. All councils support maternal and child health services, though a few councils have sub-contracted this work. The majority of councils provide children’s libraries, toy libraries and early childhood intervention services for children with disabilities or a developmental delay. Other children’s services are supported by a minority of councils.
Part A: Services for children (0–12 years) 22
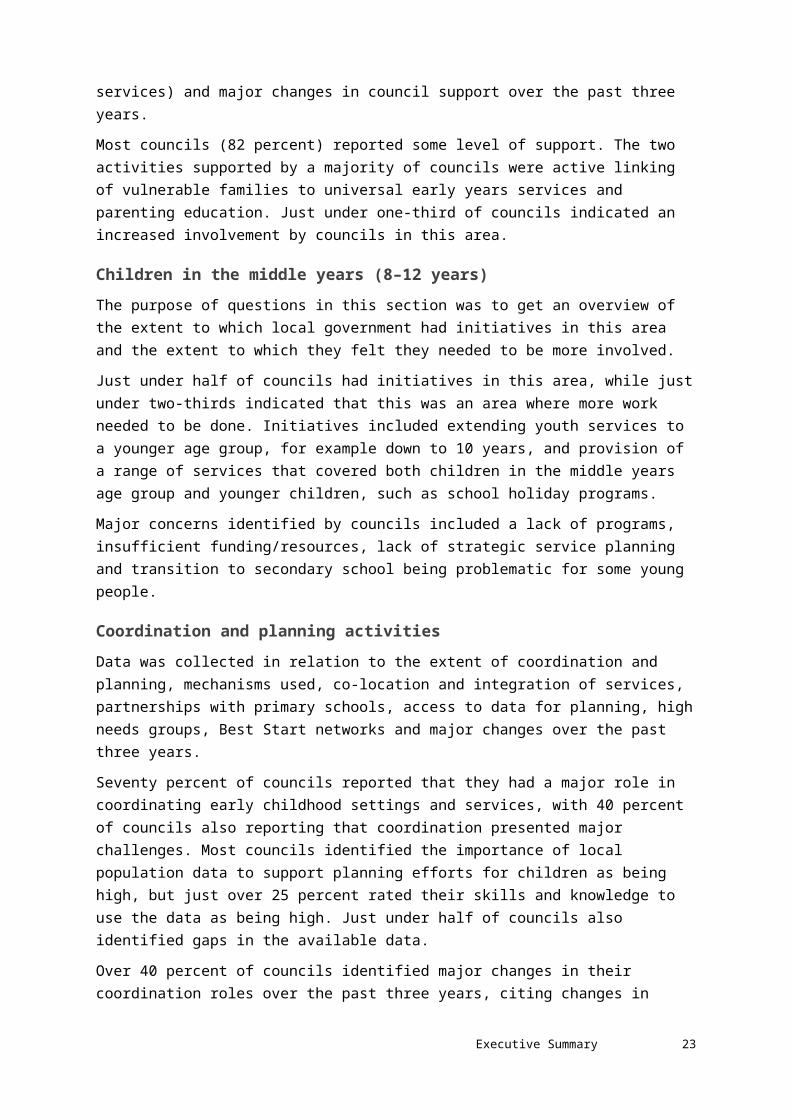
Figure 1: Early childhood settings supported by local government
4-yr-old kin
dergtn
Playgro
ups
Family
day car
e
3-yr-old progra
ms
Long day
care
Occasio
nal care
Neigh. houses
(early
years
)
Outside-s
chool-hours c
are
0102030405060708090
100Pe
rcen
tage
of c
ounc
ils
Figure 2: Children’s services supported by local government
Maternal and Child Health
Toy library
ECIS services
Participation in physical activities
Holiday programs primary school
Other partnerships with schools
Use & development agreements schools
Early Years Neigh. Renew
Child car safety harness
0 10 20 30 40 50 60 70 80 90 100
Percentage of councils
:
Part A: Services for children (0–12 years) 23

Changes in council involvementTwo sources of data were used here: changes between what councils reported in the 2006 and 2010 surveys (a period of four years) and council responses to a question asked in the 2010 survey of whether there had been any major changes in support over the past three years. Comparisons between the 2006 and 2010 surveys are mainly restricted to questions about council support for early childhood settings (0–8 years) as other areas were not covered in the 2006 survey.
Changes identified comparing 2006 and 2010 surveysThe main change from 2006 was that fewer councils reported providing support for the following early childhood settings:
neighbourhood houses with early years programs (18 fewer or 23 percent) outside-school-hours care (15 fewer or 19 percent) occasional care (8 fewer or 10 percent) family day care (7 fewer or 9 percent) four-year-old kindergarten (1 fewer or 1 percent).
Seven additional councils reported being involved in three-year-old programs, three in playgroups, with unchanged numbers since the first survey for long day care. The details of differences in council involvement are provided in later sections of the report.
Major changes in support over the past three yearsCouncils were asked whether there had been major changes in their support for a range of early childhood settings and services. Their responses are summarised in Figure 3 below. The percentage of councils involved in each of these areas is provided as a context in which councils identified major changes.
Figure 3: Major changes in council support for early childhood settings and services for children (0–12)
4 yr old ki
nder
Playgro
ups
Familie
s with
child
ren
Family
Day Care
3 yr old porgr
ams
Long D
ay Care
Occasio
nal car
e
Early
Inter
ventions S
ervice
s
Neigh Houses
EYP
Outside S
chool H
ours Care
0102030405060708090
100
Percentage supported by CouncilPercentage of councils identified changes in support in past 3 years
Pece
tnag
e of
cou
ncils
24 Victorian Local Government Support for Children, Young People and Their Families

Over one-third of councils identified major changes in support for four-year-old kindergartens and playgroups, often involving increased council support. The major exceptions to increased support identified were in areas where councils have withdrawn from providing any type of support, as discussed.
Council ownership of facilitiesCouncils were asked whether they own the facilities which children attended in a range of early childhood settings in both the 2006 and 2010 surveys. Council responses are summarised in Figure 4.
Figure 4: Council ownership of facilities in 2006 and 2010 surveys
4-year-o
ld kinderg
tnPlayg
roups
Long day c
are
Occasional c
are
Neigh. houses
(early y
ears)
Outside-sc
hool-hours care
0102030405060708090
100
2006 survey2010 survey
Perce
ntag
e of c
ounc
ils
In 2010, most councils reported owning the facilities at which four-year-old kindergarten programs operate; and a majority also reported owning the facilities out of which playgroups, long day care and occasional care operate. In terms of change between the 2006 and 2020 surveys, the number of councils owning facilities at which four-year-old kindergarten and long day care is provided had increased slightly. In contrast, the number of councils owning facilities at which occasional care, neighbourhood houses with early years programs and outside-school-hours care had decreased markedly. No question was asked in the 2006 survey on whether councils owned the facilities at which playgroups were provided, so comparisons cannot be made.
Part A: Services for children (0–12 years) 25

Rural and metropolitan differencesFigure 5 compares the extent to which metropolitan and rural councils support universal and mainstream provision of early childhood settings. Metropolitan councils are more likely than rural councils to provide support for most early childhood settings, with the exception of three-year-old programs.
Figure 5: Rural and metropolitan council involvement in early childhood settings
4-yr-old kindergt
nPlayg
roups
Family d
ay care
3-yr-old program
s
Long day care
Occasional ca
re
Neigh. houses (
early ye
ars)
Outside-school-hours ca
re
0102030405060708090
100
MetropolitanRural
Perce
ntage
of cou
ncils
Figure 6 compares the extent to which metropolitan and rural councils support a broad range of early childhood services. Most metropolitan councils were more likely than rural councils to provide support for children’s services. The major exception was that rural councils were more likely than metropolitan councils to be involved in primary care partnerships with a focus on the early years.
Figure 7 compares ownership of buildings used as early childhood settings between metropolitan and rural councils. Metropolitan councils are more likely to own buildings for early childhood settings, with the more major differences in neighbourhood houses, occasional care and long day care.
26 Victorian Local Government Support for Children, Young People and Their Families

Figure 6: Rural and metropolitan council involvement in children’s services
Maternal and Child Health
Toy library
ECIS services
Participation in physical activities
Holiday programs primary school
Other partnerships with schools
Use & development agreements schools
Early Years Neigh. Renew
Child car safety harness
0 10 20 30 40 50 60 70 80 90 100
RuralMetro
Percentage of councils
Figure 7: Rural and metropolitan council ownership of buildings operating as early childhood settings
4-year-
old kinder
Playgro
ups
Long day
care
Occasio
nal care
Neigh. houses
(early
years
)
Outside-s
chool-hours c
are
0102030405060708090
100
Metro Rural
Perc
enta
ge o
f cou
ncils
Part A: Services for children (0–12 years) 27

Growth corridor, interface and metropolitan fringe councilsThere is an obvious policy and planning interest in children’s services provision in both growth corridor and metropolitan fringe councils. Differences in patterns of council involvement are examined below where councils in growth and metropolitan fringe councils had either much higher or much lower rates of involvement.
Growth corridor councilsThese councils are Cardinia, Casey, Hume, Melton, Whittlesea and Wyndham. Because all of these six councils are metropolitan councils, they are compared to other metropolitan councils rather than all councils. These councils had a similar pattern of support for most early childhood services and settings to other metropolitan councils. The main exceptions where growth corridor councils were more likely to be involved were as follows:
outside-school-hours care (100 percent compared to 52 percent of other metropolitan councils)
support for children with a disability or developmental delay (100 percent compared to 52 percent of other metropolitan councils)
holiday programs for primary school children (100 percent growth compared to 48 percent of other metropolitan councils)
Best Start (100 percent compared to 52 percent of other metropolitan councils).
Interface councilsThis grouping is comprised of the growth corridor councils plus three additional councils: Mornington Peninsula, Yarra Ranges and Nillumbik. Not surprisingly, the major differences between these councils and other metropolitan councils were similar to the growth corridor–metropolitan council comparison, although the proportions changed slightly:
outside-school-hours care (89 percent compared to 50 percent of the other councils) holiday programs for primary school children (78 percent compared to 50 percent of
other metropolitan councils) Best Start (100 percent compared to 18 percent of other metropolitan councils).
One other change was that the differences in proportions of councils providing support for children with disabilities/ developmental delay became minor.
Metropolitan fringe councilsThese councils are Baw Baw, Hepburn, Macedon Ranges, Mitchell, Moorabool and Murrindindi shires. Compared to other councils, these councils had a similar pattern of support for most early childhood services and settings. However, there were areas where these councils were more likely to be involved:
primary care partnerships, with a focus on the early years (100 percent compared to 38 percent of other councils)
baby capsule loan/hire scheme (50 percent compared to 27 percent of other councils).
28 Victorian Local Government Support for Children, Young People and Their Families
There were also areas where these councils were less likely to be involved as follows:
support for long day care (33 percent compared to 75 percent of other councils) support for outside schools hours care (nil compared to 44 percent of other councils) child protection, family and early parenting services (nil compared to 52 percent of
other councils) preschool dental program (nil compared to 19 percent of other councils) toy library service (33 percent compared to 63 percent of other councils) holiday programs for primary school children (5 percent compared to 41 percent of
other councils) supporting participation in physical activities (5 percent compared to 49 percent of
other councils) services or programs for families with children (50 percent councils compared to 84
percent of other councils).
2.2 Detailed findingsDetailed findings are provided in this section under the following headings:
Four-year-old kindergarten Three-year-old programs Neighbourhood houses operating early years programs Long day care Occasional (limited hours) care Family day care Outside-school-hours care (OSHC) Playgroups Early childhood intervention services for children with disabilities/developmental
delay Support services and programs for families with children Coordination and planning of services for children and their families Services and supports for children in the middle years.
Four-year-old kindergartenAll but four councils provide support for four-year-old kindergarten. This section reports council support under the following headings:
Main types of support Central enrolment arrangements Differences in support for stand-alone kindergarten and those in long day care Other types of council support Changes between the 2006 and 2010 surveys Major changes over the past three years.
Part A: Services for children (0–12 years) 29

Main types of supportThe main types of involvement are summarised in Table 1, from highest to lowest percentage of support. Most councils provide some level of support for four-year-old kindergarten, with most councils owning and maintaining the facilities at which programs are conducted. The majority of councils also provide regular training and resourcing for staff, operate some form of central enrolment and provide other administrative support.
Table 1: Types of council involvement in four-year-old kindergarten
Support functions Number of councilsNo. ( percent)
Council ownership of facilities 74 (94)
Maintain facilities 72 (91)
Regular training and resourcing for staff 50 (63)
Central enrolment in some form 48 (61)
Any other administrative support 45 (57)
Financial grants for non-council kindergartens 37 (47)
Major changes in council support over the past three years
33 (42)
Approved cluster manager 27 (34)
Licensee for stand-alone kindergarten 27 (34)
Differences in support for stand-alone kindergarten and those in long day care
24 (30)
Licensee for kindergarten programs in long day care 20 (25)
Central enrolment arrangementsCouncil involvement in central enrolment in four-year-old kindergarten is reported in more detail in Table 2, from highest to lowest percentage. The most common form of involvement was to provide central enrolment for council services only. The other types of central enrolment arrangements identified by 12 councils were:
kindergarten services that request/volunteer for it kindergarten programs that are run in council-owned premises for not-for-profit and/or community-managed services for stand-alone kindergartens only for external agencies that provide central enrolment.
Table 2: Types of council involvement in central enrolmentProvision of central enrolment Number of councils
No. (percent)
No form of involvement 36 (46)Council services only 20 (25)
Other arrangements 12 (15)
All services 11 (14)
Total 79 (100)
30 Victorian Local Government Support for Children, Young People and Their Families
The increased complexity and demands of kindergarten management have coincided with parents having less time to offer. At our site, it is difficult to find volunteers to devote the time, and with the required skills to fill the roles: in effect, we are amateurs without the skills required to run a complex business. (Kindergarten President, Bass Coast)

Differences in support for stand-alone kindergarten and those in long day careJust under one-third of councils (30 percent) identified that they provide different support for stand-alone four-year-old kindergarten than for those kindergarten programs located within long day care. These differences in support are summarised as follows:
Fifteen councils (19 percent) reported that they provide higher levels of support for stand-alone kindergartens, with a number of councils linking this to their role as kindergarten cluster manager.
Six councils (8 percent) reported that they provide higher levels of support for kindergarten programs provided as part of long day care services, linked directly to councils’ direct management role in these services.
In the remaining three councils it was not clear whether council provided more support for stand-alone kindergartens or those provided in long day care settings. Comments were that they reserve support to council tenants; leave management of stand-alone kindergartens to their management committee; and that support relies on relationships, management structures and proximity rather than whether the program is provided in a stand-alone setting or in long day care.
Other types of council supportJust under two-thirds of councils also identified the following range of supports for four-year-old kindergartens:
teacher support to kindergartens through facilitating teaching networks staff training field officers for professional support and resources for teacher assistants financial support to kindergartens through sponsorship, grants and fundraising general advice and support for management and governance occupational health and safety support and other legal requirements IT systems and equipment playground and other maintenance upgrades.
Changes identified comparing 2006 and 2010 surveysThe following differences are identified in order of the numbers of councils affected (from highest to lowest):
financial grants to non-council services (12 fewer councils) regular training or resourcing of staff (6 additional councils) owner of facilities (2 additional councils) some level of involvement (1 fewer council).
Major changes over the past three yearsIn response to a question in the 2010 survey, just over two-fifths (42 percent) of councils identified increases in support for four-year-old kindergarten over the past three years, as follows:
commenced planning for Universal Access (11 councils) developed cluster management arrangements (6 councils)
Part A: Services for children (0–12 years) 31
established central enrolment (4 councils) reviewed their agreements, standards, projects and programs, including the
Kindergarten Management Agreement, Best Start Program, Victorian Early Years Learning and Development Framework, Victorian early childhood teachers and assistants (VECTA) award, licence agreements, Coalition of Australian Governments (COAG) reform agenda and Enterprise Bargaining negotiations
other increased support, such as increasing staff numbers, increasing financial support, management support, project support and administration support.
Three-year-old programsSeventy-five percent of councils indicated that they provided some level of support for three-year-old programs. This section reports council support under the following headings:
Types of council support Staff qualifications Changes between the 2006 and 2010 surveys Major changes over the past three years.
Types of council supportCouncils providing support for three-year-old programs were asked about the arrangements for three-year-old program provision, with their responses summarised in Table 3, from highest to lowest.
Table 3: Types of three-year-old provision in municipalitiesArrangements for three-year-old program provision
Number of councilsNo. ( percent)
Both in stand-alone and multi-age settings 26 (32)
Separate stand-alone provision 18 (23)
Multi-age settings 9 (11)
Don’t know 6 (8)No response 20 (25)
Total 79 (100)
The most common provision is a mixture of stand-alone and multi-age settings. Councils also provided a description of the type of support they provided to three-year-old programs, listed in order of frequency of provision:
a mixture of property and service support (15 councils) properties and deliver maintenance only (13 councils) directly provide three-year-old year programs (12 councils) service support and/or participation of committees of management only (10 councils) a mixture of other types of support, including two councils which reported Early Start
(9 councils).In addition, 35 percent of councils are a licensee for three-year-old programs and one-third also receive DEECD funding for Early Start kindergarten targeted at disadvantaged children.
32 Victorian Local Government Support for Children, Young People and Their Families
Staff qualificationsCouncils were asked whether staff providing three-year-old programs were qualified or unqualified, with their responses summarised in Table 4. The most common situation was for councils to support services planned and delivered by staff with an approved qualification (32 percent), although a slightly smaller proportion of councils (30 percent) also indicated that they employed at least some unqualified staff (combining responses to two categories in Table 4).
Table 4: Staff qualifications in council supported three-year-old programsStaff qualifications Number of councils
No. ( percent)
Planned and delivered by staff with approved qualifications
25 (32)
Planned and delivered by a mix of qualified and unqualified staff
20 (25)
Don’t know 9 (11)
Planned and delivered by staff without approved qualifications
4 (5)
No response 21 (27)
Total 79 (100)
Changes between the 2006 and 2010 surveysThere were an additional seven councils (9 percent) reporting involvement in supporting three-year-old programs.
Major changes in council support over past three yearsIn response to this question in the 2010 survey, just over one-quarter (28 percent) of councils reported major changes in support for three-year-old programs over the past three years, all involving some level of increased support. A major theme in comments was that, due to increased demand, there has been increased council support for three-year-old kindergartens; however, at the same time, they experienced problems delivering services due to increased demands/bureaucratic requirements flowing from both Victorian and Commonwealth government policy changes, particularly the national provision of 15 hours per week of four-year-old kindergarten (Universal Access). This has led to some councils developing alternatives to kindergarten where demand has exceeded supply, through initiatives such as activity groups and playgroups. Other councils have increased parent fees to cover increasing costs of supply.
Other additional involvements relating to three-year-olds were:
early start programs early years facilitators, education and early childhood support coordinators, central enrolment cluster management Best Start.
Part A: Services for children (0–12 years) 33
Neighbourhood houses operating early years programsForty-two percent of councils reported providing some level of support to neighbourhood houses with early years programs. This section reports council support under the following headings:
Main forms of support Other types of support Changes between the 2006 and 2010 surveys Major changes over the past three years.
Main forms of supportThe main types of involvement are summarised in the Table 5, from highest to lowest percentage of support. The most common council involvement was ownership of the buildings in which Neighbourhood houses operate.
Table 5: Council involvement in neighbourhood houses with early years programsType of involvement Number of councils
No. ( percent)
Own neighbourhood houses 29 (37)
Financial grants 24 (30)
Central enrolment* 20 (25)
Any other support 15 (19)
Operate neighbourhood houses 8 (10)
Any other administrative support 7 (9)
Maintain neighbourhood houses not owned by council
1 (1)
*For council operated services only.
Other types of support Fifteen councils identified other types of support, with some councils identifying more than one type. The main types of support identified by councils were:
networking activities (7 mentions) grants and other forms of direct financial support (5 mentions) provision of support and advice, including within the establishment phase (4
mentions), marketing/advertising support (4 mentions) training/professional development (4 mentions) property maintenance (3 mentions).
Other types of support identified were maintaining a central waiting list for early years programs, committee support, equipment and capital works.
Changes between the 2006 and 2010 surveysThe following differences are identified in order of the numbers of councils affected (from highest to lowest):
provision of support (18 fewer councils) financial grants to non-council services (17 fewer councils)
34 Victorian Local Government Support for Children, Young People and Their Families

owner of facilities (14 fewer councils) operator of facilities (3 fewer councils) maintain facilities where councils are not the owner (5 fewer councils).
This survey did not seek an explanation for why fewer councils were involved in neighbourhood houses with early years programs, and therefore cannot report on the extent to which this is the result of council withdrawal of support or neighbourhood houses withdrawing from this area of activity.
Major changes over the past three yearsSix councils indicated that there had been major changes in their support for neighbourhood houses with early years programs over the past three years. These changes all involved increased support as follows:
supporting an increased number of early years programs increased council funding for early years programs a greater time commitment in working with neighbourhood houses increased capital commitment and greater involvement in planning by councils recently begun working with the Victorian Government to assist a neighbourhood
house to purchase a new building free of stamp duty.
Long day careAbout 72 percent reported that they provide some level of support for long day care, the same number as in the 2006 survey. This section reports council support under the following headings:
Main forms of support Other types of support Changes between the 2006 and 2010 surveys Major changes over the past three years.
Main types of supportThe main types of involvement are summarised in Table 6, from highest to lowest percentage of support.
Table 6: Council involvement in long day careType of involvement Number of councils
No. ( percent)
Own facilities 54 (68)
Maintain facilities 54 (68)
Licensee 37 (47)
Any other type of support 31 (39)
Any other administrative support 27 (34)
Regular training and resourcing tonon-council services 22 (28)
Financial grants 17 (21)
Central enrolment* 15 (19)
*12 for council services only and 3 for all long day care services in municipality.
Part A: Services for children (0–12 years) 35

Other types of support Thirty-nine percent of councils indicated that they provided other forms of support for long day care, sometimes indicating more than one type. These other types of support are:
networking support (8 mentions) inclusion support for children with disabilities (7 mentions) financial administration, including payroll and insurances (4 mentions) financial support, including subsidised rental and provision of operational costs (3
mentions) building maintenance (3 mentions) staff training/ professional development (3 mentions) human resources functions (3 mentions) marketing/advertising of services (2 mentions) planning (2 mentions) resourcing committees, IT support, occupational health and safety (1 mention each).
Changes between the 2006 and 2010 surveysThe following differences are identified:
owner and maintainer of facilities (4 additional councils) maintain facilities where councils are not the licensee (2 additional councils).
Major changes over the past three yearsIn response to a question in the 2010 survey, 18 councils (23 percent) indicated increased support in the following areas:
demands placed on councils as a result of new Victorian and Commonwealth government policies, including new Victorian children’s services regulations, the National Early Years Learning Framework and the Victorian Early Years Learning and Development Framework (4 mentions)
additional expenditure, including through community grants and through council contribution to a federally funded children’s services centre (4 mentions)
involvement in early childhood networks (2 mentions) development of integrated children’s centres council involvement in long day care for the first time place-based planning more developed replacement of children’s centre destroyed in the February 2009 Victorian bushfires employment of an early years learning facilitator increased requests for both Preschool Field Officers and Inclusion Support
Programs.In addition, two councils identified changes that indicated reduced council involvement:
council direction that long day care services be cost neutral council closed long day care and transferred management to another provider.
36 Victorian Local Government Support for Children, Young People and Their Families

Occasional (limited hours) careSixty-five percent of councils provide some level of support for occasional care. This section reports council support under the following headings:
Main forms of support Other types of support Changes between the 2006 and 2010 surveys Major changes over the past three years.
Main forms of supportThe main types of involvement are summarised in Table 7, from highest to lowest percentage of support. The majority of councils own and maintain facilities at which occasional care is provided and provide financial grants.
Table 7: Council involvement in occasional careSupport functions Number of councils
No. ( percent)
Own facilities 49 (62)
Maintain facilities 49 (62)
Financial grants* 40 (51)
Licensee 39 (49)
Any other type of support 27 (34)
Any other administrative support 25 (32)
Financial grants for non-council services 20 (25)
Financial grants for council services 20 (25)
Central enrolment** 10 (13)
*Half of these grants are for council services and the other half for non-council services.** For council services only.
Other types of support Thirty-four percent of councils indicated that they provided other forms of support for occasional care services, with some councils indicating more than one type of support:
financial assistance, including community grants and subsidies (7 mentions) training/professional development for occasional care staff (7 mentions) network support (5 mentions) direct employment of staff (2 mentions) planning activities (2 mentions) human resources/ payroll support (2 mentions) marketing and promotion (2 mentions) inclusion support (2 mentions) other types of support included central enrolment, administrative support, advice and
support and data collection.
Part A: Services for children (0–12 years) 37

Changes between the 2006 and 2010 surveysThe following differences are identified in order of the numbers of councils affected, from highest to lowest:
have some level of involvement (8 fewer councils) owner of facilities (7 fewer councils) maintain facilities where council is not the licensee (2 fewer councils) provide financial grants to non-council services (1 fewer council) maintain facilities where councils is the licensee (1 additional council).
Major changes over past three yearsIn response to a question in the 2010 survey,14 councils (18 percent) indicated that there had been major changes in council support for occasional care over the past three years. The types of changes indentified by councils indicated a mixture of increased support and decreased support, but in some cases it was unclear as to whether there had been any changes in support levels.
Increased support was indicated in relation to:
increased financial contribution linked to changes in staff–child ratios and children’s services regulations
increases in the number and length of sessions capital funding to upgrade buildings and playgrounds increased need for information and support due to changes in early years
environment increased operational assistance to neighbourhood houses council operation of leisure/aquatic facilities incorporating occasional care move to provision in integrated settings.
Reduced support was indicated in relation to operation ceasing in three centres. Other changes were:
changes to Take a Break funding funding and affordability issues place-based planning was more developed.
Family day careJust over three-quarters of councils (76 percent) provide some level of support for family day care. This section reports council support under the following headings:
Main forms of support Other types of support Changes between the 2006 and 2010 surveys Major changes over the past three years.
38 Victorian Local Government Support for Children, Young People and Their Families

Main forms of supportThe main types of involvement are summarised in Table 8, from highest to lowest percentage of support. The majority of councils provide central enrolment and are the licensee for family day care scheme in their area.
Table 8: Council involvement in family day careSupport functions Number of councils
No. ( percent)
Central enrolment 59 (75)
Licensee 49 (62)
Any other type of support 42 (53)
Regular training and resourcing tonon-council services
13 (16)
Other types of support Forty-two councils (53 percent) identified other forms of support provided to family day care, with many councils identifying more than one type, as follows:
training/professional development (12 mentions) administrative support (10 mentions) playgroup support (6 mentions) financial support, including provision of operating costs and interest free loans (5
mentions) all aspects of local family day care schemes (4 mentions) in kind provision of office space (4 mentions) marketing/publicity/advertising/promotion activities (4 mentions) support for staff to attend regional and state conferences (4 mentions) human resource/payroll support (3 mentions) support of networks (3 mentions) equipment provision/loans (3 mentions) council directly employs family day care staff (2 mentions) IT support (2 mentions) support for private providers (2 mentions) other aspects of support were for building maintenance, transport, occupational
health and safety, toy library, inclusion support, Indigenous family day care scheme, monitoring/home visits, processing child care benefit, 24-hour emergency on call service and Better Communities for Children.
Changes between the 2006 and 2010 surveysThe following differences are identified in order of the numbers of councils affected, from highest to lowest:
have some level of involvement (7 fewer councils) licensee/operator of family day care (6 fewer councils) provide regular training or resourcing for non-council services (4 additional councils).
Part A: Services for children (0–12 years) 39

Major changes over the past three yearsIn response to a question in the 2010 survey, 21 councils (27 percent) indicated that there had been major changes in council support for family day care over the past three years. The most commonly reported change was from eight councils that had moved out of direct provision of family day care. Other changes appeared to have involved increases in local council support:
changes in status of workers in family day care (3 councils); becoming council employees rather than contractors in one; becoming contractors rather employees in another; and an increased number of contract arrangements and staffing levels in the third as part of a new business model
shift to independent fee care setting (2 councils) introduction of interest free loans to support recruitment of family day carers (2
councils) changes associated with implementation of early years learning framework and new
children’s services regulations increased financial support increases in breaches of carer agreements and support responses increased training associated with new legislative requirements restructure of council administration support arrangements development of a new community hub for children’s services.
Outside-school-hours care Forty percent of councils reported that they provided support for outside-school-hours care (OSHC). This section reports council support under the following headings:
Main forms of support Types of care Other types of support
Changes between the 2006 and 2010 surveys Major changes over the past three years.
Main forms of supportThe main types of involvement are summarised in Table 9, from highest to lowest percentage of support. The most commonly provided types of support provided were being a licensee, providing central enrolment in some form, and other types of administrative support. The types of care provided in councils that support OSHC are set out in Table 10. The most common form of OSHC care which councils are involved in is school holiday vacation care.
40 Victorian Local Government Support for Children, Young People and Their Families

Table 9: Council involvement in outside-school-hours careSupport functions Number of councils
No. ( percent)
Licensee 22 (28)
Central enrolment in some form* 20 (25)
Other administrative support 19 (24)
Maintain facilities** 18 (23)
Any other type of support 16 (20)
Own facilities 14 (18)
Regular training and resourcing to non-council services
12 (15)
Grants to non-council services 9 (11)
*Includes 19 councils for OSHC services operated by council and one service not operated by council ** Includes 4 councils which maintain facilities which they do not own.
Table 10: Types of outside-school-hours care supported by councilsSupport functions Number of councils
No. ( percent)
School holiday vacation care 19 (24)
After school care 15 (19)
*Care during pupil free days 7 (9)
Before school hour care 6 (8)
Other types of support Sixteen councils (20 percent) identified other forms of support provided to OSHC. These additional supports are:
inclusion strategies, including inclusion support programs and facilitators (6 mentions)
network support (5 mentions) resourcing support, including assistance with funding applications (5 mentions) financial support, including community grants (4 mentions) transport (2 mentions) marketing and promotion (2 mentions) other types of support were planning, training, IT, attending conferences, physio
support for carers, equipment, marketing and promotion and full support as a provider of OSHC.
Part A: Services for children (0–12 years) 41

Changes between the 2006 and 2010 surveysThe following differences are identified in order of the numbers of councils affected, from highest to lowest:
having some level of involvement (15 fewer councils) owner of facilities (8 fewer councils) maintain facilities it owns (8 fewer councils) maintain facilities it does not own (2 fewer councils) grants to non-council services (1 fewer service).
As noted, 15 fewer councils reported providing support to OSHC services than in the 2006 survey.
Major changes over the past three yearsIn response to a question in the 2010 survey, 16 councils (20 percent) identified major changes in council support over the past three years. The main themes in these comments are:
increasing complexity of demands on councils due to the new children’s services regulations and, to a lesser extent, quality frameworks and early learning frameworks (4 mentions)
increased focus on children with a disability, including increased demand, inclusion support subsidy inadequate to cover costs of including children with disabilities (3 mentions)
decrease in council support, including closing the provision of vacation care but retaining school based care; closing school based care but retaining vacation care; withdrawing all support; and removing council subsidy to private provider
Other changes included establishing a new service in 2010, providing care for children on one site from one school instead of three schools; moving from council employed staff to contract staff; increased focus on place-based planning; and provision of service at aquatic/leisure centre.
PlaygroupsEighty-one percent of councils reported that they provide some level of support for playgroups. This section reports council support under the following headings:
Main forms of support Funding sources Focus on higher-needs children/families Other types of support Changes between 2006 and 2010 surveys Major changes over the past three years.
Main forms of supportThe main types of involvement are summarised in Table 11, from highest to lowest percentage of support. The majority of councils own facilities used for playgroups and employ staff to support playgroups.
42 Victorian Local Government Support for Children, Young People and Their Families
[Playgroup] It's an experience for him and for me. I get to meet Mums; get to talk to them, ask them for advice, you know, if I've got problems, what would you do? You know, you exchange information and help each other out. It's well worth coming. (Mum from Kooweerup)

Table 11: Council involvement in playgroupsSupport functions Number of councils
No. ( percent)
Maintains facilities used for playgroups* 68 (86)
Own facilities used for playgroups 60 (76)
Employ staff to support playgroups 43 (54)
Grants to non-council services 36 (46)
Other types of support 32 (40)
Other administrative support 28 (35)
Regular training and resourcing to non-council services 19 (24)
Grants to council services 16 (20)
Central enrolment in some form** 8 (10)*
Training to work with children with a disability or developmental delay
10 (13)
*Includes 8 councils which maintain facilities that they do not own.**Seven councils provide central enrolment for council operated services only and one council provides support for all services in the municipality.
Funding sources Councils reported the funding sources of playgroups they supported as set out in Table 12.
Table 12: Funding sources of council-supported playgroupsSources of funding Number of councils
No. ( percent)
Other specified funding sources 38 (48)
Victorian government funded 33 (42)
Commonwealth government funded 18 (23)
Other specified funding sources identified by councils included partnership arrangements between councils and community groups, for example where council provides the facility and the community runs it, or council provides some staffing support. A small number were run or managed by community groups at no cost to council or government, sometimes with non-government sources of funding. A small number involved a combination of Victorian and local government funding, leveraged off programs such as Best Start, or Maternal and Child Health.
Focus on higher-needs children/ familiesCouncils were asked to report on whether their playgroups focused on a range of potentially disadvantaged children and their families, with the results shown in Table 13, from highest to lowest.
Part A: Services for children (0–12 years) 43

Table 13: Focus in playgroups on higher-needs children and familiesGroupings of children/families Number of councils
No. ( percent)
Young mothers 45 (57)
Mothers suffering from postnatal depression 31 (39)
Other groups 31 (39)
Children with a disability or developmental delay 29 (37)
Being inclusive of children with a disability or developmental delay
29 (37)
Children from CALD backgrounds but not refugee or recent arrival
29 (37)
Children from refuge or other high needs recent arrival group
26 (33)
The majority of councils supported playgroups with a focus on young mothers. Other groups identified by councils included:
no particular focus on higher needs groups but inclusive of these groups (4 mentions) fathers’ groups (4 mentions) socially and geographically isolated, including small rural towns (3 mentions) Indigenous families (3 mentions) new mothers’ groups (3 mentions) playgroups in particular locations, including urban renewal areas, bushfire-affected
areas and a women’s correctional facility (3 mentions). vulnerable families (2 mentions) further groups mentioned were low socioeconomic status families; chronically
disadvantaged families; mobile playgroups; supported playgroups; premature babies; children who will be attending school as transition support; multigenerational; Supported Parents and Playgroup (SPPI); and Nurture Nature (natural play materials).
Other types of support Thirty-two councils (40 percent) identified other forms of supports provided to playgroups, with a number of councils reporting more than one form of support as follows:
marketing/advertising and promotion activities (13 mentions) financial support, including community grants, reduced hire fees of council venues,
payment of Playgroup Association membership fees, funding of SPPI (9 mentions) support and advice to services and parents (7 mentions) network support (5 mentions) employment of staff whose role is wholly or partly to support playgroups: a playgroup
facilitator, a coordinator of early years and a coordinator of early years (3 mentions) training support (3 mentions) planning and policy support (3 mentions) equipment provision (3 mentions) provision of council buildings as playgroup venues (2 mentions)
44 Victorian Local Government Support for Children, Young People and Their Families
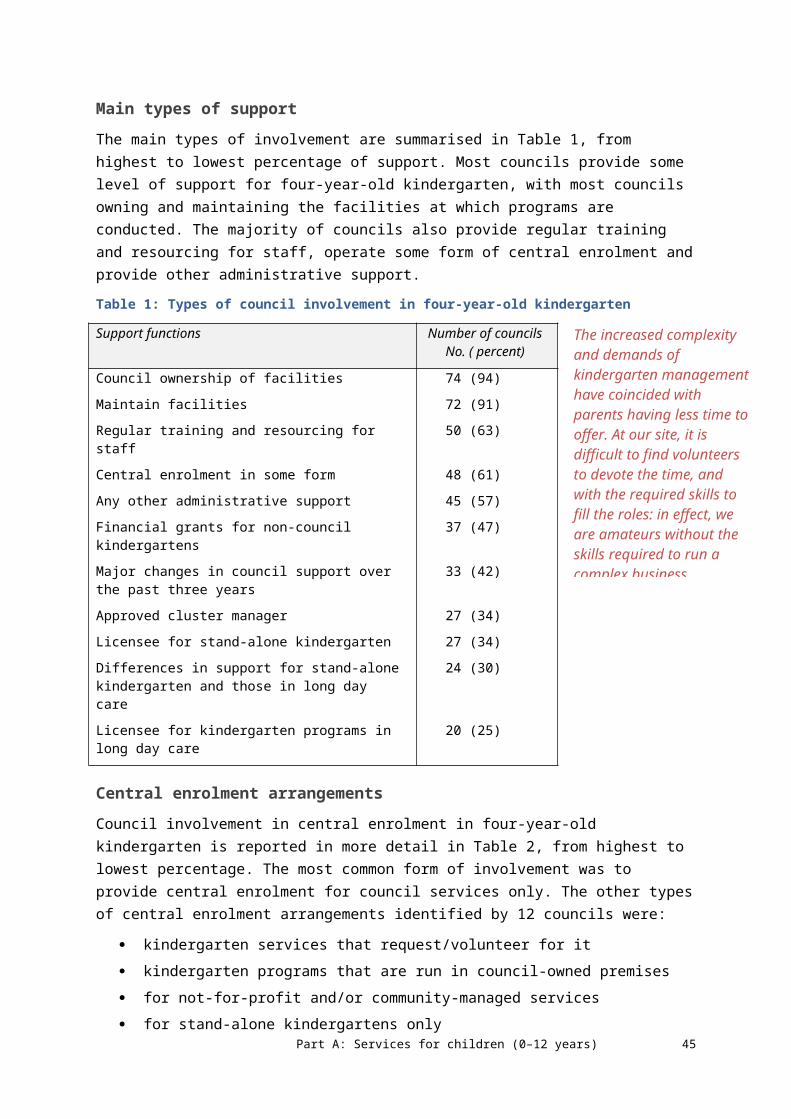
other support included maintenance of ground and building; transition support for families from new parent groups to playgroups; administrative support; and support through maternal and child health service.
Changes between the 2006 and 2010 surveysAn additional three councils reported supporting playgroups compared to the 2006 survey.
Major changes over the past three yearsIn response to a question in the 2010 survey, 29 councils (37 percent) reported major changes in council support for playgroups. The changes identified are as follows:
the receipt of Victorian government funding referred to as either SPPI (5 mentions), DEECD funding (4 mentions) or Best Start funding (2 mentions) (11 mentions of funding in total)
the council employment of playgroup development officers (4 mentions) and an early years facilitator (1 mention)
playgroups provided in bushfire-affected areas, with one council drawing attention to the fact that funding for a position to support this runs out in June 2011 (4 mentions)
councils involved in supporting playgroups for the first time, including for women with postnatal depression (3 mentions)
other changes identified included increased numbers of playgroups in culturally and linguistically diverse (CALD) communities; provision of supported playgroups; increased provision through maternal and child health; early home learning study participation; lack of playgroups identified as a gap in a council review; council taking a stronger leadership role; and council seeking alternative accommodation for displaced playgroups as part of the introduction of universal access to preschool.
Early childhood intervention services for children with disabilities/developmental delayFifty-three percent of councils identified that they provide some level of support for children with disabilities or developmental delays. Data on the extent of this support is reported under the following headings:
Employment of staff with specialist roles Specialist services provision In-home support/respite Major changes in support over the past three years.
Employment of staff with specialist rolesCouncils reported on whether they employed staff with specialist roles in relation to disability or developmental delay, as set out in Table 14. The main employment grouping is PSFO positions.
Part A: Services for children (0–12 years) 45

Table 14: Employment of staff with specialist roles in relation to child disabilityGroupings of children/families Number of councils
No. ( percent)
Preschool field officers (PSFOs) 18 (23)
Other specialist roles 13 (16)
Inclusion Support Facilitator 12 (15)
Inclusion Support Officer 5 (6)
Kindergarten Inclusion Support professionals 4 (5)
Early childhood intervention professionals 3 (4)
Other specialist staffing positions reported by councils were:
respite carers/ home care workers (2 councils) Joint Council’s Access for All Abilities officer community support workers kindergarten assistant additional support staff for council-managed children’s services under the Inclusion
Support Program family counsellors, teachers and maternal and child health disability assessment team specialist playgroup facilitator enhanced home visiting nurse children and family services development officer referral to specialist services from universal services children’s advocate.
Specialist services provisionCouncils reported on their provision of specialist services for children with a disability or developmental delay, as set out in Table 15. The service most commonly provided was a metropolitan or rural access worker. Other forms of specialist service provision included respite services (3 mentions); specialist holiday provision (2 mentions); ‘top up’ integration support in child care and kindergarten; support provided by maternal and child health nurses; and council support for an early intervention centre.
Table 15: Provision of specialist services in relation to child disabilitySpecialist services Number of councils
No. ( percent)
Metropolitan or rural access worker 18 (23)
Special needs playgroups 16 (20)
Integration support for children in mainstream holiday programs
13 (16)
Other specialist services 8 (10)
Specialist transport 8 (10)
Specialist outside-school-hours care 5 (6)
46 Victorian Local Government Support for Children, Young People and Their Families

In-home support/respiteThirty-five councils (44 percent) identified that they provided in-home respite care, a service funded though the Home and Community Care program. Twenty-one councils indicated that they had some form of policy on the maximum number of hours provided, though only 11 were able to specify. The range of hours was from a low of 1.5 hours per month as the maximum provided to a high of 14 hours per week.
Major changes in support over the past three yearsTwelve councils indicated that there had been major changes in their support for children with a disability or developmental delay over the past three years, as follows.
Changes in auspice/administrative arrangements Two councils have ceased to employ inclusion support officers, with this service now
provided by a non-government organisation in one instance and by another council in the other.
Inclusion support facilitators now held with two councils instead of three. Support provided by the inclusion support facilitator program has become more
administrative, and now involves supporting the service as the client as opposed to the individual as the client (as per Commonwealth government guidelines).
An early intervention centre supported by council management is in transition from incorporated committee to a board of management arrangement.
Growth in demand increase in demand for support for children with autism spectrum disorder (ASD) or
ASD-like symptoms increase in the number of requests for preschool field officers (PSFOs) and inclusion
support program through the eastern region central intake service growth in demand, with families wanting more information as they become more
informed increasing demand for integration support for children in mainstream holiday
programs.
Increased council involvement council now employs a preschool field officer council contribution to preschool officer role to support full-time position (but also
withdrew from direct employment of inclusion support facilitators, as noted) increase in service size and move to integrated service centre developing and resourcing of the families and early years team and community
planning and development team.
Part A: Services for children (0–12 years) 47

Support services and programs for families with children Eighty-one percent of councils reported that they provide some level of support for services and programs for families with children. This section reports council support under the following headings:
Main forms of support Other types of support Language groupings provided with parenting education Policies to support vulnerable families Linkage of vulnerable families with universal early years services Major changes over the past three years.
Main forms of supportThe main types of involvement are summarised in Table 16, from highest to lowest percentage of support. The majority of councils reported that they actively link vulnerable families into universal services and supported parenting education.
Table 16: Council involvement in services for families with children (0–12 years)Support functions Number of councils
No. ( percent)
Active support for linking vulnerable families into universal early years services
57 (72)
Parenting education 52 (66)
Outreach in-home support 34 (43)
Policies in regards to family support for more vulnerable families
29 (37)
Parenting education/information sessions for families with adolescent children
20 (25)
Counselling 17 (21)
Other types of support 16 (20)
Partnerships with schools on family programs 16 (20)
Parenting education for parents with a child with a disability
12 (15)
Parenting education targeted at non-English speaking families
8 (10)
Other types of support Sixteen councils (20 percent) reported other types of support to families with children (as indicated in Table 17). These other types of support are:
maternal and child health services (4 mentions) referrals (2 mentions) home and community care (2 mentions) provision of information for families, e.g. at festivals and events (2 mentions) other forms of support provided as single mentions included: integration of family
support in universal services as the responsibility of a full-time family support worker;
48 Victorian Local Government Support for Children, Young People and Their Families
Together, we must ensure that ongoing opportunities are created to promote the optimum health and wellbeing of all children in the municipality, regardless of economic, social or cultural background. (Knox MEYP)

information provision; family health; immunisation; paediatric support; speech pathology; adventure playground; early years literacy program; and parent groups.
Language groupings provided with parenting education Eight councils reported that they supported parenting education targeted at non-English speaking families, as indicated in Table 16. The language groupings identified included Chinese /Mandarin/Cantonese, Vietnamese, Somali, Arabic, Italian and Greek. One council commented that they provided language support ‘as specified by families’ and another council said that their municipality had identified residents from 150 different language backgrounds.
Policies to support vulnerable families Twenty-nine councils (37 percent) indicated that they had policies to support vulnerable families, as indicated in Table 16. These policy types are summarised as follows:
plans and strategies specific to individual councils, including social justice charters, children’s early years policies, inclusive practice strategies, partnership commitments and municipal early years plans (MEYPs) (4 mentions of MEYPs, 16 mentions in total)
Child FIRST/Family Services Alliance with DHS (8 mentions) maternal and child health, including enhanced maternal and child health (4 mentions) Commonwealth priority access guidelines in relation to access to child care (4
mentions).
Linkage of vulnerable families with universal early years services Fifty-seven councils (72 percent) reported providing active support for linking vulnerable families into universal early years services, as indicated in Table 16, often reporting more than one activity. The types of activities identified by councils are as follows:
maternal and child health/enhanced maternal and child health as a key universal service linking vulnerable families with other services, including the use of family support workers and family counsellors (35 mentions)
a range of initiatives specific to individual councils, including collocation/integrated service provision; use of AEDI data to support planning; early childhood networks; referrals to non-government agencies; Preschool Field Officer assistance; and targeting ‘young mums’ (24 mentions)
Early Start Kindergarten project (3 mentions) Best Start initiatives (3 mentions) Child FIRST Alliances (2 mentions).
Major changes over the past three yearsOne-third of councils reported that there had been major changes in support for families with children over the past three years.
Part A: Services for children (0–12 years) 49
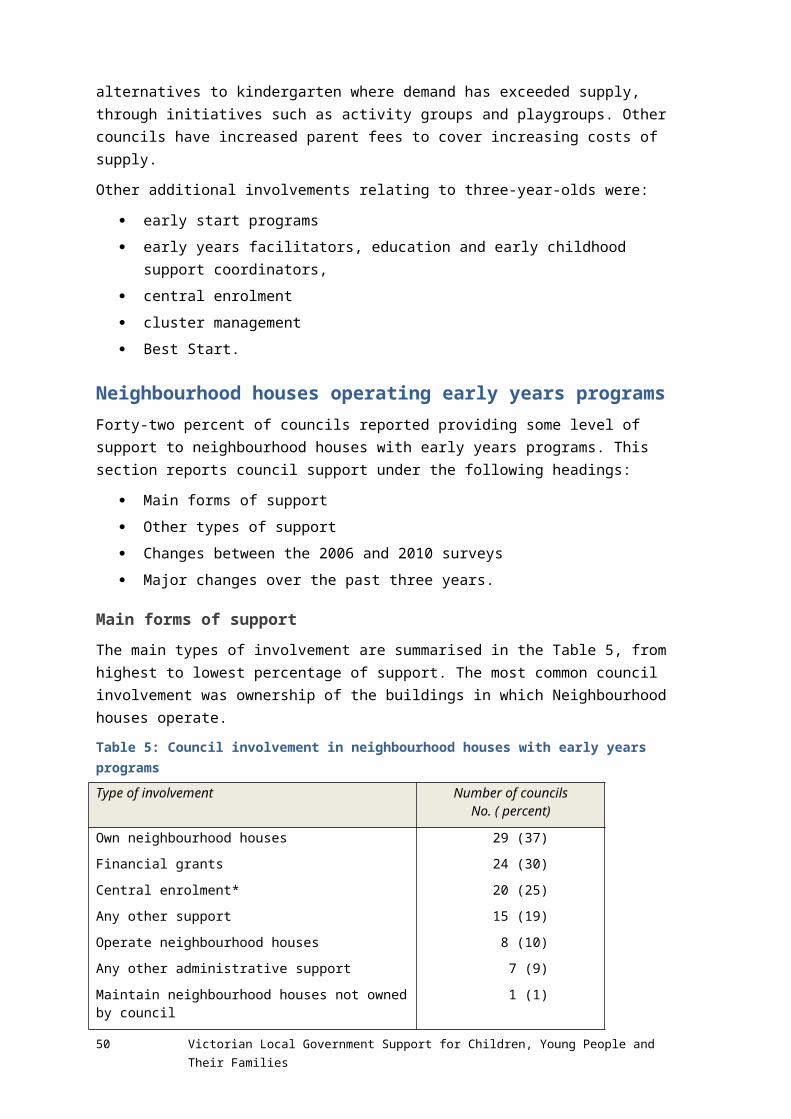
Increased support from councils included employment of additional staff; increased scope of service provision; increased funding of non-government services; closer partnerships with non-government organisations; greater network support; increased complexity of issues and corresponding increase in council involvement; increased involvement in Child FIRST; development of case management support; and planning for integrated provision of support for families.
One council had reduced support by withdrawing from family support in partnership with DHS. Other changes reported by councils included increased demand for services, the importance of Best Start initiatives and the receipt and use of Communities for Children funding through the Commonwealth Government.
Coordination and planning of services for children and their familiesThis section reports council involvement in coordination under the following headings:
Extent of support for coordination Councils rating of effectiveness of coordination efforts Coordination mechanisms Co-location and integration of services Partnerships with primary schools Access to data for planning Focus in planning on high-needs groups Best Start analysis Major changes over the past three years.
Extent of support for coordinationTable 17 sets out councils’ reports on the extent of their role in coordinating services for children and their families, from highest to lowest percentage of support. Seventy percent of councils reported that they had a major role in coordinating early childhood service provision.
Table 17: Extent of support in coordinating early childhood (0–8 years) service provisionExtent of support Number of councils
No. ( percent)
Council has major role in coordinating early childhood service provision
55 (70)
Council has minor role in coordinating early childhood service provision
22 (28)
Council has no role in coordinating early childhood service provision
2 (2)
Total 79 (100)
Councils rating of effectiveness of coordination efforts Councils reported on whether the extent of their involvement was either well done or presented minor or major challenges, as set out in Table 18, from highest to lowest percentage of support. They were fairly evenly divided on whether coordination presented
50 Victorian Local Government Support for Children, Young People and Their Families
In Frankston City, the Early Years Partnership is crucial in providing guidance and reference to Frankston City Council’s implementation of the Municipal Early Years plan. This aligns with the aim of the partnership: to work collaboratively to improve the outcomes in all areas of health, wellbeing, early learning and development, support for children and families particularly those most vulnerable. (Frankston Council MEYP)
minor or major challenges, with only a minority of councils reporting that it was well done. Those that reported having no role in coordination were slightly less likely to identity that there are any major challenges (57 percent), compared to those councils that identified that they had a minor role (70 percent) or a major role (75 percent).
Table 18: Council views on effectiveness of local early childhood (0–8 years) coordination efforts Level of effectiveness Number of councils
No. ( percent)
It presents some minor challenges 33 (42)
It presents major challenges 32 (40)
It is well done 14 (18)
Total 79 (100)
Coordination mechanismsTable 19 shows the extent to which councils were involved in a range of coordination mechanism, from highest to lowest percentage. Most councils reported that they had a municipal early years plan (MEYP). A majority also reported that they foster local service networks; support co-location or integration of early years services; facilitate community connections, engagement and capacity; and identify service gaps and solutions.
Table 19: Council mechanisms used in coordination of services for families with young childrenMechanisms Number of councils
No. ( percent)
Municipal early years plans 70 (89)
Fosters local service networking 67 (85)
Supports for co-location or integration of early years services
59 (75)
Facilitates community connections/engagement and capacity
58 (73)
Identification of service gaps and solutions 53 (67)
Integrated community service planning 43 (54)
Broader service system planning 41 (52)
Formal contracts with providers of early years services
37 (47)
Case management approaches 17 (21)
Facilitates regional networks 33 (42)
Kindergarten cluster management 32 (40)
Protocols for intake and referral 23 (29)
Common assessment tools/models for initial identification of needs
19 (24)
Co-location and integration of servicesThree-quarters of councils reported that they supported co-location and integration of services, as indicated in Table 19. Thirty of them
Part A: Services for children (0–12 years) 51
Overall I think that Pakenham Springs [Children’s Centre] would have to be one of the most convenient educational facility that we have come across… If they can have more of these facilities everywhere it will make the

identified centres in their area where services were co-located. Other functions identified were:
planning support, including the provision of data and MYEP (10 mentions) network support (5 mentions) capital works (3 mentions) provision of council buildings (3 mentions).
Twenty-five councils identified the specific clusters of services provided in these hubs. In summary:
Twenty-six different types of services were identified. The most commonly mentioned services were maternal and child health (20
mentions), kindergartens (16 mentions) and playgroups (12 mentions)
Only two of the 25 combinations of services provided in these hubs were exactly the same (kindergarten, long day care and maternal and child health combination).
Partnerships with primary schoolsSixty-eight percent of councils reported that they have formed partnerships with primary schools. The main types of partnerships are summarised in Table 20, from highest to lowest percentage of support. Other forms of partnership reported by councils were:
networks (five councils) co-location arrangements (3 mentions) Best Start (2 mentions) communities for children (2 mentions) other partnerships provided as single mentions included : playgroups, school
regeneration, subsidised aquatic programs, community education, parenting sessions, Children’s Week events, education and meetings.
Table 20: Council partnerships with primary schoolsPartnership type Number of councils
No. ( percent)
Transition to school programs 38 (48)
Youth programs 28 (33)
Involvement in school networks 27 (34)
Other forms of partnerships 22 (28)
Joint use and development agreements 18 (23)
Participation in school governance bodies 18 (23)
Family programs 7 (9)
Access to data for planning Councils were asked questions about data for planning with responses summarised under the following headings:
Rating of importance of population data Rating of importance of evidence on types of interventions
52 Victorian Local Government Support for Children, Young People and Their Families
Overall I think that Pakenham Springs [Children’s Centre] would have to be one of the most convenient educational facility that we have come across… If they can have more of these facilities everywhere it will make the
Sources of data Major gaps in data Council access to skills and knowledge to use data Direct providers of data.
Rating of importance of population data
Councils were asked to rate the importance of access to local population data for supporting planning and coordination efforts for children (0–12 years) and their families. Council responses are provided in Table 21, from highest to lowest percentage of support. Most councils rated local population data as being of high importance.
Table 21: Council rating of importance of local population data for planning/coordinationRating Number of councils
No. ( percent)
High 68 (86)
Medium 10 (13)
Low 1 (1)
Total 79 (100)
Rating of importance of evidence on interventionsCouncils were also asked to rate the importance of access to evidence on types of interventions that work to support planning and coordination efforts for children (0–12 years) and their families. Council responses are provided in Table 22, from highest to lowest percentage of support. Three-quarters of them rated importance of evidence on types of intervention as being high.
Table 22: Council rating of importance of access to evidence-based interventions Rating Number of councils
No. ( percent)
High 59 (75)
Medium 16 (20)
Low 4 (5)
Total 79 (100)
Sources of data Councils identified sources of data accessed by council, as summarised in Table 23 from highest to lowest percentage of support.
Table 23: Types of data accessed by councilsData type Number of councils
No. ( percent)
Part A: Services for children (0–12 years) 53

DEECD community profiles 73 (92)
Other sources of data 56 (71)
VCAMS* population data 30 (38)
VCAMS catalogues of evidence
19 (24)
* Victorian Child and Adolescent Monitoring System
Most councils access DEECD community profiles. The other sources of data identified by councils, with some councils identifying more than one source, are:
Australian Bureau of Statistics (ABS) (32 mentions) Australian Early Development Index (AEDI) (26 mentions) using their own data (e.g. community consultation, kindergarten enrolments,
consultation data and local profiles compiled by council) (5 mentions) Other sources of information included private companies (Informed Decision), the
Commonwealth Government, and the Victorian Community Indicators (VCI) Project (a VicHealth funded initiative designed to support local governments develop and use, see www.communityindicators.org.au)
community indicators as tools for measuring health, wellbeing and sustainability and for improving citizen engagement, community planning and policy-making (see www.communityindicators.org.au).
Major gaps in dataForty-nine percent of councils identified major gaps in data. The dominant themes in council comments related to the need for more up-to-date data or localised information for planning purposes. Several councils referred to the related challenge of adequately planning in the context of population growth. Inconsistency and difficulties with cross-referencing between data sources was noted by one council, with a proposed solution being data linkage using Medicare numbers. Other identified gaps were local data on specific groups, including Indigenous families, non-English speaking background families and families with disabled children.
Council access to skills and knowledge to use dataCouncils provided a rating on the extent to which they have access to the skills/knowledge to make good use of data, with results provided in Table 24. A majority of councils indicated that they either had low or only medium level skills to make use of data.
Table 24: Council rating of access to skills and knowledge to use dataRating Number of councils
No. ( percent)
Medium 44 (56)
High 23 (28)
Low 12 (15)
Total 79 (100)
Direct providers of dataCouncils reported on mechanisms and sources used to directly access skills and knowledge to make good use of data for planning for children. The findings are summarised in Table 25. Councils identified that they used multiple sources of expertise, with a majority of councils using council employees, consultants, Victorian government departments and partners.
54 Victorian Local Government Support for Children, Young People and Their Families

Other mechanisms included regular meetings of CEOs or managers of key community organisations; engagement with service providers through forums and surveys; internal data collection with the assistance of consultants, research (empirical and academic); and formation of a junior shire council.
Table 25: Mechanisms/sources used to access dataMechanism/source Number of councils
No. ( percent)
Council employees 75 (95)
Consultants 59 (75)
Victorian government departments
55 (70)
Partners 44 (56)
Other sources 11 (14)
Focus in planning for high-needs groupsCouncils reported on their focus in supporting high-needs groups of children, with the main ones summarised in Table 26, from highest to lowest percentage of support. The majority of councils provide or fund targeted services for children at risk who are known to child protection services and children with disabilities or developmental delay (see section 2.2.9). It might be expected that the uneven population distribution of the other groups by location might reduce the number of councils involved.
Table 26: Council provides or funds targeted programs for higher needs groups of children Targeted groups Number of councils
No. ( percent)
Children at risk who are known to child protection services
50 (63)
Children with a disability or developmental delay 42 (53)
Indigenous children 33 (42)
Children from CALD backgrounds (other than high-need immigrant/refugee background)
31 (39)
Children from recent high-need and/or immigrant/ refugee background
28 (35)
Involvement in school networks 27 (34)
Children with mental health difficulties or at risk of developing mental health difficulties
25 (32)
Other children (see following text) 14 (18)
Other groups identified included children affected by bushfires; geographically and socially isolated; from low socioeconomic areas; exposed to family violence; having parents who are substance abusers; and those affected by inter-generational poverty.
Major changes over the past three years Thirty-three councils (42 percent) reported that there had been major changes in council involvement in coordinating and planning services for children over the past three years.
Councils reported four types of linked and sometimes overlapping changes arising from:
Part A: Services for children (0–12 years) 55
increased and/or changed demands within local areas, including local demographic changes and increasing complexity of needs
increased demands from government, including universal access to preschool, government policy and program developments, compliance with Victorian government early years reforms
funding opportunities from the Victorian or Commonwealth Government, including Best Start, Communities for Children and Early Start Kindergarten
changes in council operations, including increased consultation across council departments, increased community involvement and participation and increased coordination efforts.
Best Start analysisThere is a clear local and state planning interest in local government support for children and their families in Best Start areas, given that Best Start sites were selected on the basis of concern about disadvantaged families with children.
Additional analysis was undertaken comparing the 25 councils involved in Best Start with the other (54) councils on a range of service support and coordination activities. Consistent with the narrower function of the four Aboriginal Best Start projects that are not part of a generalist Best Start site (all in rural locations), it would not be expected that participation by these four councils would affect other children’s policies. An analysis confirms little difference between these four councils and other councils and the four councils have therefore been excluded as Best Start sites in the analysis below.
On most service involvement and coordination/planning issues, the 25 Best Start councils were more likely than the other 54 councils to report involvement. While it is beyond the scope of this study to attribute these differences in council involvement to Best Start, it is consistent with what is known about Best Start activities encouraging council involvement and improved service responses.
The analysis is provided under the following three headings:
Children’s services and settings Coordination and planning activities Support for vulnerable children.
Children’s services and settings Figure 8 compares Best Start councils with other councils on their involvement in early childhood services and settings for children.
Best Start Councils were more likely than other councils to be involved in supporting all but one of the early childhood settings (the exception is three-year-old programs). In 12 of the 15 other service areas, councils with Best Start were more likely than other councils to have indicated their involvement.
The most noticeable differences are the higher proportion of Best Start councils involved in playgroups, long day care, occasional care, children’s library service and holiday programs.
56 Victorian Local Government Support for Children, Young People and Their Families

Figure 8: Comparing Best Start councils with other councils on support for children’s settings and services
4-year-old kindergtn
Family day care
Occasional care
Children's library service
3 year old programs
Early Childhood Intervention Services
Holiday programs (primary school)
Outside-school-hours care
Early years neighbourhood renewal
Baby capsule hire/loan
Safety harness loan/hire
0 10 20 30 40 50 60 70 80 90 100
Other councilsBest Start councils
Percentage of councils
Part A: Services for children (0–12 years) 57

Coordination and planning activitiesFigure 9 compares Best Start councils with other councils on whether they are involved in a range of coordination and planning mechanisms. Best Start councils were more likely than other councils to report involvement in all but one of the coordination/planning mechanisms. In relation to the two assessments of coordination issues, Best Start councils were more likely than other councils to identify that it had a major role and that coordination presents major challenges.
Figure 9: Comparing Best Start councils with other councils on involvement in coordination and planning mechanisms
Fosters local service networkingHas a municipal early years plan
Service networkingPartnerships with primary schoolsFacilitates community connections
Service gap identifcation and solutions Co-location and service integration
Has a major role in coordinationBroader service system planning
Integrated community service planning Transition to school programs
Formal contracts with service providersFacilitates regional networks
Coordination presents major challengesProtocols for intake & referralCase management approaches
Common assessment tools/models
0 20 40 60 80 100 120
Other councils Best Start
Percentage of councils
58 Victorian Local Government Support for Children, Young People and Their Families

Support for vulnerable childrenFigure 10 compares Best Start councils with other councils on whether they are involved in supporting vulnerable children. Best Start councils were more likely than non-Best Start councils to report involvement in seven of the eight areas listed (and similar on the eighth: Children with mental health issues).
Figure10: Comparing Best Start councils with other councils in supporting vulnerable children
Linking vulnerable famiiles to universal services
Children known to child protection
Indigenous children
CALD (not high need/refugee background)
Children with disability/developmental delay
Recent high need migrant/refugee background
Policies for vulnerable families
Children with mental health issues
0 10 20 30 40 50 60 70 80
Other councilsBest Start councils
Percentage of councils
Services and supports for children in the middle yearsCouncils were asked whether they had any initiatives focused on children in the middle years (students 8–12 years of age) and whether this was an area where more work needed to be done. Their responses are summarised in Figure 11. Forty-eight percent of councils reported that had middle years initiatives and 65 percent indicated that this was an area where more work needs to be done.
Part A: Services for children (0–12 years) 59
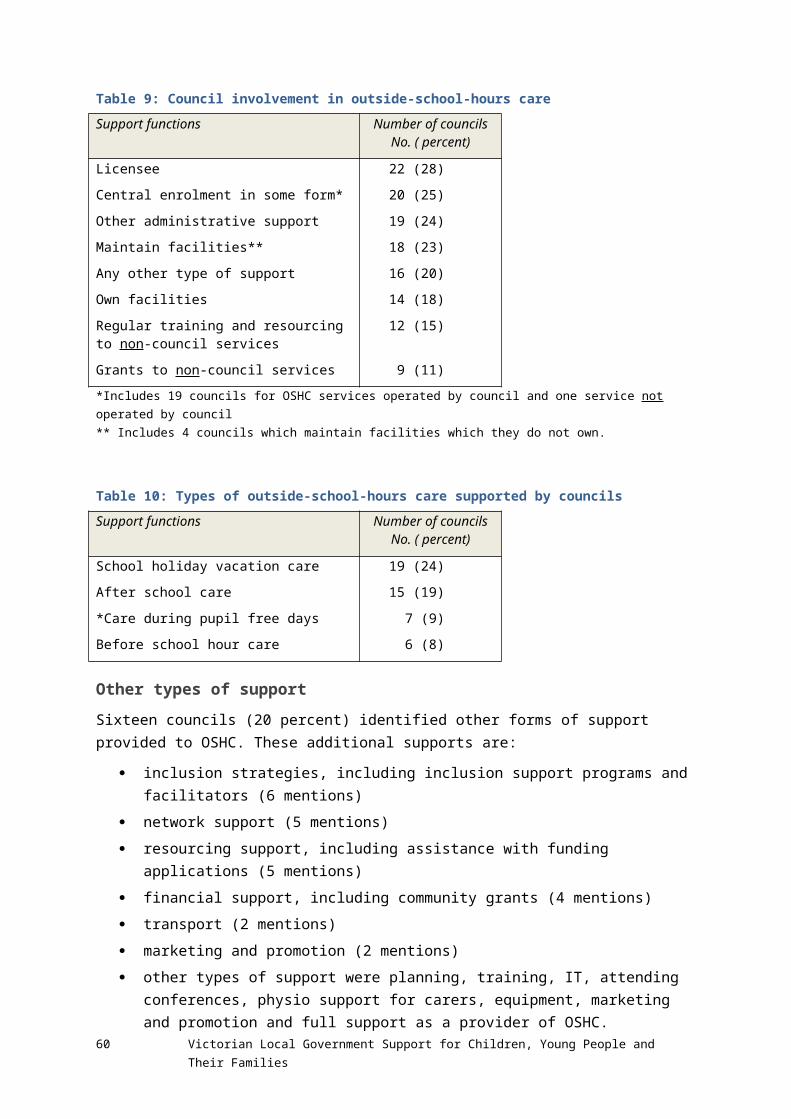
Figure 11: Middle years initiatives and council views on whether more work was needed
Middle years initiatives More work needed
0
10
20
30
40
50
60
70
Perce
ntag
e of c
ounc
ils
Current council initiativesThe 38 councils (48 percent) who reported having middle years initiatives provided descriptions which included::
initiatives provided for young people where access is provided for children from age 10 years onwards, including school-focused youth service and general youth services and programs (10 mentions)
services focused on children aged 5 years and older, which include children in the middle years, comprising outside-school-hours care programs (before and after school care, vacation care and pupil free days care) (8 mentions); council Primary Years Support Officer; MEYPs which have been extended to include children to age 12; and adventure playgrounds (2 mentions)
programs and services available to all or most children and young people and families, including leisure services providing a range of sport; recreation and aquatic programs; a family service program offering counselling; parent support and educational support for children in schools; parenting programs; school-based programs (2 mentions); Access for all Abilities Program, Building Bridges Cultural Program, family-friendly facilities/activities inclusive of middle years children; family services providing counselling; and educational support to children at school.
60 Victorian Local Government Support for Children, Young People and Their Families

Major concernsThe 51 councils (65 percent) that indicated that there was more work to be done were also asked to indicate any major concerns, with a number of councils identifying more than one concern. Council responses are:
lack of programs to support the needs of this age group, such as recreation, child care, welfare programs, transition programs, and transport (14 mentions)
insufficient funding and other resources, no specific funding pool for this age group, and a lack of qualified staff (13 mentions)
lack of strategic service planning, including coordination (11 mentions) transition to secondary college as a problem, including lack of support mechanisms
(10 mentions) gap in service and funding due to being overlooked, as they are neither part of early
years (age 0–8) or youth (age 13–25) (9 mentions) lack of support for children from disadvantaged families and those with additional
needs (7 mentions) earlier presentation of issues, such as disengagement, behavioural issues, psycho-
social issues, antisocial patterns of behaviour and wellbeing, and a lack of services to deal with this (6 mentions)
no data on or understanding of this age group, their needs and associated risks (5 mentions).
2.3 Discussion of findings: Services for children (0–12 years)The survey set out to establish the extent of local government support for services for children (0–12 years), as well as for young people as reported in Part B of this report. All 79 councils completed the survey and completed all questions in the survey.
Extent of local government involvementThis is a story in three parts. First, council responses indicate their broad involvement in children’s services (for 0–12 year-olds). Second, involvement varies considerably from council to council and, in some instances, between rural and metropolitan councils. The third element is a mixture of decreased and increased council involvement.
Councils responded to a list of 25 different types of services listed in the survey. The most commonly supported services were maternal and child health, kindergarten services, and those captured under the generic title of services for families with children. The types of support included direct provision, ownership and maintenance of buildings in which services were conducted, grants, central enrolment, training of staff and networking support.
The most obvious type of variability was between councils either being involved or not involved in particular activities. This variability extended to all early childhood settings and most children’s services. The major exception was maternal and child health, which is supported by all councils. Metropolitan councils were also more likely to be involved in the range of children’s settings and services.
Part A: Services for children (0–12 years) 61

Despite identifying major differences in whether councils supported particular services and their coordination, this study did not attempt to quantify the extent of difference between councils that supported the same things, though anecdotally this is known to be high. As one example, this study did not attempt to identify the number of buildings used for early childhood services that council owned or maintained or the age and condition of such buildings.
In relation to the middle years, about two-thirds of councils indicated that this was an area where more work needed to be done, which confirmed anecdotal feedback from a number of councils in recent years that this was an issue that they were concerned about.
Changes in government involvementThis is a story in two parts: continuity and change. The majority of councils indicated no major changes in their involvement in provision of support for children.
The most dramatic changes identified were the number of councils withdrawing from their involvement with neighbourhood houses with early years programs (not necessarily neighbourhood houses), outside-school-hours care, occasional care and family day care. In contrast, more councils had become involved in three-year-old programs and playgroups.
Councils identified that there had been major changes in their support for kindergarten provision and different forms of child care, which included the introduction of universal access to preschool and changes in children’s services regulations. However, changes in local demand, other government policy changes and government funding were also identified as leading to increased council involvement.
62 Victorian Local Government Support for Children, Young People and Their Families

3. Part B: Services for young people (13–25 years)Survey findings on council involvement in supporting young people are reported under the following headings:
Overview of findings Investment in youth services Communication, consultation and participation in decision-making strategies Coordination and planning of services for young people Use of data to support coordination and planning efforts.
3.1 Overview of findingsThis overview presents overall research findings in relation to council support for young people under the following headings:
Main service areas supported by local government Major changes in council involvement over the past three years Rural and metropolitan differences Growth corridor, interface and metropolitan fringe councils.
Main services areas supported by local governmentThis section reports data in relation to programs and services supported by local government, and targeted groups in programs and services supported by local government.
Programs and services supported by local government Councils reported on the range of programs and services for young people which they provided or funded. Council responses are summarised in Figure 12.
Most councils reported support for music/cultural events and education and training. A majority of councils also supported programs at recreational facilities, leadership programs, youth festivals (not music/cultural) and cultural programs/events.
Councils were also given the opportunity to identify other programs and services not listed (see Figure 12) and nine councils indentified the following activities: programs for teenage/young mums (3 mentions); performing and visual arts (2 mentions); and single mentions of out-of-school hours programs; training for young people as media activists; volunteering; and skills development.
Victorian Local Government Support for Children, Young People and Their Families 63

Figure 12: Programs and services supported by local government
Education & trainingLeadership programs
Cultural programs/eventsSchool engagement Harm minimistation
Youth summitsPrograms sporting facilities
Physical activityYouth counselling
Sexual healthYouth discount card
Smoking issues
0 10 20 30 40 50 60 70 80 90 100
Percentage of councils
Council involvement in education and training Councils were also asked additional questions about their involvement in providing education and training support for young people. Table 27 summarises council ratings on their role in relation to training and support for young people, from highest to lowest percentage. The majority of councils reported that they had a minor role in supporting education and training for young people.
Table 27: Council rating of their role in education and training support for young people (13–25 years)Education and training support
Number of councilsNo. ( percent)
Council has a minor role 46 (58)
Council has a major role 19 (24)
Council has no role 14 (18)
Total 79 (100)
64 Victorian Local Government Support for Children, Young People and Their Families

Councils were also asked about whether they wanted to be more involved in supporting education and training. Table 28 summarises council responses on this issue, from highest to lowest percentage.
Table 28: Council views on the extent of their current involvement in education and training support for young people View on support Number of councils
No. ( percent)
Current involvement is about right 49 (62)
Council would like to be more involved 19 (24)
No strong indication of council involvement 10 (13)
Council would like to be less involved 1 (1)
Total 79 (100)
The majority of councils reported that council involvement was about right, with only a few councils reporting that they would like to be more involved in this area. It might have been expected that those councils with minor or no roles would be the ones which would have identified that that would like to be more involved. While this was the major trend, responses indicated a more complex relationship between the two ratings. Thus, councils that reported that council response was about right (62 percent) were most likely to be those councils who identified that it had a minor role (63 percent), followed by councils identified as having a major role (20 percent) and those with no role (5 percent). The other major category of responses was the 24 percent of councils that identified that they would like to be more involved. These councils were most likely to report having only a minor role (58 percent), followed by having a major role (37 percent) and no role (5 percent).
Targeted groups in programs and services supported by local governmentCouncils reported on groupings of young people at some level of disadvantage or risk who were targeted in service and program provision. Their responses are summarised in Figure 13. The majority of councils provided targeted support for young people disengaged from education and work and those in the youth justice system.
Part B: Services for Young People (13–25 years) 65
Figure 13: Targeted groups in programs and services supported by local government
Disengaged from education & workIn youth justice system
Disengaged from familyAlcohol/illicit drug use
Young people with disabilities Young parents
Culturally & linguistically diverseRefugees/recent arrivals
Indigenous young people Domestic violence
Learning difficultiesHomeless young people
Young people with mental health problemsYoung people attracted by same sex
Out of home care
0 10 20 30 40 50 60
Percentage of councils
Major changes in council involvement over the past three yearsCouncils were asked whether there had been major changes in their support for young people over the past three years in relation to three aspects of their involvement: communicating and engaging, coordination and planning and investment. Their responses are summarised in Figure 14. The majority of councils reported major changes in communicating and engaging with young people and fewer than half reported changes in coordination and investment.
Figure 14: Major changes in council involvement in supporting young people over the past three years
66 Victorian Local Government Support for Children, Young People and Their Families
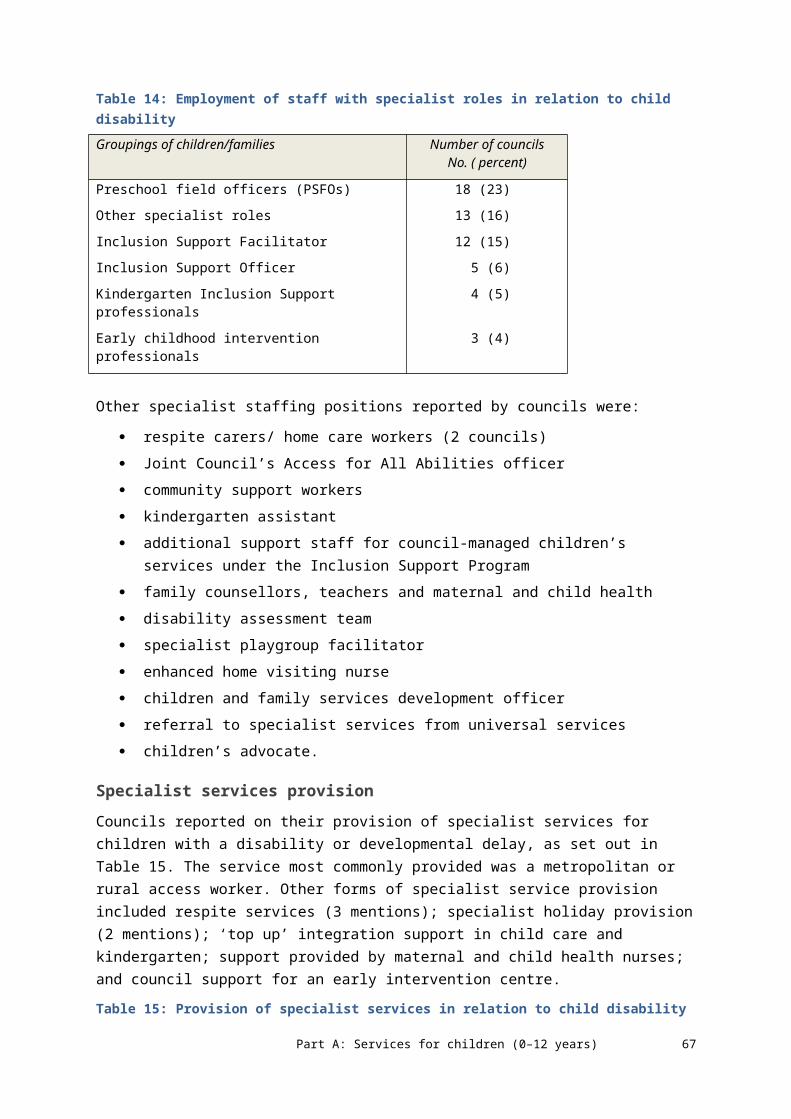
Communicating and engaging Coordination and planning Investment in services0
10
20
30
40
50
60
70
Perce
ntag
e of c
ounc
ils
Rural and metropolitan differences Figure 15 compares the extent to which metropolitan and rural councils reported that they provide or fund particular youth services.
Metropolitan councils are much more likely than rural councils to provide or fund a range of youth services. (An analysis of different levels of metropolitan and rural recurrent expenditure is provided in Figure 17, and is consistent with this picture of differential metropolitan and rural council support for a range of youth services and programs.)
Figure 15: Metropolitan and rural council support for youth services
Part B: Services for Young People (13–25 years) 67
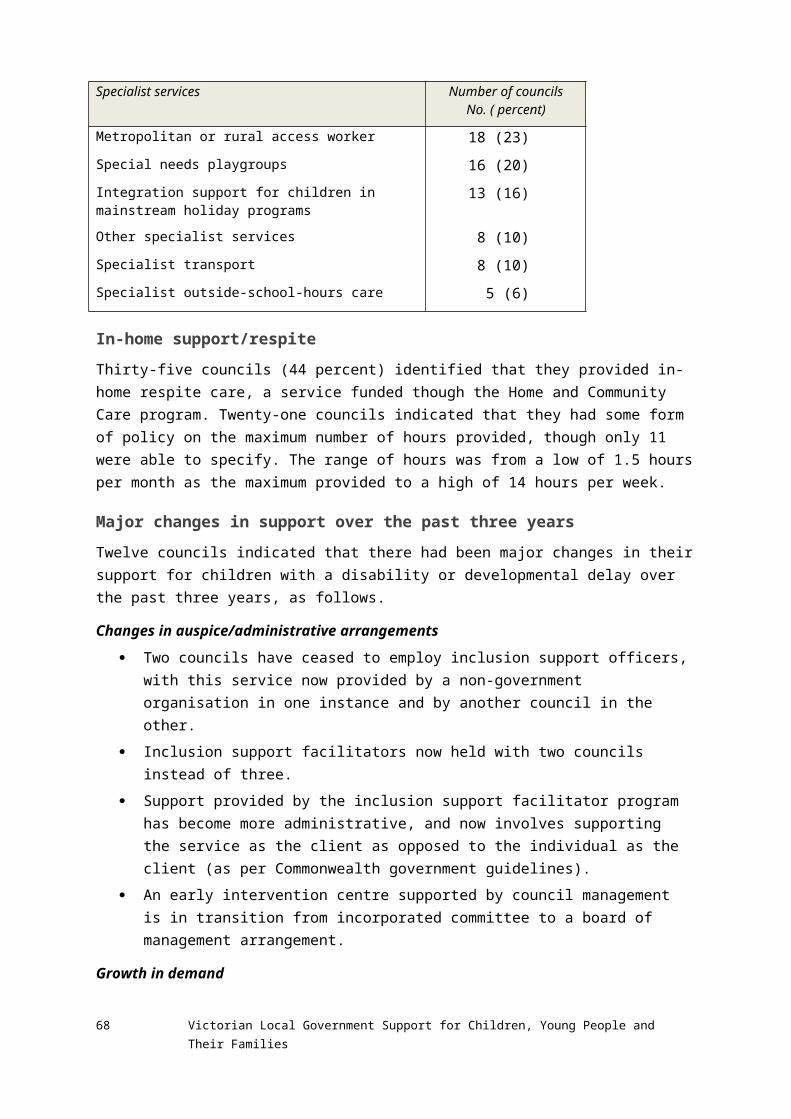
Music/cultural eventsEducation & training
Harm minimistationCultural programs/events
School engagement Holiday program
Mental healthAlcohol related
Physical activitiesHealthy eating
Mentoring Youth discount card
Smoking issues
0 10 20 30 40 50 60 70 80 90 100
Rural Metro
Percentage of councils
Growth corridor, interface and metropolitan fringe councilsAs noted for children’s services, there is an obvious policy and planning interest in whether there are differences in council support for youth services in these three groupings of council. Differences and similarities in patterns of council involvement are discussed.
Growth corridor councilsThese six councils are Cardinia, Casey, Hume, Melton, Whittlesea and Wyndham. As they are all metropolitan councils, they are compared only with other metropolitan councils rather than all councils.
These six councils were more likely than other metropolitan councils to be involved in supporting young people in most areas of activity on which councils reported, particularly in relation to supporting:
youth groups/clubs (83 percent of growth area councils compared to 56 percent of other metropolitan councils)
holiday programs for secondary school children (100 percent growth area councils compared to 60 percent of other metropolitan councils)
sexual health issues (83 percent of growth area councils compared to 44 percent of other metropolitan councils).
68 Victorian Local Government Support for Children, Young People and Their Families

Interface councilsThis grouping includes growth corridor councils as identified above, plus three additional councils: Mornington Peninsula, Yarra Ranges and Nillumbik. Not surprisingly, the major differences between these councils and other metropolitan councils are similar to the growth corridor/metropolitan council comparison, although the addition of these three councils changed the proportions changed slightly:
youth groups/clubs (78 percent compared to 54 percent of other metropolitan councils)
sexual health issues (66 percent compared to 44 percent of other metropolitan councils).
One change was that the proportion of interface councils reporting support for school holiday programs for secondary school children was at a similar level as for other metropolitan councils.
Metropolitan fringe councilsThese councils are Baw Baw, Hepburn, Macedon Ranges, Mitchell, Moorabool and Murrindindi shires. Compared to other Victorian councils, these councils were less likely to be involved, particularly in the following areas:
holiday programs for secondary school children (16 percent of metropolitan fringe councils compared to 48 percent of other councils)
cultural programs/events for young people (16 percent compared to 59 percent of other councils)
mentoring programs for young people (16 percent compared to 41 percent of other councils)
healthy eating issues for young people (nil compared to 32 percent of other councils) physical activities for young people (16 percent compared to 41 percent of other
councils) alcohol issues for young people (16 percent compared to 41 percent of other
councils) sexual health issues for young people (nil compared to 33 percent of other councils) youth outreach activities (16 percent compared to 34 percent of other councils).
Metropolitan fringe councils were much more likely to be involved in programs at recreational facilities (100 percent compared to 70 percent of other councils).
Part B: Services for Young People (13–25 years) 69

3.2 Investment in youth servicesCouncil reports on their investment in youth services is provided under the following headings:
Recurrent expenditure 2010–11 Effective full-time (EFT) staffing levels Major changes in investment over the past three years.
Recurrent expenditure 2010–11Councils reported their recurrent/operational expenditures for providing or funding specific services and infrastructure for young people in bands of $250,000, including funds provided by all sources, including other levels of government. Responses are summarised in Figure 16. Council expenditure ranged from $nil–250,000 per annum to greater than $2 million. The most common category of expenditure was in the $nil–250,000 range (43 percent of councils).
This distribution of recurrent expenditure is further analysed in terms of metropolitan–rural differences in Figure 17. Overall, as might be expected, rural councils have lower recurrent expenditure to support young people than metropolitan councils with their larger populations and budgets. All 34 councils which nominated recurrent expenditure levels in the nil to $250,000 range were rural councils. In addition, just over half of metropolitan councils reported increased expenditure in this area over the past three years, compared to 37 percent of rural councils.
Councils also reported on the proportion of this recurrent expenditure coming from their funds, as indicated in Figure 18. Councils’ reports of expenditure on support for young people ranged from a very small proportion to more than half of their recurrent expenditure. Overall, about two-thirds of councils reported that council expenditure accounted more than half of the amount to be expended in 2010–11.
Figure 16: Recurrent 2010–11 expenditure on youth services and infrastructure
70 Victorian Local Government Support for Children, Young People and Their Families

Nil to 250k
250k-500k
500k-750k
750k-1m 1m-1.25m
1.25m-1.5m
1.5m-1.75m
1.75m-2m
2m+0
5
10
15
20
25
30
35
40
45
50Pe
rcenta
ge of
coun
cils
Figure 17: Recurrent 2010–11 expenditure on youth services and infrastructure, by metropolitan and rural councils
Nil to 250k
250k-500k
500k-750k
750k-1m 1m-1.25m
1.25m-1.5m
1.5m-1.75m
1.75m-2m
2m+0
10
20
30
40
50
60
70
80
MetroRural
Perce
ntage
of co
uncils
Figure 18: Proportion of recurrent expenditure on youth services and infrastructure from council funds
Part B: Services for Young People (13–25 years) 71

0-20 21-40 41-60 61-80 81-1000
5
10
15
20
25
30
35
Percentage of council contribution
Perce
ntag
e of c
ounc
ils
72 Victorian Local Government Support for Children, Young People and Their Families

Figure 19 presents the average percentages of funding from councils’ resources, from Victorian government, Commonwealth government and other sources, for a total of 100 percent of funding. For the purposes of this analysis, councils have been grouped into four categories of recurrent expenditure:
nil to less than $250,000 (43 percent of councils) $250,000 to less than $500,000 (16 percent of councils) $500,000 to less than $1 million (20 percent of councils) more than $1 million (20 percent of councils).
The proportion of recurrent expenditure funded directly by councils increases as council expenditure in this area increases and there appears to be some corresponding reduction in the proportion provided from Victorian government sources. Commonwealth government and other sources of funding provide only a minor contribution.
Figure 19: Proportion of council recurrent expenditure on youth services and infrastructure from different funding sources
$0-<250k $250k- <500k $500k- <1m $1m+
0
10
20
30
40
50
60
70
80
90
100
Other sourcesComm GovtVic. Govt.Local council
Perce
ntag
e of e
xpen
ditur
e
Effective full-time (EFT) staffing levelsCouncils reported on the number of full-time EFT staff members involved in supporting young people, as summarised in Figure 20. The number of EFT staff positions ranged from 1–2 staff to more than 10 staff. The majority of councils had 1–2 staff members allocated to youth issues.
As evident from Figures 16 and 20, 43 percent councils had youth support expenditure in the lowest budget category and 52 percent had staffing at the lowest levels. However, in checking directly with three councils where there appeared to be a discrepancy between levels of expenditure and staffing, the following three situations emerged:
one council that had nominated high level of expenditure and lowest category of staffing had done so because they contracted out their services
Part B: Services for Young People (13–25 years) 73

another may have included staffing with other responsibilities in addition to youth issues
a third one had made an error in completing the survey (now corrected).
Figure 20: Number of effective full-time staffing positions for youth services and infrastructure
1-2 staff 3-4 staff 5-6 staff 7-8 staff 9-10 staff > 10 staff0
10
20
30
40
50
60
Perce
ntag
e of c
ounc
ils
Major changes in investment over the past three yearsCouncils reported on whether investment had increased, decreased or stayed the same as summarised in Figure 21. The majority of councils indicated that youth investment had remained unchanged over the past three years, with over 40 percent having increased it.
Figure 21: Changes in investment in youth services and infrastructure over the past three years
Investment unchanged Investment increased Investment decreased0
10
20
30
40
50
60
Perce
ntage
of cou
ncils
74 Victorian Local Government Support for Children, Young People and Their Families
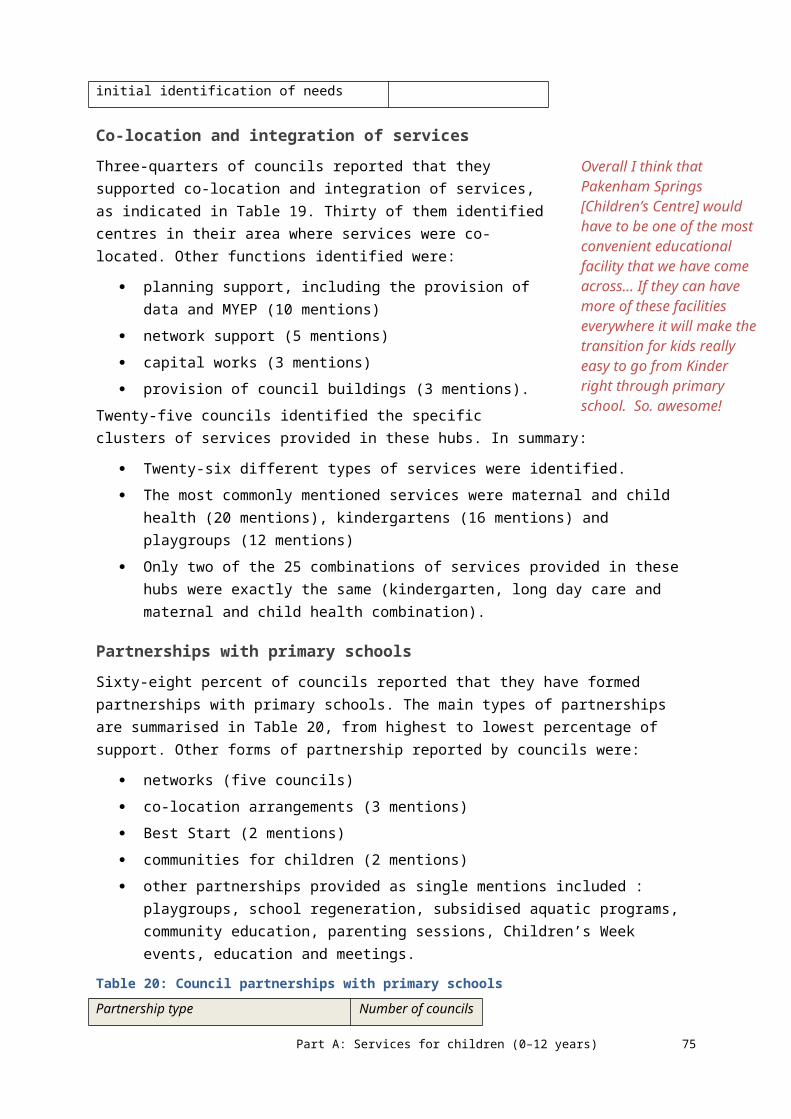
Part B: Services for Young People (13–25 years) 75

3.3 Communication, consultation and participation in decision-making strategies Councils reported on communication, consultation and participation in decision-making strategies, including any major changes in these strategies over the past three years.
Communication strategiesMost councils (83 percent) reported that they had strategies for communicating with young people. Their identified strategies are summarised in Table 29, from highest to lowest percentage. The majority of councils reported being involved in producing flyers, a youth services website and social networking media.
Table 29: Strategies used by councils to communicate with young people Strategy Number of councils
No. ( percent)
Flyers 50 (63)
Youth services website 46 (58)
Social networking media (e.g. Facebook and Twitter) 40 (50)
Text messaging 36 (45)
Directory of services targeted to youth 34 (43)
Noticeboards 34 (43)
Youth information centres 25 (31)
Fact sheets 21 (26)
Youth newsletter 21 (26)
Other 20 (25)
Other strategies identified by 20 councils are summarised, with a number of councils mentioning more than one strategy:
information cards (7 mentions): youth contact card, flip cards, postcards and discount card
newsletters/mail-outs (6 mentions): mail-outs of local newsletters, general mail-outs, youth database and council newsletter
print media (5 mentions): local newspapers, youth services page in local newspaper through schools (6 mentions): school newsletters, school talks, school-based
programs and school-based outreach online (four mentions): website, digital communication, e-newsletter and email through specific programs (3 mentions): forums and information sessions, focus
groups and consultations and youth chat rooms other single mentions were radio; street-based outreach; word of mouth; youth bus
being established; a youth participation framework in which young people are involved in the development of services and programs affecting them; communication
76 Victorian Local Government Support for Children, Young People and Their Families
A recurring theme identified in consultations with young people is their desire and interest to participate and contribute in practical ways to the development of the community. (Whittlesea Youth Plan 2030)
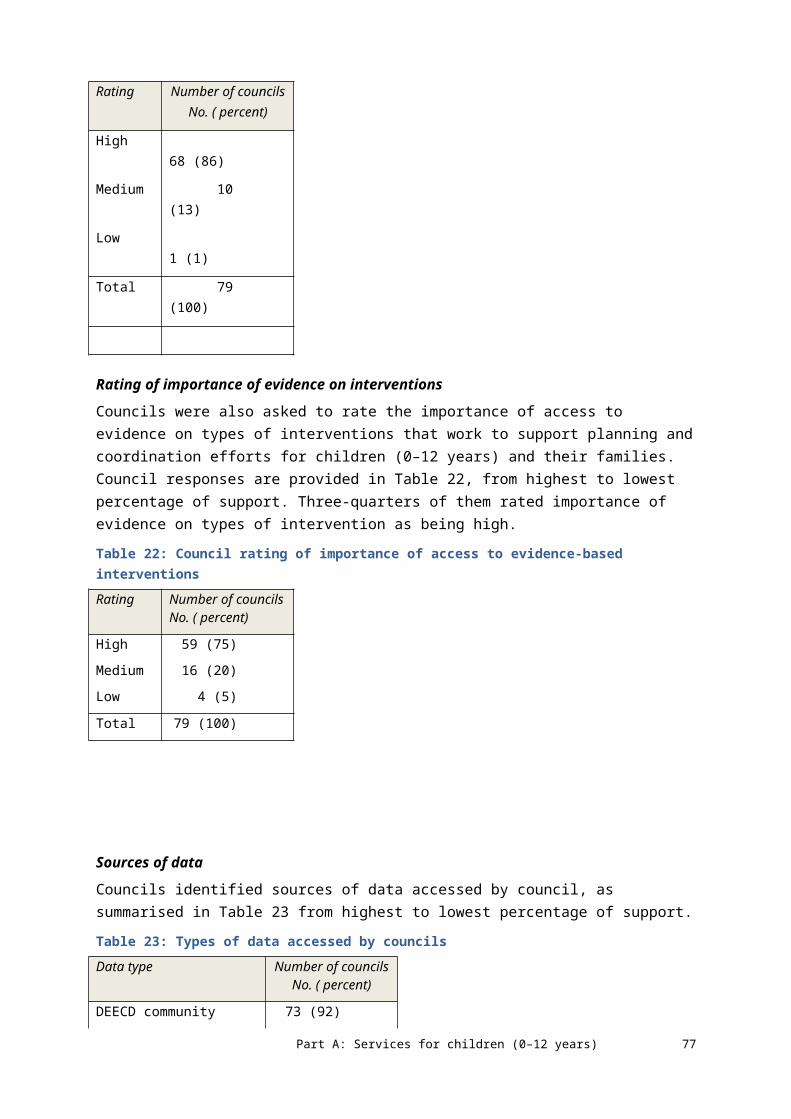
strategies run through agencies; and communicating through a mobile youth information centre.
Consultation strategiesMost councils (85 percent) reported that they had strategies for consulting with young people. They also identified strategies used, as summarised in Table 30, from highest to lowest percentage. The majority of councils organise forums, surveys and focus groups as methods of consulting with young people.
Table 30: Strategies used by councils to consult with young peopleStrategy Number of councils
No. ( percent)
Forums 54 (68)
Surveys 54 (68)
Focus groups 50 (63)
Other 18 (23)
Suggestion boxes 14 (17)
Other consultation strategies nominated by 18 councils are: specific councils/committees (14 mentions): youth and junior youth councils,
reference groups, advisory forums and committees, leadership groups, consultative committees, steering committees, separate multicultural, Indigenous and disability groups, and working groups on specific issues
online consultation (4 mentions): online forums using facebook and twitter, online discussion boards, vox-pop through youth website, feedback section on youth website
consultation through events (5 mentions): one-off events, youth summits held biannually, skate parks, music events and community festivals, committees for projects and FReeZA committee
consultation through direct contact (3 mentions): face-to-face interviews, one-on-one contact and feedback from young people through school outreach
other forms of consultation (3 mentions): peer consultations (employing young people to consult with peers), program evaluations and Youth Foundations Victoria partnership.
Participate in council decision-makingJust under three-quarters of councils (73 percent) reported that they had strategies in place to actively involve young people in their decision-making processes. They also identified strategies they used as summarised in Table 31, from highest to lowest percentage. The majority involve young people in organising events, with a minority reporting a range of other strategies.
Part B: Services for Young People (13–25 years) 77
It is the clear intent of this Youth Plan that the focus of Council’s current and future efforts will be to work with young people and their families, including the most vulnerable, to strengthen their resilience, protect them against risk and promote their health and wellbeing (Knox Youth Plan)

Table 31: Strategies used by councils to involve young people in the decision-making processes of council Strategy Number of councils
No. ( percent)
Young people organising events 46 (58)
Youth council 25 (31)
Youth advisory committee 23 (29)
Youth working group 20 (25)
Youth reference group 13 (16)
Major changes in council communicating and engaging with young people over the past three yearsA majority of councils (58 percent) reported that there have been major changes in council communicating and engaging with young people over the past three years, with some councils identifying more than one change, as follows:
use of social networking/online/new technologies (16 mentions): websites, social networking, youth facilities
development of youth advisory processes (15 mentions): youth councils, social action groups, youth facilities and services steering committees, forums, development of youth leaders and town meetings
adoption of youth charter/plan/strategy (9 mentions) increased funding/resourcing (6 mentions): support for youth councils and specific
grants increased involvement overall in the past three years (6 mentions): consultation and
participation opportunities, and dedicated youth spaces changes to staff (5 mentions): new youth development offices, youth engagement
teams and youth ambassadors individual contact (2 mentions): text messaging participants involved in programs and
email use other mentions were targeted communications strategies and development of a
place-based model of youth services.
3.4 Coordination and planning of services for young people Responses on coordination are summarised under the following headings:
Overall assessment of local coordination efforts Mechanisms to promote coordination Major changes in coordination over the past three years.
(A discussion of the use of data to support local planning/coordination is provided in the section 3.5.)
78 Victorian Local Government Support for Children, Young People and Their Families
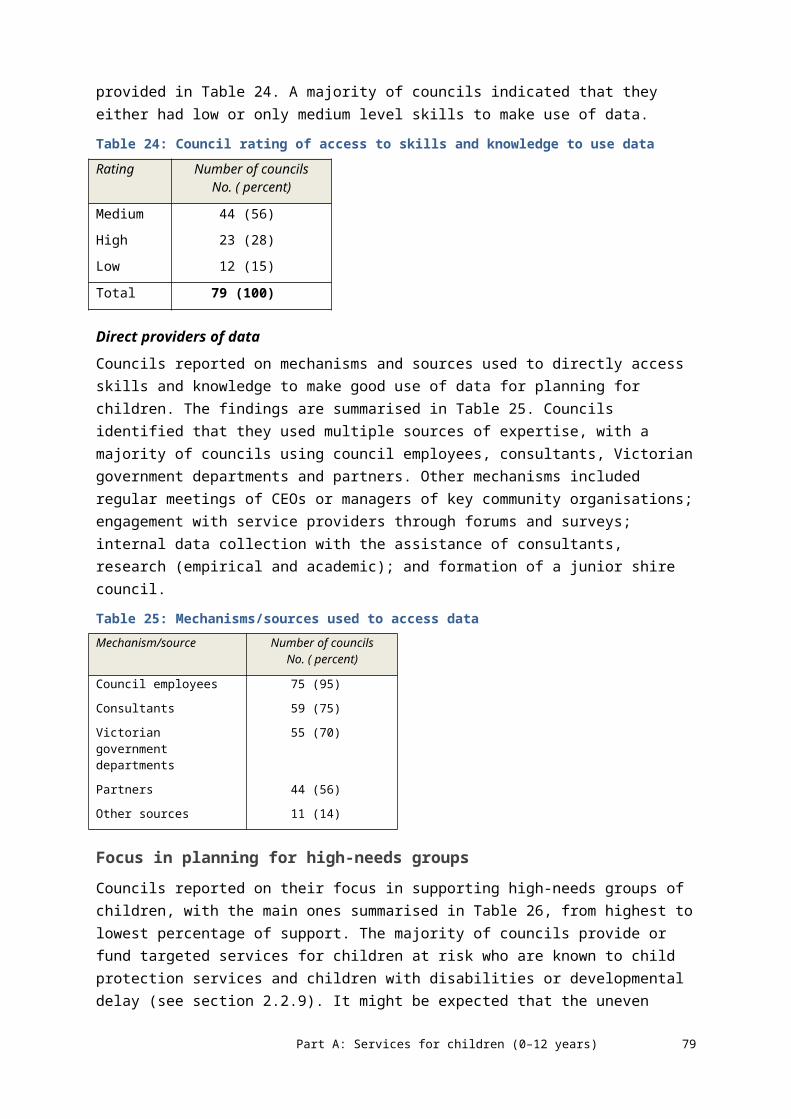
Overall assessment of local coordination effortsCouncils reported on whether they had no role, a minor role or a major role in coordinating youth services, with their responses summarised in Table 32, from highest to lowest percentage.
Table 32: Extent of support to coordinate youth servicesExtent of support Number of councils
No. ( percent)
Council has major role in coordinating youth service provision
47 (60)
Council has minor role in coordinating youth service provision
29 (37)
Council has no role in coordinating youth service provision
3 (4)
Total 79 (100)
The majority of councils reported that they had a major role in coordinating youth services. Councils also reported on whether local coordination efforts were well done or provided minor or major challenges. The question concerned council views on how well coordination was undertaken and not council views of their own coordination efforts. Their responses are summarised in Table 33, from highest to lowest percentage.
Table 33: Council views on effectiveness of coordination of local youth servicesLevel of effectiveness Number of councils
No. ( percent)
It presents some minor challenges 42 (53)
It presents major challenges 25 (32)
It is well done 12 (15)
Total 79 (100)
The majority of councils reported that coordination of youth services provides minor challenges. The 25 councils that identified major challenges described them, often mentioning more than one challenge, summarised from most to least frequent mentions, as follows:
coordination as challenging (12 mentions), including issues related to services provided across municipalities, no co-location of services, no single entry point into services, different working hours, fragmentation, lack of strategic partnerships and competitive funding
lack of funds and resources (10 mentions), including lack of staffing and complicated and fragmented funding arrangements
delivering services to a dispersed population (5 mentions), including issues related to locations, transport, primacy of regional cities as focal point of service delivery, and different areas requiring different responses
lack of services in the local area (4 mentions) generational culture differences make it difficult (3 mentions): schoolies, lack of
school completion/further education, and young mums Part B: Services for Young People (13–25 years) 79

no clear data set (3 mentions): difficult to get a sense of young people as a whole, and a lack of data sharing
currently under review and future planning is being attempted (2 mentions) one of many challenges that need to be addressed.
Mechanisms to promote coordinationCouncils reported on whether they had in place 17 possible mechanisms listed in the survey that promote coordination or integration of services for young people. Council responses are summarised in Table 34, from highest to lowest percentage. The majority of councils have multiple mechanisms to promote coordination and integration of services, with three-quarters or more of councils identifying three mechanisms: facilitating community connections, facilitating local service networks, and the existence of a strategic broad plan to support young people.
Table 34: Council mechanisms to coordinate or integrate services for young people Mechanism Number of councils
No. ( percent)
Facilitates community connections/engagement and capacity
63 (80)
Fosters local service networking across services and programs
59 (75)
Council has a strategic or broad action plan that relates to supporting young people
59 (75)
Regional Youth Affairs Networks (RYANS) 58 (73)
Community service planning 55 (70)
Identification of service gaps and solutions to address these
51 (65)
Involvement with school-focused youth service 50 (63)
Participation in local alcohol and drug strategies 48 (61)
Council has a formal statement of commitment to young people
44 (56)
Councils support centres/hubs which bring together multiple services for young people in the one location
33 (42)
Formal contracts with providers of youth service 32 (41)
Other regional networks 31 (39)
Regional youth commitment 24 (30)
Protocols for intake and referral of services 20 (25)
Case management approaches 19 (24)
Common assessment tools/models for initial identification of needs
15 (19)
Inclusion Support Facilitators 6 (8)
Action plan or statement of commitmentAs indicated in Table 34, three-quarters of councils had an action plan and a majority had a formal statement of commitment to young people. Eighty percent of councils had either an action plan or a statement of commitment.80 Victorian Local Government Support for Children, Young People and Their Families

Council support for centres/hubs for young peopleAs indicated in Table 34, 42 percent of councils provided support to centres/hubs bringing together multiple services for young people in the one location, with more detailed feedback from councils on the nature of these hubs summarised as:
dedicated youth centres, including activities and youth counselling/support (12 mentions)
services provided as part of a larger community house/centre (8 mentions) one-stop dedicated youth services centres, including externally provided co-located
services (8 mentions) other examples of services without enough detail to classify (8 mentions) centre providing youth activities/ training only (7 mentions) services aimed at vulnerable youth (2 mentions) religious groups (1 mention).
Council partnershipsCouncils were also asked to identify whether they collaborated with a range of possible partners to support young people. Council responses are summarised in Table 35, from highest to lowest percentages.
Table 35: Council partnerships to provide services and supports for young peoplePartner Number of councils
No. ( percent)
Secondary schools 70 (89)
Local Learning and Employment Networks (LLENS) 69 (87)
Victoria Police 63 (80)
Victorian Department of Education and Early Childhood Development (DEECD)
57 (72)
Non-government organisations (NGOs) 49 (62)
Alcohol and other drug services 47 (59)
Department of Human Services (DHS) 46 (58)
Mental health services 45 (57)
TAFEs 43 (54)
Local employers 39 (49)
Centrelink 34 (43)
Department of Health (DH) 30 (38)
Commonwealth Department of Families, Housing, Community Services and Indigenous Affairs (FaHCSIA)
25 (32)
Victorian Multicultural Commission 17 (21)
Other partners 9 (11)
Part B: Services for Young People (13–25 years) 81

Most councils identified partnerships with secondary schools, LLENS and Victoria Police. The other partners identified by nine councils were as follows:
youth/community services (3 mentions) other NGOS (3 mentions) Office for Youth (DPCD at time of survey, now in DHS) (3 mentions) sports/recreation (3 mentions) arts (3 mentions) Uniting Church and inner-Melbourne VET (vocational education and training)
network. TAFE partners.
As indicated in Table 35, 43 councils (54 percent) identified partnerships with TAFEs. These councils also provided names of TAFES, with a small number of councils mentioning more than one. The TAFES are listed in alphabetical order with the number of mentions in brackets (when more than one):
Ballarat University (4 mentions) Box Hill (2 mentions) Bendigo Regional institute Central Gippsland Chisholm Institute (4 mentions) Community College Bacchus Marsh Gippsland (2 mentions) East Gippsland TAFE (2 mentions) Goulburn Ovens TAFE (2 mentions) Holmesglen (4 mentions) Gordon GOTAFE (2 mentions) GOTAFE (Seymour) Kangan Batman (2 mentions) Northern Melbourne Institute (5 mentions) RMIT (2 mentions) South West Sunraysia Institute SuniTAFE Swinburne (6 mentions) Victoria University (6 mentions) William Angliss Wodonga (2 mentions).
82 Victorian Local Government Support for Children, Young People and Their Families

Non-government organisations (NGO) partners As indicated in Table 35, 49 councils (62 percent) identified specific NGOs, with a number of councils indentifying more than one. The types of NGOS identified by councils are listed, from most frequently to least frequently mentioned:
community health services (24 mentions) child and family services (20 mentions) migrant support (13 mentions) youth services (13 mentions) community service organisations covering a range of services/needs (11 mentions) education/training/employment (10 mentions) drug and alcohol support services (7 mentions) community centres (6 mentions) schools (6 mentions) homelessness/housing support (2 mentions) Indigenous services (2 mentions) single mentions were Sexual Assault Support Services, disability services, general
practitioners (GPs), and counselling service for primary producers.
Major changes in coordination over the past three yearsThirty-four councils (43 percent) identified that there had been major changes in its coordination and planning of youth services over the past three years, with some indicating more than one change. All these responses either explicitly or implicitly indicated an increase in local government involvement in this area, as follows:
new staffing positions/additional investment (13 mentions) updated/revised youth strategy (11 mentions) new consultation and planning groups developed (5 mentions) new program/services developed (5 mentions) involvement in Better Youth Service Pilot program (5 mentions) more involved in general (4 mentions) engagement with external youth services (2 mentions) restructured and/or relocated youth services (2 mentions) redefined role for council as planners and coordinators (3 mentions) reviewed services (2 mentions) new advocacy development through Victorian government funded network (1
mention).
Part B: Services for Young People (13–25 years) 83

3.5 Use of data to support coordination and planningCouncil responses to questions on the use of data are summarised under the following headings:
Importance of data Sources of data expertise Gaps in data.
Importance of dataCouncils rated their views on the importance of access to local data to support local planning for youth services, as set out in Table 36, from highest to lowest percentage. Most councils viewed access to local data as being of high importance. Councils also rated their views on the importance of access to local data on types of intervention that worked, as set out in Table 37 from highest to lowest percentage. The majority of councils viewed access to evidence on the types of intervention that work as being of high importance.
Table 36: Council views on importance of access to local data for youth service planning Importance of access to local data Number of councils
No. ( percent)
It is of high importance 63 (80)
It is of medium importance 12 (15)
It is of low importance 4 (5)
Total 79 (100)
Table 37: Council rating of importance of access to evidence-based interventionsImportance of access to evidence on interventions
Number of councilsNo. ( percent)
It is of high importance 63 (80)
It is of medium importance 12 (15)
It is of low importance 4 (5)
Total 79 (100)
Sources of data Councils reported on what data sources they accessed to support local planning for youth services, as summarised in Table 38, from highest to lowest percentage. Three quarters of councils reported accessing ABS data.
84 Victorian Local Government Support for Children, Young People and Their Families

Table 38: Data used by councils to support local youth service planning Data source Number of councils
No. ( percent)
ABS 75 (95)
Centrelink 34 (43)
Other sources of evidence (specified in following text)
29 (37)
VCAMS* population data 26 (33)
VCAMS catalogues of evidence on interventions
12 (15)
* Victorian Child and Adolescent Monitoring System
Other data sources identified by 29 councils include a mixture of Victorian government, local sources, non-government organisations, the Commonwealth government, employment or education agencies and research organisations/ universities as follows:
Victorian government sources (31 mentions): DEECD (11), Victoria Police (9), Department of Human Services (4), Department of Justice (2), Department of Health (2), Office for Youth (2), Coroner’s Court data and surveys of Victorian young people.
local sources (28 mentions):service data and that collected from young people directly
non-government organisations (9 mentions) Commonwealth government sources (7 mentions), including: the Census of
Population and Housing: Socio-Economic Indexes for Areas (SEIFA), Commonwealth government surveys of young people, and other Commonwealth Government (3)
employment or education agency (4 mentions) research organisations or universities (3 mentions).
Sources of data expertiseCouncils reported on sources of data expertise to make good use of the available data for planning services for young people, as reported in Table 39. The mechanism most commonly used by councils was, understandably, council employees, although a majority of councils also used partners, consultants and Victorian government departments. Councils also rated level of access to data for planning services for young people, as reported in Table 40. The majority of councils reported medium access. Given the importance to councils of data, as reported in Tables 36 and 37, it is worth noting that it is only a minority of councils (35 percent) reported high level of access to the skills and knowledge required to make good use of the available data.
Table 39: Sources of data expertise used by councils Sources Number of councils
No. ( percent)
Council employees 75 (95)
Partners 58 (73)
Consultants 47 (59)
Victorian government departments 46 (58)
Other* 7 (9)*Part B: Services for Young People (13–25 years) 85

*Other sources identified were LLENS and local providers of service.
Table 40: Council access to skills/knowledge to make good use of available data Access to skills/knowledge Number of councils
No. ( percent)
Medium level of access 44 (56)
High level of access 28 (35)
Low level of access 7 (9)
Total 79 (100)
Gaps in dataForty-eight percent of councils identified major gaps in data available to them to support improved coordination of services and supports for young people. These gaps are summarised as:
A general lack of available data on specific topics (29 total), including: young people’s use of a range of services: welfare support; mental health; alternative
education and training; youth housing/accommodation and youth justice; use of Medicare and Centrelink; and public transport availability
characteristics of the youth population: CALD characteristics; migration data; rates of homelessness; tracking of young people leaving school early; mental health population data; suicide data; and child protection
local ABS data at the Statistical Local Area (SLA) level bushfire recovery missing voices, including young people, parents and other stakeholders.
Data that is not well tailored to particular local government areas/regions (13 total), including:
data for effective local planning must be locally specific and comprehensive need for data on trends at local government level provision of more specific data on health and other services, including waiting lists for
services used by local population inside the council boundaries and in other council areas
need more accurate data for regional townships concern about the local limitations of VCAMS and How R U? survey data.
A lack of up-to-date data (8 total), including: since the 2009 Victorian bushfires it has been difficult to ascertain what services
agencies are providing, which risks a duplication of services and operating under false assumptions
need data that is easy to replicate on a local, regional and state level in order to support benchmarking
86 Victorian Local Government Support for Children, Young People and Their Families
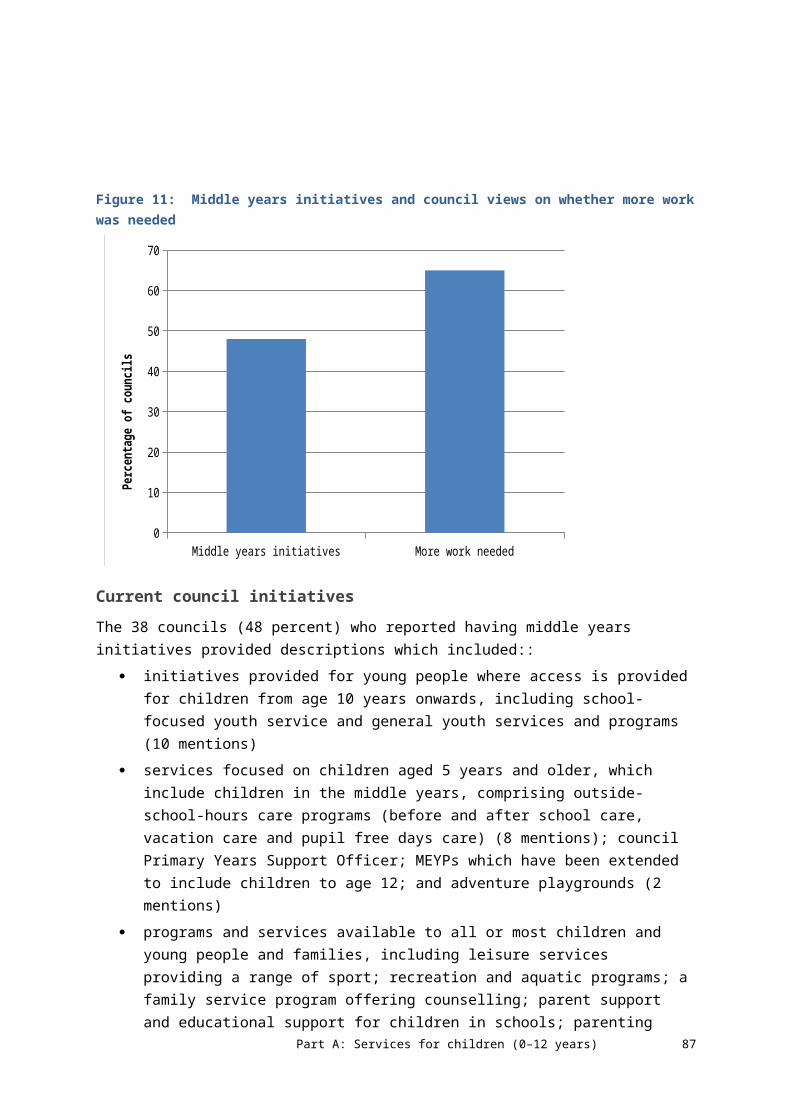
need for data to be provided consistently over a period of time to enable monitoring of trends, including measuring the effectiveness of initiatives
out-of-date data sources.
Listing of a range of data that is not readily available (7 total), including: education: education data, school data, and disengagement risk factors training/workforce and employment/unemployment data crime and Victoria Police data, specifically on victims and perpetrators.
Problems in using the data (6 total), including: gaps in resources to pull together meaningful analysis of data, and a lack of common
language across data collection sources: sampling issues: data sets too small gaps resulting from lack of coordination across services lack of knowledge about what is available too many variables in data for data sets to be useful multiple variances in data sets relating to young people in local area, including the
catchment area covered by data sets, databases used and compatibility, the type of data collection and the purpose of collection.
Problems in accessing data due to high costs (6 total).
3.6 Discussion of findings: Services for young people This survey has, for the first time, provided a statewide snapshot of local government involvement in supporting young people. The reported information ranges from the direct provision and funding of services, to engaging with young people directly and coordinating and planning services and support. In addition, councils reported on 2010–11 recurrent expenditure on young people and the number of effective full-time positions assigned to this work.
Extent of involvementThere was very wide variation in council involvement in supporting young people across the state. Most councils had some level of involvement in music/cultural events for young people and education and training issues. The majority saw themselves as having a major role in coordinating services for young people. However, metropolitan councils were more likely to be involved in the range of activities than rural councils. The growth area councils were more likely that other metropolitan councils to be involved in the full range of activities, while metropolitan fringe councils were less likely to be involved than other councils.
Changes over past three yearsAs with support for children, this is a story in two parts: continuity and change. The majority of councils reported that there had been no changes in support for young people over the past three years. In contrast, about 40 percent of councils reported major changes (mostly increases) in involvement, including increased investment and coordination and planning activities. In addition, a majority of councils reported increased involvement in
Part B: Services for Young People (13–25 years) 87

communicating and engaging with young people, including the use of new social networking technology.
88 Victorian Local Government Support for Children, Young People and Their Families

4. ConclusionThe data questions were intentionally limited to questions which would be relatively easy for council respondents to the survey to complete without additional research or referral to council meetings for policy directions. The strength of this approach was the relatively quick completion of surveys. The limitation is that the survey lacks the level of information required for detailed planning. Rather, its intention was to provide an overview of council involvement to assist the broader development of state–local planning processes and as a starting point for more detailed planning.
Local government is clearly a major player in the provision of support for children, young people and their families. The major variations in the extent of that support identified by councils in the survey provide valuable background information for future policy, planning and resourcing efforts. These include major differences between rural and metropolitan councils, presumably reflecting differences in population size and budgets.
In terms of change, council involvement in children’s services appears to be growing, although some areas show decreased involvement. There was a clear trend for increased support for young people but only for about two-fifths of councils.
One of the considerations for Victorian and local governments is whether all councils need to have a similar level of involvement in ensuring provision of a broad range of services and support for children and young people. The high variability in councils’ current levels of involvement highlights the challenges involved in ensuring a more systemic and consistent level of local support for children and young people.
Conclusion 89