local level isaster risk reduction and limate hange ... · 12 training highlights module i: ......
TRANSCRIPT

Local Level Disaster Risk Reduction and Climate Change Adaptation in Agriculture: Training for Planners and Implementers
Training Documentation Report
The report contains the highlights of the pilot trainings conducted by the AMICAF
Project on “Local Level Disaster Risk Reduction and Climate Change Adaptation in
Agriculture” for local planners in Caraga region on July 29 -31 and for field
implementers in Bicol region on August 11 – 15, 2014.
Page 1 of 132
Table of Contents
Title Page
OVERVIEW OF THE TRAINING DESIGN
Background and Rationale . . . . . . . . . . . . . . . . . . . . . . . . . . . . . . . . . . . . . . . . . . . . . .
. .
3
Objectives . . . . . . . . . . . . . . . . . . . . . . . . . . . . . . . . . . . . . . . . . . . . . . . . . . . . . . . . . . . .
. .
4
Methodology . . . . . . . . . . . . . . . . . . . . . . . . . . . . . . . . . . . . . . . . . . . . . . . . . . . . . . . . .
. .
4
TRAINING SCHEDULES . . . . . . . . . . . . . . . . . . . . . . . . . . . . . . . . . . . . . . . . . . . . . . . . . . . . .
. .
6
THE PARTICIPANTS . . . . . . . . . . . . . . . . . . . . . . . . . . . . . . . . . . . . . . . . . . . . . . . . . . . . . . . .
. .
11
THE RESOURCE PERSONS . . . . . . . . . . . . . . . . . . . . . . . . . . . . . . . . . . . . . . . . . . . . . . . . . . .
. .
12
TRAINING HIGHLIGHTS
Module I: Disaster Risk Reduction and Climate Change Adaptation
for Food and Nutrition Security . . . . . . . . . . . . . . . . . . . . . . . . . . . . . . . . . .
. .
17
Session 1 (Option1): Climate Variability and Extreme Events . . . . . . . . . . . . . . . . . . .
. .
19
Session 1 (Option2): Climate Change, Disasters and Food Security . . . . . . . . . . . . . .
. .
30
Session 2: Basic Meteorology
Weather/Climate Observation and Forecasting . . . . . . . . . . . . . . . . . . . . .
. .
34
Session 3: Impacts of Climate Variability and Change
on Food and Nutrition Security . . . . . . . . . . . . . . . . . . . . . . . . . . . . . . . . . .
. .
37
Session 4: Climate Change, Agriculture and Food Security:
Concepts, Linkages and Considerations for Community-based
Disaster Risk Reduction and Climate Change Adaptation . . . . . . . . . . . . .
. .
42
Module II: Tools and Methods For Disaster Risk Reduction
and Climate Change Adaptation . . . . . . . . . . . . . . . . . . . . . . . . . . . . . . . . . .
. .
47

Page 2 of 132
Session 1a: Understanding Hazard and its Impacts . . . . . . . . . . . . . . . . . . . . . . . . . . .
. .
48
Session 1b: Hazard, Risk, Vulnerability, and Capacity Assessment . . . . . . . . . . . . . . .
. .
51
Session 2: Spatial and Temporal Analysis of Climate Change
Agricultural Impacts . . . . . . . . . . . . . . . . . . . . . . . . . . . . . . . . . . . . . . . . . . .
. .
57
Session 3: Introduction to Maps and Geographic Information System . . . . . . . . . . .
. .
59
Module III: Planning and Implementing Disaster Risk Reduction
and Climate Change Adaptation in Agriculture Initiatives . . . . . . . . . . . .
. .
62
Session 1: Overview of Existing Policies on Disaster Risk Reduction
and Climate Change Adaptation . . . . . . . . . . . . . . . . . . . . . . . . . . . . . . . . . .
. .
63
Session 2: Strategic Planning: Harmonizing Disaster Risk Reduction
and Climate Change Adapation in Agriculture
and Local Governance . . . . . . . . . . . . . . . . . . . . . . . . . . . . . . . . . . . . . . . . . .
. .
79
Session 3: Approaches to Assessment of Impacts and Vulnerability
to Climate Change and Adaptation Options . . . . . . . . . . . . . . . . . . . . . . . .
. .
87
Session 4: Integrating Cross-cutting Concerns: Gender . . . . . . . . . . . . . . . . . . . . . . . .
. .
90
Session 5: Implementing Community-based Early Warning System
for Agriculture . . . . . . . . . . . . . . . . . . . . . . . . . . . . . . . . . . . . . . . . . . . . . . . .
. .
98
Module IV: Participatory Monitoring and Evaluation for Disaster Risk
Reduaction and Climate Change Adaptation in Agriculture . . . . . . . . . .
. .
103
Session 1: Concepts in Participatory Monitoring and Evaluation
for Disaster Risk Reduction and Climate Change Adaptation
in Agriculture . . . . . . . . . . . . . . . . . . . . . . . . . . . . . . . . . . . . . . . . . . . . . . . . .
. .
104
Session 2: Considerations for Assessment, Monitoring,
and Evaluation for Results – based Adaptation Planning . . . . . . . . . . . . . .
. .
109
Module V: Climate-Smart Agriculture and Good Practice Options . . . . . . . . . . . . . . .
. .
111

Page 3 of 132
Session 1: Introduction to Climate-Smart Agriculture
and Good Practice Options . . . . . . . . . . . . . . . . . . . . . . . . . . . . . . . . . . . . . .
. .
112
Session 2: Sustainable and Organic Agriculture Systems
for Climate-Smart Agriculture . . . . . . . . . . . . . . . . . . . . . . . . . . . . . . . . . . . .
.
114
Session 3: Developing Sustainable and Inclusive Food Value Chains . . . . . . . . . . . . .
. .
115
Session 4: Climate-Smart Forestry . . . . . . . . . . . . . . . . . . . . . . . . . . . . . . . . . . . . . . . . .
. .
116
Module VI: Communicating Climate Change Smartly . . . . . . . . . . . . . . . . . . . . . . . . . .
. .
117
Session 1: Risk Communication . . . . . . . . . . . . . . . . . . . . . . . . . . . . . . . . . . . . . . . . . . .
. .
118
Session 2: Techniques and Methods in Translation and Popularization . . . . . . . . . .
. .
122
EVALUATION RESULTS . . . . . . . . . . . . . . . . . . . . . . . . . . . . . . . . . . . . . . . . . . . . . . . . . . . . . . .
124
LINKS TO ONLINE REFERENCE SOURCES . . . . . . . . . . . . . . . . . . . . . . . . . . . . . . . . . . . . . . .
. .
127
Overview of the Training Design
Background and Rationale
The unprecedented impacts of climate change will ultimately alter the lives of many vulnerable
groups especially the rural folks who have no or limited access to resources and livelihood
options in order to adapt. In the Philippines, the rural population greatly depends on agriculture
and fisheries both as a means of livelihood and as a source of food. With the archipelagic
location of the country, the increasing occurrence and intensity of extreme weather events like
typhoons can severely damage crops and aggravates or cause hazards that can damage assets in
production, marketing and agriculture based livelihoods. In terms of production, crops respond
Page 4 of 132
even to the slightest change in temperature and water availability. Thus, with the gradual
change in temperature and precipitation pattern, farmers have to deal with lower crop yield and
in extreme cases, crop failure. All these threaten the stability of food availability, accessibility
and utilization.
Climate change is not an individual problem. It is a global phenomenon that affects everybody
but its impact varies across locations and sectors. Some sectors like agriculture are vulnerable to
its impacts and so are people living in poverty. Thus, reducing risks from disasters while adapting
to its impact require collective action from the national and local levels.
While disaster risk reduction (DRR) and climate change adaptation (CCA) and mitigation have
become a major agenda of the government and structures are set-up/ strengthened for this
purpose (e.g. NDRRMC and CCC), the local government units (LGUs), being the frontline of basic
services to the communities, should serve as the platform of convergence to operationalize and
implement location specific efforts. With development issues as aggravating factor in
vulnerability, the understanding of LGUs of their local realities can well define their DRR and CCA
efforts.
Another key to successful community-based DRR and CCA efforts is the scientific understanding
of climate change and its causes. A scientific view would help them understand what is
happening, why it is happening, and what/how should they do about it. The scientific knowledge
also forms a solid base for planned adaptation.
This training is then designed for local policy makers, development planners and field
implementers purposely to initiate or strengthen DRR and CCA initiatives in agriculture at the
community level. The modules were developed and pilot tested as one of the outputs of a
project titled, “Assessments of Climate Change Impacts and Mapping of Vulnerability to Food
Insecurity under Climate Change to Strengthen Household Food Security with Livelihoods’
Adaptation Approaches” (AMICAF) of the Food and Agriculture Organization of the United
Nations implemented in the Philippines through the Department of Agriculture, other
government agencies, academic institutions, and the local government units of the two pilot
regions, Bicol (Region V) of southern Luzon and Caraga (Region XIII) of northeastern Mindanao
from October 2011- March 2015. The AMICAF is a comprehensive framework that combines
building evidence-base for adaptation planning (Steps I and II), testing adaptation options on the
farm (Step III) and providing enabling environment for all of the above (Step IV).
Objectives
In general the training is designed for local policy makers/development planners and field
implementers to initiate or strengthen DRR and CCA initiatives in agriculture at the community
level.
Specifically, it is hoped that after completing the modules in this training, the participants would
be able to perform the following:
1) integrate DRR and CCA into their respective municipal local development plans; and
2) support the implementation of local DRR/CCA initiatives through appropriate policies
and budget allocations.

Page 5 of 132
Methodology
The training design was progressively developed as part of Step IV of the AMICAF Project by a
training management team composed of the project staff and a hired consultant. This was done
in collaboration with the project’s regional partners in Bicol and Caraga who are familiar with
the capacity needs at the field level during a workshop conducted for this purpose on April 29-
30, 2014 in Quezon City. From this workshop, six major themes were identified which eventually
became the modules containing key topics incorporating the experiences/learnings from the
AMICAF and other DRR/CCA related projects. The key topics were also gleaned from the needs
and situations manifested during the Regional Institutional Analysis Workshops conducted by
the project for Bicol and Caraga in September 2013. From these workshops, it was found that at
least for both regions, their efforts towards DRR and CCA in agriculture have reflected
interdisciplinary/across the value chain approaches and several modalities were already
employed to enlist community participation. Hence, the following modules that were pilot
tested to these regions hoped to strengthen the capacities not only of their field implementers
but also their policymakers to enable their ongoing efforts to be supported by local government
funds.
The six modules are as follows:
MODULE I DRR and CCA for Food and Nutrition Security Session 1 Climate and Climate Change
Session 2 Basic Meteorology, Weather/Climate Observation and Forecasting
Session 3 Impacts of Climate Variability and Change on Food and Nutrition Security
Session 4 (Synthesis)
Climate Change, Agriculture and Food Security: Concepts, Linkages and Considerations for Community-based DRR and CCA
MODULE II Tools and Methods for DRR and CCA Session 1 Hazard, Risk, Vulnerability, and Capacity Assessment
Session 2 Spatial and Temporal Analysis of Climate Change Agricultural Impacts
Session 3 Introduction to Maps and Geographic Information System
MODULE III Planning and Implementing DRR and CCA in Agriculture Initiatives Session 1 Overview of Existing Policies on DRR and CCA
Session 2 Strategic Planning: Harmonizing DRR and CCA in Agriculture into Local Governance
Session 3 Implementing DRR and CCA Initiatives through Community-based Approaches
Session 4 Integrating Cross-cutting Concerns
Session 5 Implementing Community-based Early Warning Systems for Agriculture
MODULE IV Participatory Monitoring and Evaluation for DRR and CCA in Agriculture
MODULE V Climate-smart Agriculture and Good Practice Options
MODULE VI Communicating Climate Change Smartly
Delivery
The training design was delivered in two different modes, one for local planners and the other
for field implementers. The pilot training for local planners was conducted in Caraga on July 29-
31, 2014 in Surigao City, Surigao del Norte. This three-day training covered Modules I, III and V
which aimed to help local government planners integrate DRR and CCA into their local
development plans. For field implementers, all of the six modules were covered and were pilot
tested in Bicol for five days from August 11-15, 2014 in Nabua, Camarines Sur. Modules II, IV and
VI were considered “specialized topics” in DRR and CCA field implementation and participants in
Bicol can better relate to them because of their exposures to DRR/CCA projects.

Page 6 of 132
Both trainings were carried out with the active participation of the DA regional field offices and
other AMICAF regional partners. Invited speakers were technical experts from scientific and
academic institutions within each region and were complemented by the AMICAF consultant.
A module delivery plan was prepared for each module outlining the learning objectives and key
messages to be covered. This was given to the resource persons before the training proper. The
said plan elaborated the module theme through the key topics covered by sessions. Ideally, each
session starts with a workshop to draw out local experience and understanding of the topic. This
is immediately followed by a lecture to synthesize and deepen the participants’ understanding
about the topic by providing the necessary and appropriate input.
Evaluation
A general evaluation form was prepared and was administered at the end of the training. The
form included evaluation on the training management, content and delivery. Process
documentation throughout the training duration was also done by the training management to
immediately address concerns and gaps arising every session. Necessary adjustments in content
and delivery modes were done through proper briefing and coaching to the resource persons by
the AMICAF consultant based on noted observations during the workshop.
Training Schedules
The following tables show the planned run-down of the modules in the pilot trainings
conducted:
Table 1. Training Schedule for Local Planners (Caraga region), Mt. Bagarabon Beach Hotel and
Mountain Resort, P-6, Mabua, Surigao City, 29 – 31 July 2014
TIME ACTIVITY PERSON RESPONSIBLE

Page 7 of 132
DAY 1
7:30 – 8:30
Registration RS Parejo, EM Velasquez
8:31 – 9:30
Opening Program 1. Preliminaries 2. Welcome/ Opening Remarks 3. Expectation Setting 4. Training Overview 5. Host Team Formation
9:31 – 11:00
MO
DU
LE
I
Disaster Risk Reduction (DRR) and Climate Change Adaptation (CCA) for Food and Nutrition Security
Session 1: Climate and Climate Change
Daisy Ortega, PAGASA
Session 2: Basic Meteorology, Weather/ Climate Observation and Forecasting
Daisy Ortega, PAGASA
Strategic Learning Exercise
Session 3: Impacts of Climate Variability and Change on Food and Nutrition Security
Danilo A. Gaas, CSU
Strategic Learning Exercise
Session 4: Climate Change, Agriculture and Food Security: Concepts, Linkages and Considerations for Community-based Disaster Risk Reduction and Climate Change Adaptation
Roberto C. Sandoval Jr., FAO
11:01 – 12:00
Open Forum
12:01 – 13:00
- - - L U N C H B R E A K - - -
MO
DU
LE
II
Planning and Implementing DRR and CCA in Agriculture Initiatives
13:01 – 14:00
Session 1: Key Policy Frameworks on DRR and CCA in Agriculture
Roberto C. Sandoval Jr., FAO
Open Forum
14:01 – 15:00
Session 3: Overview of Implementing DRR and CCA Initiatives through Community-based Approaches
14:00 – 15:00
Session 4: Integrating Cross-cutting Concerns
Open Forum
15:00 – 17:00
Session 5: Implementing Community-based Early Warning Systems (EWS) for Agriculture
Lorenzo Alvina, DA – RFO V
17:01 – 17:30
Introduction to Farm Weather Bulletin Preparation and Hazard-Cropping Calendars
17:3 – 17:45
Announcements
DAY 2
8:00 – 8:30
Preliminaries Host Team
8:31 – 12:00
Session 5 Workshop: Introduction to Farm Weather Bulletin Preparation and Hazard-Cropping Calendars
Lorenzo Alvina, DA – RFO V
Presentation of workshop outputs
12:01 -13:00
- - - L U N C H B R E A K - - -
13:01 – 14:00 M
O
DU
LE
III Climate-Smart Agriculture

Page 8 of 132
Session 1: Overview of Climate-smart Agriculture and Synergies with DRR and CCA
Roberto C. Sandoval Jr., FAO
Exercise – Identification of existing CSA practices/ possible CSA practices
14:00 – 15:00
Presentation/Discussion of Identified Local Practices
Roberto C. Sandoval Jr., FAO
15:00 – 17:30
Drafting of Local DRR and CCA plans Participants
Workshop: plan preparation with ENSO as the major concern
17:31 – 17:45
Announcements
DAY 3
8:00 – 8:30
Preliminaries Host Team
8:31 – 10:00
Presentation of Plans per Municipality Participants
10:01 – 12:00
Closing Program
Training Synthesis
Participants’ Impressions (Evaluation and Training Needs)
Impressions on the plans presented
Awarding of Training Certificates
Closing Remarks
13:00 onwards
Departure
Table 2. Training Schedule for Field Implementers (Bicol region), Macagang Hotel and Resort,
San Antonio Poblacion, Nabua, Camarines Sur, August 11 – 15, 2014
TIME ACTIVITY PERSON RESPONSIBLE
DAY 1

Page 9 of 132
10:00 – 12:00
Registration and Billeting Secretariat
13:01-13:30
Opening Program
Preliminaries
Welcome/ Opening Remarks
Training Overview
Host Team Formation
13:31 – 16:00
MO
DU
LE
I
Disaster Risk Reduction (DRR) and Climate Change Adaptation (CCA) for Food and Nutrition Security
Session 1: Climate and Climate Change Arthur Estrella, CBSUA
Session 2: Basic Meteorology, Weather/ Climate Observation and Forecasting
Henry Mabesa, CBSUA
Strategic Learning Exercise Training Team
Session 3: Impacts of Climate Variability and Change on Food and Nutrition Security
Arthur Estrella, CBSUA
Session 4: Climate Change, Agriculture and Food Security: Concepts, Linkages and Considerations for Community-based Disaster Risk Reduction and Climate Change Adaptation
Roberto C. Sandoval Jr., FAO
16:01 – 17:00
MODULE II: Tools and Methods for DRR and CCA in Agricultural Systems
Session 1a. Hazards and Impacts Yolanda Agawa, CBSUA Session 1b: Hazard, Vulnerability and Capacity
Assessment
17:01 – 17:15
Announcements Training Team
DAY 2
8:00 – 8:30 Preliminaries by Host Team
Workshop 1: Resource and Hazard Mapping
Yolanda Agawa/ Rene Rabacal, CBSUA
11:01 – 12:00
Workshop Output Presentation and Critiquing (Module II: Session 1)
Participants
12:01 – 13:00
- - - L U N C H B R E A K ---
13:01 – 14:00
Session 2: Spatial and Temporal Analysis of Agricultural Impacts of Climate Change
a. Rainfall Calendars b. Hazard Calendars c. Cropping and Seasonal Calendars
Arthur Estrella, CBSUA
14:01 – 15:30
Workshop: Rainfall and Hazard Calendars, Cropping and Seasonal Calendars
Participants
15:31 – 16:15
Workshop Output Presentation and Critiquing (Module II: Session 2)
Participants
16:16 – 17:00
Session 3: Brief Introduction to Maps and Geographic Information System
Vladimir Foronda, CBSUA
17:01 – 17:15
Announcements
Training Team
DAY 3
8:00 – 8:30 Preliminaries by Host Team
MO
DU
LE
III
Planning and Implementing DRR and CCA in Agriculture Initiatives
8:31 – 9:15 Session 1: Overview of Existing Policies on DRR and CCA
Cely Binoya, CBSUA

Page 10 of 132
9:16 – 10:00
Session 2: Strategic Planning: Harmonizing DRR and CCA in Agriculture into Local Governance
Cely Binoya, CBSUA
10:01 – 10:30
Strategic Learning Exercise Training Team
10:31 – 12:00
Session 3: Approaches to Assessment of Impacts and Vulnerability to Climate Change and Adaptation Options
Roberto Sandoval Jr., FAO
12:01 – 13:00
- - - L U N C H B R E A K ---
13:00 – 13:45
MO
DU
LE
III
Session 4: Integrating Cross-cutting Concerns a. Gender b. Capacity Development
Lora Panga, CBSUA
13:46 – 15:00
Session 5: Implementing Community-based Early Warning Systems (EWS) for Agriculture
Lorenzo Alvina, DA – RFO V
Workshop: Analyzing Crop-level Agro-meteorological Risks
Participants
15:01 – 17:00
MO
DU
LE
IV
Participatory Monitoring and Evaluation for DRR and CCA in Agriculture
Concepts and Considerations - Scope, purposes, frameworks - Measuring Baselines - Criteria and Indicators
Vladimir Foronda/ Art Estrella, CBSUA
Data Gathering Methods Vladimir Foronda/ Arthur Estella, CBSUA
Strategic Learning Exercise Training Team
Framing Contributions to Resilience Roberto Sandoval Jr., FAO
Externalities and Ancillary Impacts
17:01 – 17:15
Announcements Training Team
DAY 4
8:00 – 8:30
Preliminaries by Host Team
8:31 – 12:00
MO
DU
LE
V
Climate-Smart Agriculture (CSA) and Good Practice Options (GPO)
Edgardo dela Torre
Soil and Water Management
Sustainable and organic agriculture systems for CSA
Mely Cervantes, CBSUA
Developing Sustainable and Inclusive Food Value Chains
Hanilyn Hidalgo, CBSUA
Climate-smart Forestry Aries O. Ativo, CBSUA
Workshop on identifying other CSA and GPOs (in crop production, livestock, fisheries and aquaculture)
Participants
12:01 – 13:00
- - - L U N C H B R E A K ---
13:01 – 14:30
MO
DU
LE
VI
Communicating Climate Change Smartly
Session 1: Risk Communication Franie Belarmino and Lora Panga,
Session 2: Techniques and Methods in Translation and Popularization

Page 11 of 132
CBSUA
14:31 – 15:30
Workshop: Simulation through a 15-minute talk show titled, “Usapang Climate Change”
Participants
15:31 – 16:30
Workshop Output Presentation and Critiquing (Module VI)
Participants
16:31 – 18:30
Closing Program
Preliminaries: Opening Prayer, Lupang Hinirang Training Team
Training Synthesis Training Team
Participants’ Impressions Participants
Message DA – RFO V
Awarding of Training Certificates AMICAF
Closing Remarks Eulito U. Bautista, FAO – AMICAF
DAY 5
8:00 onwards
Departure Participants
The Participants

Page 12 of 132
A total of 30 participants from the local government units and other government agencies in
Surigao del Sur (2), Surigao del Norte (12), Agusan del Sur (4), and Agusan del Norte (12)
successfully completed the training for local planners in Caraga region. The following are the
distribution of represented agencies: DA RFO-XIII (1), PhilRice Agusan (3); NEDA-XIII (1); ATI-
Caraga (1); PDRRMO (3); PPDO (1); OPAg (5), MDRRMO (3); MPDO (1); MAO (7); and AT (4)
Meanwhile, 23 participants attended the training for field implementers in Bicol region. The
following are agencies were represented: technical and extension staff of the DA-RFO V V (3),
local DRRM and Provincial/Municipal Agricultural Officers of PLGU Masbate (1), PLGU Camarines
Norte (3), MLGU Camarines Sur (13), PLGU Sorsogon (1), and other field implementers from the
Office of Civil Defence Region V (2).
Dir. Edgar R. Madrid (seated, fourth from left), the Regional Technical Director for Research and
Regulations of DA – RFO V joined the participants, resource persons and AMICAF project
personnel during the first day of the training, August 11, 2014.
The Resource Persons

Page 13 of 132
The training management through its regional partners made sure that the speakers invited
were local experts within the area. Thus, for the training for local planners in Caraga region, the
three modules were delivered by the following resource persons:
Engr. Daisy Ortega, PAGASA Mindanao
Dr. Danilo Gaas, Caraga State University
Mr. Lorenzo Alvina, DA – Region V
Dr. Roberto Sandoval, FAO Philippines
On the other hand, the six modules for the field implementer’s training were delivered by the
following resource persons:
Arthur Estrella, Central Bicol State University of Agriculture
Henry A. Mabesa Jr. , Central Bicol State University of Agriculture
Yolanda S. Agawa, Central Bicol State University of Agriculture
Cely S. Binoya, Central Bicol State University of Agriculture
Vladimir R. Foronda, Central Bicol State University of Agriculture
Lourdes-Rafaelita O. Panga, Central Bicol State University of Agriculture
Hanilyn A. Hidalgo, Central Bicol State University of Agriculture
Aries O. Ativo, Central Bicol State University of Agriculture
Frannie A. Belarmino, Central Bicol State University of Agriculture
Carmelita N. Cervantes, Central Bicol State University of Agriculture
Edgardo B. de la Torre, Freelance Consultant
Lorenzo L. Alvina, DA-RFO V
Dr. Roberto Sandoval, FAO Philippines
The resource persons for the training for local planners in Caraga region

Page 14 of 132
Daisy F. Ortega
Assistant Weather Services Chief
PAGASA – Mindanao Regional Division
Topics during the training:
Climate and Climate Change
Basic Meteorology,
Weather/Climate Observation and
Forecasting
Danilo A. Gaas
Director, Office for Resource Generation
Caraga State University
Topic during the training:
Impacts of Climate Variability and
Change on Food and Nutrition Security
Roberto Sandoval Jr.
Climate Change Specialist
FAO Philippines
Topics during the training:
Concepts, Linkages and
Considerations for Community-
based Disaster Risk Reduction and
Climate Change Adaptation
Key Policy Frameworks on DRR and
CCA in Agriculture
Overview of Implementing DRR and
CCA Initiatives through
Community-based Approaches
Integrating Cross-cutting
Approaches
Climate-smart Agriculture
Lorenzo L. Alvina
Agriculturist
DA-RFO V
Topics during the training:
Implementing Community-based Early
Warning Systems for Agriculture
Table 4. The resource persons for the training for field implementers in Bicol region

Page 15 of 132
Arthur Estrella, Ph.D. Director for Research
Central Bicol State University of Agriculture
Topics during the training:
Climate and Climate Change
Impacts of Climate Variability and Change on Food and Nutrition Security
Spatial and Temporal Analysis of Agricultural Impacts of Climate Change
Henry A. Mabesa Jr., Ph.D. Professor III
Central Bicol State University of Agriculture
Topic during the training:
Basic Agrometeorology
Yolanda S. Agawa, Ph.D.
Director, RCDRRM and CCA Central Bicol State University of
Agriculture Topics during the training:
Hazards and Impacts
HRVCA
Cely S. Binoya, Ph.D. Dean, Graduate School
Central Bicol State University of Agriculture Topics during the training:
Overview of Existing Policies on DRR and CCA
Strategic Planning: Harmonizing DRR and CCA in Agriculture into Local Governance

Page 16 of 132
Lourdes-Rafaelita O. Panga, M.A.Ed. GAD Focal Person and Guidance Counselor
Central Bicol State University of Agriculture
Topic during the training:
Integrating Gender in Planning and Implementing DRR and CCA Initiatives in Agriculture
Vladimir R. Foronda, M.Sc. Director, Information
and Communication Tecnology Central Bicol State University of Agriculture
Topics during the training:
GIS Overview
Participatory Monitoring and Evaluation for DRR and CCA in Agriculture
Edgardo B. de la Torre
Field Extension Worker Freelance Consultant
Topic during the training:
Overview of Climate-smart Agriculture and Good Practice Options

Page 17 of 132
Lorenzo L. Alvina, M.P.A Technical Staff, ORED
Department of Agriculture RFO V Topic during the training:
Implementing Community-based EWS for Agriculture
Aries O. Ativo, M.Sc. Instructor
Central Bicol State University of Agriculture Topic during the training:
Climate-smart forestry

Page 18 of 132
Hanilyn A. Hidalgo, M.B.A. Director, OSAS
Central Bicol State University of Agriculture
Topic during the training:
Developing Sustainable and Inclusive Food Value Chain
Frannie A. Belarmino, M.L.L Instructor/Public Information Officer
Central Bicol State University of Agriculture
Topic during the training:
Communicating Climate Change Smartly
Carmelita N. Cervantes, Ph.D. Assistant Professor IV
Central Bicol State University of Agriculture
Topic during the training:
Sustainable and Organic Agriculture Systems for Climate-smart Agriculture
Training Highlights
The following discussion highlights of the modules were a result of the harmonized
documentation of the two pilot trainings. The topics were presented the way the resource
persons delivered them during the actual training.

Page 19 of 132
MODULE I
Disaster Risk Reduction and Climate Change Adaptation
for Food and Nutrition Security
Climate change has now become the buzzword of many agencies and programs as its impacts
are greatly aggravating many lives and climate-sensitive livelihoods like farming and fishing.
However, understanding its causes remains elusive even to local development planners and
implementers and this greatly affects the design and implementation of local DRR and CCA
programs.
It is important to deepen one’s knowledge and level of appreciation by introducing the science
that explains the ‘what’ and the ‘why’ of climate change. Thus, the module’s main objective is to
ground the learners on the scientific explanations of climate change and predictions about
future impacts especially in agriculture. More importantly, this introductory module should
enable the learner to understand that “climate change is a global phenomenon” but “adapting
to its impact is a local process”. Also, it will situate them better to appreciate the relationship of
climate change to food and nutrition security.
Objectives
At the end of the module, the learner should be able to:
1. Define climate and discuss climate system, climate variability and climate change
2. Discuss basic meteorology, weather and climate observation and forecasting
3. Discuss local examples of climate change impacts on food and nutrition security
4. Recognize and prioritize the importance of DRR and CCA in agriculture
Methodology
Lecture – discussion
Video presentation
Session 1: Climate and Climate Change
Weather is the specific condition or “actual state” of the atmosphere or “actual state” at a
particular place and time. It is described by measuring the following:
a. wind direction

Page 20 of 132
b. wind force
c. precipitation
d. temperature
e. sunshine
f. visibility
g. cloud
When these weather phenomena are measured systematically at a specific location over several
years, a record of observations is accumulated from which averages, ranges, maximums and
minimums for each variable can be computed, along with the frequency and duration of more
extreme events (FAO, 2008).
The World Meteorological Association requires the calculation of averages for the consecutive
periods of 30 years, with the latest being from 1961 to 1990. Such a period is long enough to
eliminate year-to-year variations. The averages are used in the study of climate change, and as a
base with which current conditions can be compared (UK Met Office Online as cited by FAO,
2008).
Climate, on the other hand, is the “average weather” or normal state of the atmosphere and its
long term variability over a particular period (say, over a month, a season, a year or several
years). For example, the climate of the Philippines may be characterized into hot and dry from
March to May, rainy from June to October, and cool from November to February.
Discussion Option 1
Climate Variability and Extreme Events By Daisy F. Ortega
Assistant Weather Services Chief
PAGASA – Mindanao Regional Division
Climate Variability

Page 21 of 132
It refers to changes in patterns, such as precipitation patterns, in the weather and climate
including droughts and floods. It also refers to variability on time scales of a few years to a few
decades (shorter than climatic averaging period).
The Philippine Atmospheric, Geophysical and Astronomical Services Administration classified the
Philippine climate as Tropical-maritime. It is characterized by relatively high temperature, high
humidity and abundant rainfall. Thus, temperature, humidity and rainfall are the most important
elements of the country's weather and climate.
The mean annual temperature is 26.6 °C. The coolest month is in January with mean
temperature of 25.5 °C, while the warmest month is in May with mean temperature of 28.3 °C.
The mean annual rainfall range is between 965 to 4,064 mm. The relative humidity range is
between 71 – 85 % (Rice Watch and Action Network, 2012).
In terms of season, PAGASA used temperature and rainfall as bases. Thus, the climate of the
country can be divided into two major seasons: the rainy season, from June to November and
the dry season, from December to May. The dry season may be subdivided further into the cool
dry season, from December to February and the hot dry season, from March to May.
In general, the Philippine climate is adequately described by one single climatic element –
rainfall. The yearly distribution of rainfall is synchronized with the Southwest Monsoon
(Habagat) and Northeast Monsoon (Amihan).
Climate Type
Based on the distribution of rainfall, there are four climate types recognized after the Coronas
Classification in 1920. The PAGASA called it the Modified Coronas Classification, which are
described as follows:
First semester (April – September) is synchronized with the Southwest Monsoon
(Northern Hemisphere Summer Monsoon) locally known as Habagat. This happens
when the sun is directly shining in the northern hemisphere causing convective
activities – rising and unstable air causing weather disturbance. In the Philippines,
PAGASA (Rice Watch and Action Network, 2014) noted that Habagat is commonly
experienced from June to September with August as the peak month. It affects the
western sections of the country.
Second semester (October – March of the following year) is synchronized with the
Northeast Monsoon (Northern Hemisphere Winter Monsoon) locally known as
Amihan. According to PAGASA (Rice Watch and Action Network, 2014), Amihan is
commonly experienced from November to February. It affects the eastern sections
of the country

Page 22 of 132
Type I - two pronounced seasons,
dry from November to April and
wet during the rest of the year.
Type II – no dry season with a very
pronounced maximum rain period
from December to February. There
is not a single dry month. Minimum
monthly rainfall occurs from March
to May.
Type III – no very pronounced
maximum rain period with a dry
season lasting only from one to
three months, either during the
period from December to February
of from March to May. This type
resembles Type I since it has a short
dry season.
Type IV – rainfall is more or less
evenly distributed throughout the
year. This type resembles Type II
since it has no dry season.
Aside from monsoon, cold front and Intertropical Convergence Zone, the weather system which
greatly influences the climate and weather conditions of the Philippines is the tropical cyclone. A
great portion of the rainfall, humidity and cloudiness are attributed to it. In fact, 50% of the
annual rainfall is attributed to tropical cyclone activity. According to PAGASA, tropical cyclones
generally originate in the region of the Marianas and Caroline Islands of the Pacific Ocean which
have the same latitudinal location as Mindanao. Their movements follow a northwesterly
direction, sparing Mindanao from being directly hit by majority of the typhoons that cross the
country.
Factors Affecting the Climate of the Philippines
The climate of the Philippines is influenced by the complex interactions of the various factors
such as Philippine geography and topography, semi-permanent cyclones and anti-cyclones,
principal air streams, ocean currents, linear systems, tropical cyclones, ENSO events, and human
activity.
1. Geography and Topography
The Philippine archipelago is located near the equator, with the sun directed to it all
year round. The light also has fewer atmospheres to travel through. , and surrounded by
bodies of water separating the different islands. The land feature is generally
mountainous.
2. Semi-permanent Cyclones and Anti-cyclones
Atmosphere (air) pressure is a measure of the weight of the atmosphere above any
location. It is the force exerted on a person by the weight of tiny particles of air (air
molecules).

Page 23 of 132
Low and high pressure is created due to heat energy coming from the sun; it occurs due
to the unequal heating of the surface of the earth, the earth being tilted. Warm air rises
while cold air descends.
Coriolis effect moves winds to the right or left due to the rotation of the earth around
its axis; rotates in a counter-clockwise manner. Global winds is the manner of the
rotation of the wind
Vertical Flow versus Convergence and Divergence
o Low pressure rotates in a counter-clockwise manner while high pressure rotates
in a clockwise manner. High pressure enters to low pressure
o Divergence aloft is when low pressure rises; convergence aloft is when high
pressure descends
Anti-cyclone is a region of high atmospheric pressure; commonly known as “highs”
o Low pressure absorbs the high pressure; if low pressure is higher than high
pressure a typhoon is created
o Cyclone is a region of low pressure area
Normal Position of Highs and Low Pressure Areas during January
o High pressure is found at the NH (northern hemisphere); low pressure is found
at the SH (southern hemisphere)
o During July, the low pressure goes to NH
o July – peak of the southwest monsoon across the Philippines
o Trough is also considered as a zone of low pressure
o If there is climate change, the position of the low and high pressure changes.
3. Principal Airstreams
Southwest Monsoon (Habagat)
o comes from the southwest, affecting the western side of Luzon and Visayas;
Mindanao is affected by the SW monsoon during the peak season only
o affects the country from July to September; very warm and humid because it
passes through the Indian Ocean, collecting moisture
o occurs when warm moist air flows over the country from the southwest
direction; characterized by heavy rainfall that may last for a week during July-
September, bringing rainy season to the western part of the country
Northeast Monsoon (Amihan)
o Marginal flow of the wind – wind flows from north to south, causing extreme
low temperature in Northern Luzon
o affects the eastern portions of the country from October up to late March
o starts over Siberia as a cold, dry air mass but gathers moisture as it travels
across the Pacific Ocean before reaching the eastern sections of the Philippines
o occurs when the cold and intense Asiatic winter anti-cyclone sends
northeasterly winds across the Philippines
o characterized by widespread cloudiness with rains and showers
4. Ocean Currents
High pressure produces cold currents on the western coast of the continent and warm
currents on the eastern coast

Page 24 of 132
o Trade winds carry warm air from the Pacific Ocean pushing it towards the
eastern coast of the Philippines causing cloudiness and rainfall in the western
coast
5. Linear Systems
Cold Front
o along the front, clouds develop bringing heavy rains
o not formed in the Philippines, but in the mid-latitude countries or cold areas
o usually brings low pressure area that forms into a tropical cyclone
o when cold air meets warm air, unstable air is formed and this unstable air rises
forming cloudiness, scattered rain showers, and sometimes, thunderstorms
Intertropical Convergence Zone (ITCZ) – air from the NH and SH meet causing instability
in the air and series of low pressure area
o ITCZ oscillates with the season
o January-February: ITCZ located in the northernmost part of the Philippines even
reaching Australia – Philippines have good weather while Australia has bad
weather
o July: ITCZ located across the Philippines; August: located in the northernmost
part – many tropical cyclones entering the country because of this
Tropical Cyclone – intense weather disturbance with very low pressure and strong wind
circulation blowing in a counter-clockwise direction toward the center or “eye” with
minimum winds of 35 kilometers per hour
Classification of Tropical Cyclones in the Philippines
o Tropical Depression – maximum winds near the center: 35-64 KPH
o Tropical Storm – max. winds near the center: 64-118 KPH
o Typhoon – max. winds exceed 118 KPH
o Super Typhoon – conceived by JTWC; max. winds greater than 200 KPH near the
center
Philippine Area of Responsibility (PAR)
o Around 20 tropical cyclones enter PAR every year
o Even though a tropical cyclone exits the PAR, it still affects the country –
enhances the SW monsoon (Habagat) bringing heavy rains
o From 1948-2010, 1154 or 70% of tropical cyclones entered or formed in PAR
o Tropical cyclones enter or are formed in the Phils mostly in July, August and
September in which the SW Monsoon is at its peak
Average Tropical Cyclone Tracks
o February: tropical cyclone rarely enter PAR because it diverts direction due
to cold temperature
o January 2013: tropical cyclone “Crising” was formed
o 2011-present: tropical cyclone track is changing
o Tropical cyclones form at the lowest latitude
Frequency of Tropical Cyclones in the Philippines
o Northern Luzon is most frequently hit by tropical cyclones, followed by
Catanduanes and Northern Samar. Least hit is the Mindanao area.

Page 25 of 132
Public Storm Warning
Signal
No.
Description Potential Impacts
1 Tropical cyclone may threaten or affect
locality
Winds: not more than 30-63kph may be
expected within 36 hours
Action: monitor the latest weather bulletin
issued by PAGASA every 6 hours
Twigs and branches of small trees may be broken
Some banana plants may tilt or land flat on the ground
Rice in flowering stage may suffer significant damage
some houses of very light materials may be partially uprooted
very light or no damage at all may be sustained by exposed community
2 Moderate cyclone will affect the locality
Winds: 61 up to 100 kph may be expected
within 24 hours
Action: Prepare flashlights, batteries,
matches, kerosene lamps or candles and
charcoal in anticipation of power
interruption
some coconut trees may be tilted with few broken
few big trees may be uprooted
many banana plants may be drowned
rice and corn plants may be adversely affected
large number of nipa and cogon houses may be partially or totally uprooted
some old galvanized iron roofing’s may be peeled off
light to moderate damage to the exposed communities
3 Strong tropical cyclone will affect the
locality
Winds: 101 up to 185kph may be expected
in at least 18 hours
Action: If the house is not strong enough to
withstand the battering of strong winds go
to the designated evacuation center or seek
shelter in stronger houses. Stay in safe
houses until after the disturbance has left
the area.
many coconut trees may be broken or destroyed
almost all banana plants may be drowned and a large
number of trees may be uprooted
majority of nipa and cogon houses may be uprooted
or destroyed and considerable damage to structures
of light to medium construction
widespread disruption of electrical power and
communication services
moderate to heavy damage may be experienced in
the agricultural and industrial sectors
4 Very strong typhoon may threaten or affect
the locality
Very strong winds: more than 185kph may
be expected in at least 12 hours
Action: Stay in safe houses or evacuation
centers
coconut plantations may suffer extensive damage
many large trees may be uprooted
rice and corn plantation may suffer heavy losses
most residential and institutional buildings of mixed
construction material may be severely damaged
electrical power distribution and communication
services may be severely disrupted
damage to affected communities can be very heavy
Tropical Cyclone Warnings/Bulletins
o The Weather Advisory
General information on tropical cyclone or other severe weather
systems such as the southwest monsoon
For southwest monsoon, low pressure area and other severe weather
systems, it describes the expected weather condition in affected areas
and its duration
For tropical cyclones, it provides additional details such as the maximum
sustained winds, movement and forecast position. Issued once a day at
11:00 AM
o Severe Weather Bulletin
Tropical Cyclone Alert
A tropical cyclone either enters or develops in the PAR and has an
impending threat to any part of the country

Page 26 of 132
No public storm warning signal is in effect in any part of the country
Its content is similar to an advisory, however, the frequency of
issuance of alert bulletin shall be twice a day, at 11AM and 11PM
Tropical Cyclone Warning
Upgrading from tropical cyclone alert
Necessary to put in effect public storm warning signal no. 1 over
certain areas of the country
Tropical cyclone has a real threat to some communities,
provinces or regions in the country
Frequency of issuance very six hours: at 5 AM, 11 AM, 5 PM,
and 11 PM
Beneficial Effects of Tropical Cyclone
o Rainfall increases groundwater and the water levels of dams that provide
drinking water, irrigation water and power generation
o Rain means water for plants
o Rain decreases the level of pollutants and cleanses the atmosphere
6. EN/SO (El Niño/ Southern Oscillation) Events
EN/SO occurs when there is an anomalous warming of the waters during El Niño
extended over a large portion of the equatorial Pacific; if the water warms up, the
atmosphere reacts.
El Niño – refers to the warming of the ocean in the eastern equatorial and central
Pacific. It is an oceanic phenomenon first recorded in the early 1500s along the coasts of
northern Peru and Ecuador. It is originally used to describe the annual appearance of
warm waters around Christmas time. In some years, warm waters appeared earlier and
lasted longer; eventually, the term El Niño was used to describe these periods of
anomalous warming
Southern Oscillation (SO) – the changes in atmospheric pressure associated with this
warming, and SO index is the measure of these changes. It can be dated back as a large
scale pressure fluctuations reported since the late 1800s. It is used as a forecasting tool.
Two Phases of EN/SO
El Niño (warm phase) – phenomenon where water across much of the tropical eastern
and central Pacific is hotter than usual and affects the atmosphere and weather around
the world
La Niña (cold phase) – phenomenon where water in the Pacific Ocean near the equator
gets colder than usual and affects the atmosphere and weather around the world
How do ocean temperatures affect rainfall?
If the ocean is warm, there is plenty of evaporation; if there is plenty of evaporation,
abundant moisture accumulates in the atmosphere causing rainfall.
If the ocean is cold, there is less evaporation; if there is less evaporation, less moisture
accumulates in the atmosphere resulting to lesser rainfall or no rainfall at all.
Global winds: the rotation of the earth creates wind, and it changes in the presence of
typhoons

Page 27 of 132
What is normal condition?
There is no El Niño or La Niña.
When low pressure is at the western Pacific and high pressure is at the eastern Pacific;
with trade winds, stronger wind pushes the warm water, hence more clouds and wind
generated and warm water goes south in the western Pacific
Strong easterly wind pushes the warm air in the west Pacific producing rainfall and low
pressure which pushes towards the Philippines
Upwelling – the circulation of warm and cold air under water, subsurface of ocean;
fosters the growth of fish population
What if there is El Niño
Easterly wind weakens and westerly winds go against the direction of the easterly
winds; tropical cyclones will not form in or near PAR because the warm air pushes the
low pressure away from the Philippines
What if there is La Niña
Easterly winds are stronger pushing the warm air towards the Philippines; many tropical
cyclones form and develop in and near the PAR
EN/SO Monitoring
Global observation: the climate condition in the eastern and central equatorial Pacific
(CEEP) ocean as reflected by the sea surface temperature anomaly (SSTA), wind (trade
winds), and the atmosphere above it (Southern Oscillation Index)
Key Indicators of El Niño and La Niña
Sea surface temperature anomaly (SSTA): if the threshold value is greater than or equal
to 0.5 degrees Celcius, El Niño occurs; if threshold value is below or equal to -0.5
degrees Celcius, La Niña occurs.
Southern Oscillation Index (SOI): if the threshold value is below or equal to -8, El Niño
occurs; if greater or equal to 8, La Niña occurs.
Trade wind (easterly wind): if trade wind is weaker than normal, El Niño occurs; when
stronger, La Niña occurs.
NOAA Operational definitions of El Niño and La Niña
El Niño is characterized by a positive ONI greater than or equal to +0.50C while La Niña –
characterized by a negative ONI less than or equal to -0.50C. By historical standards, to
be classified as a full-fledged El Niño or La Niña episode, these thresholds must exceed
for a period of at least 5 consecutive overlapping 3-month seasons. If the ONI is
sustained for three consecutive months, it can be called El Niño; otherwise, it will just
remain as a “condition,” and not El Niño.
El Niño and La Niña events tend to develop during the period April-June. These tend to
reach maximum strength during December-February; typically persist for 9-12 months,
though occasionally persisting up to 2 years and typically recur every 2 to 7 years.
Overview of Climate Change and Global Warming
By Daisy F. Ortega
Assistant Weather Services Chief
PAGASA – Mindanao Regional Division

Page 28 of 132
Global Warming
the increase in the earth’s mean temperature due to the so-called enhanced
greenhouse effect
global average air temperature increased by 0.740C from 1906 to 2005; unprecedented
strong temperature increase since 1975
in 1975, technologies for human convenience were invented, that emit greenhouse
gases in the atmosphere
The Greenhouse Effect
a necessary phenomenon that keeps all Earth’s heat from escaping to the outer
atmosphere
farmers in the temperate zone (cold places) establish greenhouses to maintain the
temperature needed by their plants; without the natural greenhouse effect, life on
Earth would be difficult to sustain
o Methane (CH4): animal husbandry, irrigated agriculture, and oil extraction
release great amounts of this potent greenhouse gas
o Nitrous oxide (N2O): a by-product of burning fossil fuels and is also released
when ploughing farm soil
o Ozone (O3): main element of the protective layer in the upper atmosphere,
which shields the Earth from the sun’s harmful ultraviolet radiation; both a
natural and man-made gas; when produced in excess, results are smog and
severe air pollution which are harmful to human health
o Chlorofluorocarbons (CFCs): chlorine containing gas used for refrigerators, air
conditioners, aerosol sprays propellants and cleaning agents; these cause
depletion of the atmospheric ozone layer
Selected Greenhouse Gases
Carbon dioxide (CO2): fossil fuel burning, deforestation are among its sources
o anthropogenic increase: 30%
o average atmospheric residence time: 500 years
Methane (CH4)
o source: rice cultivation, cattle & sheep ranching, decay from landfills, mining
o anthropogenic increase: 145%
o average atmospheric residence time: 7-10 years
Nitrous oxide (N2O)
o source: industry and agriculture (fertilizers)
o anthropogenic increase: 15%
o average atmospheric residence time: 140-190 years
The Carbon “Bathtub” and its Components
Carbon dioxide – the most abundant type of greenhouse gases present in the atmosphere
If the amount of water flowing into a bathtub is greater than the amount of water leaving
through the drain, the water level will rise; carbon dioxide emissions are like the flow of
water into the world’s carbon bathtub
Global warming – result of CO2 levels rising in the Earth’s atmosphere
“Thickening blanket”

Page 29 of 132
o Carbon dioxide: +31%
o Methane: +151%
o Nitrous oxide: +17%
Natural sources of greenhouse gases – volcanic eruptions, forest fires, decay of plants, and soil.
Nitrous oxide – produced by bacterial breakdown of nitrogen in soils and oceans
Man-made sources of carbon dioxide – burning of fossil fuels (oil, coal) by power plants,
industries and vehicles; accounts for 20% of additional greenhouse effects
Methane – decomposition of garbage and agricultural waste materials, leaks in coal
mining and natural gas production
Causes of Climate Change
Natural causes – volcanic eruption, solar, and natural variability
Human causes – include greenhouse gases, aerosols, and land use
Ten Indicators of Warming World
The ten indicators are the changes in the following: humidity, air temperature near surface
(troposphere), temperature over oceans, sea surface temperature, sea level, ocean heat
content, temperature over land, glaciers, show cover, and sea ice. Seven of these indicators
would be expected to increase in a warming world and observations show that they are, in fact,
increasing; three would be expected to decrease and they are, in fact, decreasing
Observed Global Trends (IPCC Conclusions)
Warming of the climate system
Increasing global average air and ocean temperatures
Rising global average sea level
Reductions of snow and ice
Sea ice has a bearing with the world’s climate. If sea ice lessens, more water will
evaporate to the atmosphere subsequent to more moisture in the atmosphere. If there
is a lot of moisture in the atmosphere, cloudiness develops resulting to rainfall in some
parts of the world.
The Philippines is too far away from the top ranking greenhouse gases emitting
countries so our advocacy is “adaptation” to the impacts of climate change. The
Philippines has minimal contribution to greenhouse gases emissions since the
population is low. The top emitters of greenhouse gases are the rich countries.
Humanity’s carbon dioxide sources as of 2010 comes from fossil fuels and cement
(91%) which is equivalent to 33.4 billion metric tons and land use change (9%)
equivalent to 3.3 billion metric tons.
Humanity’s carbon dioxide goes to the atmosphere (50%) amounting to 18.4
billion metric tons, land (26%) 9.5 billion metric tons and oceans (24%) 8.8 billion
metric tons.
Page 30 of 132
Change in Global Average Surface Temperature
Eleven of the last twelve years rank among the twelve warmest years in the
instrumental record of global surface temperature
Usually, the sudden rise in temperature is connected to El Niño
Observed Changes in Climate
Since 1993, global mean sea level has risen between 2.8 and 3.6 millimeters per year
(0.11-0.14 inches/year).
From 2005-2012, meltwater entering the ocean has dominated sea level rise, accounting
for more than twice the contribution from warming-caused expansion.
In the 20th century, sea level rise reached 0.17m.
Sudden increase in local hazard intensity such as heat waves, heavy rainfall/ flood,
tropical cyclones, coastal marine hazards, and strong winds indicate the need for
disaster risk reduction management.
Impacts of Climate Change
Agriculture and Food Security – added heat stress, shifting monsoons, drier soils and water
shortages as a result of higher temperatures will affect livestock and crop production patterns
with expanded range of weeds, insects and diseases which may reduce global food supplies and
contribute to higher food prices.
o A degree increase in temperature in the tropics results to as much as 10% decline in
agricultural yield
o If temperature increases by 2-6 degrees, there will be a decline in the Philippine
agricultural production by 29%-160%
o Health and global warming – extreme temperatures can directly cause the loss of life
(e.g. 35,000 people died during heat wave in Europe, August 2003); warmer weather
provides an ideal breeding environment for mosquitoes
o Tropical diseases – global warming increases drought which lessens the supply of clean
drinking water; less supply of clean water causes cholera. An increase in temperature
provides an ideal breeding environment for mosquitoes bringing diseases such as
dengue fever, malaria and yellow fever
o Coral reefs – highly sensitive to small changes in water temperature
Response to Climate Change
Mitigation – an anthropogenic intervention to reduce the sources or enhance the sinks of
greenhouse gases (The Philippines already has windmills located at Northern Luzon)
Mitigation actions involve the following:
First, improve and develop technologies to increase energy efficiency, to use renewable
energy, and capture and store carbon
Second, put in place regulations and standards that help move towards low fossil fuel
use
Third, use instruments, such as carbon finance, and markets, to help reduce emissions
Fourth, change behavior and lifestyle; example: use more public transport and lower
energy consumption at home

Page 31 of 132
Adaptation – practical steps to protect countries and communities from the likely disruption
and damage that will result from effects of climate change
Other Actions
Manage resources, especially forests, in a sustainable way
Use renewable energy sources such as solar, wind and geothermal power
Recycle as much as you can; you’ll be saving energy and preserving natural resources
Reduce the number of journeys you make by car; use public transport, go by bike or
walk
Switch off lights; turn off home and office appliances when not in use
Change your light bulbs to energy saving bulbs (CFLs) that use a fraction of electricity
and last up to 13 times longer
PAGASA’s Response
The PAGASA’s response established through the years include enhancement of observing
systems and monitoring facilities for early warning system through the upgrading of surveillance
radars; establishment of Doppler radar, upgrading of satellite facilities (NOAA, MTSAT),
acquisition of MODIS satellite, upgrading of upper air stations, buoys, wind profilers, automatic
weather stations (AWS).
Discussion Option 2
Climate Change, Disasters and Food Security: The Challenge of Our Time
Arthur B. Estrella
Director for Research
Central Bicol State University of Agriculture

Page 32 of 132
Climate Change
Caused by anthropogenic linkage
Triggered during the industrial revolution, and great acceleration
Caused by natural happenings such as volcanoes, tectonic plate movement, among
others, however, with human activities it (climate change) agitates.
Anthropocene regime refers to period where man shapes the world into his own
desire by abusive activities. Industrial revolution is characterized by the
environment being badly affected by man’s activities. Great acceleration
refers to the period where there is great increase in population, coastal zone
destruction, and loss of biodiversity.
Climate Change Scenarios
Coral triangle, the richest area of biodiversity is at stake, according to a study of World
Bank
El Niño characterized by rise of sea surface temperature, ocean acidification, rise of sea
levels, tropical cyclones, rainfall, river flow and flooding
Earthquakes, which is very difficult to predict. The Marikina fault is already wide and
can fall anytime.
Increase in global sea and air temperatures
Widespread melting of ice and snow
Typhoons
Greenhouse effect caused by too much CO2, methane (CH4), nitrous oxide (N20), GNG
or energy generation industrial power plants
Climate Outlook and Knowledge of Community Hazards and Risks
Cropping/ Enterprise Calendar
Good Practices Options/Climate Smart Technologies
Farm Plan/Enterprise Plan
Post Disaster Needs Assessment
Community DRRM Support Systems (BDRRM Plan, Policy/fiscal support, EWS, Capacity
Development, Infrastructures, etc.)
Five Components of Weather
1. Temperature
2. Precipitation
3. Wind
4. Atmospheric pressure
5. Humidity
Weather is the present condition or change in the day, e.g. cold in the morning and hot in the
afternoon.
Climate is longer change in temperature, precipitation, and others.
Climate variability is the way climate fluctuates yearly above or below a long term average
value.

Page 33 of 132
Climate Change
It is long-term continuous change (increase of decrease) to average weather conditions
or the range of weather.
It is happening faster than ever before and will continue.
It is variable, non-linear and no one knows when it will end.
Climate change affects agriculture. Plants in order to grow need water, sunshine or available
light, and temperature. It also affects livelihood.
Projected seasonal temperature increase and rainfall in the Philippines (Project NOAH):
In 2020, there will be temperature increase of 1.1 º C.
In 2050, there will be temperature increase of 2.2 º C.
In terms of rainfall, Bicol regions will have more rainy seasons and typhoons.
Albay will have minimum temperature and maximum change in Camsur and Masbate
with a rise 1.88 º C.
Temperature is the most observable effect of climate change.
Illustrations of temperature change:
Blue-cold
Red-hot and rainy season
Major conflict of climate change is level of CO2 in the atmosphere caused by our usage of energy
resources especially hydro energy. PAGASA said that in 1897, the country surpassed the normal
level of temperature.
Causes of Climate Change
Emissions from agriculture due to agriculture and land conversion contributing up to 1/3 to the
human-induced greenhouse effect, e.g. manure emits CH4 and N20, and its contribution equals
to 413 million tons of CO2.
Climate change is no longer irreversible; IPCC have the following conclusions:
There is 95% certainty that human activities are responsible for global warming.
CO is unprecedented level for the last 800, 000 years.
Sea level is set to continue to rise at faster rate that over the past 40 years.
Over the last decades, the Greenland and Antarctic ice sheaths have been melting and
glaciers have receded in most parts of the world.
Impacts of Climate Change
Ability/capacity of man to produce food is at risk. Degree increase of temperature in the tropics
will decrease agricultural yield by as much as 10%.
Food security exists when all people, at all times, have physical and economic access to
sufficient, safe, and nutritious food to meet their dietary needs and food preferences for an
active and healthy life. (World Food Summit, 1996)

Page 34 of 132
Components of food Security
1. Food utilization- nutritional value, social value, and food safety
2. Food access-affordability, allocation, and preference
3. Food availability-production, distribution, and exchange
Climate Change Possible Future Effects on Ecosystem
Coral system cannot handle higher temperature well
Wildfires will increase
Up to 30% of species will be at increased risk for extinction due to the rapid changes in
their ecosystems
Other Observed Changes and Effects
89% of current changes in ecosystems are consistent with changes expected due to
global climate change.
carbon dioxide, methane, and nitrous oxide levels in atmosphere have increased greatly
due to human activities since 1750 and now far exceed previous levels.
Climate change is irreversible that is why there is climate adaptation.
Identified Portfolio of Upland Good Practices Options
(against strong wind, typhoon, continuous rain, flash flood and drought)
1. Strip cropping
2. Mixed cropping
3. Small farm reservoir (SFR)
4. Wide row spacing for rainfall multiplication
5. Tillage practices (zero and minimum tillage)
6. Coconut leaf pruning
7. Sloping Agricultural Land Technology (SALT-1)
8. Votive grass technology
9. Alley cropping
Identified Portfolio of Lowland Irrigated Good Practices Options
(against floods/flashflood, typhoon and saline intrusion)
1. Early-Maturing Rice Varieties
2. Submergence Rice variety (NSIC Rc-194)
3. Salt-tolerant rice variety (NSIC Rc-108)
4. Timing of planting/ratoon
5. Rice + Duck Farming Systems
6. Rice + fish farm system
7. Synchronized planting/controlled irrigation
8. Floating garden (San Buena, Buhi)
Identified Portfolio of Fisheries and Aquaculture Good Practices Options
(against typhoon, storm surge and fish kill)

Page 35 of 132
1. Backyard raising of tilapia
2. Integrated rice-fish farming
3. Backyard pond polyculture of African catfish and tilapia
4. Polyculture of tilapia and carps in net cages
5. Small-scale seaweed (Eucheumia and kappaphycus spp.) farming
6. Mud crab (Scylla serrata) farming/fattening
7. Fish processing and value addition for housewives
8. Freshwater prawn Macrobrachium rosenbergii culture
9. Nursery of wild mangrove crab S. Serrata\
10. Squid pot fishing
In order to develop adaptation applications, it is important to identify the major and secondary
hazards.
Secondary Hazards
Floods-epidemics, snake bites
Drought-pest infestation, epidemics, famine
Pollution-disease
Tools for Hazard Assessment
Historical profile
Timeline
Hazard map
Hazard hunting
Seasonal calendar
Hazard assessment matrix
It is not the strongest species, nor the most intelligent, that survive,
but the ones most responsive to change.
---Charles Darwin
Session 2: Basic Meteorology,
Weather/Climate Observation and Forecasting
Henry A. Mabesa Jr.
Professor
Central Bicol State University of Agriculture
Basic Meteorological Concepts

Page 36 of 132
Meteorology is a branch of science which deals with weather elements and it includes
forecasting.
Sun is the most important source of energy. Sunlight reaching the earth is determined by the
rotation of the earth on its axis and its revolution in its orbit around the sun.
The earth, on the other hand, is the third planet from the sun. It is the only planet that has living
things. It is divided into four quadrants. Its northern and southern hemisphere is divided into
two: Prime Meridian and Greenwich England.
Weather variability is caused by the circulation of the atmosphere and unequal distribution of
the earth’s surface. Countries nearer the equator receive more solar radiation compared to
those located on the pole. This is the reason why there are varying levels/characteristics of
weather elements especially with respect to the position of our place to the sun. Equator is an
imaginary line that divides the northern and southern hemisphere.
Aspects of Meteorology
1. Observation
2. Understanding
3. Prediction of weather
Branches of Meteorology
1. Climatology – study of climate of a place or regions on the basis of weather-related data
gathered over a period of time
2. Synoptic Meteorology – study of the movement of low pressure area, air masses,
fronts, and other weather systems, depression and tropical cyclones. Data are collected
on a weather map which helps the experts get a synoptic view of world weather.
Synoptic meteorology-day-to-day analysis and forecasting
3. Dynamic Meteorology – study of atmospheric process through mathematical equations,
are called numerical model when taken together
4. Physical Meteorology – study of the physical process of the atmosphere, such as solar
radiations, its absorption and scattering in the earth.
5. Micrometeorology – study if atmospheric conditions over an area of smaller than 1 km.
6. Hydrometeorology – study if occurrence of water in various from in relation to weather
elements.
Water cycle explains the components of water in various forms which is very
important in monitoring water resources, water balance and others.
7. Agricultural Meteorology – study that deals with weather and its relationship to crops
and vegetation.
Agrometeorology is the relationship of weather and climate to agricultural production (crops,
vegetation & livestock)
Branches of Meteorology in Agriculture
1. Hydrometeorology-occurrence of water in various forms
2. Agricultural meteorology-establishes relationship of weather elements to agricultural
production
Importance of Agricultural Meteorology
1. Long-range planning of agricultural systems (RDE)
Irrigation & drainage systems (gravity and pressurized)
Land-use and farming patters
Crop protection/fertilizer application
Prediction of el niño and rainfall variability
Selection of crops, animals and breeds and farm machineries
2. Observation/ monitoring and real-time dissemination of meteorological information & timely
decisions (farm weather forecasts)

Page 37 of 132
Atmosphere
The atmosphere is the layer from our ground land surface up to several thousand kilometers
moving towards the sun. It is referred to as “protective bubble.” It has several layers
characterized based on some physical dimensions like the density of gas, movement, thermal
characteristics, chemical composition and movement. These layers are:
1. Troposphere – it begins at the earth’s surface and extends up to 4-12 miles high. As the
density of the gases in this layer decrease with height, the air becomes thinner.
Tropopause is the transitions boundary between the troposphere and the layer above.
tropopause and troposphere – lower atmosphere
2. Stratosphere – it extends from the tropopause up to 31 miles above the earth’s surface.
It holds 19% of the atmosphere’s gases but very little water vapor. Temperature
increases with height as radiations is increasingly absorbed by oxygen molecules leading
to the formation of Ozone.
stratopause and mesopause – middle atmosphere
3. Mesosphere – it extends from the stratopause to about 53 miles (85 km) above the
earth. Temperature decreases with height.
4. Thermosphere – it extends from the mesopause to 690 km above the earth. It is known
as upper atmosphere. Thermopause is the transition boundary which separates the
exosphere from the thermosphere below.
5. Exosphere- It is the outermost layer of the atmosphere. It extends from the
thermopause to 10, 000 km above the earth.
Hydrologic Cycle Concepts
Water cycles through various pools in the environment
Cycling occurs when the water changes state (liquid to vapor)
It is driven by solar energy.

Page 38 of 132
Weather Observation and Forecasting
Weather systems that affect the Philippines are thunderstorms, cold front, Southwest and
Northeast monsoons, Intertropical Convergence Zone, easterly wave, orographic lifting, and
tropical cyclone.
Weather observation and forecasting involves the following:
1. Observation of different weather elements
2. Collection and transmission of weather data
3. Plotting of weather date
4. Weather map analysis
5. Formulations of forecasts
Farm Weather Forecasting (PAGASA)
Weather forecast – the weather advisory for the guidance of all people.
Farm advisories – weather advisory for the guidance of farmers in their farming activities for the
period
Fishing advisories – weather advisory for fishermen on their fishing activities for the period
Session 3: Impacts of Climate Variability and Change
on Food and Nutrition Security
Danilo A. Gaas, Ph.D.
Associate Professor IV
Caraga State University
Projected change in annual mean temperature for the Philippines (2020, 2050, 2100)

Page 39 of 132
2020- 09 to 1.1 ºC
2050- 0.9 to 2.2 ºC
2100-0.9 to 3.4 ºC
PAGASA reported that there was an increase of 0.648 ºC in the Philippine mean temperature
from 1955-2010.
Frequency of Extreme Temperature: Hot temperatures (indicated by the number of days with
maximum temperature exceeding 35 ºC will continue to become more frequent.
Frequency of Extreme Rainfall- Heavy daily rainfall (exceeding 300 mm) events will continue
increase in number in Luzon, Visayas and Eastern sections of the country.
Significant Climatic Variability Findings
Warming of the Climate system
Increasing in global air and ocean temperatures
Rising global average sea level
Reductions of snow and ice
Observed Changes in Climate
Global average sea level rose at a level of 1.8 mm per year over 1961-2003.The rate was
faster over 1993-2003, about 3.1 mm per year
Total 20th century sea level rise is .17 mm
Signs of Global warming
Rising Sea Water Temperature-Warmer water in ocean takes up more space than the cold water
contributing one way or the other to the rise of sea level due to “Thermal Expansion of Water”
leading to:
Coral reefs damage (30% of world’s coral reefs have already been damaged and by 2010
it is estimated to rise up to 60% if we do not do something the soonest possible time.)
Weather shifting or climate change-more ENSO/La Niña episodes are likely to occur.
More and stronger Tropical Cyclones
Flora and fauna will be forced to “Adapt or Die”
The climate change that is besetting us today is a result of anthropogenic activities. Thus, while
climate change affects agriculture, it also contributes to climate change. The relationship is
directly proportional.
The vulnerability of the Philippines cannot be denied. Due to its geographic location in the
Pacific ring of fire, the archipelago is vulnerable to rising sea level and extreme weather events.
Its vulnerability is aggravated by the country’s weak and unstable economy. For the agriculture
sector, while it must do its part to mitigate, foremost is to learn to adapt.
Samples of Weather and Climate Effect to Agriculture
1. Livestock

Page 40 of 132
Required temperature for breeding/right season for breeding
Relative humidity, rainfall and temperature for the occurrence of pests and diseases
Water and feed requirement during dry season or wet season
Others
2. Crops
Photoperiodic sensitivity of crops
Adaptation of crops/vegetation based on pressure, altitude, and pressure
Impacts of Climate Change in the Agriculture Sector
On Crop Behavior
1. Higher CO2 levels can increase yields, yet high temperature, lack of water and low
nutrients reverse this effect. In controlled – environment agriculture, e.g. nursery and
greenhouses, CO2 fertilization is done to increase yield. However, during
photosynthesis, elevated CO2 also needs more water. Hence, in drought areas and in
depleted soils,higher CO2 levelreverses crop development. The carbon cycle can best
illustrate how this happens.
Figure 1. The carbon cycle
Carbon dioxide is the most important raw material in photosynthesis so that crops can
produce organic matters. The natural exchange of CO2 occurs during respiration,
photosynthesis, volcanic eruptions, and fermentation process. During decomposition,
carbon dioxide maybe trapped and be converted into energy through a process called
CO2 harvesting/capturing. In California, for example, one of their alternative sources of
energy is from anaerobic digestion. Manures from 500 cows are collected in a lagoon
which is covered with canvass to prevent oxygen in the fermentation process. After
sometime, the canvass would rise indicating the accumulation of methane gas inside.
This methane gas can generate 40 megawatts electricity, enough to run a generator.
While there are ways to harvest CO2, terrestrial plants remain the biggest natural sinks
of CO2 from the atmosphere. And with the increase of CO2 emission especially from the
burning of fossil fuels, there is no way plants could be able to absorb it. This gas stays in
the atmosphere contributing to the overall warming.

Page 41 of 132
2. Extreme events, especially floods and droughts can harm crops and reduce yields. This is
true in rice because it is dependent on the availability of water. The abundance and lack
of water can significantly reduce yield.
3. Drought is difficult to deal with because of the increased temperature and less
precipitation. In agriculture, crop productivity is relative to temperature. Because
drought is accompanied by temperature increase, there are crops that die when
temperature reaches 24 oC no matter how much moisture and fertilizers are provided.
Even if some plants can, crops cannot recover with the prolonged absence of water.
4. Many weeds, pests and fungi thrive under warmer temperatures, wetter climates, and
increased CO2 levels. Organisms that cause disturbance to agriculture are more
adaptive to warmer temperatures. This is because most commercial crops are cultivars
as compared to weeds that are indigenous hence, more resistant to pests and diseases.
Most of these problems, however, are ecological repercussions of pesticide use.
On Livestock
1. Heat waves (heat stress) increases vulnerability to disease, reduces fertility, and reduces
milk production. Heat stress affects the hormonal production in the pituitary and
reproductive organs.
2. Drought may threaten pasture and feed supplies
3. Prevalence of parasites and diseases that affect livestock
4. Increases in atmospheric CO2 : upsets forage quality
On Fisheries
1. Changes on range of species of fish and shellfish. Temperature threshold reduce
reproducibility and survival.
2. Species movement bring greater competition in food and other resources
3. Aquatic diseases are more prevalence in warm waters.
4. Timing of reproduction and migration leads to decline in population.
5. World’s oceans acidification threatens sensitive ecosystem.
On Global Food and Nutrition Security
Global food shortages can cause humanitarian crisis in some countries. Adaptation problems
would magnify in developing countries and poorer countries may find it difficult to adapt.
Aside from drought and extreme events that bring outright damage to production areas,
creeping impacts like increase in temperature can also increase pests and diseases including the
adaptability of weeds. All of these are aggravated by the conflict of resource use because of
increasing population. Human health is also affected while damage and decline in production
will also cause the loss of livelihood to agriculture workers.

Page 42 of 132
According to the Food and Agriculture Organization, food security exists when all people at all
times has physical and economic access to sufficient safe and nutritious food to meet their
dietary needs and food preferences for an active and healthy lives.
The following are the primary risk factors of food security: drought and flood
shipping/distribution disruptions, fuel shortages, economic instability, and wars.
As discussed earlier, water is a basic component for plant photosynthesis. Excess water during
flood also destroys the plants.
Food shortage may not be caused by low production but in the equitable shipping and
distribution of produced goods. Prices of these commodities are also influenced by fuel
shortages. The buying capacity of the people is reflective of a country’s economic stability.
The four components or pillars of food security are availability (production, distribution and
exchange), access (affordability, allocation and preferences), utilization (safe, nutritious and
healthy), and stability (over-time).
Availability is related to production. There is produce which could be exchanged. Accessibility is
the availability of a produce and its affordability. Utilization means, is it safe and does it provide
the right and adequate nutrition. Stability is the ability of food to be present over a period of
time.
In summary, the present farming practices have contributed to the greenhouse gases that
altered the atmospheric processes which lead to what is now called anthropogenic climate
change. As a result, the changes in temperature and the frequent occurrence of extreme events
affect agriculture.
For extreme events, the
following are the possible
adaptive mechanisms: use of
traditional instead of
commercial crops, the practice
of traditional soil conservation
as first line of defense, organic
composting and amelioration,
bio-indigenous pesticides use,
promoting local markets, seed
banking, etc.
Figure 2. The complex relationship of agriculture
and anthropogenic climate change
Agriculture’s Contribution to Greenhouse Gases
Meanwhile, can agriculture hasten climate change? According to the Climate Change
Commission, agriculture is responsible to 14% direct greenhouse gas emission. An additional
18% is from deforestation. Living carbon becomes emitted from farmlands due to inappropriate
farming and overgrazing practices.
To summarize, carbon dioxide becomes lost from the biosphere as a result of deforestation,
biodiversity loss, accelerated soil erosion, loss of soil organic matter, coastal water pollution and
acidification of the oceans. All of these are anthropogenic in nature.

Page 43 of 132
Changes in land use also contribute to atmospheric carbon. To meet the needs of an increasing
population, farmers resorted to machine intensive farming which unfortunately reduced land
cover and encouraged chemical farming which led to soil loss associated with low organic
matter.
Module I Synthesis
Session 4: Climate Change, Agriculture and Food Security: Concepts,
Linkages and Considerations for Community-based Disaster Risk
Reduction and Climate Change Adaptation
Dr. Roberto C. Sandoval Jr.
Climate Change and Food Security Specialist
Food and Agriculture Organization of the United Nations

Page 44 of 132
Main Topics
1. Concepts and linkages of disaster risk reduction and climate change adaptation in the
context of agriculture and food security
2. Overview of institutional policies
3. Approaches on climate change impact assessment and adaptation assessment
4. Monitoring and evaluation considerations for climate change adaptation and disaster
risk reduction in agriculture
The linkages among agriculture, climate change and food security are dynamic. These concepts
are like a series of gears; any change in the climate impacts agriculture and whatever movement
in agriculture impacts the four components of food security.
Climate Change Key Variables
The key variables of climate change are temperature rise, change in precipitation, extreme
weather events, and sea level rise. The nature of impact depends on the sector, location and
type of ecosystem.
Examples of Impacts
Ocean Ecosystem
In the ocean ecosystem, acidification occurs because of the increase of greenhouse gas concentration
in the atmosphere. In the atmosphere, part of that carbon dioxide is absorbed by the ocean water.
When sea water absorbs CO2, it forms carbonic acid increasing water acidity. This occurrence affects
the reproduction of mallows and shellfish. Studies have found out that increase in salt water acidity
affects the reproduction of some species.
Aside from this, acidification and warming of the sea stress the corals. Corals are polyps, colorless.
What give them color are microscopic algae called zooxanthellae which live in the small holes of the
corals. Zooxanthellae and corals share a symbiotic relationship. This algae need to live in the corals
for protection from predators at the same time to access light to manufacture food. On the other
hand, zooxanthellae help generate energy for the coral. When the ocean water warms, the corals
release zooxanthellae causing the corals to be colorless. Slowly, the corals will die because they can
no longer metabolize energy. When corals die, many fish species will also suffer because they will no
longer have shelter and source of food.

Page 45 of 132
Important DRR and CCA Concepts
Classification of Hazards
When talking about climate variability and climate change in the context of agriculture and food
security, it is important to classify hazards for effective planning.
Quick-onset hazards – storms, floods
Slow-onset hazards – drought, dry and wet spells, ENSO associated droughts
Creeping changes – changing rainfall patterns, salinity intrusion, increasing
temperatures
Quick-onset hazardscan be experienced anytime like storms and floods. On the other hand,
slow-onset climate extremes happen short term but it may take few months for ipacts to be
experienced such as dry and wet spells and ENSO associated droughts. Creeping changes
happen over decades or over several years like changing rainfall patterns and saline intrusion.
These classifications can better guide DRR at climate CCA planners design the appropriate plan.
For instance, hazards being experienced now can be prioritized and those that can happen in 20
to 30 years can have a better CCA and DRR options. Good plans are those that can address two
or more hazards.
Coping
Examples of Impacts
In the forest ecosystem, a deforested mountain is prone to landslide
during extreme weather events like typhoon. It does not only damage
properties and livelihood, but it also deposits the sediments during
surface run-off to the oceans. These sediments can damage the coral
reefs because these can block sunlight. Whatever happens in one
ecosystem can result to ecological imbalance.
With thermal expansion which will cause surface intrusion in the coastal
areas. This occurs when saltwater seeps into the rice fields eventually
affecting the rice plant. Seepage also occurs in freshwater sources just
like cases observed in the Ilocos region. Careful planning then is
needed in order that one solution may worsen another existing condition
More intense drought is connected to temperature rise which is also
associated to higher evaporation rate causing drier soils. Rainfall
variability leads to changing rainfall patterns.
When talking about intense drought, the Food and Agriculture
Organization classified it into the following: 1) metrological drought this
is when it is above the threshold levele declared by PAGASA; 2)
hydrological drought is when water resources start to get affected, this
can be manifested in decrease in the supply ng irrigation or domestic
water; 3) agricultural drought happens when it affects agricultural
production (this is when the moisture content ng soil is very low); and 4)
economic drought happens when it affects the prices of commodities.

Page 46 of 132
Coping is what people usually do when experiencing a hazard. It is characterized as follows:
immediate and short term, geared towards survival, reactive not continuous, and often
degrades the resource base.
For example, a strong typhoon hit a coastal community ravaging rice farms. As a form of coping,
an affected farmer may resort to the cutting of mangrove trees for income in order to support
his family. The farmer’s action is an example of coping. The action is immediate, geared towards
survival of the farmer and his family. It is reactive, not planned but rather based on impulse.
The most defining characteristics of coping, it often degrades the resource base.
Coping Range
This is the range in which the effects of climate conditions are beneficial or negative but
tolerable. Beyond the coping range, the damage or loss is no longer tolerable and a sociatey or a
system is said to be vulnerable.
Adaptation
Adaptation involves changes in practices, both short and long term, which takes into account
the impacts of climate change. Unlike coping which does not involve planning, adaptation
involves changes in practices, both current and long term, while anticipating the possible
impacts of climate change.
Levels of Adaptation
Anticipatory adaptation – takes place before impacs of climate change are observed. It
is also referred to as proactive adaptation.
Autonomous adaptation – does not constitute a conscious response to climatic stimuli
but is triggered by ecological changes in natural systems and by market of welfare
changes in human systems. It is also called spontaneous adaptation.
Planned adaptation - result of a deliberative policy decision based on an awareness that
conditions have changed or are about to change and that action is required to return to,
maintain, or achieve a desired state. This is when interventions are formalized in a plan
that is accepted to the barangay level, municipal, provincial level, and national level.
Resilience
Resilience is the ability of the system, community or society exposed to hazards to resist, absorb
accommodate to and recover from the effects of a hazard in a timely and efficient manner,
including through the preservation and restoration of the essential basic structures and
functions.
Ideally, a community is resilient if it can resist, otherwise then it should have the capacity to
obsorb, accommodate or recover. For instance, if there’s a crop failure for rice in a community
but its farmers have vegetable farms, fishponds, other source of income, and crop insurance
then that particular community is can recover and is therefore resilient. However, the recovery
should be timely and not after some years.
Disaster Risk Management (DRM)

Page 47 of 132
Disaster risk management is the systematic process of using administrative directives,
organizations and operational skills and capacities to implement strategies, policies and
improved coping capacities in order to lessen the adverse impacts of hazards and the possibility
of disasters.
It comprises the whole range of interventions before, during and after a shock in the continuum
of development.
Risk – probability of an event to occur and cause negative consequence
Vulnerability –probability of being negatively affected of a particular hazard.
Risk Management Framework
1. Risk assessment –the identification of areas and where high risk Are located
2. Risk evaluation
3. Risk management
Three Basic/Major Risk Management Action
1. Risk avoidance
2. Risk mitigation
3. Addressing residual risk
The problem with risk is that it is a probability, it has uncertainties. This means there are risks
which may not be prevented. This is called risidual risks. This is where risk sharing mechanisms
are used.
Importance of DRR and CCA in Agriculture
Climate vriability today and long term climate change are two ends of a continuum of time
scales at which the climate varies and impacts agriculture. Climate change brings two scales of
problems, short term and longterm (20 – 30 years in the future).
Disaster risk reduction focuses on current climate-related extreme events while climate change
adaptation focus is somehow longer term. It is also important to address first the current risks
or reduce the risks being experienced through DRR to be able to adapty to future changes. This
is the reason wht DRR comes first before CCA to ensure that a community, for example, is stable
before slowly increasing its capacity towards longterm adaptation to climate change.
Disaster Risk Reduction and Management for Food and Nutrition Security
The elements in the DRR continuum are the following:
1. Prevention
2. Mitigation
3. Preparedness
4. Response
5. Rehabilitation
6. Transition

Page 48 of 132
It is important to have DRR initiatives in place, to reduce the possibility of losses and to help in
the immediate recovery of a community’s growth pattern. Adapatation to climate change is
difficult if there is no recovery from current risks.
Disaster risk management is the first line defence to increase resilience against climate change
impacts. In the Philippines, agriculture is the center of DRR and CCA. There is an increasing
convergence of CCA and DRR agenda.
Linkages: Climate Change and Disaster Risk
Climate change increases the frequency and intensity of disasters
Disaster risk reduction is a natural entry point for climate change adaptation
Disaster risk reduction structures exist in most countries to build on
The common concern between CCA and DRR is the climate-related risks and hazards. This are
the short term problems that DRR tries to respond at the same time the long term problem that
may worsen that CCA will still have to address. These are the main considerations in planning to
be able to come up with plans and interventions that would promote drr and climate change
adaptation.
Page 49 of 132
MODULE II
Tools and Methods for Disaster Risk Reduction
and Climate Change Adapatation
Planning and implementing community-based DRR and CCA greatly depends on latest climate
scenarios and the assessment of current vulnerability, risks and local livelihoods. Assessments
are done using various tools which are mostly designed to be inclusive and conscious of the
concerned community’s participation. This aspect of participation is in itself an education
process that allows the community people to better understand their vulnerabilities and
capacities thereby encouraging them to participate and appreciate local adaptation. This
module aims to capacitate learners to be able to determine the appropriate tools to be used
and to acquire the basic skills of how these are conducted.
Objectives
At the end of the module, the learner should be able to:
1. Describe and demonstrate the basic skills needed to conduct hazard, vulnerability and
capacity assessment method and tools
2. Demonstrate skills in drafting the following calendars of agricultural impacts:
a. Rainfall calendars
b. Hazard calendars
c. Cropping and seasonal calendars
3. Perform cost-effective environmental monitoring techniques
Methodology
Lecture – discussion
Workshops

Page 50 of 132
Session 1a: Understanding Hazard and its Impacts
Yolanda S. Agawa, PhD
Director, CBSUA RCDRRM and CCA
Central Bicol State University of Agriculture
Definition of Hazard
Hazard is a potentially damaging physical event, phenomenon and/or human activity, which
may cause the loss of life or injury, property damage, social and economic disruption or
environmental degradation (UNISDR, 2004). A hazard can only be a hazard if it is a threat to like
and just like what typhoon Yolanda did.
Classification of Hazards
1) Natural hazards – arise from purely natural processes like earthquakes and floods
2) Quasi-natural hazards – arise through the interaction of natural processes and human
activities like smog and desertification
3) Technological/Anthropogenic (man-made) hazards - arise directly as a result of human
activities like toxicity of pesticides to fauna, accidental release of chemicals, radiation
from a nuclear plant.
Hazards can be single, sequential or combined in their origin and effects.
Secondary hazards – hazards that follow as a result of other hazard events (earthquake can lead
to: fires, tsunami, water pollution, dam failure
Chronic hazards – group of hazards that do not stem from one event but arise from continuous
conditions which accumulate over time (famine, resource degradation)
Thunderstorm – localized storm cloud producing lightning and thunder and often brings heavy
rainfall or hail as well as strong, gusty winds. Associated hazards are: lightning, heavy rainfall,
tornado/ water spout (hazards of tornado is on the land while water sprout is on the water
surface), hail
Signs of an Impending Thunderstorm
Towering cumulonimbus clouds
Darkening skies
Flashes of lightning and gusty winds
Sound of thunder
Static AM radio signal
Typhoon/Tropical cyclone – general term given to describe a major weather disturbance in the
tropics. It is a closed wind circulation accompanied by strong winds and voluminous rains
characterized by a low pressure center called the “eye” of the storm with no rain and calm. The
winds blows around the low pressure center spiraling inward in a counterclockwise direction. Its
diameter ranges from 300 to 1000 kilometers.

Page 51 of 132
Structure of a Typhoon
Eye – relatively calm & generally clear area of sinking air and light winds
Eyewall – ring of tall clouds and thunderstorms that produce heavy rains and
usually the strongest winds
Rainbands – curved bands of clouds and thunderstorms that trail away spirally
from the eye wall, capable of producing heavy bursts of rain, wind, tornadoes,
etc.
Storm surge – a sudden rise in sea level above the normal level on the coast due to a very low
atmospheric pressure and the force of the winds as a tropical cyclone approaches the coast.
Philippine Atmospheric, Geophysical and Astronomical Services Administration (PAGASA). It is
new to us when typhoon Yolanda fell in the country.
Flood – occurs when the level of a body of water rises until it overflows its natural or artificial
confines and submerges land in the surrounding area. Water will always find its way and will
find its depth.
The Philippines is to flooding because of the following weather systems affecting the country:
tropical cyclones; Inter Tropical Convergent Zone; Southwest monsoon; Northeast monsoon;
thunderstorms; Easterly waves; and tail end of cold front. All of these bring rains.
Types of Flood
Flash flood
Standing flood
Coastal flood
Riverine flood
Impacts of Flood
Destruction of houses, bridges, roads,
buildings and other infrastructure
Erosion of river banks and farm lands
Siltation of agricultural fields
Crop loss
Deaths due to drowning, electrocution
Interruption of services
Health problems
Permanent changes in the river channel
Loss of wildlife habitat
Earthquake – the shaking felt when sudden, strong movement takes place along a break in the
earth’s crust.
Types of Hazards from Earthquakes
ground shaking
fault rupture
tsunamis
ground failures (landslides, differential ground, settlement, ground
upheaval/lurching, soil liquefaction, lateral spreading, fracturing,
slumping)

Page 52 of 132
Types of Earthquake
1. Tectonic – earthquakes produced by sudden movement along faults and plate
boundaries
2. Volcanic – earthquakes produced by movement of magma beneath volcanoes
Earthquake Hazards
Tsunami
Fire
Ground shaking
Ground rupture
Liquefaction
Landslides
o Fall – falls down from its original position
o Slide – from its original position, it will slide down and will create slumped
mass
o Topple – creates domino effect
o Flow – tipping type of earthquake
Impacts of Earthquake
Death
Destruction of houses, bridges, roads,
Buildings and other infrastructure
Displacement of community
Interruption of services
Secondary hazards such as tsunami, flooding,
Fire, erosion
Volcanic Hazards
Hazards brought about by the eruption of volcanoes
Types of Volcanic Hazards
lava flows
pyroclastic flows
lahar
ashfall and ballistic projectiles

Page 53 of 132
Session 1b: Hazard, Risk, Vulnerability, and Capacity Assessment
Yolanda S. Agawa, Ph.D.
Director, CBSUA RCDRRM and CCA
Central Bicol State University of Agriculture
The hazard, risk, vulnerability, and capacity assessment (HRVCA) is a data needed to come up
with the MDRRM plot. The DILG gave a template in 2012 and HRVCA was included but now,
there is again a new DILG circular for the preparation of the contingency plan. With this plan, it
is understood that all sectors participates in the planning; agriculture must not be left out. For
instance, in the preparation of an evacuation center, a space for your agricultural crops, plants
and animals must be included.
Hazard
Hazard is a potentially damaging physical event, phenomenon and/or human activity, which
may cause the loss of life or injury, property damage, social and economic disruption or
environmental degradation. (UNISDR, 2004)
Hazard Assessment
This is the process of estimating, for defined areas, the probabilities of the occurrence of
potentially damaging phenomenon of a given magnitude within a specific period of time.
NATURAL HAZARD EVENT PARAMETER SITE PARAMETER
Cyclone Wind Speed (kph)
How fast is this cyclone?
Area Affected
How wide is the area
affected?
Earthquake Magnitude (Richter scale)
How strong is the magnitude?
Intensity (Modified Mercalli
Scale)
Based on the reception of the
community.
Flood Volume of Water (cu.m.)
Velocity
can be slow or trap concept
Area Flooded (sq. km.)
Depth of Flood Water (m.)
Landslide Volume of Dislodged
Material
Area Affected
Ground Displacement (m.)
Tsunami Height of Wave Crest Depth of Flood Water
Volcano Eruption Size and Duration Ash Fall (m.)
Lava Flow (area in sq. km.)

Page 54 of 132
Hazard Assessment Tools
This is alsways done at the barangay level
1. Historical profile
How many times do you experience hazard?
What is the strongest hazard you experienced?
2. Timeline
In a year, how many times typhoon visit your place?
In what season does typhoon visits your place?
3. Hazard map
4. Hazard hunting
What other hazards does your place experience?
What activities/natural processes can trigger new hazards?
5. Seasonal calendar
6. Hazard assessment matrix
Hazard
Type
Origin Force Warning
Signs
Fore-
warning
Speed of
Onset
Frequency Period of
Occurrence
(When)
Duration
Flood cyclone Volume
of
water
Rising of
water
12 hrs slow Once or 2
times/year
Northeast
monsoon
(Amihan)
season
3 days
Hazard
Type
Origin Force Warning
Signs
Forewarn
ing
Speed of
Onset
Frequency Period of
Occurrence
(When)
Duration
Risk
Risk is the probability that a community’s structure or geographic area can be damaged or
disrupted by the impact of a particular hazard, on account of their nature, construction, and
proximity to a hazardous area. It is the exposure or the chance of loss due to a particular hazard
for a given area and reference period. It may be expressed mathematically as the probability
that a hazard impact will occur multiplied by the consequences of that impact.
(R = H x E x V) Risk=Hazard x Exposure x Vulnerability
Elements at Risk
1. Persons – this should be categorized according to the vulnerable sectors. These are 1)
children, 2) senior citizen, 3) persons with disabilities, 4) women, 5) men
2. Infrastructure
3. Crops
4. Sources of livelihood
5. Other societal components exposed to known hazard, which are likely to be adversely
affected by the impact of the hazard. In MDRRM, these are referred to as the life bloods
such as transportation, communication, electrical supply, and water supply.

Page 55 of 132
Vulnerability
Vulnerability is a condition or set of conditions that reduces people’s ability to prepare for,
withstand or respond to a hazard. It is a complex situation created by multiple levels of causes.
Unsafe conditions are often only symptoms
Aspects of Vulnerability – it is about susceptibility and resilience
Susceptibility – the fact of being exposed to an event
Resilience – the ability to adjust and recover
What makes communities vulnerable to disasters?
Rapid growth and inadequate planning
Population density
Ecological imbalance
Dependency on infrastructure and services
Concentrated political, economic and other resources
Inappropriate construction site and design (e.g. makeshift housing on unstable
slopes)
What makes communities vulnerable to disasters?
Deforestation
Inadequate emergency planning and warning
Unmarked evacuation routes
Lack of urban planning, no safety measures
Inappropriately built and poorly maintained essential facilities and services
What makes communities vulnerable to disasters?
Housing too close to each other.
Bad management of industrial wastes.
Technological disaster risks
Inappropriately constructed buildings in high risk areas
Vulnerability Assessment
A participatory process to identify what elements are at risk per hazard type, and to analyze the
causes why these elements can be damaged
Vulnerability assessment answers the following questions:
1. Who are at risk or can incur damage or loss?
2. What are other elements at risk?
3. What damage or loss can these people or elements at risk suffer or incur? (physical
damage, deaths, injuries, disruption to economy, social disruption, environmental
impact, need for emergency response)
4. Why will these people and elements suffer damage and loss?

Page 56 of 132
Vulnerability Assessment (Urban setting, hazard specific)
Elements At Risk (EAR) Effects on Different EARs Characteristics of EARs That
Contribute to Vulnerability
People injured, died, starvation, trauma Age, gender, physical health,
social, economic &
demographic
Buildings (houses, others) Partial damage/fully damage Construction materials,
design, location, height
Infrastructure (roads,
bridges,
telecommunications,
electricity)
Partial damage/full damage Size, height/depth, design,
materials, level of exposure
Industry Damage to building, products, raw
materials, machinery, (labor,
management)
Size, type of products, type of
raw material,
Vulnerability Assessment (Rural setting, hazard specific)
Elements At Risk (EAR) Effects on Different EARs Characteristics of EARs That
Contribute to Vulnerability
Crops Destroyed Height, water dependent ,
cropping calendar
Environment Damage to vegetation, harm to
flora and fauna, damage to water
ways, mountains, etc
Terrain type, nature of flora
and fauna
Land Erosion, salinity, deposits,
desertification,
Location, elements of soil,
terrain
Irrigation system Deposit of silt, breaking of
channels, damage to machinery
(tube-wells)
Location, design, construction
materials
Animals Injured, died, disease, Location, characteristics of
species, health
Capacity
It is the positive conditions or abilities which increase a community’s ability to deal with hazards.
The goal is to have access to resources and capacities which determine the ability to recover
from the impacts of a hazard event.
Capacity Assessment
This is an analysis done to determine what people do in times of crisis to reduce the damaging
effects of the hazard, and to protect themselves and secure livelihood and community services.
It involves the following:
understanding people’s previous experiences with hazards that enabled them to
develop coping and survival strategies
identifying resources which are available and can be used in disaster risk reduction and
management

Page 57 of 132
What is Hazard, Risk, Vulnerability, and Capacity Assessment (HRVCA)?
This is the process of identifying and validating the vulnerability and capacity of the community
to potential disaster – causing hazards. Its results will lead to the identification of disaster
potential areas that maybe difficult to recognize because of the unusual combinations of the
state physical/material, social/organizational, and attitudinal/motivational factors
Types of Vulnerability and Capacity
Physical and material
o Economic – includes the means of livelihood, productive skills, land, water,
livestock, other means of production (access and control)
o Infrastructure and services - roads, health facilities, schools, electricity,
communication, transport, housing, access routes, buildings
o Human capital – mortality, diseases, nutritional status, population, literacy,
numeracy, poverty levels
o Environmental factors – forestation, soil quality
Social and organizational
o Special categories of vulnerable groups of people (young children, elderly,
differently able, women)we look into how many children, elderly, etc are there in
the community? So if we conduct a plan, the vulnerable groups were counted. The
census must be updated census which we can get from barangay.
o Livelihood at risk
o Population density issue
o Local institutions or organizations and social structures –community organizations
(formal/informal, traditional)
o Family structure
o Leadership qualities and governance structures
o Decision- making structures
o Participation levels
o Division and conflicts – ethnicity, class, caste, religion, ideology, political group,
language group, structures for conflict
o Degree of justice/injustice - equality, access to governance
o Coordination and relationship of governance structures
Attitudinal and motivational
o Beliefs
o Cultural traditions (indigenous and local knowledge)
o Practices
o Standards of values and morals
o Attitudes towards change
o Initiative
o Faith determination
o Dependency and access
o Cohesiveness, unity, cooperation
o Orientations

Page 58 of 132
Sustainable Livelihood Approach (SLA)
The Sustainable Livelihood Approach (SLA) is alway to improve understanding of the livelihoods
of poor people. It draws on the main factors that affect poor people's livelihoods and the typical
relationships between these factors. It can be used in planning new development activities and
in assessing the contribution that existing activities have made to sustaining livelihoods.
Seven guiding principles of SLA
• Be people – centered
• Be holistic – involve all stakeholders
• Be dynamic
• Build on strengths
• Promote micro-macro links – create partnership, private-public partnership
• Encourage broad partnerships
• Aim for sustainability
SLA framework
The poor have assets like human asset (knowledge, skill, attitude), natural
resources (soil fertility, water, etc), financial assets (investments, credits), fiscal
(agricultural implements, agricultural structures), social (applications,
organization, partnerships).
Resource and Hazard Mapping
Resource and hazard map allows the community to identify graphically the vulnerable members
of the community especially the young, the elderly and the disabled who are put at special risk
by hazards.
Transect Walk
Transect walk is walking in the geographical area belonging to a community to get a picture of
the vulnerability of the community and the resources that are available or may be available for
disaster risk reduction and management.
Vulnerability Mapping to ENSO Events of Selected Crops
• ENSO has been linked to droughts and flooding
• Vulnerability of vegetation/ crops
• Good practice options in agriculture – drought resistant crops, flood resistant crops
Page 59 of 132
Session 2: Spatial and Temporal Analysis of Agricultural Impacts of
Climate Change (Farm-level Techniques)
Arthur Estrella, Ph.D.
Director for Research
Central Bicol State University of Agriculture
Spatial Analysis
It describes how objects fit together in space, either among the planets or down here
on earth.
Spatial statistics extend traditional statistics to support the analysis of geographic data.
It provides techniques to describe the distribution of data in the geographic space
(descriptive spatial statistics).
It analyzes the special patterns of the data (special pattern analysis), identifies and
measures special relationships (spatial regression).
It creates a surface from sampled data (spatial interpretation, usually categorized as
geostatistics)
It includes areas of the atmosphere.
It is over space. Allocation of land resources is spatial.
It is concerned more in geographic and topographic.
Its best manifestation of a spatial diagram is a map over space in 2D or 3D. It makes use
of ICT / Information Technology like GIS.
Spatial Analysis Tool
It locates resources or hazards over space by doing Resource map and Hazard map.
Resource Map includes the allocation of physical and biological resources. It describes
the location of resources over space. A true resource map should be polygon not a
square. It should also be a map of a barangay that shows the accurate location of the
resources over space.
Temporal Analysis
It describes relations to time as distinguished from space, or relations to the sequence
of the time.
It is by time element. Allocation of land resources is over time.
Examples are time of year where there are floods, time when precipitation is low,
among others.
Spatio-Temporal Analysis is the combination of space and time – e.g. Transect
map which refers to the cross-section of an area by time and space element. It is
basically divided into two zones. In forestry, in order to make a spatio-temporal
analysis, one needs to get the land cover maps several years ago and latest land
cover maps.

Page 60 of 132
Temporal Analysis Tool
It describes seasonal changes which connote time showing the overlapping changes in seasons,
climate, or weather.
It includes the following:
Hazard Calendar
It includes the process of making hazard maps over space indicating the time of the year
when there are hazards. It is a very simple diagram.
Cropping Calendar
In Agriculture, there is a need to consider the cropping calendar aside from hazard calendar.
Rainfall Calendar
It basically/graphically includes a plot of average rainfall over time.

Page 61 of 132
Session 3: Introduction to Maps and Geographic Information System
Vladimir R. Foronda
Director, Information and Communication Technology
Central Bicol State University of Agriculture
Map
A map is a symbolic depiction highlighting relationships between elements of some space, such
as objects, regions, and themes. Its function is to aid in planning and decision-making, not for
legal purposes.
Geographic Information System (GIS)
Geographic Information System (GIS) is software being used by technical personnel in
generating maps.
Participatory Mapping
It is allowing the community people to participate in making their maps in relation to Disaster
Risk Reduction and Management (DRRM) to give them the sense of ownership to the map and
to allow them to express their ideas into the map.
Its advantage is that the people already know the placement or location and condition of things
(in a given time) in the map as compared to visiting technical people who will still need to do a
transect map.
3-D Mapping
It is time-consuming, expensive to construct, requiring large space to install, and difficult to
maintain.
It provides options and an attempt to improve the visibility/features of mapping.
Challenges
Harmonizing community sketch maps with the official maps to maximize its use to
upgrade its data
Using of technology (computer and mapping softwares such as Google Earth and
Bing Map) to improve maps and its utilization
Aerial Photography
It is highly technical, requiring experts, and expensive. A practitioner in mapping can use aerial
photographs when looking at the past.

Page 62 of 132
Geographic Information System (GIS) is a system used to describe and characterize the earth
and other geographies for the purpose of visualizing and analyzing spatially referenced
information. This work is primarily performed using maps.
It links locational (spatial) and database (tabular) information and enables a person to visualize
patterns, relationships, and trends. The process gives an entirely new perspective to data
analysis that cannot be seen in a table or list format.
Five GIS Components
1. Software
2. Hardware
3. People
4. Methods
5. Data
The GIS does mapping and spatial analysis easily and comprehensively – e.g. Using a real world
data, it could separate maps into other different maps called layers. In the local perspective,
layers are called maps. In real world scenario, one can produce several layers, but
seems/appears to be one when evaluated. Each layer can also be analyzed using GIS.
Characteristics of GIS
1. GIS can integrate maps into 3D
It could transform a flat surfaced map into a 3-Dimensional (3D) map. Each element like
typography, mountain slope and crevice becomes detailed. For instance, a slope map
can be raised coming from a flat surface using GIS by just a single press. Other elements
can also be integrated.
2. Established coordinates help to integrate layers of maps into one
Another element to be considered is the coordinates. In making projects, it should
always have coordinates for easier overlaying of layers when making maps.
Coordinates appear like pins and each represents a data. These are retrieved using GPS.
GIS can merge all layers using one coordinate. Each layer represents a specific feature
like land cover, structures, etc. One coordinate is composed of several maps.
3. GIS Mapping (digital maps)
We can transform a paper-blessed map into a digital map by scanning, and digitization.
The GIS has a legend like the paper maps.
A digital map generated using GIS are segregated into layers (containing specific
“features” of the map) that can be easily overlapped.
Features
o Use points, lines, and polygon/area with coordinates to determine its location using
GPS, and online mapping tools
o Have shapes and sizes and can be displayed accordingly
o Linked to information in their attribute table
o New layer of features can be created and added from areas of overlap
o Using gathered coordinates, layers can be integrated into one community map

Page 63 of 132
GIS maps are used for communication and understanding
o Maps are used to communicate and convey overwhelmingly large amounts of
information in an organized way.
o Humans, as spatial thinkers, are able to view a map, associate map locations with
real-world phenomena , and interpret and grasp critical information from the sea of
detailed content that is contained within each map display.
GIS maps help you see patterns
o Maps are used to discover and investigate patterns.
o In GIS, interactive, online maps are used to compare information reports for
multiple features and how phenomena change through time.
GIS maps provide interactive reports of the information behind the map
o It provides interactive reports of the information behind the map, not solely lists of
attributes but also charts, reports, photos, and virtually any relevant content. E.g. a
link to a website
o Defining how features are being reported and what you access through a map
feature is one of the key specifications that you design and capture when you create
a GIS map.
GIS maps are used to derive new information using analysis
o They combine powerful visualization with a strong analytic and modeling framework
into rich analytic results.
GIS maps are used to openly share geographic information
o They are effective and efficient in visualizing geographic knowledge. Great maps
help
GIS users communicate and share geographic information
Sample Application GIS Maps on Climate Change
Land-cover pattern in a municipality (forest cover)
Changes in flooded level or areas covered across time (years) and the potential affected
population
Hazard maps (baseline and monitoring maps) and the possible communities affected
Pest incidences trend
Lake shore enlargement (per month)
A GIS map on climate change helps to show the trend and the changes. Instead of a tabulated
data, it is more exciting to present these through illustrations or visuals which could be easily
understood. Poverty Incidence Trend shows the comparison of the poverty incidence between
years.
Page 64 of 132
MODULE III
Planning and Implementing Disaster Risk Reduction
and Climate Change Adaptation in Agriculture Initiatives
Adaptation is a local process which entails community participation and institutional and policy
support. After assessment, it is important that local institutions who will be implementing DRR
and CCA initiatives align their efforts to existing international and national policies. Local policies
should allow for the creation/strengthening of structures/platforms and mechanisms to support
initiatives. These serve as enabling environments upon which DRR and CCA programs will take
off and be sustained. In addition, implementation mechanisms should always ensure that part of
the attainment of DRR and CCA objectives is to ensure that all sectors in the community
especially women participates and are capacitated.
Objectives
At the end of the module, the learner should be able to:
1. Discuss existing international and national policies on DRR and CCA
2. Harmonize DRR and CCA in agriculture into local governance
3. Describe community-based DRR and CCA in agriculture program implementation
appreciate community-based early warning systems for agriculture
Methodology
Lecture – discussion
Workshops

Page 65 of 132
Session 1: Overview of Existing Policies
on Disaster Risk Reduction and Climate Change Adaptation
Cely S. Binoya, Ph.D.
Dean, Graduate School, Bicol Central State University
Central Bicol State University of Agriculture
The Republic Act (RA) 10121 is an act strengthening the Philippine Disaster Risk Reduction and
Management System, providing for the National Disaster Risk Reduction and Management
Framework and Institutionalizing the National Disaster Risk Reduction and Management plan
appropriating funds therefore and for other purposes.
Disaster Risk Reduction (DRR) refers to the concept and practice of reducing disaster risks
through systematic efforts to analyze and manage the causal factors of disasters, including
through reduced exposure to hazards, lessened vulnerability of people and property, wise
management of land and the environment, and improved preparedness for adverse events.
The Philippine Disaster Risk Reduction and Management Act was enacted on May 27, 2010
replacing PD 1566.
Under the old law (P.D. 1566), disaster management centered only on the hazards and the
impacts of a disaster. It assumed that disasters cannot be avoided. Most of the plans were on
the provision of relief goods and infrastructures like dikes and flood control systems. The
government’s response to disaster was focused on disaster response.
Overview
• It prioritizes on community level DRRM focusing on the most vulnerable sectors (i.e., the
poor, the sick, people with disabilities, the elderly, women and children). Agriculture
and fisheries sectors are the most vulnerable sectors. For instance, animals cannot
evacuate themselves during times of disasters so they need trainings.
In terms of gender, men are more vulnerable than women after a disaster, since they
are the ones who are responsible in raising their families. Men become down and out-
focused when source of living is gone. In the end, women, who are in-charge of feeding
the family, are more resilient since they are determined to find ways just to feed their
families after a disaster.
• It recognizes the important role and strengthens capacities of local communities.
Community-based DRRM is being taught because after a disaster, it is the people in the
community who organize and help one another.
• It ensures broad‐based and greater participation from Civil Society. It should involve the
participation of everyone in the community.
• It addresses root causes of disaster risks. Knowledge of the basis or source of disasters
which is the hazard is important in order to be able to mitigate, prevent, and prepare for
disasters.
Page 66 of 132
Paradigm Shift in DRRM
• It is the new concept of DRRM.
• It is a centralized management. It starts in the LGU level (Municipal DRRMC) with the
participation of all sectors.
• It focuses in knowing how to deal with hazards and managing effective tools to be able
to make a very effective DRRM plan.
• It aims to identify the most vulnerable areas during times of disasters and integrates this
in the development of the DRRM plan.
Salient Features of the DRRM Act
• Coherence with the international framework
• Adherence to universal norms, principles, and standards of humanitarian
• Good governance through transparency and accountability
• Strengthened institutional mechanism for DRRM – there is a need to make sure that in
every LGU, there should be a DRRM office and it must have people, budget, structure
and mechanism.
• Integrated, coordinated, multi-sectoral, inter-agency, and community-based approach
to disaster risk reduction.
• Empowerment of local government units (LGUs) and civil society organizations, (CSOs
such as the academe) as key partners in disaster risk reduction
• Integration of the DRRM into the educational system – the practices and concepts of
DRRM should be integrated in the formal education. In CBSUA, DRRM was integrated in
the curriculum so MS in DRRM was offered. DRRM contents are also incorporated in the
project, Save the Children.
• Establishment of the DRRM Fund (DRRMF) at the national and local levels – RA 10121
states that a minimum of 5% funds should be allocated for DRRM fund in the LGU to
national level. In the DRRM fund, 70% of it should be allocated to mitigation, prevention
and preparedness, even in making studies to assess risks; it can be used for trainings,
provision for the declaration of state of calamity and come up with remedial measures.
If these are not done, the government can be punished.
• Providing for provisions on the declaration of a state of calamity, remedial measures,
prohibited acts and penalties
Who are Involved in DRMM as Mandated in the DRRM Act?
• National Government (NDRRMC)
• Local Government (LDRRMC)
• CSOs, Private Sector, and Volunteers
• Community
New DRRM Structure (PD 1566 vs RA 101221)
The national level is equivalent to OCD, and then followed by Regional, Municipal and Barangay
level DRRMC.
The DRRM Act clarified the distinction between oversights versus implementation of DRRM in
order to strengthen the capacities of local governments. It broadened the membership of the
DRRM Councils at all levels. It also recognizes the importance of local communities by
institutionalizing the participation of civil society organizations and the private sector.

Page 67 of 132
Structure of the NDRRMC
The National Disaster Risk Reduction and Management Council (NDRRMC) is a multi‐sectoral
body composed of the heads of the different executive departments of government,
government institutions, local government associations, civil society organizations, and the
private sector. It shall oversee the DRRM system in the Philippines. (Secs. 5 and 6)
For NDRRMC, the major stakeholders include the Department of National Defense as the Chair;
DOST for Mitigation and prevention Division; DILG for Disaster Preparedness; DSWD for Disaster
Response; and, NEDA for Rehabilitation & Recovery. For instance, TNA result showing those who
are in need of rehabilitation, is being presented to NEDA since it is important for Rehabilitation
and Recovery.
Regional DRRM Councils (RDRRMC)
• Responsible for coordinating, integrating, supervising and evaluating DRRM
activities of the Local DRRM Councils.
Regional Development Plans should be sensitive in DRRM concerns. It is important
to harmonize DRRM into local government plans.
• Responsible for ensuring disaster sensitive regional development plans, and
convening the different regional line agencies and concerned institutions and
authorities in case of emergencies (Sec. 10).
Since there are many agencies, there is a need for coordination and unity in the
implementation and assessment of the activities of the DRRM.
Local DRRM Councils (LDRRMC)
They are found at the provincial, city, and municipal levels. Provincial level is to be led by the
Governor; Municipal is by the Mayor, and Barangay is by the Punong Barangay. The
Barangay Development Council (BDC) shall assume the powers and functions of the council
at the barangay level.
These are composed of multi‐sectoral and multi‐agency members. For instance, the concern
also includes the Agriculture Officer for rehabilitation of their sector; the Planning Officer
because it is important to integrate DRRM in the municipal plans; and, the Veterinary officer
since the livestock is one of the most vulnerable to disaster.
Role of LDRRMC
It oversees the implementation of the Local DRRM Plans (LDRRMPs) formulated by Local
DRRM Offices (LDRRMOs) (Sec. 11).
Local DRRM Offices (LDRRMO)
In a local DRRMC, there should be a DRRM officer and three (3) other staff that will be
responsible in administrative and training, research and planning and operational warning,
independently.
Role of LDRRMO
Local DRRM Offices set the direction, development, implementation and coordination of
DRRM programs and activities within their territorial jurisdictions. The LDRRMOs are

Page 68 of 132
established in every province, city and municipality (PDRRMO, CDRRMO and MDRRMO)
(Sec. 12 .a).
The LDRRMO is under the Office of the Governor, City or Municipal Mayor, and Barangay
Captain. Each office will be headed by a DRRM Officer to be assisted by three staff (Sec.
12.b).
Qualifications of the DRRM Officer
• Must be civil service eligible
• Must have a civil defense/ DRM experience
• Graduate of MS in Public Safety or MS in DRM
Barangay DRRM Committees (BDRRMC)
At the barangay level, Barangay DRRM Committees (BDRRMC) shall be established (Sec.
12.a) with at least two (2) members representing the civil society organizations (CSOs). The
BDRRMC shall be a regular committee of the BDC (Sec. 12.d).
The Barangay Captain is the acting Chair of the Barangay DRRM Committee.
National DRRM Framework (NDRRMF)
It serves as the principal guide to disaster risk reduction and management efforts in the
country. This shall be developed by the NDRRMC. It shall be the basis for the formulation of
the National DRRM Plan (NDRRMP).
It shall provide for a comprehensive, all‐hazards, multi‐sectoral, inter‐ agency and
community‐based approach to DRRM (Sec. 3.y and Sec. 6.a).
DRRM Plan Framework Paradigm
It is important to make resource map, hazard map, hazard calendar and cropping calendar,
because we will know when hazards are expected, and we could match it with our cropping
calendar to save our crops from hazards.
For Risk Assessment, there is a need to identify Prevention and Mitigation measures, build
capacities and awareness about the plan, set- up preparedness plans and early warning to
ensure that everyone is not affected during a calamity. Once we are affected, it is better to have
Emergency Response plans.
It is observed that there are more actions to be taken before a disaster. This is the reason why
70% of the DRRM fund is appropriated from Risk Assessment to early warning; and 30% for
emergency response, rehabilitation and reconstruction.
In the old paradigm, development is found outside the paradigm. But it is placed inside the
paradigm in the new DRR paradigm. The new framework states that development focus will not
be affected if all concerns are put within the DRRM plan.
National DRRM Plan (NDRRMP)
The NDRRMP shall be formulated and implemented by the Office of Civil Defense (OCD)
(Sec.3.z and Sec. 9.b). The NDRRMP sets out goals and specific objectives for reducing
disaster risks. This includes the identification of hazards, vulnerabilities and risks to be
managed at the national level; DRRM approaches and strategies to be applied in managing

Page 69 of 132
said hazards and risks; agency roles, responsibilities and line of authority at all government
levels; and vertical and horizontal coordination of DRRM in the pre‐disaster and post‐
disaster phases.
In preparing DRRM plan, it should:
1. Acknowledge risks and vulnerabilities that need to be addressed
2. Identify strategies
3. Set the roles of people
4. Make sure there is a structure; and coordination mechanism should be well said
Local DRRM Plans (LDRRMP)
The Local DRRM Plan will guide DRRM implementation at the local level. The LDRRMP will
be formulated by the LDRRMOs/BDRRMC in close coordination with the local development
councils. (Sec. 12.c.6)
In local plans, it is creating or making local plans. The government mandates institutions that
they could not use their DRRM fund without an approved DRRM plan.
Vulnerability Reduction
The damaging effects of disasters can decrease by reducing vulnerabilities and enhancing
capacities of local communities.
It is not necessary to wait for a disaster to happen before planning and taking action
against hazards.
Before, the local calamity fund can only be used after a declaration of a state of
calamity; the fund has been renamed as the DRRM Fund and is encouraged to be used
to fund activities such as training personnel and procurement of equipment to reduce
vulnerabilities.
Uses of DRRM Fund
• capital expenditures
• conduct of participatory risk assessments
• establishment of early warning systems
• conduct of emergency drills
• public awareness campaigns
• purchase of communication equipment
• construction of safe evacuation centers, etc.
Difference Between the DRRM Fund and the Previous Calamity Fund
• A declaration of a state of calamity is no longer necessary to access and utilize the
DRRM Fund.
• The Local DRRM Fund shall be sourced from not less than 5% of the estimated revenue
from regular sources (Sec. 21 par. 1). The 5% is just the initial appropriation but we can
go higher than 5% when all orders and projects have gone concerns to make us
implement such. Meanwhile, each sector (agriculture, infrastructure and health) has
each respective DRRM. Thus, to sum up all the DRRM fund of all sectors, it can go as
higher than 5%.

Page 70 of 132
• The DRRM Fund can be used for DRRM. It can be used to implement the DRRM
Plan. Thirty percent (30%) of the fund shall be set aside as a Quick Response Fund (QRF)
for relief and recovery programs. (Sec. 21 par 1; Sec. 22.a & c). The 70% is used for the
first activities for DRRM from assessment to early warning system and the 30% for
response.
• Unexpended LDRRMF goes to a trust fund which will be used solely for DRRM activities
of the LDRRMC within the next five (5) years. Funds which are still not fully utilized after
five (5) years shall go back to the general fund and will be available for other social
services to be identified by the local sanggunian. (Sec. 21 par. 3).
• Unutilized quick response fund should be put into a special trust fund which can stay
there for five years. It can be used for social activities. For instance, in some barangays,
when meetings are being conducted, sometimes bar soaps are given just to encourage
their constituents to attend their trainings, and meetings. It is indicated as a training
material in an activity or training for disaster preparedness so DRRM fund can be used.
• The Special Trust Fund is not planned because it is a quick response fund.
Vulnerability Reduction
At the local level, the LDRRMO through the LDRRMC and the LDC shall submit the proposed
programming of the LDRRMF to the local sanggunian (Sec. 12.c.7).
It shall likewise submit the report on the utilization of the LDRRMF and other dedicated DRRM
resources to the local Commission on Audit (COA) (Sec. 12.c.24). The LGU must submit DRRM
plan as basis for spending and must be agreed upon plan by the local DRRMC, and give copy to
COA.
Disaster Preparedness
The LDRRMO shall conduct public awareness programs and activities to provide stakeholders
with knowledge and skills in preparing for disasters (Sec. 12.c; Sec. 10 and Sec.17).
Also, public sector employees are required to undergo training in emergency response and
preparedness (Sec. 14).
The LDRRM Fund can be utilized for pre‐disaster preparedness programs such as training,
purchasing life‐saving rescue equipment, stockpiling of food and medicine (Sec. 21 par. 1).
Disaster Response
A State of Calamity can be declared so that disaster response can be coordinated, remedial
measures can be taken, and the Quick Response Fund can be used to provide assistance to
those affected.
Remedial measures are the mandatory courses of action which shall immediately be undertaken
during the declaration of a state of calamity (Sec. 17). These are as follows:
1. Imposition of a price ceiling on basic necessities and prime commodities
2. Prevention of overpricing/profiteering
3. Prevention of overpricing/profiteering and hoarding of prime commodities, medicines and
petroleum products
4. Programming/reprogramming of funds for the repair and upgrading of public infrastructure

Page 71 of 132
5. Granting of no‐interest loans by government financing institutions to the most affected
population
Declaration of State of Calamity
The President can declare a state of calamity upon the recommendation of the NDRRMC. The
local sanggunian may now also declare and lift the state of calamity within their locality. This
is upon the recommendation of the LDRRMC based on the results of the damage assessment
and needs analysis (Sec. 16).
How Will DRRMCs Coordinate During a Disaster?
The LDRRMCs take the lead in preparing for, responding to, and recovering from the effects of
any disaster based on the following criteria (Sec. 15):
• The Barangay Development Council - One (1) barangay is affected
• The City/Municipal DRRMCs -Two (2) or more barangays are affected
• The Provincial DRRMC ‐ Two (2) or more cities/municipalities are affected
• The Regional DRRMC -Two (2) or more provinces are affected
Taking the onslaught of typhoon Yolanda, the LDRRMC was blamed for the disaster but in that
context, the NDRRMC should have taken the response since the LDRRMC is also devastated.
The LDRRMCs shall coordinate with the private sector and CSO groups through the LDRRMO.
The LDRRMO conduct continuous disaster monitoring and mobilize volunteers to utilize their
facilities and resources (Sec. 12.c.8). The LDRRMO shall respond to and manage the adverse
effects of emergencies and carry out recovery activities in the affected area (Sec. 12.c.16). It
shall build links with the LGUs, private sector and CSOs and volunteers who could be tapped or
mobilized for DRRM.
Prohibited Acts
Dereliction of duties which leads to destruction, loss of lives, critical damage of facilities
and misuse of funds
Preventing the entry and distribution of relief goods in disaster‐stricken areas, including
appropriate technology, tools, equipment, accessories, disaster teams/experts
Buying, for consumption or resale, from the disaster affected recipient any relief goods,
equipment or other aid commodities received by them
Selling of relief goods, equipment or other aid commodities which are intended for
distribution to disaster victim
Forcibly seizing relief goods, equipment or other aid commodities intended for or
consigned to a specific group of victims or relief agency
Diverting or misdelivery of relief goods, equipment or other aid commodities to persons
other than the rightful recipient or consignee
Misrepresenting the source of relief goods, equipment or other aid commodities by:
Covering, replacing or defacing the labels of the containers to make it appear that the
goods, equipment or other aid commodities came from another agency or persons
Repacking the goods, equipment or other aid commodities into containers with
different markings to make it appear that the goods came from another agency or
persons or was released upon the instance of a particular agency or persons
Page 72 of 132
Making false verbal claim that the goods, equipment or other aid commodity in its
untampered original containers actually came from another agency or persons or was
released upon the instance or a particular agency or persons
Substituting or replacing relief goods, equipment or other aid commodities with the
same items or inferior/cheaper quality
Illegal solicitations by persons or organizations representing others as defined in the
standards and guidelines set by the NDRRMC
Deliberate use of false or inflated data in support of the request for funding, relief
goods, equipment or other aid commodities for emergency assistance or livelihood
projects
Tampering with or stealing hazard monitoring and disaster prepared
Penal Clause
Section 20 of the DRRM Act imposes the penalty of:
1. Fine between P50, 000 to P500, 000
2. Imprisonment between six months to one year
3. Both fine and imprisonment
4. Confiscation or forfeiture of the objects and instrumentalities used
Policies on Climate Change
The RA 9729 is an act mainstreaming climate change into government policy formulations,
establishing the framework strategy and program on climate change, creating for this purpose
the climate change commission, and for other purposes.
“Climate Change” refers to a change in climate that can be identified by changes in the mean
and/or variability of its properties and that persists for an extended period typically decades or
longer, whether due to natural variability or as a result of human activity.
Climate Change: A Reality
Climate change is a reality as evident in the occurrence of disasters like drought, flood, cyclone,
typhoons, salinity, and erosion. These bring worse impact on Agriculture.
Phenomena like increased natural hazard threats, sea level rise causing salinization of soils and
drinking water, and on changing cropping seasons do not leave any doubts indeed that impacts
of Climate change are already visible.
The poorest are the first to be hit, and due to their basically high vulnerability they are also likely
to be hit hardest by climate change.
Hydrometrelogical disasters increase as a result of climatic change and affecting livelihood
worst. In case of Bangladesh, (where > 80% population dependent on agriculture and allied
sectors) livelihood sector is mainly represented by these sectors. Thus, there is a need to give
this issue a special attention. Taking this strategic issue into consideration LACC projects are
initiated, in drought prone and coastal areas as pilot projects.

Page 73 of 132
Effects of Climate Change
Greenhouse gases (GHG)” refers to constituents of the atmosphere that contribute to the
greenhouse effect including, but not limited to, carbon dioxide, methane, nitrous oxide,
hydrofluorocarbons, perfluorocarbons and sulfur hexafluoride.
“Greenhouse effect” refers to the process by which the absorption of infrared radiation by the
atmosphere warms the Earth.
1. Climate change directly affects food security
A one degree increase in temperature in the tropics causes 10% decline in agricultural
yield. This would impact on food security.
2. Climate change impact on rural livelihood
Climate Change
Results Impacts on Rural Livelihood Effect to National Development
Change in Rainfall
Frequent and Severe flood Higher river erosion Increased sedimentation
Agriculture land inundation and erosion Damage to crop, fishery, livestock Agricultural Input loss (fertiliser, seeds, etc.)
Food insecurity Nutrition deficiency Increased poverty Poor health Scarcity Livelihood Migration
Glacier Melting
Increased River Flow (warm season) Lower flow (once glacier melted) Increased saline intrusion
Agriculture land inundation Scarcity of water for irrigation Soil degradation (more salinity)
More Cyclone
More storm surge Higher wind speed Saline water intrusion
Direct loss to crop, fishery, and livestock Soil becomes infertile Scarcity of fresh water (irrigation)
Humid/Warm Climate
Rise in Temperature More wet climate
Rise in insect infestation Crop and cattle disease Less evapo-transpiration
Sea Level Rise
Land inundation Saltwater intrusion Increased soil salinity
Agriculture land loss Scarcity of irrigation water Soil degradation (more salinity)
Lower Rainfall
Droughts condition Soil degradation Fall in water table
Irrigation water scarcity Soil nutrient deficiency More disease (cattle/crop)
3. Climate change causes land and water constraints
It causes water and soil scarcity.
4. Climate change causes erratic rainfall patterns
There is heavy rainfall during wet seasons; dry seasons become drier.

Page 74 of 132
Anticipated Impacts on Agriculture
(Source: IPCC 2007)
• 1oC rise in air temp agricultural irrigation demand increases by 6-10% or more in East
Asia; rice yield declines by 10% in Korea; wheat yield declines by 4-5 million tons (India)
• 2oC rise in air temperature reduction of rainfed rice yields by 5-12% in China
• 3oC rise in air temp disappearance of Tibetan Plateau glaciers of <4km length (China)
• 2-4oC rise in air temperature increase of tropical cyclone intensity by 10-20% in East Asia
• 30cm sea level rise increase of area under coastal flooding by 5-6 times in Chanjiang and
Zhujiang deltas of China
• 40cm sea level rise by 2100,13-94 million people to be at flood risk in Asia
• 1m sea level rise Inundation of 2643 km2 of Korean peninsula
Climate Change Impact on Crop Yields by 2050
There will be a gradual decline of yields in crops like rice by 14-26%; wheat by 32 – 44%; maize
by 2-5%; and, soybean by 9 – 18%. It will result in the increase of price in rice by 29-37%; maize
by 58-97%; wheat by 81-102%; and, soybean by 14-49%.
Other yields of major crops such as drybean, peanut and grain sorghum will also decrease.
Causes
“Anthropogenic causes” refer to causes resulting from human activities or produced by human
beings.
Policy on Adaptation
Adaptation refers to the adjustment in natural or human systems in response to actual or
expected climatic stimuli or their effects, which moderates harm or exploits beneficial
opportunities.
Adaptation occurs at a range of inter-linking scales, and can either occur in anticipation of
change (anticipatory adaptation), or be a response to those changes (reactive adaptation).
It is a social and institutional process that involves reflecting on and responding to current
trends and projected changes in climate.
Policy on Mitigation
a. “Mitigation” in the context of climate change involves reduction in the concentration of
greenhouse gases, either by reducing their source or by increasing their sinks.
It involves reduction in the concentration of greenhouse gases, either by reducing their
source or by increasing their sinks. Example of source reduction is using bicycles instead
of using vehicle to save use of fuel.
It entails acting to tolerate the effects of global warming
It is a human intervention to reduce the sources or enhance the sinks of greenhouse
gases (UN)

Page 75 of 132
b. “Mainstreaming” refers to the integration of policies and measures that address climate
change into development planning and sectoral decision-making.
c. Gender mainstreaming” refers to the strategy for making women’s as well as men’s
concerns and experiences an integral dimension of the design, implementation,
monitoring, and evaluation of policies and programs in all political, economic, and
societal spheres so that women and men benefit equally and inequality is not
perpetuated.
It is the process of assessing the implications for women and men of any planned action,
including legislation, policies, or programs in all areas at all levels.
d. “Vulnerability” refers to the degree to which a system is susceptible to, or unable to
cope with, adverse effects of climate change, including climate variability and extremes.
It is important that if we look at climate change adaptation, there is a need to consider
those who are vulnerable and susceptible groups and those who are unable to cope
with climate change.
Vulnerability is a function of the character, magnitude, and rate of climate change and
variation to which a system is exposed, its sensitivity, and its adaptive capacity.
Principles to Consider in Designing Adaptation Policies and Mechanisms
(Scheraga and Grambsch)
• The effects of climate change vary by region
E.g. Temperature rise affects some ethnic groups. In the tropics, the Waray tribe is
affected because of gradual temperature rise.
• The effects of climate change may vary across demographic groups so there is a need
to identify the most vulnerable groups
Accordingly, farmers and fisherfolks are the most vulnerable groups because their
livelihood is dependent on weather or change in climate.
• Climate change poses both risks and opportunities
Climate change does not always bring negative effects. The planning of DRRM is one
good effect of climate change.
• The effects of climate change must be considered in the context of multiple stressors
and factors, which may be as important to the design of adaptive responses as the
sensitivity of the change
• Adaptation comes at a cost
There is investment in adaptation.
• Adaptive responses vary in effectiveness, as demonstrated by current efforts to cope
with climate variability
• The systemic nature of climate impacts complicates the development of adaptation
policy

Page 76 of 132
• Mal-adaptation can result in negative effects that are as serious as the climate-
induced effects that are being avoided
Dam can be a maladaptation strategy. For instance, Bataan and Bulacan
was once submerged into flood because the dam released a massive
amount of water which could happen during a strong typhoon signal. But it
could also be good reservoir for irrigation.
Many opportunities for adaptation make sense whether or not the effects of climate
change are realized.
Climate Change Adaptation: The Appropriate Strategy
• Bridge the gap between global climate information and local adaptation needs of rural
population.
• Develop mechanisms to address climate change adaptation at the local level by using
different prediction models and climate scenarios data, translating them into local
impact outlooks and finally into location specific livelihood adaptation practices.
It should be situation specific. For example, one should not copy the DRRM Plan that
worked on Palawan or Laguna. It involves knowing our local disaster situation in order
to familiarize ourselves with our hazard and cropping calendar counts.
The principle in DRRM is that there is no one preach-all- formula. It may work in one
area but may not work efficiently in our situation.
• Ideal Practices or options therefore need to fit the location specific agro-ecological
setting; increase climate resilience and reduce the risk of hazard impacts to the
production system; must maintain the income level of rural population and do not
increase greenhouse gas emissions.
The Approach
It starts from vulnerability, risks and local livelihoods until it ends in Up-scaling and
mainstreaming.
• Assess current vulnerability, risks and local livelihoods
• Assess future climate risks
• Promote institutional and technical capacities for adaptation
After identifying current and future vulnerabilities, we put up institutional mechanisms and
train people from the local government units.
• Identify, validate and test suitable adaptation options
• Design location-specific adaptation strategies
• Upscaling and mainstreaming

Page 77 of 132
Mitigation Practices
• Using fossil fuel more efficiently for industrial processes or electricity generation,
• Improving the insulation of buildings, and
• Expanding forests and other "sinks" to remove greater amounts of carbon dioxide from
the atmosphere. There is a need to reforest our forests because it is already denuded. If
without forest, there would be no carbon sinks.
• Reducing energy waste and switching to cleaner energy sources switching to renewable
energy (solar energy or wind power, biofuels)
Adaptation Option’s Prioritization Mechanism
Feasibility Evaluation (of adaptation options)
Agro- ecological suitability
Economic & social feasibility
Increase resilience against impact of climate hazard exposure
Does not make contribution to GH Gases
Examples of Field Levels
Agro-ecological suitability
Economic and social feasibility
Increase resilience against impact of
climate hazard exposure
Does not make contribution to GHG
• Farmer’s perception
• Expert’s perception
• Climatic, edaphic and topographic conditions and agro-ecological zones
• Cost of input • Net benefits • Quantity of yield • Capacity building
requirements • +/-employment
opportunities for the landless
• Hazard resilience of innovation
• +/- water use • Cost for irrigation • Reduced risk by
changed farming schedule or varieties
• =/- chemical fertilizer use
• + /- use of organic manure
Not using chemical fertilizer is favourable. Although in organic fertilizer, it depends on the duration it will take to decompose. For instance, farmers are advised to put their rice straws in their rice paddies until these will be decomposed. During the process, the decomposing rice straw has high methane gas emission. This is the reason why in decomposing, it should be covered in plastic to prevent methane gas emission from the compost.

Page 78 of 132
Good Adaptation Practices in Agriculture
• Changing sowing times and cropping patterns
• Adopting new water saving technique – use of plastic mulch
• Use of drought tolerant varieties
• Rainwater harvesting
• Cloud seeding
Adapting to Climate Change: Technological Options
Private
• Alter crop species and varieties
• Alter livestock species and breeds
• Alter timing of planting and harvest
• Multiple cropping season
• Rehabilitation of on-farm structures
• Change land use
Public
• Plant and animal breeding
• Public awareness and extension
• Insurance schemes and conditional cash transfers
• Modernization of irrigation systems
Examples of Adaptation
Sea-level rise
• Better flood defenses, by establishing greenbelt along shorelines
• Changing patterns of land use like avoiding more vulnerable areas for housing
Good adaptation practices
• Use of saline tolerant varieties
• Water harvesting pond with azolla
• Use of lemon grass as a biological control
Lemon grass can be used as an insect repellant
• Use of plastic mulch to conserve water – mulching can prevent sea level rise since it
does not allow water to evaporate from the soil.
• Use of plastic mulch and rice hull for water conservation and weed control – in
mulching, it is advised not to water the plants.
• Construction canals and dikes to prevent further shoreline erosion
Examples of Mitigation Practices
• Use of Renewable Energy Sources
• Energy efficiency and conservation
• Use of bicycles for zero carbon footprints
• Greening the Building Designs; ex: BedZEDzero-energy housing in the UK
• Reforestation, avoidance of deforestation

Page 79 of 132
• Bio/Carbon sequestration of greenhouse gasses – use of vaccine in Australia to lower
methane release from ruminants due to flatulence and eructation
• Efficient practices in organic agriculture
Focal Areas of Adaptation Policies
• Information- effective – it should focus more on information campaign.
• Capacity – strengthening capacities in technical and planning disciplines to understand
potential Climate change impacts and devising response strategies
• Financial Resources should focus on poorer countries – e.g. carbon trading between rich
and poor countries. Rich countries pay for every seed planted by poor countries.
• Institutions – focal points are needed at the national and international levels to garner
expertise, develop and coordinate comprehensive strategies and advocate for broad-
based planning and action
• Technology – suitable to the needs
Stages Developed by the Conference of Parties (COP)
Stage 1 – identifying most vulnerable countries and regions and adaptation
options
Stage 2 – to involve measures, including capacity building to prepare for adaptation
Stage 3 – implementing measures to facilitate adaptation
The Philippines has already gone through these stages 1 to 3. Many countries like Canada and
Japan cannot anymore abide with the initial agreement on climate change so small countries
need to full force to pressure these bigger countries to commit in the initial agreement that they
would buy carbon elements or would also implement carbon minimizing options. It resulted in
bilateral programs amounting to US$110 M to more than 50 adaptation projects in 29 countries.
Also, it provided funding to member countries to prepare the NAPAS-National Adaptation
Programs of Actions.
Priorities in Moving Forward
• Adaptation under the UN Framework Convention on Climate Change (UNFCCC) –
strengthening support for proactive adaptation by facilitating comprehensive national
policies and committing reliable funding for high priority projects
• Integration with Development – this means factoring adaptation into development
Assistance thru measures such as mandatory climate risk assessment for projects
finance by bilateral cooperation. For instance, geo-hazard map is required in
infrastructure projects. This is for geologic assessment.
• Climate Insurance – for instance, cropping insurance should not only be limited to rice
but also to animals.

Page 80 of 132
Near term policy options for adapting to climate change and securing food supply (Source: V.
Anbumozhi, ADBL, 2002)
Policy options should become part of the Climate Change Response Measure.
Page 81 of 132
Session 2: Strategic Planning: Harmonizing Disaster Risk Reduction
and Climate Change Adapation in Agriculture and Local Governance
Cely S. Binoya, Ph.D.
Dean, Graduate School
Central Bicol State University of Agriculture
Issues at Hand: Global Warming and Disaster Risks
Factors Influencing the Agricultural Landscape (Paul Teng, 2014)
Demographic landscape
Declining performance of Agriculture
Stress factors on the rural resource base
o Soil degradation; Water – pollution of industrial and agriculture effluent, Air
pollution by natural and anthropogenic sources
o Global climate change – temperature (global warming, light (global dimming)
o temperature change
o Oil prices vs. Food Prices – biofuel expansion
Rapid transformation of supply chain
o emergence of supermarkets and large wholesalers/processors in the last two
decades
o Impact: lower food prices for urban consumers but lower market participation
among poorer small farmers. It affects technology, and society.
Association of Southeast Asian Nations (ASEAN) Integration – zero tariffs, free flow of
people, single market and production base, ASEAN Investment area. Accordingly,
Philippines would hardly cope up during the full swing of ASEAN integration especially
on Rice Production.
Declining enrolment in agriculture – the agriculture sector is met by declining
population. Accordingly, 70% are indigent farmers.
Issues and Opportunities for Action
1. Food security
2. The sustainability challenge
3. Biotechnology /Biodiversity Management/ Genetic Engineering – Molecular Biology
This is receiving negative acceptance among farmers while scientists think that these
can be an answer to food security. Undeniably, biotechnology actually has a big
contribution to food security and productivity so there is the need to educate our
farmers. One issue is about Genetic Engineering.
4. Urban/Peri-urban agriculture - part of the problem of part of the solution
5. Bio – entrepreneurship: keeping farmers on the farm thru profit motivation, value
addition> science + technology+ investment

Page 82 of 132
Why is Strategic Planning Important?
• Secures the future of the institution
• Provides a roadmap
• Sets priorities
• Allocates resources
• Establishes measure of success
• Gets inputs and ideas from all parts of the institution
• Coordinates actions of different parts of the institution
• Responds to changes in the environment
What is Strategic Planning?
Strategic planning is an organizational management activity that is used to
o set priorities,
o focus energy and resources to strengthen operations,
o ensure that employees and other stakeholders are working toward common
goals,
o establish agreement around intended outcomes/results (Scorecard), and
o assess and adjust the organization's direction in response to a changing
environment.
Effective strategic planning articulates not only where an organization is going and the
actions needed to make progress, but also how it will know if it is successful.
Involves formulating and implementing decisions about an institution’s future direction.
A Strategic Plan is a document used to communicate with the organization the ff:
1. Organization goals
2. The actions needed to achieve those goals
3. All of the other critical elements developed during the planning exercise.
Strategic Management
• It involves processes that organizations use to systematically coordinate and
align resources and actions with the mission, vision and strategy throughout the
organization.
• Activities transform the static plan into a system that provides strategic performance
feedback to decision making and enables the plan to evolve and grow as requirements
and other circumstances change.
Rationale, Sequential and Analytical Strategizing
Integrating TQM in Strategic Planning Framework
1. Begin with the end in mind – for instance, it involves envisioning how the small farmers
can compete to the ASEAN 2015.
a. Draw a picture of your institution's future
b. Describe that picture
c. Vision Statement

Page 83 of 132
2. Analyze past trends like asking the question: Where is your Institution now?
External Analysis (Projection of the Future)
After analyzing the past trends, one should do an External Analysis and project the
future.
Institutional Mandate
E.g. What is the mandate of the Department of Agriculture (DA) in terms of
the context in Climate Change on DRR?
Government Policies, Regulations and Incentives
Sector Status, Dynamics and Structure – in 2015, budget for the activities of
DRRM should be highlighted
Sector Demand and Supply, Potentials and Prospects
Micro-market Assessment - it is projected that small farmers cannot compete
during the ASEAN 2015
Internal Analysis (Projection of the Future)
From external analysis, do a Strengths, Weaknesses, Opportunities, and threats (SWOT)
Analysis. In doing SWOT Analysis, the process includes starting from the External
Environment before going internally. After knowing your external environment, you can
review your internal conditions.
Assess Performance vis a vis targets and benchmarks
Assess Organizational Capabilities
Assess Resources and their allocation
Assess Functions in regulations (Policy Making -Technical, Monitoring,
Evaluation, Administrative, Etc.)
Assess Management Processes
Assess Teams and Individuals
Assess Top Management and Strategic
Internal analysis is like undergoing ISSO accreditation. After undergoing it (internal
analysis), opportunities and trends can already be identified from External Analysis,
while strengths and weaknesses can be identified from Internal Analysis. Then, Cross
Impact Analysis can now be done.
Vision – it is an idealized picture of your institution in the future / picture of the target
clients or beneficiaries.
Strategies – these are means that will get you to the vision.
Mission – it is the basic purpose of being of the organization.
Objectives – these are measurable end results that are derived from the vision and
mission/ mandate.
Key result areas – these are qualitative manifestations that the objectives are being
achieved.

Page 84 of 132
E.g. For Higher Education, key results areas include the number graduates, number of
students who graduated on time, number of unrelated programs, and percentage
passing in licensure exams.
Performance Indicators or Outcomes – these are quantitative measurements of key
result areas.
The Six R’s of Performance
When looking at the performance indicators, the six R’s of performance must be
considered.
1. Reach – physical presence
2. Revenues – agency income
3. Returns – bottom line profit and equity
4. Recognition – image and reputation
5. Ratings – product rating by clients
6. Responsiveness – impact on the market
Strategies
From performance indicators, identify strategies or the major moves or directions
that will allow the institution to move.
Action Plans
There will operationalize the Strategies, Regulation, Monitoring, Special Projects,
Administration, Human Resource and Finance.
Activities
These are set of tasks to be done.
Resources
These are the inputs that are needed for the accomplishment of strategies,
programs, activities and tasks.
Full- Spectrum of Right to Left Planning
From the Full Spectrum of Planning, it starts with Right to Left Planning which is the (Vision,
Mission, Objectives, Key Result Areas, and Performance Indicators) VMOKraPI’s progress.

Page 85 of 132
It is the management that sets the strategic planning. For example, Department of Agriculture
sets up its own DRRM Plan for Agriculture. It is the agency that sets its dream.
Top – Down Approach
It starts from vision, mission, objectives, key result areas, and performance indicators. It will be
met by Bottom-Up Planning.
Bottom-Up Planning
Here, one needs to consider External and Internal Environment Analysis that are inputted to the
selection of strategies, operating plans and action programs, activities and tasks, and resources
required.
There should be a Top-Down and Bottom-Up Planning that are meeting at the middle.
Needs identification may start from the bottom for as long it will meet the needs of the top.
VMOKraPI-SPATRes
• Vision is the 5 to 10 – year picture of the future.
• Mission is the reason for being /purpose.
• Objectives are the direction/measurable end results.
• Key Result Areas are specific manifestations that objectives are met
E.g. CHED has 9-Point Roadmap. From the 9-Point Agenda, a SOT Analysis is being done.
It involves determining areas to be funded. While thinking of that 9-point agenda of
CHED, we also try to address local situations.
• Performance Indicators are Numerical Translation of KRAs.
• Strategies are best Ways of Doing Things.
• Programs are done by multi-functional groups.
E.g. Climate Risk Assessment and Disaster Preparedness is a joint project of DRRMC and
DA then there are many agencies that are working towards the attainment of the
program. The role of each sector should be specific.
• Activities are done by groups in a department.
• Tasks are done by individuals.
• Resources include human and financial.
Planning Framework
Where we are now?
• Internal Analysis
• External Analysis
How do we get there?
• Strategies
• Programs
• Tasks
• Resource Allocation
• Contingency Planning
• Integrate Functional Plans

Page 86 of 132
How do we know we are getting there?
• Strategic Control
• Monitoring
• Evaluation
Where do we want to be?
• Vision
• Mission
• Objectives
• Key result areas
• Performance Indicators
The New Balanced Scoreboard and Measurement-Based Management
The major elements of Score Card include customer, financial, internal business processors and
learning and growth. We can devise our own Score Card based on your major final outputs.
The Strategic Planning Process
The three foundations of Strategic Planning Process include External Analysis, Internal and
VMOKraPI. For instance, levels of external analysis in the academe include curriculum, library
facilities, Research and Extension, etc.
The Three Foundations
1. Environmental Analysis should cover what can or can’t be done.
2. Internal Analysis should cover what we are able or unable to do.
3. VMOKraPI should cover what we want or not want to do.
Selective Process
It involves choosing from many strategies.
• Screen the strategic options against the VMOKraPI.
• Those that pass the screen will be developed into SPATRes.
What influences what?
VMOKRAPI is driven mostly by External Analysis and answers ‘What? On the other hand,
SPATRES is driven mostly by Internal Analysis and answers ‘How?’.
Three Rules
• Never use IA to determine Vision.
It is to avoid being short-sighted so as not to take advantage of the opportunities
around and misaddress the threats.
• Use IA to determine the near future Performance indicators but use EA to determine
the 3rd to 5th year Performances
There is a need to determine the opportunities and the threats.
• Use IA to determine the Human Resource and Financial Strategies

Page 87 of 132
Operations Strategies
• How to keep Quality consistent with what market wants
• How to improve quality
• How to ensure that delivery is on time
• How to improve productivity
Human Resource Strategy
• How to make people competent to perform tasks
• How to make people become the best they can be
• How to reward/punish people who live or violate culture set by the values
Financial Strategies
• How much money is needed to deliver the tasks
• Cash flow management better than Income statement management
• Asset Management
Marketing Strategies
• How to retain clients/customers
• How to get more from current clients/customers
• How to gain new clients/customers
Other Major Considerations
These are the new considerations in planning especially during the current adminsitration.
• Results Based Performance Management System
• Organizational Performance Indicators Framework
• Strategic Performance Management System (SPMS)
• Program to Institutionalize Meritocracy and Excellence in Human Resource
Management (PRIME-HRM)
Vision Setting
• A clear, measurable and challenging description of a desired future goal around which
an organization can direct its program of work
• An image of how we see our purpose upholding
• A picture of the preferred future we seek to create
• An answer to the question “What do we really want”
Qualities of a Vision
• It motivates and inspire.
• It is a stretch, move towards greatness.
• It is clear and concrete.
• It is achievable, not a fantasy.
• It fits with highest values.
• It is easy to communicate.
Vision and Mission
• Picture of the future
• Of our institution and of our stakeholders and clientele
Element
• Elements
Who are we?
Who we serve?

Page 88 of 132
What type of product and services we offer?
How do we make them available?
Return of Investment
Services and commitment
Definition of Mission
It is the organization’s driving purpose for existence usually specified in terms of mandates and
principal products and services, people it serves and key element of the organization’s
philosophy
Why is it important?
Defines what our organization means to us.
Distinguishes the organization from other organizations.
Serves as a framework for evaluating current and prospective activities.
Components
A description of the mandates of our organization
The organization’s key strengths
Broad strategies to be pursued in order to achieve the mission
The values the organization adheres to in pursuit of its mission
Definition of Values
Enduring standards of what is worthwhile, which serve to guide behavior in meeting
objectives, in dealing with the people the organization serves, colleagues and others.
Reflect the way the organization will achieve its mission
Can be a source of strength if consistent with strategies
Enduring beliefs that a specific mode of conduct of existence is personally or socially
preferable to an opposite.
If we want our farmers to become resilient and competitive during the ASEAN Integration, we
should identify the values that they need to have in the market. It may include discipline.

Page 89 of 132
Session 3: Approaches to Assessment of Impacts and Vulnerability
to Climate Change and Adaptation Options
Robert Sandoval Jr., Ph.D.
Climate Change and Food Security Specialist
Food and Agriculture Organization of the United Nations
Review of Terms
Risk is the probability of an event to occur and cause relative consequences.
Hazard is any event that has a potential to cause harm (to any sector).
Vulnerability was first defined by taking the formula used by engineers and scientists in
landslide modeling: Hazard (location/geography) x Risk Exposure – e.g. in terms of exposure,
lowland community is more prone to storm surge than upland; or in the same manner, the
upland is more prone to landslides as compared to coastal areas.
However, since impacts of climate change do not only affect the ecosystem but also
communities, a modern definition of vulnerability came out. It is now defined as exposure
(location or geography), and susceptibility. E.g. In the upland, an area with less vegetation is
more prone to landslides) and adaptive capacity (socio-economic side of the communities
like educational attainment, livelihood of people in a community, access to insurance, etc.).
Vulnerability is the susceptibility to be affected by any negative hazard or event.
Two Types of Assessment to Support Climate Change Adaptation
1. Climate Impact and Vulnerability Assessment
It is the assessment of key changes in climate, climate change impact on different sectors,
and vulnerability of livelihoods for strategic planning. This is not to be confused with
assessment of impact of adaptation interventions in project evaluation.
Two vulnerability frameworks
a. Outcome vulnerability – traditional concept in climate change work, top-down
approach
b. Contextual vulnerability – emerging concept in climate change work, bottom-up
approach, vulnerability of social-ecological systems is determined by multiple
factors and processes, climate change is treated as one of the threats.
Examples of Outputs
1. Top-Down Approach
It uses international to national level data which are analyzed using computer models so
that these could be applicable in the grassroots/community level.
E.g. Local climate models with the integration of PAGASA’s climate observations that are
computed and then placed in maps, and Historical Rainfall Reconstruction
2. Bottom-up Approach
It means from the ground or from community/LGU level to higher levels that use
participatory methods. E.g. Hazard maps and cropping calendars

Page 90 of 132
Designing climate impact and vulnerability assessment
Literature review
Identification of stakeholders
Assessment of information needs of stakeholders
Design of assessments, including agreement of adaptation objectives by
stakeholders
Adaptation goals
There are different views on how to define “adaptation’ to climate change (e.g DRR
and CCA links)
There is a need to define adaptation goals with the wide participation of different
stakeholders.
Questions to ask when designing assessment
1. What is the target sector?
2. What is the temporal scale? The next 3 years? Next 10 years?
3. What is the spatial extent? Regional, provincial, local community or household?
4. What is the spatial resolution? Meters, kolometers, hundreds of kilometers,
individuals, households, community, farm or watershed?
2. Climate Change Adaptation Options Assessment
It is the assessment of different options’ effectiveness to achieve adaptation to identify
best options.
It builds on climate impact and vulnerability assessment.
It examines the extent to which different adaptation measures may achieve the
adaptation options.
It is done during the implementation of programs/projects. Good practice options
should not only end in just mere implementation but is important to monitor these.
Two approaches for climate change adaptation options field-testing and assessments
1. Participatory Action Research
a. Identification of Options
b. Validation, prioritization and selection
c. Procurement and demo site establishment
d. Seasonal implementation and monitoring
e. End of season assessment
*Local Working Groups - technical training and advice, monitoring and evaluation,
lesson learning, and knowledge management
Considerations for launching community-based adaptation and disaster reduction
processes:
a. Collate local, introduced and improved adaptation options.
b. Synthesize into potentially suitable adaptation options for location specific
conditions.
c. Scientific validation of adaptation options
d. Local prioritization/selection of adaptation options for field testing
e. Field-testing; Monitoring and evaluation

Page 91 of 132
2. Climate-Smart Farmer Field Schools
Considerations:
a. Impacts of climate change on agriculture
b. Food insecurity vulnerability analysis at household level
c. Livelihood adaptation to climate change
d. Institutional analysis and awareness raising
Climate-Smart Farmer Field Schools (FSS) Integration Framework
Climate Field School
(Dumangas/Irosin Model
by RWAN and PAGASA)
Farmer Field School
(PalayCheck by PhilRice and ATI)
• Climate, Pest and Crop Growth and Development
• Cropping Systems and Climate –Related Risks
• Observation of Weather and Climate Parameters
• Weather and Climate Information Products and Sources (Temperature, Rainfall, Evaporation Rate, Humidity)
• Forecast Generation, Climate Forecast Interpretation, Translation and Communication
• Incorporating Climate Forecast in Decision Making
• Use high quality seeds of a recommended variety.
• No high and low soil spots after final levelling
• Practiced synchronous planting after a fallow period.
• Sufficient nutrients from tillering to early panicle initiation and flowering stages.
• Avoided excessive water or drought stress that could affect the growth and yield of the crop.
• No significant yield loss due to pests • Cut and threshed the crop at the right
time.
• Topics and information on climate/weather outlooks, forecast, farm advisory,
parameters and others are discussed every meeting in addition to key check systems.
• Documented good practice options/adaptation strategies are introduced to participants for adoption/ testing
• Focused on increasing farm productivity, reducing losses from climate related risks/hazards and minimizing food insecurity

Page 92 of 132
Session 4: Integrating Cross-cutting Concerns: Gender
Lourdes – Rafaelita O. Panga
GAD Focal Person and Guidance Counselor
Central Bicol State University of Agriculture
Sex vs. Gender
Sex
• Biological differences between men and women
• Determined at birth and is universal
Gender
• Socio-cultural construct
• Refers to roles, attitudes & values assigned by culture and society to women and men
Gender Socialization
This is the process by which norms and expectations in relation to gender are learned by women
and men.
Ruth Hartley on Gender Socialization
1. Manipulation – people handle girls and boys differently as infants.
E.g. boy babies are tossed in the air; girl babies get more delicate handling
2. Canalization – means that people direct children’s attention to gender-appropriate
objects.
3. Verbal appellation – telling children what they are and what is expected of them.
• Brave boy, pretty girl
• Boys don’t cry, girls don’t hit playmates
4. Activity exposure – familiarizing children to their gender-appropriate tasks
• Girls help their mother with housework.
• Boys are encouraged to play outside the house.
Historical Experience of Women
• During pre-colonial times – high regard for women (engaged in trade, village chiefs,
healers & high priestesses)
• Spanish times- emphasized the domestic value of women
• American era – introduced universal education social reforms
• Today – high level of education and relative independence in combining work and family

Page 93 of 132
Filipino Women and Men’s Education
Source: 2008 Functional Literacy, Education and Mass Media Survey (FLEMMS)

Page 94 of 132
Gender Bias
It is a form of prejudgment, bias or limitation given to roles and expectations of males and
females.
Gender Bias against Men
• Inherently aggressive and violent
• Don’t feel pain or incapable of experiencing human emotions
• Inherently expressive in their sexuality
• Don’t need closeness, reassurance, and attention
Gender Stereotyping
• Women are weak, dependent, subordinate, indecisive, emotional and submissive.
• Men, on the other hand, are strong, independent, powerful, dominant, decisive and
logical.
Gender Stereotype in Social Roles
• Men provide financially for the family, works as managers, construction builders,
engineers, and portrayed as leaders.
• Women takes care of the house and children, works as nurse, teacher, secretary, and
portrayed as followers
Gender Stereotype in Capacities
• Men are good in Math and Science, physically strong and firm decision-makers.
• Women are good in arts and less intellectual pursuits, physically weaker and fragile
and wishy-washy or fickle minded in decision-making.
Marginalization
It happens when women are being considered a nonessential force in the economy despite their
crucial role in production. Their contributions to development remain unrecognized or
undervalued.
Subordination
This is submission, sometimes due to force or violence, or being under the authority of one sex.
Double Burden
A situation referring to the heavy workload of women and the many, overlapping tasks involved,
which if computed in terms of hours would total more than 24 hours.
Discrimination
This is the practice, policy or procedure that denies equal treatment and status to women on
the basis of being female.
Women lack voice in relevant decision-making and planning activities; hence, the need to
empower, pursue equal opportunities for women and men and ensure equal access to
Page 95 of 132
resources and development results, and abolish unequal structures and practices that
perpetuate discrimination and gender inequality.
Not withstanding their major contributions to and potential influence on the country’s economic
and social progress, Women have remained largely disadvantaged are still poor, have less access
to or control over resources, suffer from gender-based violence, and enjoy less political power
than their male counterparts.
Gender and Development (GAD)
Not a war between sexes
Not anti-male
Both women and men are victims although there are more women victims than men
Both men and women have a stake in the struggle
Fairness and equity demand that everyone in society, whether male of female, has the right to
the same opportunities to achieve a full and satisfying life.
Gender Mainstreaming
This incorporates women and men’s issues, needs and interests into the organization’s decision-
making process, policies, structures, processes/systems, practices, plans, programs, projects,
activities to attain the vision of gender equality and women empowerment.
International Mandates
The United Conventions on the Elimination of All Forms of Discrimination against
Women (UN-CEDAW) which promotes equality in all fields, affirmative action for
women and protection of women from violence.
The Beijing Platform for Action (PFA) of the Fourth World Conference on Women
(FWCF) which calls for actions on 12 areas of concern affecting women.
Commitments made in the following global meetings: UN Conference on Women,
International Conference on Population and Development, the World Summit for
Social Development and the Habitat Conference.
National Mandates
Sec. 14, Art. II of the Philippine Constitution: “the State recognizes the role of women
in nation building and shall ensure the fundamental equality before the law of women
and men.”
RA 7192 - Women in Development and Nation Building Act: promotes the integration
of women as full and equal partners of men in development and nation building.
Sec. 28 of the GAA, 1995 – 2000: directs government entities to formulate a GAD plan,
the cost of which shall not be less than five percent of their yearly budget (GAD
Budget)
EO 273: directs all government agencies and local levels to “institutionalize GAD
efforts in government by incorporating GAD concerns in their planning, programming
and budgeting processes.
RA 9710 Magna Carta of Women: …shall endeavor to develop plans, policies,
programs, measures and mechanisms address discrimination and inequality in the
economic, political, social and cultural life of women and men.

Page 96 of 132
Disaster does not discriminate children, women and men. High risk group
includes people with disabilities, people with chronic diseases and the elderly.
Involve them in the design and implementation of DRR and CCA in Agriculture.
Gender mainstreaming starts with capacity development is primarily aimed at addressing
gender issues.
Capacity – the combination of all the strengths, attributes and resources available within a
community, society or organization that can be used to achieve agreed goals (UNISDR).
Capacity Development – the process through which individuals, organizations and societies
obtain, strengthen and maintain the capabilities to set and achieve their own development
objectives over time (UNDP).
Gender Issues and Gender Gaps
Where gender division of labor brings with it inequalities in amount of work inputs
or benefits received
Where women and men face different opportunities to access, participate in, and
control resources and benefits
Where women and men are conceived or thought of as different and, thus, unequal
Where there is systemic or structural bias, resulting in differential treatment (e.g.,
valuation/reward, access) given to individuals on the basis of their gender
Levels of Gender Equality and Women’s Empowerment
Level Concern or Issue
Control Inequality in power relations so that increased women’s access or productivity may not translate to improved welfare of women
Participation Inequality in involvement of women and men in bodies that make decisions or policies affecting them; treatment of women solely as passive beneficiaries
Conscientization Notional or belief gap re the nature of gender differences and relations
Access Gender gap in the amount and quality of resources women and men can have access to
Welfare Inequality in the material and physical well-being of women and men
Resources
economic or productive resources such as land, cash and credit, employable or
income-earning skills;
political resources such as representative organizations, leadership, education and
information, public sphere experience, self-confidence and credibility; and
time.
Benefits
provision of basic needs such as food, clothing, shelter, and income;
asset ownership such as land and personal skills;
education and training; and
political power, prestige, status, and opportunities to pursue new interests.

Page 97 of 132
Gender Roles Before, During and After Disaster

Page 98 of 132
Matrix of Women’s Role in Disaster Management (Rashid and Al Shafie, 2009)
Agriculture,
Fisheries and Forestry

Page 99 of 132
Environment, Biodiversity, Climate Change and Disaster Risk Reduction

Page 100 of 132
DRR and CCA is everyone’s business. "The more governments, UN agencies, organizations,
businesses and civil society understand risk and vulnerability, the better equipped they will be to
mitigate disasters when they strike and save more lives“--- Ban Ki-Moon, UN Secretary-General
Session 5: Implementing Community-based Early Warning System
for Agriculture
Page 101 of 132
Lorenzo L. Alvina
Technical Staff, ORED
Department of Agriculture RFO – V
Agriculture and fishery profile have different hazards, among these hazards, the most
devastating are related to the lack or abundance of water (hydro metrological hazards).
The DOST agency involved in hydro meteorological hazard is PAG-ASA while Biological man-
made patheogeophysical hazards that are leaning to Disaster Risk Reduction is PHIVOLCS. Bicol
has all kinds of hazards—volcanoes, earthquakes, storms, etc.
The rock sitting on a mountain slope may be considered a hazard. When it falls and injures
people, it becomes a disaster.
In Agriculture, when talking about climate change, Early Warning System (EWS) is used in
preparedness and adaptation
Benefits of Early Warning System (EWS) in Agriculture
There are many kinds of EWS—daily, seasonal, and weather forecasts 30—40 years from now.
Forecasting what could happen in the future through modeling is Climate Change Adaptation.
Definitely, the importance of knowing what could happen is a good factor in decision-making.
Other factors in farmer decision-making include inputs (seeds, etc.) and labor. Usually money is
the factor that affects the farmer’s decisions. A farmer needs money to buy seeds and fertilizer,
to pay labor.
The service provided to the farmers thorough EWS is very important although there are other
factors that affect their decision making. If the farmers know that the rainy season will be
delayed, they will also delay planting and loaning.
These are the benefits ng EWS:
1. If tomorrow is cloudy with scattered rain shower, farmers are warned not to undertake
2. If rainfall next month is below normal, farmers will look for alternative sources of water
next month
3. On set of rainy season will start in late November, farmers will prepare seeds in early
November
4. El Niño to occur on the last quarter of the year, so this is what we are talking about,
because the government has slow (4:14) and budgeting appropriation we need to know
the probability that el nino is going to happen earlier, at least we will be prepared
Several sources of information for weather bulletins/advisories: radio, newspaper, television,
internet. Where to get information is not a problem, the problem is whether it reaches the
farmers. The problem is the medium. There is an issue on how to translate or “agriculturalize”
the information for free for the farmers. It is part of our role.
E.g.: PAG-ASA (contains weather situation and weather outlook)

Page 102 of 132
E.g.: SLPRSD – PAGASA
E.g.: DA RFO-V

Page 103 of 132
E.g.: Uganda
E.g. Project NOAH

Page 104 of 132
E.g. Automatic Weather Station
Farmers are not interested on what will happen 30 years from now, they are more concerned
with what will happen tomorrow, and the next three days, and maybe the farthest that they
would be thinking of is whether the dry season or wet season will come sooner or later than
expected.
Our goal here is to develop our capacities at the local level how to interpret. We are not going to
be forecasters but at least have an appreciation, understanding, and inclination not just/only
related to agriculture but at least with risk management.

Page 105 of 132
The normal rain fall of each province is different if it says that the rainfall in Masbate from
February to March is above normal, it does not mean that it will flood there. It means that it is
raining. The same case when we are talking about Sorsogon, it is naturally rainy in Sorsogon,
December—more than 500 ml. When we say it is below normal in Sorsogon, it is still rainy. It
depends on the actual/average rainfall of each province. So, be careful on the terminologies
above normal and below normal.
Page 106 of 132
MODULE IV
Participatory Monitoring and Evaluation
for Disaster Risk Reduaction and Climate Change Adaptation
in Agriculture
Participatory monitoring and evaluation for DRR and CCA in agriculture is both a
tracking/documenting tool that evaluates results and a learning process that draws lessons on
institutional and policy process. It is done in order to determine if a particular option should be
prioritized or replicated. This module covers what are to be considered in the monitoring and
evaluation process and how are data gathered if M&E is conducted with relevant actors in the
community.
Objectives
At the end of the module, the learner should be able to:
1. Describe the scope, purposes, frameworks and concepts of participatory M&E
2. Demonstrate how baselines are defined and measured
3. Enumerate criteria and indicators
4. Discuss data gathering methods
5. Frame contributions to resilience
6. Discuss externalities and ancillary impacts
Methodology
Lecture – discussion

Page 107 of 132
Session 1: Concepts in Participatory Monitoring and Evaluation for
Disaster Risk Reduction and Climate Change Adaptation in Agriculture
Arthur Estrella, Ph.D.
Director for Research
Central Bicol State University of Agriculture
Vladimir R. Foronda
Director, Information and Communication Technology
Central Bicol State University of Agriculture
Goal of Participatory Monitoring and Evaluation
The goal of participatory monitoring and evaluation is to develop a resilient farming villages by
reducing the vulnerability of people and their respective community to hazards by improving
their capacity to anticipate, cope with and recover from the socio-economic impacts of disaster.
Monitoring and Evaluation
Monitoring is a continuing function that aims primarily to provide the management and main
stakeholders of an ongoing intervention with early indications of progress, or achievement of
results. Meanwhile, evaluation is “an assessment, as systematic and objective as possible, of
completed project or policy, its design, implementation and results (Outputs and Outcomes)”.
Inputs Activities Outputs Outcomes Impact
• The financial, human, and material resources used for the development intervention.
• Technical Expertise
• Equipment • Funds
• Actions taken or work performed.
• Training workshops conducted
• The products, capital goods, and services that result from a development intervention.
• Number of people trained
• Number of workshops conducted
• The likely or achieved short-term and medium-term effects or changes of an intervention’s outputs.
• Increased skills • New
employment opportunities
• The long-term consequences of the program – may be positive and negative effects.
• Improved standard of living (Contribution to the Society)
Criteria Used for Evaluation and Monitoring
• Relevance – Do the objectives and goals match the problems or needs that are being
addressed?
• Efficiency – Is the project delivered in a timely and cost-effective manner?
• Effectiveness – To what extent does the intervention achieve its objectives? What are
the supportive factors and obstacles encountered during the implementation?
• Impact – What happened as a result of the project? This may include intended and
unintended positive and negative effects.
• Sustainability – Are there lasting benefits after the intervention is completed?

Page 108 of 132
Value of Doing Monitoring and Evaluation
• Determine how a project or program progressed
• Improve future policy, programs and projects through feedback of lessons learned
• Seek to learn lessons from their work and incorporate them into policy and practice
• Organizational learning (through evaluation) is a prerequisite for knowledge transfer
between agencies
• Means of retaining and building institutional memory (contribution to the society)
Components of Evaluation in DRR Initiatives
Steps in Evaluating Disaster Risk Reduction Initiatives

Page 109 of 132
Critical Factors for a Successful Momitoring and Evaluation in Disaster Risk Reduction
• Realistic and practical planning, with clear aims and objectives.
• Adequate resources (time, personnel and budget) allocated to M&E in project planning.
• Use of a mix of data collection methods that are appropriate to the project and the aims
of the evaluation.
• Involvement of key stakeholders, especially beneficiaries, in evaluation – as genuine
participants in the process, not merely providers of information.
• Identification and selection of relevant indicators, which demonstrate impact as well as
cause–effect relationships between project processes (activities and outputs), outcomes
and impact.
• Recognition that project benefits may not be shared equally; identification of impacts
on different sections of the community.
• Application of lessons learned to improve practice and project or institutional policies.
• Sharing of findings with other stakeholders.
Selecting Indicators for Monitoring and Evaluation
• Indicators are objective ways of demonstrating that progress is being made. Indicators
can be quantitative or qualitative.
• Selection of appropriate indicators is central to project design and evaluation. They can
be used to assess progress and outputs or outcomes and impact, relating to the
project’s aims and objectives.
Sample of Results-based Framework for Disaster Risk Reduction
Program Goal– Reduced national disaster vulnerability of urban populations, infrastructure,
lifeline facilities and shelter in Asia; (Asian Urban Disaster Mitigation Program)
Program Objectives – Establishment of sustainable public and private sector mechanisms for
disaster mitigation in Asia;
Indicators:
• 1 Number of operational plans developed with resources identified by national
collaborating institutions to carry out mitigation measures after demonstration activities
end;
• 2 Number of replications or adaptations of mitigation skills and procedures promoted in
AUDMP demonstration activities by other organizations, communities or countries in
Asia;
• 3 Amount of investment from non-AUDMP funding sources attracted by program and
demonstration activities; and
• 4 Number of households potentially benefiting from AUDMP-sponsored activities to
reduce disaster vulnerability.
Result No. 1 – Improved capacity of municipal officials to manage risk and apply mitigation skills
and technologies
Indicators
1.1 Number of new or improved assessment methods and guidelines/standards used for
public and private sector development

Page 110 of 132
1.2 Number of emergency preparedness and response plans written or revised to reflect
improved information on hazards and vulnerability
Result No. 2 – Improved access to hazard mitigation information and skills (e.g., techniques,
methodologies, experience) throughout the region
Indicators
2.1 Percent of public and private sector professionals with AUDMP-initiated disaster
mitigation training who are employed and using knowledge gained in fields impacting
disaster management or urban development
2.2 Number of institutions where AUDMP initiated training and professional development
course modules are institutionalized
2.3 Level of participation in the AUDMP regional information and contact network
Result No. 3 – Improved policy environment for disaster mitigation
Indicators
3.1 Number of policies established or revised to facilitate action, regulation, enforcement
and/or incentives
Data Collection Methods for DRR Evaluation
Formal surveys of beneficiaries and other stakeholders
Survey of builders and occupants of hazard-resistant housing to ascertain application of
skills and increased security
Household survey on food production, availability, concumption and marketing to
identify patterns and shifts in vulberability
Structures and semi-structured interviews with staff, partners, beneficiaries and other
stakeholders
Individual stakeholder interviews building-up picture of level of understanding of the
project, agency – community working relationships, effectiveness of coordination
mechanisms and outcomes of DRR interventions
Group discussion with stakeholders, especially beneficiary communities (e.g. participatory
workshops, focus groups)
Beneficiary workshop to identify and assess benefits to particular DRR interventions and
unforeseen impacts
Expert workshop to assess potential effectiveness of new DRR methods or approaches
Feedback workshop with beneficiaries and other stakeholders to test/confirm
evaluation findings
Rapid assessments
Post-disaster telephone or field survey to indicate effectiveness of warning and
response mechanisms and factors affecting them
Direct observation and visual survey
Visual surveying of structural mitigation measures to determine quality of design and
workmanship, take-up of technologies or techniques – disaster resilience inferred from
this or assessed through post-diaster surveys

Page 111 of 132
Observation of coping strategies and other risk-reducing behavior – before, during and
after disasters
Case studies
Personal or group accounts of use of skills, materials and organizational capacity
acquired from disaster management training courses during subsequent events
Simulations
Group simulation or exercises (table-top or field) or disaster management activities or
responses to disaster events, to test plans, skills, equipment, etc.
Documentary evidence
Content analysis of educational material on risk reduction and management produced
by project
Quantitative and qualitative data about project delivery, effectiveness, impact and cost,
from project documentation
Secondary data collection to complement or validate information collected by the
evaluators in the field
Participatory Mode and Other Approaches
• Adoption of a participatory approach does not prohibit the use of more formal,
extractive data collection methods such as secondary data, project documentation,
questionnaire surveys and formal interviewing.
• These can complement information gathered through participatory processes or help to
validate it.
• Each method should be selected according to its value in helping to understand the
project’s impact.

Page 112 of 132
Session 2: Considerations for Assessment, Monitoring, and Evaluation
for Results – based Adaptation Planning
Robert Sandoval Jr., Ph.D.
Climate Change and Food Security Specialist
Food and Agriculture Organization of the United Nations
Assessment, monitoring and evaluation are integral parts of climate change adaptation planning
and implementation. They are also crucial for learning and for conducting policy reviews.
Monitoring and Evaluation activities set baselines, define indicators, measure progress and
evaluation successes and setbacks in adaptation interventions
Overview of the Planning, Monitoring, and Evaluation in Learning Cycle
Conceptualization—risk and hazard assessment
Preparation and appraisal
o Identifying contribution to adaptation—increasing adapting capacity, training,
providing alternative income/livelihood, linking to insurance; or, inputs to good
practice options (training + fertilizers/multi-stress tolerant varieties); or, long
term sustainability in a long term change, training after two years for additional
skills to diversify farming systems. what we can do with the limited resources
o Forming an adaptation hypothesis in theory of change—outlining possible good
practice options, expected benefits, changes, and expected benefits, outcomes
and incomes
o Developing adaptation associated indicators—if we know our good practice
options we can make excellent indicators physical, inputs.
o Developing results based management— We should also consider the number
of females/males, were the farmers able to follow instructions in applying
fertilizers, what are the application methods of the fertilizers, etc. we should
always focus on the results not only table of activities, financial breakdowns,
and number of trained
o Carrying our appraisal—while finalizing, we should review the design, and
feasibilities, efficiency, and safeguards. They should not cause additional
problems
Implementation of adaptation actions
Evaluation
Learning as an Important and Continuous Process in Monitoring and Evaluation
Promotion of participatory planning methods
We get data from lessons learned
Learning helps build a sense of ownership
Because of the uncertainties of climate change feedback is important from learning
because it helps in adaptation management. If there is an uncertainty and our approach
is participatory, we have feedbacks and learning that we can use to easily adjust the
good practices
To adjust in line to hazard and new risks

Page 113 of 132
Challenges Particular to Climate Change Impacts and Adaptation Assessment,
Monitoring and Evaluation
1. Definition and goals—what will we call the CSFFS, climate resilient, climate proof, etc.
2. Multicultural issues and engagement to stakeholders—internal dynamics in the
community, political dynamics, support from NGOs, LGUs
3. Scales, axillary and facts—unintended defects
Negative externality—ex. Misunderstanding between farmers regarding the water.
Those downstream cannot access water because of the misunderstanding. There
are those suffering from other peoples’ actions. E.g. You give too many seeds and
too much fertilizer
Positive externality—if the farming communities upstream are organized, and those
downstream can access water. Others benefit from your actions
Time scale—timing of monitoring and evaluation
E.g. How are you going to evaluate an agroforestry good option if you planted
coffee and you can evaluate it after you can harvest in 3 years compared to
vegetable and rice production. Leading indicator: sapling survival rate. Medium
term, long term vs. immediate
Evaluating CCA and DRR option without relying on the yield performance/income:
o Technological suitability
o Agriculturally/ecologically sound
o Environmental profits
o Socio-cultural, economic acceptability
4. Availability of data and information
Be careful with data overload (e.g. too much information with too little useful
analysis); maximize use of existing systems;
o E.g. using existing data from other activities for M&E, AESA FFS results to be
used as indicators
o E.g. Dealing with climatic/weather data availability issues
5. Working with uncertainties
Uncertainty is to be managed—understand the nature of the uncertainty and
resulting limitations
Take account of uncertainties and be flexible in planning adaptation strategies that
withstand unpredictable futures in a robust way (e.g. by complementing it with
robust bottom-up assessments and no-regrets options)
Assumptions and their sensitivities should be explicitly stated and communicated
E.g. GCM choice and downscaling methodology; just two seasons of CCA testing
versus more seasons, etc.
6. Attribution difficulty
(Up to what degree is it possible to attribute results to a project intervention rather than
to other external causes?)
E.g.: i) is the increased adoption of CSA forestry practices a direct result of the project or
intervention, or is it influenced by a larger programme or other external activities? ii) is
the decrease in the number of people living below the poverty line may be due to
migration or wider economic forces?
Can be addressed through robust sampling when setting baselines and use of
control areas (e.g. not covered by other projects, etc.)
7. Inadequate capacity for assessment and monitoring and evaluation
8. Practicality of Methods and Tools

Page 114 of 132
MODULE V
Climate –Smart Agriculture and Good Practice Options
In Module 1, it was established that the goal of food and nutrition security is to ensure stability
in the availability, access and utilization of food. At both global and local levels, this means that
quality and diverse food should be available and accessible to everyone and anywhere physically
and economically. However, even if this is attained at present, its future may be not be secured
given the present consumption pattern and population growth of people and the direct and
indirect impacts of climate change to agricultural food production.
It is also a fact that while agriculture is one of the sectors vulnerable to climate change; it is also
significantly contributing to the emission of greenhouse gases from land use/ conversion and
production inputs (fertilizer, energy, and livestock).
Hence, integrated systems and sustainable intensification and resource efficiency in agricultural
production is needed. Climate-smart agriculture as an approach enables this while attaining
sustainable agricultural development under climate change.
Objectives
At the end of the module, the learner should be able to:
1. Explain the concept of climate-smart agriculture
2. Discuss improved technologies and approaches in crop production, forestry and
fisheries
3. Describe institutional support needed for climate-smart agriculture
Methodology
Lecture – discussion

Page 115 of 132
Session 1: Introduction to Climate-Smart Agriculture
and Good Practice Options
Robert Sandoval Jr., Ph.D.
Climate Change and Food Security Specialist
Food and Agriculture Organization of the United Nations
Edgardo B. de la Torre
Field Extension Worker
Freelance Consultant
Climate—Smart Agriculture is just an application of the concepts learned and discussed and its
applications on good practice options that is needed to be identified in the farming bulletin,
mitigation plan and the drafting of the DRRM plans. Because there are so many efforts regarding
adaptation to climate change, there are many organizations involved, there are also many
concepts or branding of approaches toward climate change adaptation that are being brought
out.
For example, FAO promotes climate—smart agriculture but one of its division also promotes the
save – and – grow concept. When analyzed, both have the same purpose—the efficiency of use
of resources, the use of stress tolerant varieties, etc. The only difference is the terminology.
The term “climate—smart” does not literally want to outsmart the climate. Climate—smart is
used because we want to consider the climate in such a way that we change our practices to
address the uncertainties of climate change.
Climate—Smart Agriculture, as proposed by FAO is agriculture that sustainably increases
productivity, resilience; reduces or removes greenhouse gases and enhances achievement of
national food security and development goals.
When we evaluate the key words, we find out that “increases productivity” means increase in
productivity given the uncertainties of climate variability and climate change. We already talked
about resilience earlier.
“Reduces or removes greenhouse gases” in the context of agriculture in developing countries is
not that much of a requirement. There might be a practice wherein one could help in the
reduction of greenhouse gases such as minimum tillage, the productivity of the farm might be
jeopardized or compromised. The context of the phrase is to promote practices that can
produce co—mitigation benefits. Mitigation is not the real focus but it is better if there are good
practice options that can be taught to the farmer, which is not costly and won’t compromise
his/her productivity but can reduce greenhouse gas contributions. Some international agencies
call this the pro—poor mitigation/mitigation co-benefits (help the farmer use practices that can
reduce greenhouse gas emissions, but we won’t push them too hard or not cause them to be
poorer).
Simply, there are four major components or concepts underlying Climate—Smart Agriculture
based on the concept of promoting synergy. These are as follos:
1. Adaption of sustainable crop verieties – experimenting and testing other varieties and
crops that can be planted
2. Farming system adjustment – improving trainings

Page 116 of 132
3. Crop diversification – diversifying agriculture systems at par with risks (when you
diversify, you spread the risk). You have a high risk because you only plant rice, but when
you have other crops; your risks are being spread out. If you are going to have a failure
with rice, you have other crops that you can depend on. You are not only dependent on
one. Inter-cropping is the underlying principle of spreading the risk. If you are going to be
hit by a hazard, the negative impact will be lessened because of diversification.
4. Diversifying agriculture systems—the other models used in diversifying agriculture
systems is the rice and corn, apiculture, homestead gardening, among others.
The basic premise of Climate—Smart agriculture is its formalized definition. There are already
many practices that are being done in the field that already adhere to the principles of climate—
smart agriculture. Having this label facilitates easy communication and increase the
acknowledgement to the fact that the agriculture sector is doing something.
Identified Portfolio of Upland Good Practices Options against Strong Wind, Typhoon,
Continuous Rain, Flash Flood and Drought
1. Strip cropping
2. Mixed cropping
3. Small farm reservoir (SFR)
4. Wide row spacing for rainfall multiplication
5. Tillage practices (zero and minimum tillage)
6. Coconut leaf pruning
7. Sloping Agricultural Land Technology (SALT - 1)
8. Vetiver grass technology
9. Alley cropping
Identified Portfolio of Lowland Irrigated Good Practices Options against Floods/Flashflood,
Typhoon and Saline Intrusion
1. Early - Maturing Rice Varieties
2. Submergence Rice variety (NSIC Rc-194)
3. Salt - tolerant Rice variety (NSIC Rc-108)
4. Timing of planting/Ratoon
5. Rice + Duck Farming Systems
6. Rice + fish farm system
7. Synchronized planting/controlled irrigation
8. Floating garden

Page 117 of 132
Session 2: Sustainable and Organic Agriculture Systems
for Climate-Smart Agriculture
Carmelita N. Cervantes, Ph.D.
Assistant Professor IV
Central Bicol State University of Agriculture
The Philippine Sustainable Agriculture Coalition (PhilSAC), the UPLB Sustainable Agriculture R &
D Committee and CBCP-NASSA SA Network defines sustainable agriculture as a philosophy,
system, method, technique and technology of production that makes agriculture ecologically
sound, economically viable, socially just and humane, culturally appropriate and grounded on
holistic and natural science.
Ecological Principles in Farming
Diversity is the Law of Nature – Nature consistently integrates plants, animals,
microorganisms into a diverse landscape. Conversion from simple monoculture to a
higher level of diversity
Keep the soil covered, all the time – Under natural conditions, the soil remains covered
with living and non-living plant materials that prevents and moderates temperature
extremes, increases water penetration and storage, and enhances soil aeration and to
protect the living soil.
Stir, not invert the soil –The top soil layers contains most of the soil organic matter and
a broad diversity of soil organisms. Deep plowing and turning over of the soil using a
moldboard plow will cause considerable damage to the soil and disrupts the natural soil
ecology.
Recycle and utilize available local resources – Through decades of promotion and over
reliance on chemical fertilizers, many farmers have taken for granted locally available
resources that could be used for production.
Recycle and utilize available local resources – Through decades of promotion and over
reliance on chemical fertilizers, many farmers have taken for granted locally available
resources that could be used for production
Lessons Learned from Organic Farming Communities
Communities and farming families have:
1. High dependence on external production system;
2. Low cropping diversity and livelihood mix;
3. Poor access to financial and technical support; and
4. Poor resiliency against stresses.
The System of Rice Intensification (SRI) Success Story
The SRI is a good practice option that is characterized by planting of early with 1 seedling per
hill, a wider spacing of 25 cm x 25 cm and more. Intermittent flooding is flooding is practiced
including rotary weeding and organic fertilization. One of the success stories is that of Sumant
Kumar of India who harvested a total of 448 cavan/ha. In the Philippines, the highest recorded
yield is 336 cavan/ha. The average yield under Bicol region condition is 105 cavan/ha.

Page 118 of 132
Session 3: Developing Sustainable and Inclusive Food Value Chains
Hanilyn A. Hidalgo
Director, OSAS
Central Bicol State University of Agriculture
Value in business is opportunity that allows consumers to enjoy choices, convenience, comfort,
and sophisticated products and service.
Value Chain
Value chain is value is added to preliminary products through combination of other resources.
Hence, as the product passes through several stages of the value chain, the value of the product
increases.
Value Chain Process
Value Chain Development (VCD)
The value chain development (VCD) is all about making the consumer/customer at the end of
the chain happy. It is all about improving cooperation and coordination along the chain. The
question is what can local stakeholders do, to make their sector more competitive and integrate
it into value chains and market? The consumer is king! The market has very specific
requirements that are often not known to local stakeholders. Compliance with market
requirements and demand conditions is an important precondition for local enterprises and
sectors to successfully integrate themselves into markets and become more competitive.
The aim of VDC is to find out market requirements, compliance of local business stakeholders,
reason of compliance, and how do they meet these requirements. The local VCD also aims to
put the local sector in a better position compared to competitors. These competitors often
would be located in different regions in the same country.
Five Triggers of Value Chain Development
These are system efficiency, product quality and specifications, product differentiation
(competition), social and environmental standards, and enabling business environment.

Page 119 of 132
Session 4: Climate-Smart Forestry
Aries O. Ativo
Instructor
Central Bicol State University of Agriculture
Synergies of Agriculture and Forests
The forest is composed of both timber products and non-timber products. It is the home of rich
fauna and most indigenous peoples. However, as a resource base, it is being pressured by the
following activities: clearing vast tracks of forest lands for agricultural purposes, timber
poaching, resource extraction, and upland migration.
Deforestation is the largest contribution of agriculture to climate change. Thus, agriculture must
be managed not to be just to be Climate-Smart but also to be Forest-Smart as well. Food
security must reconcile with environmental conservation. This is when the role of forest in the
agricultural sector must not go unnoticed.
What Must Be Done
1. Stop forest conversion
2. Engage in watershed management
3. Promote the landscape approach which focuses not just on the productive capacity of
the forest but also look into its protective capability.
4. Involvement and empowerment of indigenous peoples and other migrants

Page 120 of 132
MODULE VI
Communicating Climate Change Smartly
Knowledge is power but in communication, that power is only realized if the knowledge is
appropriate and if it benefits the intended user. This is especially so in communicating climate
change. While the popular call is to popularize or ‘laymanize’ its concepts, it still demands for
precision. One minor mistake and it can create misdirection. During extreme weather events like
typhoons, weather forecasts disseminated through the media are important in warning the
public about impending threats. Farm weather forecasts and fishing advisories if shared widely
and appropriately can help prevent losses thereby protecting income. As planners and
implementers, it is important to talk about climate change confidently and to put across its
concept with clarity and simplicity without necessarily sacrificing information integrity.
This module covers topics that would provide the learner practical tips in communicating
climate change and its jargon, strategies for effective advocacy and risk communication.
Objectives At the end of the module, the learner should be able to:
1. Identify and address information and knowledge gaps among farmers
2. Discuss advocacy strategies
3. Describe risk communication
4. Demonstrate techniques and methods in translation and popularization
Methodology
Lecture – discussion

Page 121 of 132
Session 1: Risk Communication
Frannie A. Belarmino
Instructor/Public Information Officer
Central Bicol State University of Agriculture
One of the most important lessons after typhoon “Yolanda” was how the word “storm surge”
was understood by the people. It clearly points to the importance of communication by first
understanding the language being used. This may start by the proper yet simple presentation of
advisories such as this color-coded advisory from PAGASA.
Lessons Learned
(Based on previously experienced disaster)
1. Poor Communications – there were no alternative failsafe systems (e.g. radio, with links
to local authorities in primary cities and towns) and there were no backup power
systems.
2. Public was not adequately prepared – there were no plans for worst case scenarios.
3. Poor education on hazard information and Early Warning System (EWS) – people,
particularly local leaders and those in rural areas, have yet to be properly educated
about hazards, risks and vulnerabilities.
4. Lack of clarity and timeliness – information dissemination, its clarification, and call to
swift action especially at the local levels, could be done better.
5. Slow availability and accessibility of information – quick access to information about
hazards, risks, and disasters remains to be a huge challenge. Hazard information may be
available from PAG-ASA , NDRMC, DSWD, Manila Observatory, Rappler.com, social
network sites such as Twitter, Facebook, however, bringing the information to
communities-at-risk , especially those in rural areas, is a serious concern because of
limited internet connectivity and electric power failure. Availability, accessibility and
understandability of information to all stakeholders remain to be issues of concern.

Page 122 of 132
Risk Communication
Risk communication is the process of exchanging information among interested parties about
the nature, magnitude, significance, or control of a risk. It can be understood to mean, a process
of exchanging and sharing information about climate-related risks between various knowledge
holders and decision-makers and the public. It is seen as the cross between managing
information and managing meaning during all three stages of prevention, response, and post-
crisis learning (Coombs, 2010).
Risk Communication vs. Crisis Communication
Risk communication focuses is on on developing and conveying messages prior to and during an
event. On the other hand, crisis communication focuses on doing so post-event. A crisis is a
specific incident with a short time frame, while a risk is often more nebulous and evolves over
time. Risk communication tends to utilize messages from experts and scientists while crisis
communication typically utilizes messages from authoritative figures.
Why Communicate about Risks
The emphasis on shared choice and informed decision-making where those directly at risk are
involved in making choices as to the most appropriate and desirable course of action. It is
important to communicate that there are more than one adaptation option available and that
each option has different risk and benefit profiles (not to mention costs) and long lasting
consequences. Risk communication is critical to fostering the learning needed to address the
challenges of climate change, to build new knowledge in different people.
Key Considerations for Communicating Climate Change Risks
1. Role of community members – they are the most effective communicators and
motivators for preparedness. Therefore, provide guidance and share information about
what actions they have taken against risks
2. Community engagement – this is to achieve knowledge generation and sharing, higher
understanding, sense of commitment, sense of stakeholder ownership, and engendered
capacity for action. The process involves two-way participatory dialogue between the
communicators and the receivers and workshops and learning sessions encourage
learning and exchange of knowledge. This process of social learning will promote the
development of strategies that are relevant (in the context of the receiver) and
effective.
3. Multiple sources and channels - preparedness information must come from multiple
sources and frequent repetition. People are more likely to follow evacuation messages
when they received multiple warning messages over diverse communication channels.
Multiple messages should be crafted to reach multiple publics. Integral use of social
media pre-crisis can increase resilience of publics. Traditional and social media should
work together, as necessary supplements to one another.
Traditional media utilizes interactive communication strategies such as theatre,
role-play, music and group discussions. Community members are involved in
debating climate risks and possible solutions to cope with climate change

Page 123 of 132
Print and broadcast media utilizes TV and radio broadcasts (national and regional
levels), reports, concept notes, brochures, magazines, and formal presentations and
workshops (policy makers at the local and national levels).
4. Receptiveness – the short period of time following an event is when people are most
receptive to preparedness messages. This is considered a “window of opportunity”
because “traumatic experience can be the best motivator to prepare for future
disasters” (Mileti, Bourque, Wood and Kano, 2011).
5. Risk Judgement – experiential precedes the analytical. Strong emotional experiences
related to hazards may increase the public’s perceptions of risks. It is important to
involve community members in disseminating preparedness messages, ensure that
information come from multiple channels and repeated often, and understand how
public’s perceive risks prior to disseminating risk messages.
Myths in Public Warnings
Myths Reality
Myth #1: The public is prone to panic
• It is rare for individuals to panic until they believe there is no escape from a life-threatening situation (Wessely, 2005).
• However, the public can adapt their behaviors to expose themselves and others around them to a greater risk than the original hazard they seek to avoid. This is often referred to adverse avoidance and adaptive behaviors (Sheppard, 2011).
Myth #2: The need to keep messages simple
• The concept of keeping messages short and simple applies to advertising, not public warnings; otherwise warned people will become “information starved” (Mileti, 2010, p. 35).
• If the warning does not contain sufficient information, individuals will seek out information from alternative sources, and confusion may result (Mileti, 2009).
Myth #3: The dangers of crying wolf
• False alarms can be productive for future response if explained although people can ignore sirens if they are sounded or tested frequently (Mileti, 2009).
Myth #4: Public’s general willingness to respond to warnings
• A single warning is not sufficient to get people to believe and respond and poorly crafted warnings and lack of understanding of how the public may respond to a warning will undermine a warning’s effectiveness.
Bridging the Gap
Understanding local context and local perceptions on climate risk – risk communication
strategies have to be reflective of the social and cultural norms under which the receivers
operate.

Page 124 of 132
Acknowledge local know-how on climate risk – conduct assessments that determine the
baseline status of stakeholder knowledge on climate risk, understand the local perceptions on
climate risk, and determine the sources of knowledge within the communities.
Assess knowledge at community level – can be conducted through household surveys and
participatory group discussions. Knowledge assessment of policy makers can be conducted
through individual meetings, interviews and formal workshops.
Advocacy Strategies
Advocacy is about is about persuading people to make changes that improve conditions for
vulnerable people. It is about speaking for others, working with others and supporting others to
speak for themselves, and taking community voices to a different level of decision making.
The people themselves know the risks that they face. They must be primary actors in advocacy
efforts. Neglecting risk reduction leads to more deaths and damage. There is a moral obligation
to prioritize risk reduction. Climate change is unavoidable and the risk of climate-related
disasters is ever increasing. We can prepare and we must adapt.
Advocacy process
• Identifying advocacy issues
• Understanding issues and collecting evidence
• Identifying targets
• Tailoring the message for target audience
• Delivering the message
• Monitoring and evaluation
‘See + Action’ formula
• Simple statement
• Evidence
• Use a personal story as an example, illustrating your case with a human element
• Put your message into action
Elements of Climate-Risk Information
1. Salience – timely and suitable for the context, meets a need
2. Legitimacy – limited bias from sender and acceptance by receiver
3. Credibility – trust and track record of demonstrated ability and consistency
4. Value – contributes to understanding
5. Adequacy – covers sufficient information
6. Effectiveness – can be successfully utilized
Communication Challenge
The language around risk associated with climate change is fairly new and is in many ways still
evolving, which makes risk communication particularly tricky. The audience may not be familiar
with climate risk terminology and risk analysis methodologies. Also, it is a challenge to convey
meaning between people with different knowledge domains and attitudes, based on their type
and level of education, area of work, cultural references, belief systems, etc. Other barriers to

Page 125 of 132
effective communication are inaccurate interpretation, selective perception, linguistic impact
(style, tone and speed in which the message is delivered), and semantics (different meanings
attached to the same word by the sender and receivers).
Session 2: Techniques and Methods in Translation and Popularization
Frannie A. Belarmino
Instructor/Public Information Officer
Central Bicol State University of Agriculture
Making the message clear is simply transforming complicated scientific and technical
information into communication materials that your audience can relate to and understand.
Simple Tips to Keep in Mind
1. Know your audience
• Identify the intended audience and define the key problem/s or interest/s
• Get to know the intended audience to help determine their key characteristics
2. Determine key messages
• Determine the best way to communicate messages to the audience (i.e., print,
audio, video)
• Determine how to distribute the materials to your audience
• The key messages should be clear, relevant and appropriate
3. Give the most important information
• Tell them what actions to take
• Explain why it is important to them
• Limit then number of messages
• Stick to one idea at a time
4. Consider culture
• Culture affects how people understand and respond to messages
• Culturally appropriate materials engage members of the target audience early on in
the communication planning phase.
5. Use terms that your audience uses and/or is comfortable with
• Groups may have different needs, values, and beliefs that will affect how they
interpret your message
Taking the Message Further through Translation
Messages that work well with an English-speaking audience may not work for audiences who
speak another language. Hence, developing a material in the language in the language of the
audience is equally important.
Translation involves finding out the audience values, beliefs and cultural perspectives. This can
be done through individual interviews, focus groups, or other kinds of audience research,
Page 126 of 132
including secondary research (i.e., literature reviews). Working with the community people in
the intended areas provides valuable insight about your audience.
Translating texts is not easy. One-on-one translation exists between the words and phrases of
different languages. A good translator is not only bilingual but “bicultural”.
Important Tips in Doing Translations
1. Be accurate – reproduce as exactly as possible the meaning of the source text.
2. Be natural – use natural forms of the receptor language in a way that is appropriate to
the kind of text being translated.
3. Be communicative – express all aspects of the meaning in a way that is readily
understandable to the intended audience.
4. Use back translation – Once the material has been translated to the intended language,
translate it back to English. (This step should be done by someone other than the
original translator.) Check to see if the meaning and tone of the message have stayed
the same.
5. Field-test materials

Page 127 of 132
Evaluation Results
The following are the summarized results from the General Evaluation Form answered and
submitted by the participants at the end of the training.
1. What I appreciated in the training
Comprehensive
Very useful and related to our work
All topics because these are useful in our CrFS part especially the topic on Farm Weather
Forecasting
Cropping and hazard calendars
The presenters were very intelligent, factual, and realistic in their presentations
I learned new information and I appreciated the importance of our food and livestock
not just saving lives
The awareness that not only humans and property are vulnerable to hazards but also
the crops of the farmers that humanity are dependent with
The training provided information that is very important in the field of agriculture.
Although some terms are new to me, I am very willing to learn more to be effective in
my area of work.
I appreciated the topics on DRR and CCA, the food served and the accommodation
The training is relevant to my work. I acquired additional information on DRR and CCA
measures that I believe are highly applicable in our locality
Well-rounded facilitators
Technical knowledge regarding DRR and CCA in agriculture
Impacts of DRR to CCA that is useful to my work
The close coordination and involvement of all agencies especially in the selection of
topics presented. The expertise of Dr. Sandoval in the whole aspects of DRR and CCA is
very evident. Topics that are not in the original schedule but were inserted during the
actual training because of the need of such is very much appreciated.
It opened further my understanding on climate change, its impact on decreasing food
production (crops and animals), the dis-integrated actions of different agencies of the
government and the needed political action/ support to solve the impact of climate
change.
Seasonal outlook and advisory/ forecasting
2. What I did not appreciate in this training
Time is very limited considering that some topics are highly technical and new to some
of us
Lecture delivery is very fast and we cannot catch up. We should have been provided
with reading materials before the series of lecture
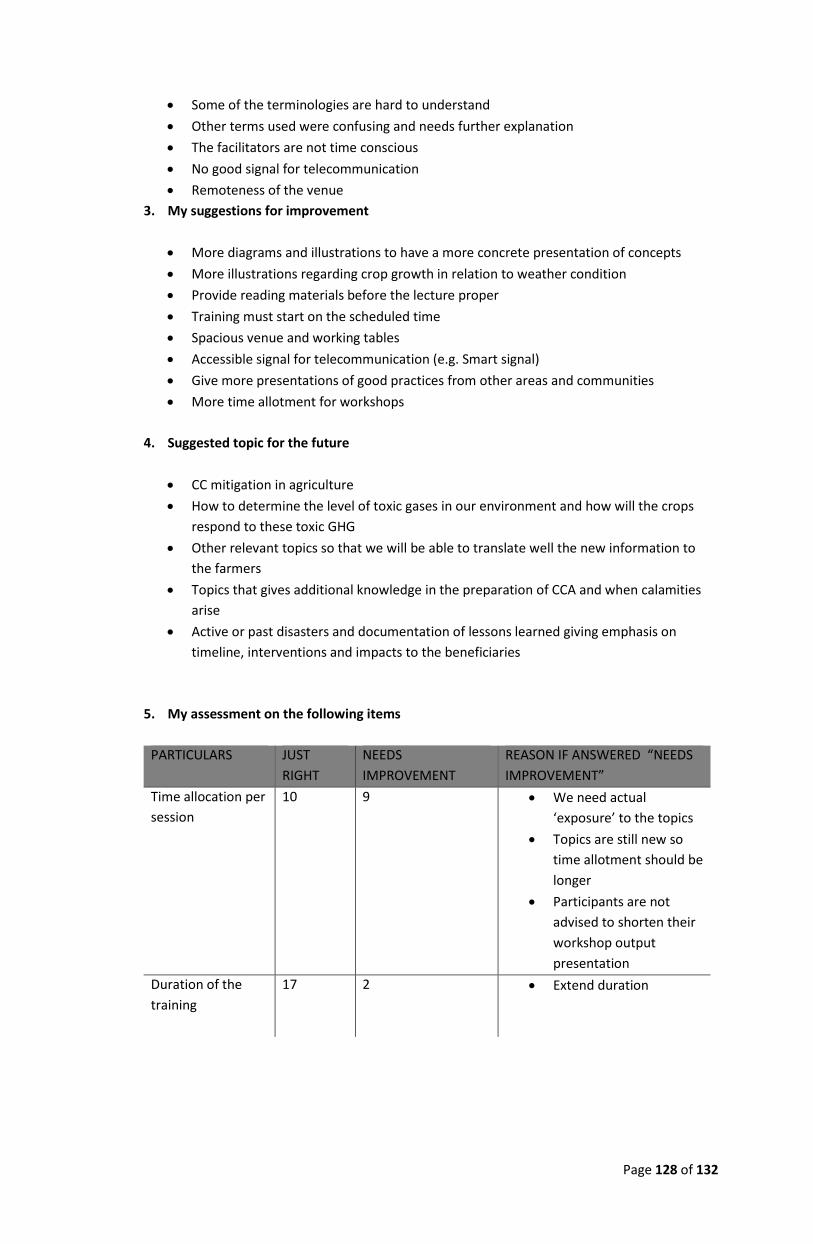
Page 128 of 132
Some of the terminologies are hard to understand
Other terms used were confusing and needs further explanation
The facilitators are not time conscious
No good signal for telecommunication
Remoteness of the venue
3. My suggestions for improvement
More diagrams and illustrations to have a more concrete presentation of concepts
More illustrations regarding crop growth in relation to weather condition
Provide reading materials before the lecture proper
Training must start on the scheduled time
Spacious venue and working tables
Accessible signal for telecommunication (e.g. Smart signal)
Give more presentations of good practices from other areas and communities
More time allotment for workshops
4. Suggested topic for the future
CC mitigation in agriculture
How to determine the level of toxic gases in our environment and how will the crops
respond to these toxic GHG
Other relevant topics so that we will be able to translate well the new information to
the farmers
Topics that gives additional knowledge in the preparation of CCA and when calamities
arise
Active or past disasters and documentation of lessons learned giving emphasis on
timeline, interventions and impacts to the beneficiaries
5. My assessment on the following items
PARTICULARS JUST
RIGHT
NEEDS
IMPROVEMENT
REASON IF ANSWERED “NEEDS
IMPROVEMENT”
Time allocation per
session
10 9
We need actual
‘exposure’ to the topics
Topics are still new so
time allotment should be
longer
Participants are not
advised to shorten their
workshop output
presentation
Duration of the
training
17 2 Extend duration

Page 129 of 132
6. My overall rating for this training/ activity
1- P (poor)
2-F (fair)
3- S (satisfactory)
4- VS (very satisfactory)
5- E (excellent)
COMPONENT P
1
F
2
S
3
VS
4
E
5
a) Meeting of my expectations 2 15 2
b) Attainment of the training objectives 5 11 3
c) Course Content/ Topics 3 14 2
d) The SLEs and workshops included 5 12 2
e) Methodologies used 4 14 1
f) Delivery 1 4 11 3
g) Choice of resource persons 3 13 3
h) Training management team 3 12 4
i) Training facilities and services 3 3 9 4
Other remarks from the daily evaluation forms submitted
Be sensitive to your participants. Give energizer if you notice that the discussion is
already dragging.
Simplify things in an approachable way in order for the participants to get a clearer
focus. Also, please be sensitive; it is not appropriate to make “green jokes”. There are
some other ways to make the participants laugh.
It would be good if participants will have a hands-on exposure to AWS and actual
weather observation (outside the training hall). The lecturer also failed to identify cloud
formation that creates rain.

Page 130 of 132
Links to Online Reference Sources
Module Reference Title Online Link
Module I Raihan, M.S., Huq, M.J., Alsted, N.G.,
Andreasen, M.H. 2010. Understanding climate
change from below: practical experience and
learning from a community-based adaptation
project in Bangladesh. ActionAid Bangladesh
(AAB). Dhaka, Bangladesh. Pp. 7-11, 18-19, 23-
25, 29-35, 46, 53
http://indiaenvironmentportal.org.in/
files/understandingccfrombelow.pdf
FAO. 2008. Climate change and food security:
a framework document. Pp. 1-12, 20-41
http://www.fao.org/forestry/15538-
079b31d45081fe9c3dbc6ff34de4807e
4.pdf
FAO. 2011. Resilient Livelihoods – Disaster Risk
Reduction for Food and Nutrition Security
Framework Programme. Pp. 2-34,
http://www.fao.org/docrep/015/i254
0e/i2540e00.pdf
Ministry of Agriculture and Cooperatives –
Nepal. 2011. Priority framework for action –
climate change adaptation and disaster risk
management in agriculture. P. 3
http://www.fao.org/docrep/015/an71
3e/an713e00.pdf
FAO Online. Planning for Community based
adaptation to climate change. Module I – II
http://www.fao.org/climatechange/2
4444-
0ed5117aa4b7b6355bca46e0cf60eb1
61.pdf
Module II FAO Online. Planning for Community based
adaptation to climate change. Module III:
Session 5
http://www.fao.org/climatechange/2
4444-
0ed5117aa4b7b6355bca46e0cf60eb1
61.pdf
Locatelli, B., Herawati, H., Brockhaus, M.,
Idinoba, M., Kanninen, M. 2008. Methods and
tools for assessing the vulnerability of forests
and people to climate change. Working Paper
No. 43. Center for International Forestry
Research (CIFOR) and Agricultural Research
Center for International Development (CIRAD)
http://www.cifor.org/publications/pdf
_files/WPapers/WP43Locatelli.pdf
CARE International. 2009. Climate
vulnerability and capacity assessment
handbook.
http://www.careclimatechange.org/c
vca/CARE_CVCAHandbook.pdf

Page 131 of 132
Asian Disaster Preparedness Center. 2005.
Training modules for climate and flood
forecast applications in agriculture.
ftp://ftp.fao.org/docrep/fao/008/af96
7e/af967e00.pdf
Module III FAO. 2008. Climate change and food security:
a framework document. Pp. 71-73
http://www.fao.org/forestry/15538-
079b31d45081fe9c3dbc6ff34de4807e
4.pdf
FAO-AMICAF. 2013. National institutional
analysis workshop on mainstreaming climate
change adaptation (CCA) and disaster risk
reduction (DRR) into agriculture and related
sectors. Workshop proceedings
Check e-copy with PMO
FAO. 2011. Resilient Livelihoods – Disaster Risk
Reduction for Food and Nutrition Security
Framework Programme. Pp. 38-45
http://www.fao.org/docrep/015/i254
0e/i2540e00.pdf
United Nations Development Programme.
2010. Gender, climate change and community-
based adaptation. UNDP, New York.
http://www.gender-
climate.org/Content/Docs/Publication
s/A35_undp_Gender_Climate_Change
_and_Community_Based_Adaptation.
CGIAR, CCAFS, FAO. 2012. Gender and climate
change research in agriculture and food
security for rural development. Training Guide.
http://www.fao.org/docrep/015/md2
80e/md280e.pdf
FAO Online. Planning for Community based
adaptation to climate change. Module III
http://www.fao.org/climatechange/2
4444-
0ed5117aa4b7b6355bca46e0cf60eb1
61.pdf
Module IV FAO Online. Planning for Community based
adaptation to climate change. Module IV
http://www.fao.org/climatechange/2
4444-
0ed5117aa4b7b6355bca46e0cf60eb1
61.pdf
FAO - MDGF 1656 Outcome 3.1. 2012. A
framework for monitoring and evaluation of
good practice climate change adaptation
options in agriculture
E-copy with RC Sandoval
Module V FAO. 2013. Climate-smart agriculture:
sourcebook
http://www.fao.org/docrep/018/i332
5e/i3325e.pdf
FAO. 2011. Climate-smart agriculture:
smallholder adoption and implications for
climate change adaptation and mitigation
http://www.fao.org/docrep/015/i257
5e/i2575e00.pdf
FAO. 2012. Mainstreaming climate-smart
agriculture into a broader landscape approach
http://www.fao.org/docrep/016/ap40
2e/ap402e.pdf
Module VI FAO. 2008. Climate change and food security:
a framework document. P. 34
http://www.fao.org/forestry/15538-
079b31d45081fe9c3dbc6ff34de4807e
4.pdf

Page 132 of 132