local results, by quartile. è cities are divided into quartiles according to the percentage of...
TRANSCRIPT

Local Results,by Quartile

Local Results, by Quartile
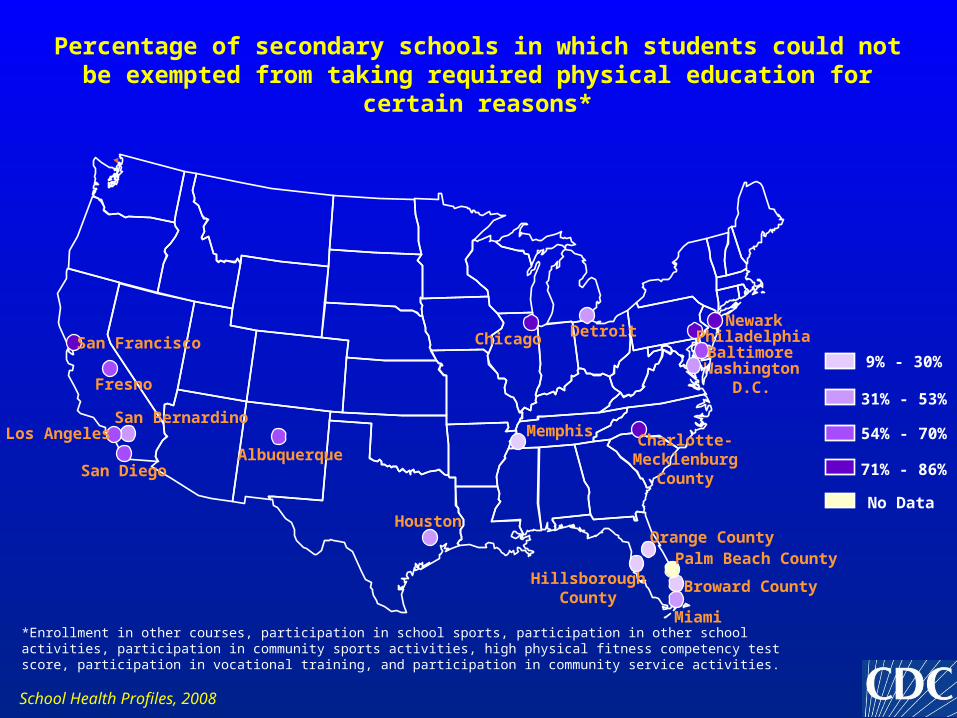
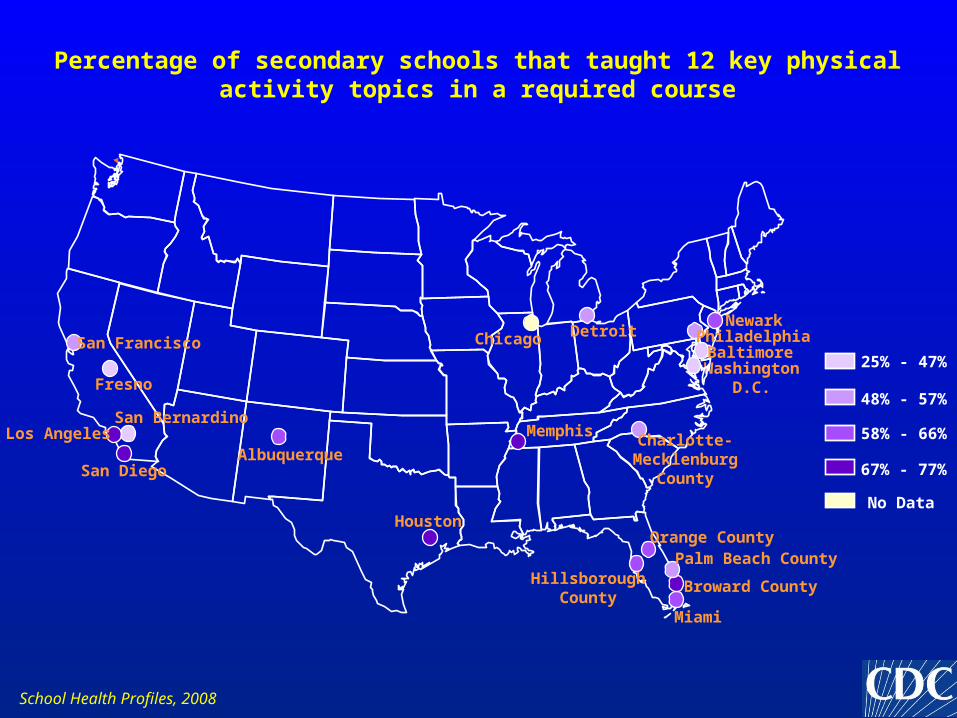
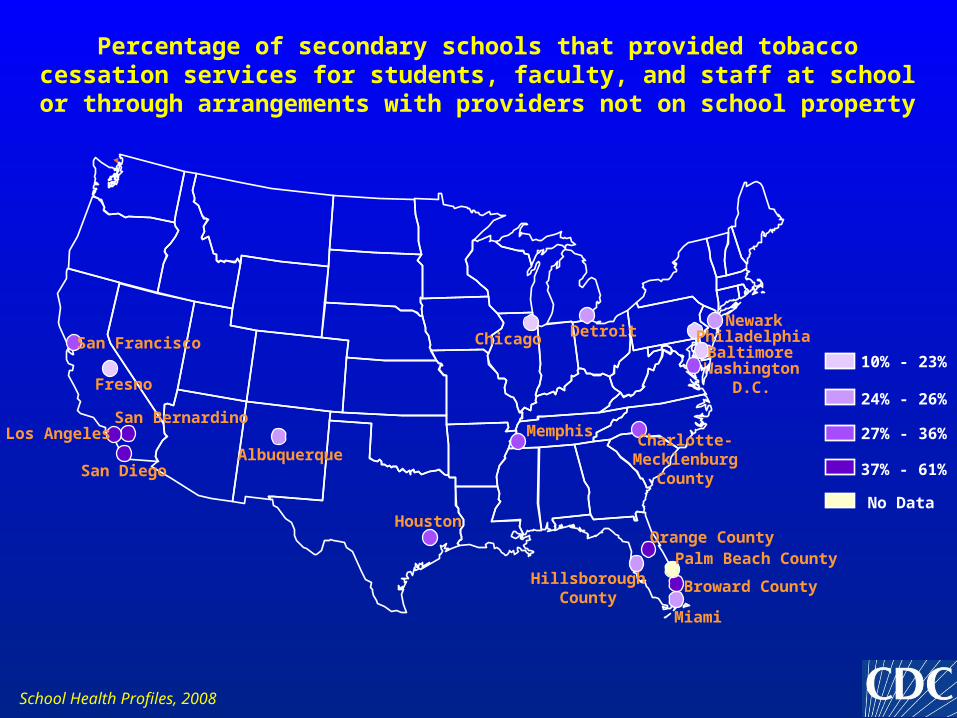
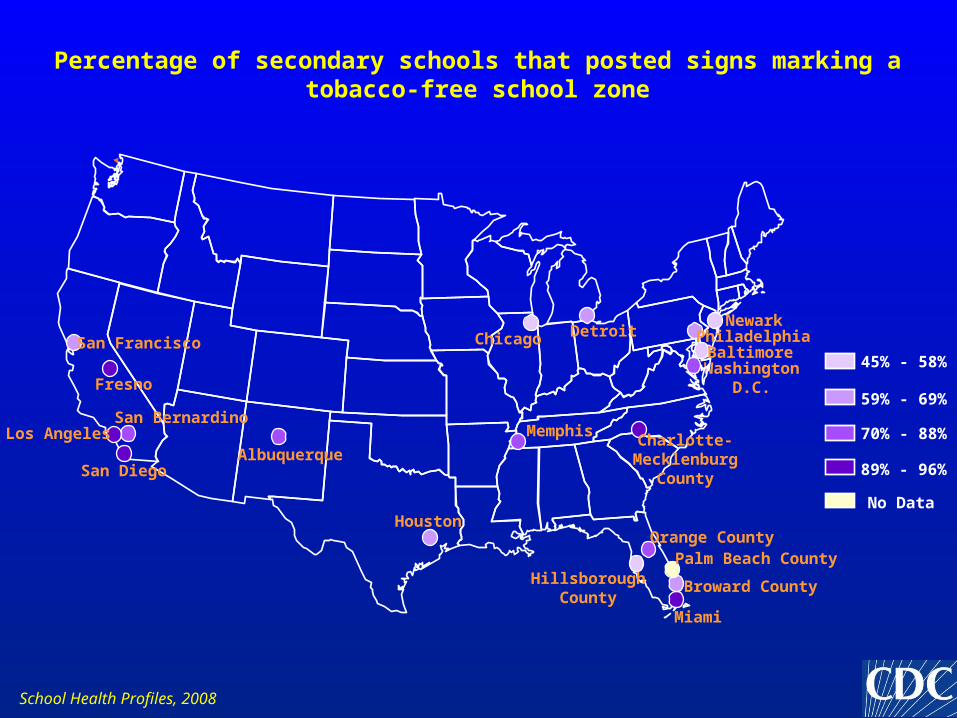
Cities are divided into quartiles according to the percentage of secondary schools in each city with each school health policy or practice in place
Percentages in quartiles change from map to map depending on the range of percentages across all cities
Darker shades indicate a higher percentage of secondary schools with each policy or practice in place
Maps provide relative results (i.e., how cities compare to each other)

Physical Education
and
Physical Activity
WashingtonD.C.
Percentage of secondary schools in which students could not be exempted from taking required physical education for certain reasons*
9% - 30%
31% - 53%
54% - 70%
71% - 86%
No Data
School Health Profiles, 2008
Miami
Palm Beach County
Broward County
Orange County
HillsboroughCounty
Houston
MemphisCharlotte-
MecklenburgCounty
Baltimore
NewarkPhiladelphiaDetroitChicago
Albuquerque
San Francisco
Fresno
San BernardinoLos Angeles
San Diego
*Enrollment in other courses, participation in school sports, participation in other school activities, participation in community sports activities, high physical fitness competency test score, participation in vocational training, and participation in community service activities.
WashingtonD.C.
Percentage of secondary schools that taught 12 key physical activity topics in a required course
25% - 47%
48% - 57%
58% - 66%
67% - 77%
No Data
School Health Profiles, 2008
Miami
Palm Beach County
Broward County
Orange County
HillsboroughCounty
Houston
MemphisCharlotte-
MecklenburgCounty
Baltimore
NewarkPhiladelphiaDetroitChicago
Albuquerque
San Francisco
Fresno
San BernardinoLos Angeles
San Diego

WashingtonD.C.
Percentage of secondary schools that taught about developing an individualized physical activity plan in a required course
41% - 70%
71% - 77%
78% - 83%
84% - 100%
No Data
School Health Profiles, 2008
Miami
Palm Beach County
Broward County
Orange County
HillsboroughCounty
Houston
MemphisCharlotte-
MecklenburgCounty
Baltimore
NewarkPhiladelphiaDetroitChicago
Albuquerque
San Francisco
Fresno
San BernardinoLos Angeles
San Diego

WashingtonD.C.
Percentage of secondary schools in which those who teach physical education were provided with key materials for teaching physical education
51% - 78%
79% - 85%
86% - 92%
93% - 96%
No Data
School Health Profiles, 2008
Miami
Palm Beach County
Broward County
Orange County
HillsboroughCounty
Houston
MemphisCharlotte-
MecklenburgCounty
Baltimore
NewarkPhiladelphiaDetroitChicago
Albuquerque
San Francisco
Fresno
San BernardinoLos Angeles
San Diego

WashingtonD.C.
Percentage of secondary schools that offered opportunities for all students to participate in intramural activities or physical activity clubs
63% - 80%
81% - 83%
84% - 93%
94% - 100%
No Data
School Health Profiles, 2008
Miami
Palm Beach County
Broward County
Orange County
HillsboroughCounty
Houston
MemphisCharlotte-
MecklenburgCounty
Baltimore
NewarkPhiladelphiaDetroitChicago
Albuquerque
San Francisco
Fresno
San BernardinoLos Angeles
San Diego

WashingtonD.C.
Percentage of secondary schools that provided parents and families with health information to increase parent and family knowledge of physical
activity
19% - 42%
43% - 53%
54% - 63%
64% - 80%
No Data
School Health Profiles, 2008
Miami
Palm Beach County
Broward County
Orange County
HillsboroughCounty
Houston
MemphisCharlotte-
MecklenburgCounty
Baltimore
NewarkPhiladelphiaDetroitChicago
Albuquerque
San Francisco
Fresno
San BernardinoLos Angeles
San Diego

WashingtonD.C.
Percentage of secondary schools that used the School Health Index or a similar self-assessment tool to assess their policies, activities, and programs
in physical activity
24% - 35%
36% - 47%
48% - 53%
54% - 81%
No Data
School Health Profiles, 2008
Miami
Palm Beach County
Broward County
Orange County
HillsboroughCounty
Houston
MemphisCharlotte-
MecklenburgCounty
Baltimore
NewarkPhiladelphiaDetroitChicago
Albuquerque
San Francisco
Fresno
San BernardinoLos Angeles
San Diego

Tobacco Use

WashingtonD.C.
Percentage of secondary schools that prohibited all tobacco use at all times in all locations*
18% - 38%
39% - 50%
51% - 63%
64% - 98%
No Data
School Health Profiles, 2008
Miami
Palm Beach County
Broward County
Orange County
HillsboroughCounty
Houston
MemphisCharlotte-
MecklenburgCounty
Baltimore
NewarkPhiladelphiaDetroitChicago
Albuquerque
San Francisco
Fresno
San BernardinoLos Angeles
San Diego
*Prohibited the use of all tobacco, including cigarettes, smokeless tobacco, cigars, and pipes; by students, faculty and school staff, and visitors; in school buildings; outside on school grounds; on school buses or other vehicles used to transport students; and at off-campus, school-sponsored events; during school hours and non-school hours.

WashingtonD.C.
Percentage of secondary schools that sometimes, almost always, or always required students who were caught smoking to participate in an assistance,
education, or cessation program
25% - 35%
36% - 52%
53% - 63%
64% - 87%
No Data
School Health Profiles, 2008
Miami
Palm Beach County
Broward County
Orange County
HillsboroughCounty
Houston
MemphisCharlotte-
MecklenburgCounty
Baltimore
NewarkPhiladelphiaDetroitChicago
Albuquerque
San Francisco
Fresno
San BernardinoLos Angeles
San Diego
WashingtonD.C.
Percentage of secondary schools that provided tobacco cessation services for students, faculty, and staff at school or through arrangements with
providers not on school property
10% - 23%
24% - 26%
27% - 36%
37% - 61%
No Data
School Health Profiles, 2008
Miami
Palm Beach County
Broward County
Orange County
HillsboroughCounty
Houston
MemphisCharlotte-
MecklenburgCounty
Baltimore
NewarkPhiladelphiaDetroitChicago
Albuquerque
San Francisco
Fresno
San BernardinoLos Angeles
San Diego
WashingtonD.C.
Percentage of secondary schools that posted signs marking a tobacco-free school zone
45% - 58%
59% - 69%
70% - 88%
89% - 96%
No Data
School Health Profiles, 2008
Miami
Palm Beach County
Broward County
Orange County
HillsboroughCounty
Houston
MemphisCharlotte-
MecklenburgCounty
Baltimore
NewarkPhiladelphiaDetroitChicago
Albuquerque
San Francisco
Fresno
San BernardinoLos Angeles
San Diego

WashingtonD.C.
Percentage of secondary schools that taught 15 key tobacco-use prevention topics in a required course
24% - 43%
44% - 50%
51% - 61%
62% - 79%
No Data
School Health Profiles, 2008
Miami
Palm Beach County
Broward County
Orange County
HillsboroughCounty
Houston
MemphisCharlotte-
MecklenburgCounty
Baltimore
NewarkPhiladelphiaDetroitChicago
Albuquerque
San Francisco
Fresno
San BernardinoLos Angeles
San Diego

WashingtonD.C.
Percentage of secondary schools in which the lead health education teacher received professional development during the two years before the survey on
tobacco-use prevention
6% - 38%
39% - 45%
46% - 64%
65% - 84%
No Data
School Health Profiles, 2008
Miami
Palm Beach County
Broward County
Orange County
HillsboroughCounty
Houston
MemphisCharlotte-
MecklenburgCounty
Baltimore
NewarkPhiladelphiaDetroitChicago
Albuquerque
San Francisco
Fresno
San BernardinoLos Angeles
San Diego

WashingtonD.C.
Percentage of secondary schools that gathered and shared information with students and families about media or community-based tobacco-use
prevention efforts during the two years before the survey
31% - 36%
37% - 44%
45% - 53%
54% - 78%
No Data
School Health Profiles, 2008
Miami
Palm Beach County
Broward County
Orange County
HillsboroughCounty
Houston
MemphisCharlotte-
MecklenburgCounty
Baltimore
NewarkPhiladelphiaDetroitChicago
Albuquerque
San Francisco
Fresno
San BernardinoLos Angeles
San Diego
WashingtonD.C.
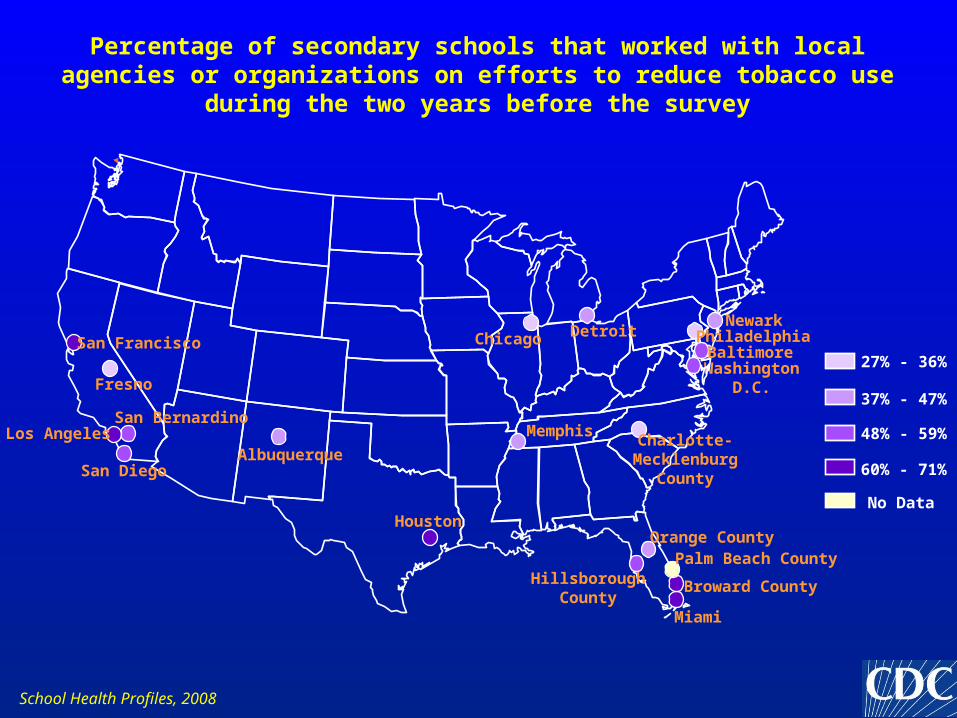
Percentage of secondary schools that worked with local agencies or organizations on efforts to reduce tobacco use during the two years before
the survey
27% - 36%
37% - 47%
48% - 59%
60% - 71%
No Data
School Health Profiles, 2008
Miami
Palm Beach County
Broward County
Orange County
HillsboroughCounty
Houston
MemphisCharlotte-
MecklenburgCounty
Baltimore
NewarkPhiladelphiaDetroitChicago
Albuquerque
San Francisco
Fresno
San BernardinoLos Angeles
San Diego

WashingtonD.C.
Percentage of secondary schools that provided parents and families of students with health information to increase parent and family knowledge of
tobacco-use prevention
15% - 33%
34% - 46%
47% - 49%
50% - 65%
No Data
School Health Profiles, 2008
Miami
Palm Beach County
Broward County
Orange County
HillsboroughCounty
Houston
MemphisCharlotte-
MecklenburgCounty
Baltimore
NewarkPhiladelphiaDetroitChicago
Albuquerque
San Francisco
Fresno
San BernardinoLos Angeles
San Diego

WashingtonD.C.
Percentage of secondary schools that used the School Health Index or a similar self-assessment tool to assess their policies, activities, and programs
in tobacco-use prevention
19% - 29%
30% - 40%
41% - 47%
48% - 64%
No Data
School Health Profiles, 2008
Miami
Palm Beach County
Broward County
Orange County
HillsboroughCounty
Houston
MemphisCharlotte-
MecklenburgCounty
Baltimore
NewarkPhiladelphiaDetroitChicago
Albuquerque
San Francisco
Fresno
San BernardinoLos Angeles
San Diego

Nutrition

WashingtonD.C.
Percentage of secondary schools in which students could not purchase chocolate candy from vending machines or at the school store, canteen, or
snack bar
47% - 78%
79% - 90%
91% - 94%
95% - 100%
No Data
School Health Profiles, 2008
Miami
Palm Beach County
Broward County
Orange County
HillsboroughCounty
Houston
MemphisCharlotte-
MecklenburgCounty
Baltimore
NewarkPhiladelphiaDetroitChicago
Albuquerque
San Francisco
Fresno
San BernardinoLos Angeles
San Diego

WashingtonD.C.
Percentage of secondary schools in which students could not purchase other kinds of candy from vending machines or at the school store, canteen,
or snack bar
39% - 78%
79% - 86%
87% - 92%
93% - 100%
No Data
School Health Profiles, 2008
Miami
Palm Beach County
Broward County
Orange County
HillsboroughCounty
Houston
MemphisCharlotte-
MecklenburgCounty
Baltimore
NewarkPhiladelphiaDetroitChicago
Albuquerque
San Francisco
Fresno
San BernardinoLos Angeles
San Diego

WashingtonD.C.
Percentage of secondary schools in which students could not purchase salty snacks that are not low in fat* from vending machines or at the school store,
canteen, or snack bar
33% - 71%
72% - 81%
82% - 86%
87% - 95%
No Data
School Health Profiles, 2008
Miami
Palm Beach County
Broward County
Orange County
HillsboroughCounty
Houston
MemphisCharlotte-
MecklenburgCounty
Baltimore
NewarkPhiladelphiaDetroitChicago
Albuquerque
San Francisco
Fresno
San BernardinoLos Angeles
San Diego
*Such as regular potato chips.
WashingtonD.C.
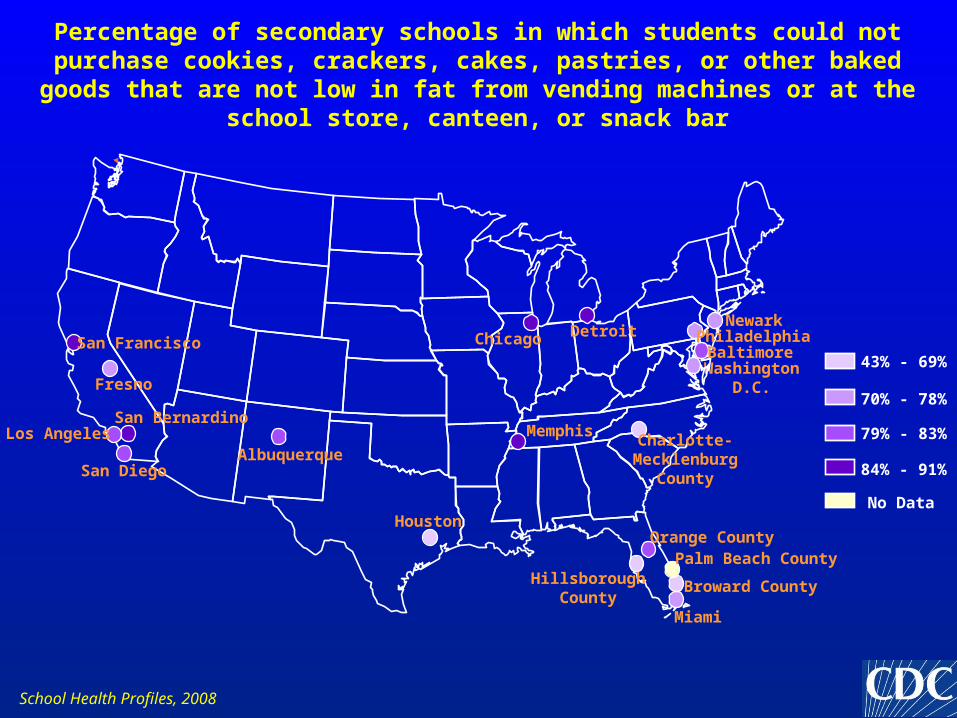
Percentage of secondary schools in which students could not purchase cookies, crackers, cakes, pastries, or other baked goods that are not low in
fat from vending machines or at the school store, canteen, or snack bar
43% - 69%
70% - 78%
79% - 83%
84% - 91%
No Data
School Health Profiles, 2008
Miami
Palm Beach County
Broward County
Orange County
HillsboroughCounty
Houston
MemphisCharlotte-
MecklenburgCounty
Baltimore
NewarkPhiladelphiaDetroitChicago
Albuquerque
San Francisco
Fresno
San BernardinoLos Angeles
San Diego

WashingtonD.C.
Percentage of secondary schools in which students could not purchase soda pop or fruit drinks that are not 100% juice from vending machines or at the
school store, canteen, or snack bar
33% - 75%
76% - 86%
87% - 90%
91% - 94%
No Data
School Health Profiles, 2008
Miami
Palm Beach County
Broward County
Orange County
HillsboroughCounty
Houston
MemphisCharlotte-
MecklenburgCounty
Baltimore
NewarkPhiladelphiaDetroitChicago
Albuquerque
San Francisco
Fresno
San BernardinoLos Angeles
San Diego
WashingtonD.C.
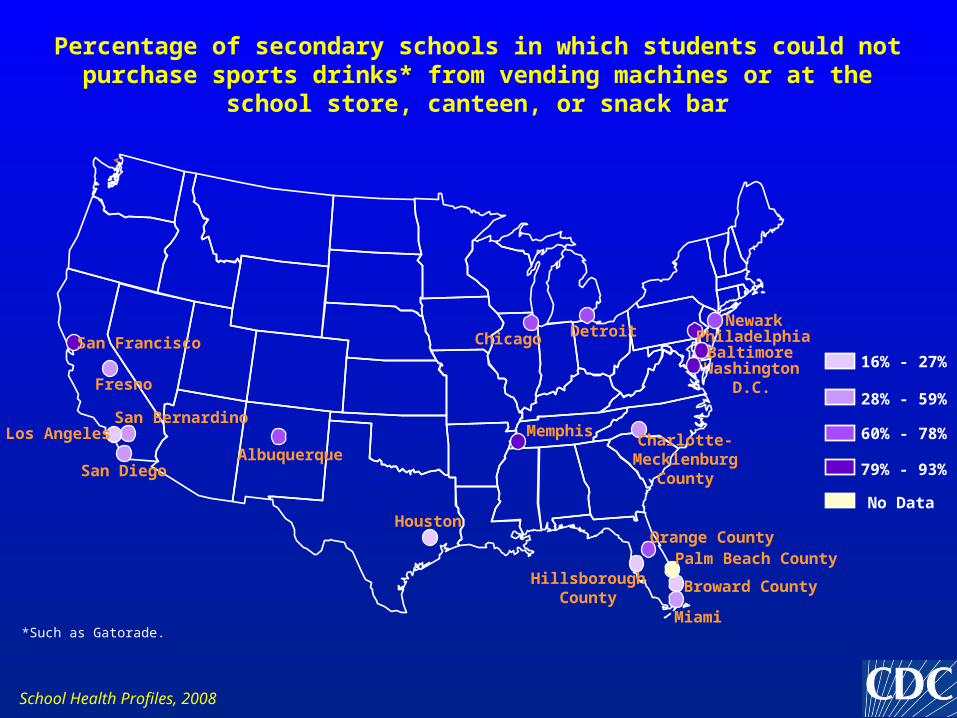
Percentage of secondary schools in which students could not purchase sports drinks* from vending machines or at the school store, canteen, or
snack bar
16% - 27%
28% - 59%
60% - 78%
79% - 93%
No Data
School Health Profiles, 2008
Miami
Palm Beach County
Broward County
Orange County
HillsboroughCounty
Houston
MemphisCharlotte-
MecklenburgCounty
Baltimore
NewarkPhiladelphiaDetroitChicago
Albuquerque
San Francisco
Fresno
San BernardinoLos Angeles
San Diego
*Such as Gatorade.
WashingtonD.C.
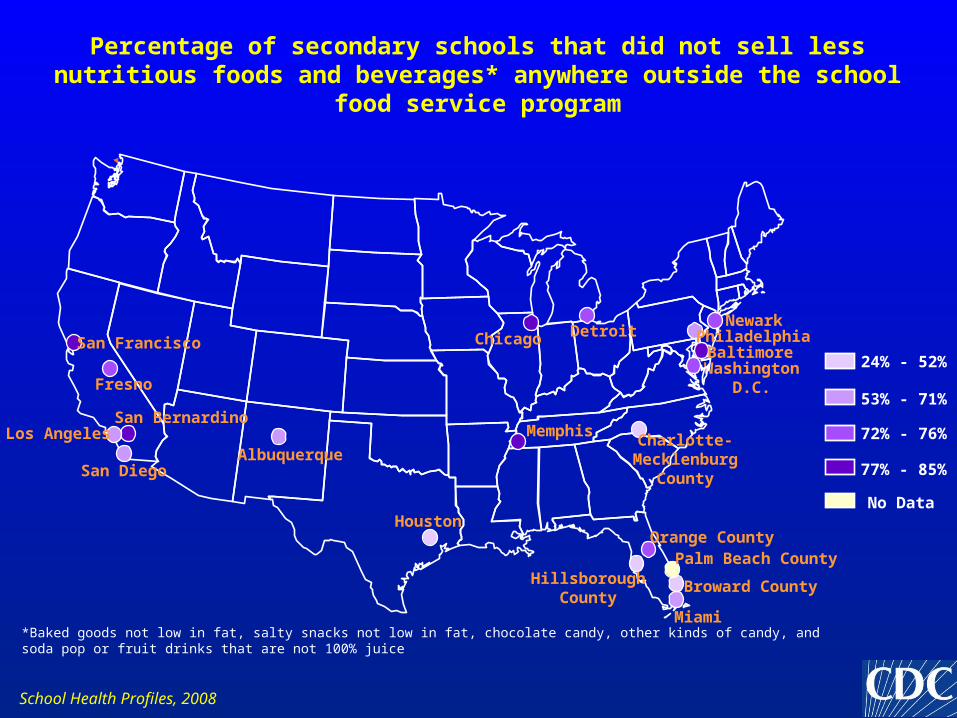
Percentage of secondary schools that did not sell less nutritious foods and beverages* anywhere outside the school food service program
24% - 52%
53% - 71%
72% - 76%
77% - 85%
No Data
School Health Profiles, 2008
Miami
Palm Beach County
Broward County
Orange County
HillsboroughCounty
Houston
MemphisCharlotte-
MecklenburgCounty
Baltimore
NewarkPhiladelphiaDetroitChicago
Albuquerque
San Francisco
Fresno
San BernardinoLos Angeles
San Diego
*Baked goods not low in fat, salty snacks not low in fat, chocolate candy, other kinds of candy, and soda pop or fruit drinks that are not 100% juice

WashingtonD.C.
Percentage of secondary schools that always offered fruits or non-fried vegetables in vending machines or school stores, and during celebrations
when foods and beverages are offered
4% - 8%
9% - 14%
15% - 19%
20% - 30%
No Data
School Health Profiles, 2008
Miami
Palm Beach County
Broward County
Orange County
HillsboroughCounty
Houston
MemphisCharlotte-
MecklenburgCounty
Baltimore
NewarkPhiladelphiaDetroitChicago
Albuquerque
San Francisco
Fresno
San BernardinoLos Angeles
San Diego
WashingtonD.C.
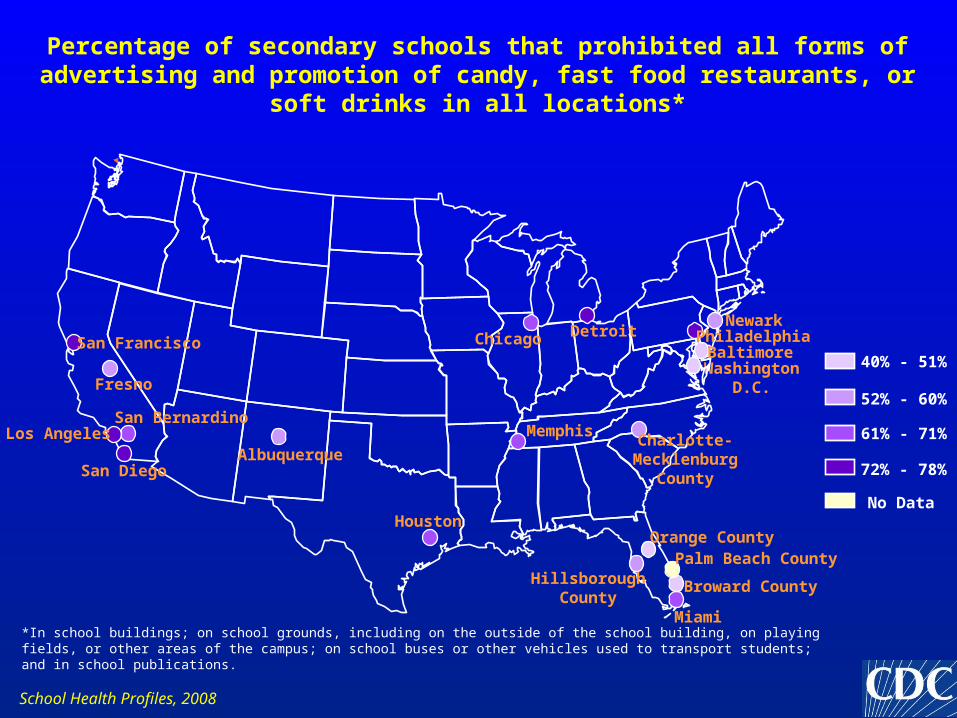
Percentage of secondary schools that prohibited all forms of advertising and promotion of candy, fast food restaurants, or soft drinks in all locations*
40% - 51%
52% - 60%
61% - 71%
72% - 78%
No Data
School Health Profiles, 2008
Miami
Palm Beach County
Broward County
Orange County
HillsboroughCounty
Houston
MemphisCharlotte-
MecklenburgCounty
Baltimore
NewarkPhiladelphiaDetroitChicago
Albuquerque
San Francisco
Fresno
San BernardinoLos Angeles
San Diego
*In school buildings; on school grounds, including on the outside of the school building, on playing fields, or other areas of the campus; on school buses or other vehicles used to transport students; and in school publications.
WashingtonD.C.
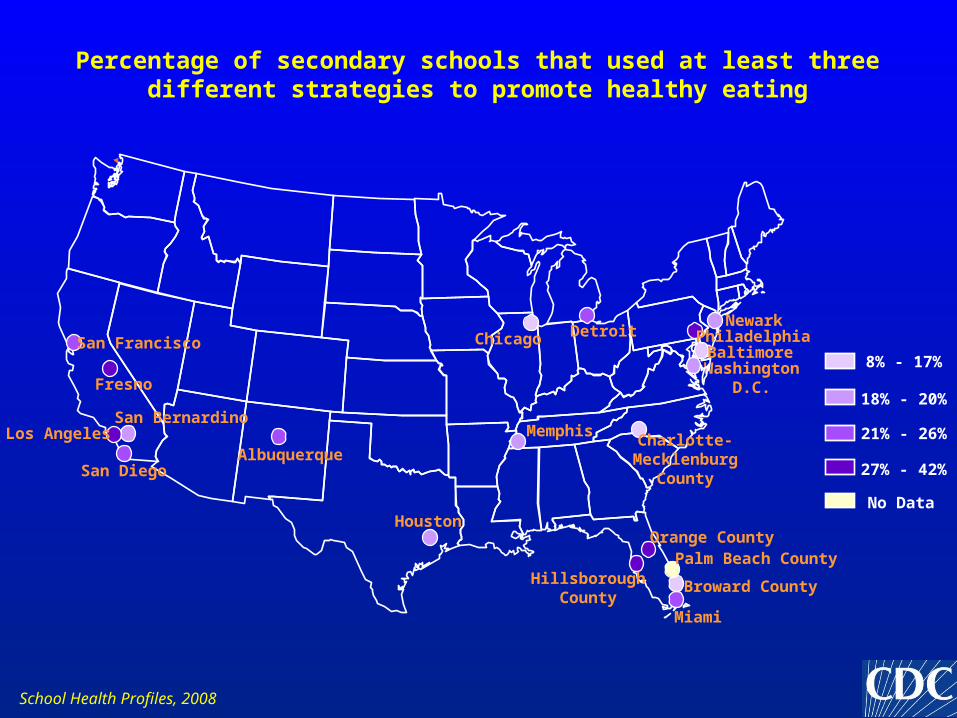
Percentage of secondary schools that used at least three different strategies to promote healthy eating
8% - 17%
18% - 20%
21% - 26%
27% - 42%
No Data
School Health Profiles, 2008
Miami
Palm Beach County
Broward County
Orange County
HillsboroughCounty
Houston
MemphisCharlotte-
MecklenburgCounty
Baltimore
NewarkPhiladelphiaDetroitChicago
Albuquerque
San Francisco
Fresno
San BernardinoLos Angeles
San Diego

WashingtonD.C.
Percentage of secondary schools that taught 14 key nutrition and dietary behavior topics in a required course
25% - 47%
48% - 56%
57% - 65%
66% - 81%
No Data
School Health Profiles, 2008
Miami
Palm Beach County
Broward County
Orange County
HillsboroughCounty
Houston
MemphisCharlotte-
MecklenburgCounty
Baltimore
NewarkPhiladelphiaDetroitChicago
Albuquerque
San Francisco
Fresno
San BernardinoLos Angeles
San Diego

WashingtonD.C.
Percentage of secondary schools in which the lead health education teacher received professional development during the two years before the survey on
nutrition and dietary behavior
6% - 37%
38% - 49%
50% - 59%
60% - 81%
No Data
School Health Profiles, 2008
Miami
Palm Beach County
Broward County
Orange County
HillsboroughCounty
Houston
MemphisCharlotte-
MecklenburgCounty
Baltimore
NewarkPhiladelphiaDetroitChicago
Albuquerque
San Francisco
Fresno
San BernardinoLos Angeles
San Diego

WashingtonD.C.
Percentage of secondary schools that used the School Health Index or a similar self-assessment tool to assess their policies, activities, and programs
in nutrition
25% - 29%
30% - 42%
43% - 49%
50% - 71%
No Data
School Health Profiles, 2008
Miami
Palm Beach County
Broward County
Orange County
HillsboroughCounty
Houston
MemphisCharlotte-
MecklenburgCounty
Baltimore
NewarkPhiladelphiaDetroitChicago
Albuquerque
San Francisco
Fresno
San BernardinoLos Angeles
San Diego

School Health
Coordination

WashingtonD.C.
Percentage of secondary schools that had a school health council, committee, or team that offers guidance on the development of policies or
coordinates activities on health topics
35% - 45%
46% - 58%
59% - 69%
70% - 84%
No Data
School Health Profiles, 2008
Miami
Palm Beach County
Broward County
Orange County
HillsboroughCounty
Houston
MemphisCharlotte-
MecklenburgCounty
Baltimore
NewarkPhiladelphiaDetroitChicago
Albuquerque
San Francisco
Fresno
San BernardinoLos Angeles
San Diego

WashingtonD.C.
Percentage of secondary schools that ever used the School Health Index or other self-assessment tool to assess their policies, activities, and programs
in physical activity, nutrition, or tobacco-use prevention
34% - 43%
44% - 53%
54% - 57%
58% - 81%
No Data
School Health Profiles, 2008
Miami
Palm Beach County
Broward County
Orange County
HillsboroughCounty
Houston
MemphisCharlotte-
MecklenburgCounty
Baltimore
NewarkPhiladelphiaDetroitChicago
Albuquerque
San Francisco
Fresno
San BernardinoLos Angeles
San Diego

WashingtonD.C.
Percentage of secondary schools that had a copy of their district’s wellness policy
45% - 61%
62% - 79%
80% - 90%
91% - 97%
No Data
School Health Profiles, 2008
Miami
Palm Beach County
Broward County
Orange County
HillsboroughCounty
Houston
MemphisCharlotte-
MecklenburgCounty
Baltimore
NewarkPhiladelphiaDetroitChicago
Albuquerque
San Francisco
Fresno
San BernardinoLos Angeles
San Diego
HIV, STD, and Pregnancy Prevention

WashingtonD.C.
Percentage of secondary schools that taught 11 key HIV, STD, and pregnancy prevention topics in a required course during grades 6, 7, or 8
9% - 49%
50% - 59%
60% - 71%
72% - 100%
No Data
School Health Profiles, 2008
Miami
Palm Beach County
Broward County
Orange County
HillsboroughCounty
Houston
MemphisCharlotte-
MecklenburgCounty
Baltimore
NewarkPhiladelphiaDetroitChicago
Albuquerque
San Francisco
Fresno
San BernardinoLos Angeles
San Diego
WashingtonD.C.
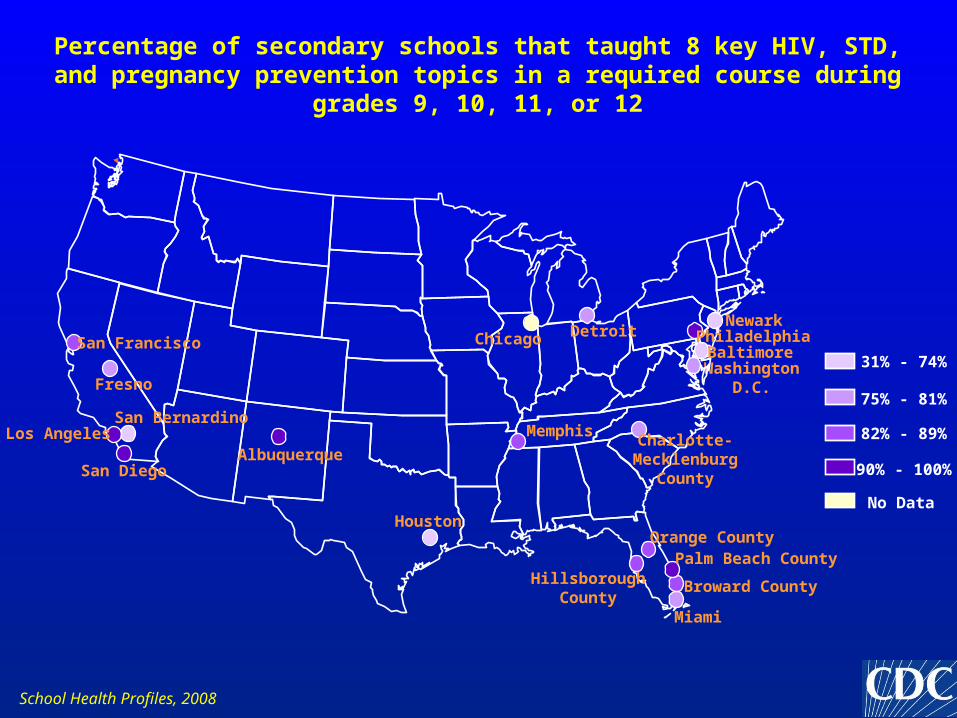
Percentage of secondary schools that taught 8 key HIV, STD, and pregnancy prevention topics in a required course during grades 9, 10, 11, or 12
31% - 74%
75% - 81%
82% - 89%
90% - 100%
No Data
School Health Profiles, 2008
Miami
Palm Beach County
Broward County
Orange County
HillsboroughCounty
Houston
MemphisCharlotte-
MecklenburgCounty
Baltimore
NewarkPhiladelphiaDetroitChicago
Albuquerque
San Francisco
Fresno
San BernardinoLos Angeles
San Diego

WashingtonD.C.
Percentage of secondary schools that taught 3 key topics related to condom use in a required course during grades 9, 10, 11, or 12
0% - 59%
60% - 68%
69% - 82%
83% - 100%
No Data
School Health Profiles, 2008
Miami
Palm Beach County
Broward County
Orange County
HillsboroughCounty
Houston
MemphisCharlotte-
MecklenburgCounty
Baltimore
NewarkPhiladelphiaDetroitChicago
Albuquerque
San Francisco
Fresno
San BernardinoLos Angeles
San Diego

WashingtonD.C.
Percentage of secondary schools that taught how to access valid and reliable health information, products, or services related to HIV, other STDs, and
pregnancy in a required course
46% - 66%
67% - 78%
79% - 89%
90% - 100%
No Data
School Health Profiles, 2008
Miami
Palm Beach County
Broward County
Orange County
HillsboroughCounty
Houston
MemphisCharlotte-
MecklenburgCounty
Baltimore
NewarkPhiladelphiaDetroitChicago
Albuquerque
San Francisco
Fresno
San BernardinoLos Angeles
San Diego
WashingtonD.C.
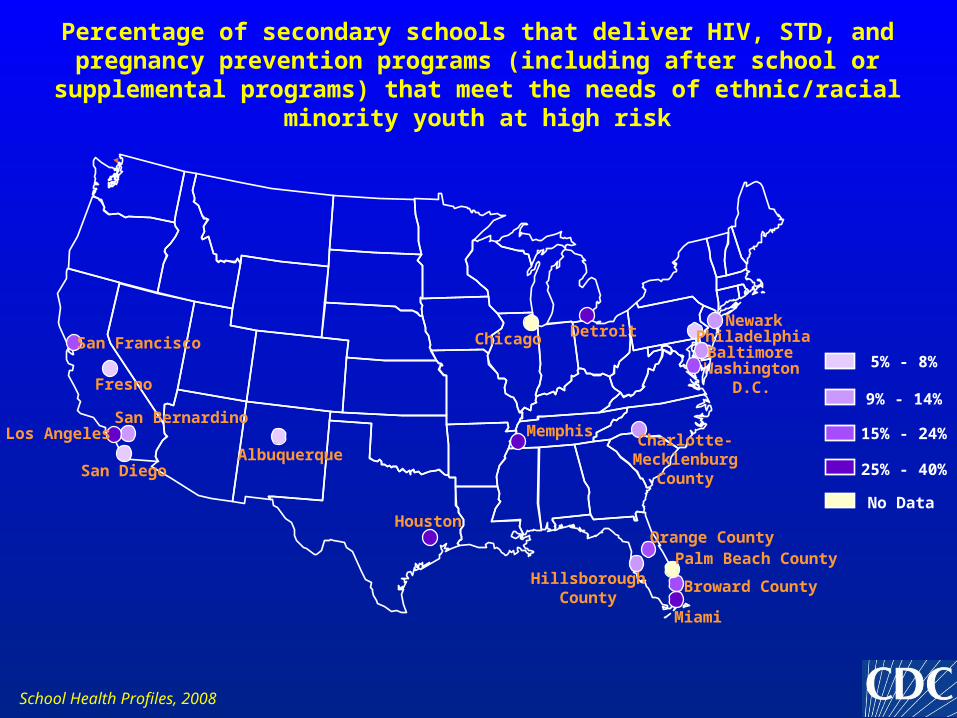
Percentage of secondary schools that deliver HIV, STD, and pregnancy prevention programs (including after school or supplemental programs) that
meet the needs of ethnic/racial minority youth at high risk
5% - 8%
9% - 14%
15% - 24%
25% - 40%
No Data
School Health Profiles, 2008
Miami
Palm Beach County
Broward County
Orange County
HillsboroughCounty
Houston
MemphisCharlotte-
MecklenburgCounty
Baltimore
NewarkPhiladelphiaDetroitChicago
Albuquerque
San Francisco
Fresno
San BernardinoLos Angeles
San Diego
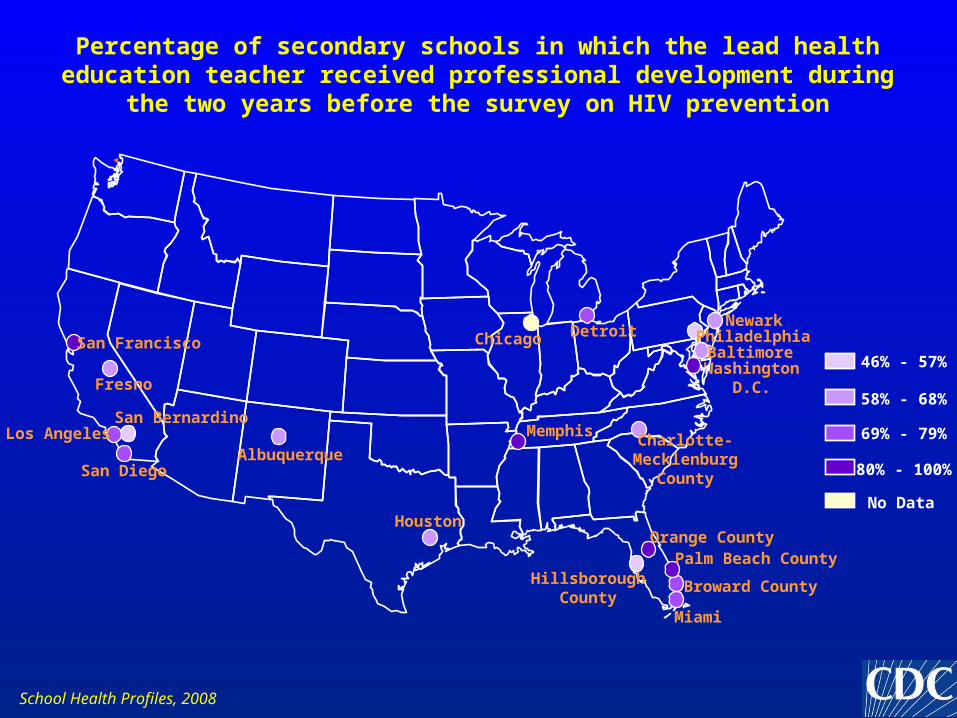
WashingtonD.C.
Percentage of secondary schools in which the lead health education teacher received professional development during the two years before the survey on
HIV prevention
46% - 57%
58% - 68%
69% - 79%
80% - 100%
No Data
School Health Profiles, 2008
Miami
Palm Beach County
Broward County
Orange County
HillsboroughCounty
Houston
MemphisCharlotte-
MecklenburgCounty
Baltimore
NewarkPhiladelphiaDetroitChicago
Albuquerque
San Francisco
Fresno
San BernardinoLos Angeles
San Diego
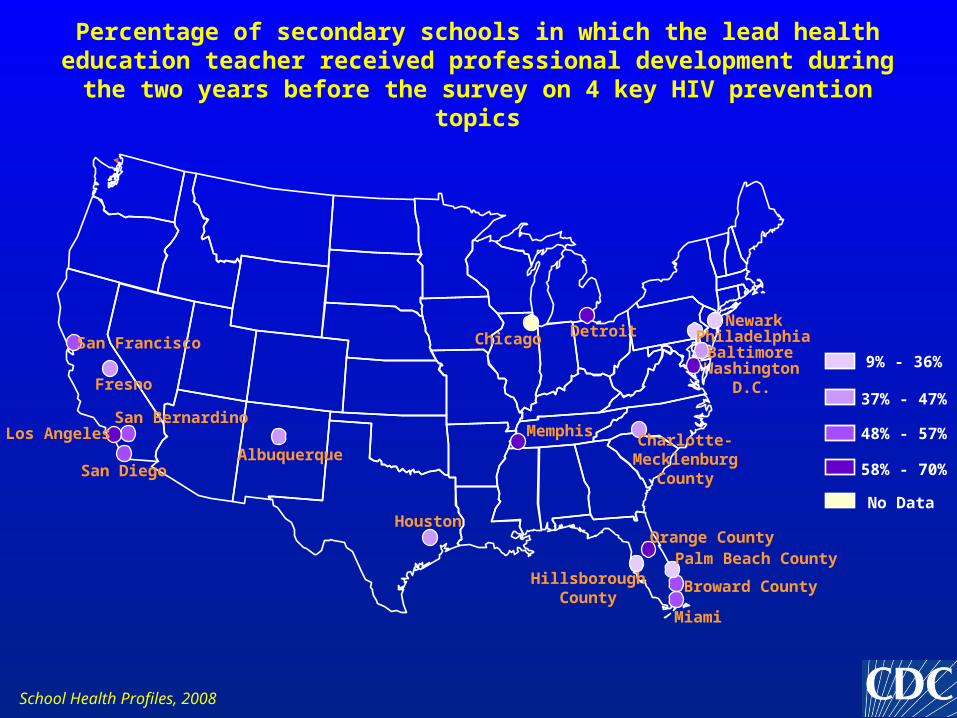
WashingtonD.C.
Percentage of secondary schools in which the lead health education teacher received professional development during the two years before the survey on
4 key HIV prevention topics
9% - 36%
37% - 47%
48% - 57%
58% - 70%
No Data
School Health Profiles, 2008
Miami
Palm Beach County
Broward County
Orange County
HillsboroughCounty
Houston
MemphisCharlotte-
MecklenburgCounty
Baltimore
NewarkPhiladelphiaDetroitChicago
Albuquerque
San Francisco
Fresno
San BernardinoLos Angeles
San Diego

WashingtonD.C.
Percentage of secondary schools in which the lead health education teacher received professional development during the two years before the survey on
at least 6 of 11 key HIV prevention topics
13% - 29%
30% - 41%
42% - 54%
55% - 65%
No Data
School Health Profiles, 2008
Miami
Palm Beach County
Broward County
Orange County
HillsboroughCounty
Houston
MemphisCharlotte-
MecklenburgCounty
Baltimore
NewarkPhiladelphiaDetroitChicago
Albuquerque
San Francisco
Fresno
San BernardinoLos Angeles
San Diego

WashingtonD.C.
Percentage of secondary schools with a gay/straight alliance or similar club
22% - 24%
25% - 33%
34% - 48%
49% - 87%
No Data
School Health Profiles, 2008
Miami
Palm Beach County
Broward County
Orange County
HillsboroughCounty
Houston
MemphisCharlotte-
MecklenburgCounty
Baltimore
NewarkPhiladelphiaDetroitChicago
Albuquerque
San Francisco
Fresno
San BernardinoLos Angeles
San Diego

WashingtonD.C.
Percentage of secondary schools with a policy on students or staff who have HIV infection or AIDS that addresses attendance of students with HIV infection, procedures to protect HIV-infected students and staff from
discrimination, and maintaining confidentiality of HIV-infected students and staff
32% - 41%
42% - 48%
49% - 55%
56% - 76%
No Data
School Health Profiles, 2008
Miami
Palm Beach County
Broward County
Orange County
HillsboroughCounty
Houston
MemphisCharlotte-
MecklenburgCounty
Baltimore
NewarkPhiladelphiaDetroitChicago
Albuquerque
San Francisco
Fresno
San BernardinoLos Angeles
San Diego

WashingtonD.C.
Percentage of secondary schools that provide parents and families health information to increase parent and family knowledge of HIV prevention, STD
prevention, or teen pregnancy prevention
19% - 31%
32% - 39%
40% - 48%
49% - 100%
No Data
School Health Profiles, 2008
Miami
Palm Beach County
Broward County
Orange County
HillsboroughCounty
Houston
MemphisCharlotte-
MecklenburgCounty
Baltimore
NewarkPhiladelphiaDetroitChicago
Albuquerque
San Francisco
Fresno
San BernardinoLos Angeles
San Diego

WashingtonD.C.
Percentage of secondary schools in which students’ family or community members helped develop or implement HIV prevention, STD prevention, or
teen pregnancy prevention policies and programs
16% - 28%
29% - 39%
40% - 47%
48% - 83%
No Data
School Health Profiles, 2008
Miami
Palm Beach County
Broward County
Orange County
HillsboroughCounty
Houston
MemphisCharlotte-
MecklenburgCounty
Baltimore
NewarkPhiladelphiaDetroitChicago
Albuquerque
San Francisco
Fresno
San BernardinoLos Angeles
San Diego

Health Education

WashingtonD.C.
Percentage of secondary schools that required students to take two or more health education courses
0% - 11%
12% - 15%
16% - 40%
41% - 49%
No Data
School Health Profiles, 2008
Miami
Palm Beach County
Broward County
Orange County
HillsboroughCounty
Houston
MemphisCharlotte-
MecklenburgCounty
Baltimore
NewarkPhiladelphiaDetroitChicago
Albuquerque
San Francisco
Fresno
San BernardinoLos Angeles
San Diego

WashingtonD.C.
Among secondary schools that required a health education course, percentage that required students who fail the course to repeat it
0% - 47%
48% - 54%
55% - 62%
63% - 82%
No Data
School Health Profiles, 2008
Miami
Palm Beach County
Broward County
Orange County
HillsboroughCounty
Houston
MemphisCharlotte-
MecklenburgCounty
Baltimore
NewarkPhiladelphiaDetroitChicago
Albuquerque
San Francisco
Fresno
San BernardinoLos Angeles
San Diego

WashingtonD.C.
Percentage of secondary schools with a health education curriculum that addresses all 8 national standards for health education
13% - 50%
51% - 61%
62% - 72%
73% - 95%
No Data
School Health Profiles, 2008
Miami
Palm Beach County
Broward County
Orange County
HillsboroughCounty
Houston
MemphisCharlotte-
MecklenburgCounty
Baltimore
NewarkPhiladelphiaDetroitChicago
Albuquerque
San Francisco
Fresno
San BernardinoLos Angeles
San Diego
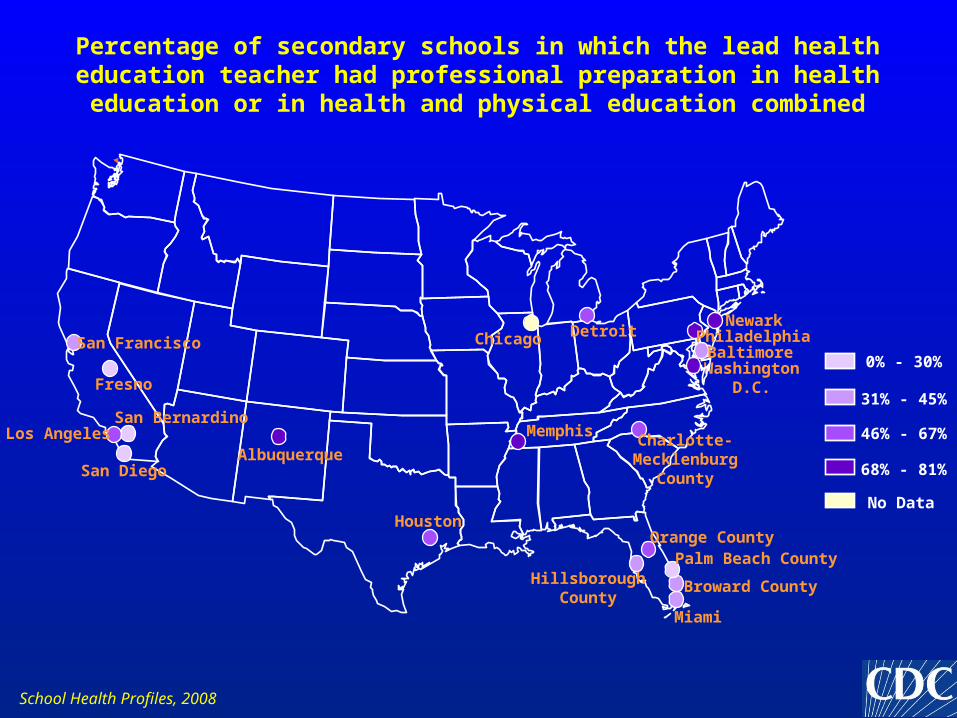
WashingtonD.C.
Percentage of secondary schools in which the lead health education teacher had professional preparation in health education or in health and physical
education combined
0% - 30%
31% - 45%
46% - 67%
68% - 81%
No Data
School Health Profiles, 2008
Miami
Palm Beach County
Broward County
Orange County
HillsboroughCounty
Houston
MemphisCharlotte-
MecklenburgCounty
Baltimore
NewarkPhiladelphiaDetroitChicago
Albuquerque
San Francisco
Fresno
San BernardinoLos Angeles
San Diego

WashingtonD.C.
Percentage of secondary schools in which all staff who teach health education were licensed, certified, or endorsed by the state in health
education
2% - 58%
59% - 73%
74% - 83%
84% - 97%
No Data
School Health Profiles, 2008
Miami
Palm Beach County
Broward County
Orange County
HillsboroughCounty
Houston
MemphisCharlotte-
MecklenburgCounty
Baltimore
NewarkPhiladelphiaDetroitChicago
Albuquerque
San Francisco
Fresno
San BernardinoLos Angeles
San Diego
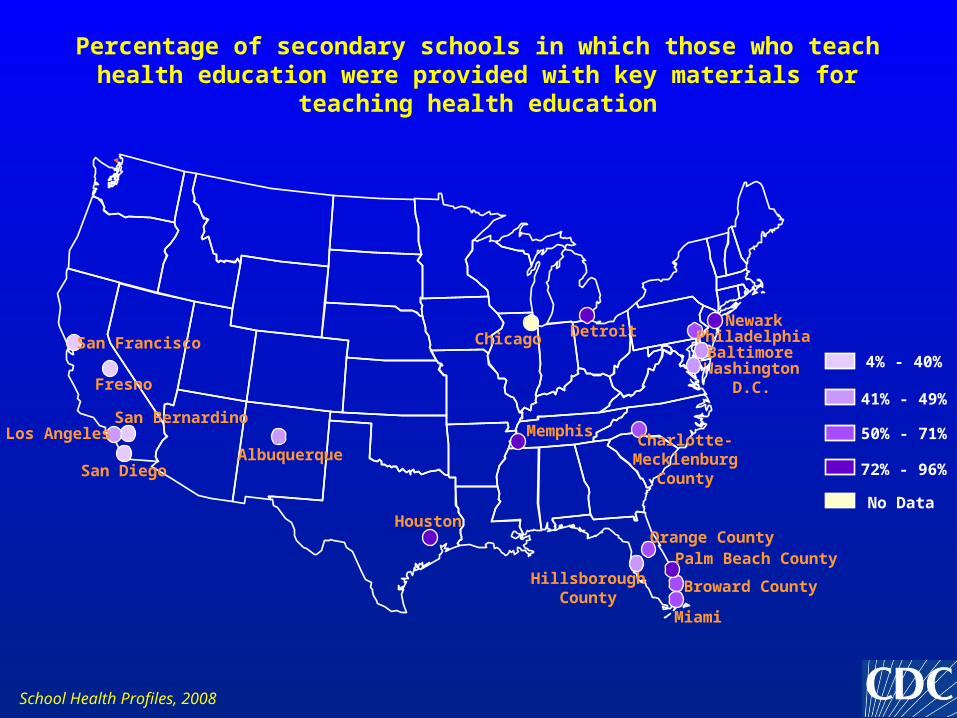
WashingtonD.C.
Percentage of secondary schools in which those who teach health education were provided with key materials for teaching health education
4% - 40%
41% - 49%
50% - 71%
72% - 96%
No Data
School Health Profiles, 2008
Miami
Palm Beach County
Broward County
Orange County
HillsboroughCounty
Houston
MemphisCharlotte-
MecklenburgCounty
Baltimore
NewarkPhiladelphiaDetroitChicago
Albuquerque
San Francisco
Fresno
San BernardinoLos Angeles
San Diego

WashingtonD.C.
Percentage of secondary schools that provided parents and families health information to increase parent and family knowledge of tobacco-use
prevention, physical activity, or nutrition and healthy eating
36% - 51%
52% - 61%
62% - 71%
72% - 83%
No Data
School Health Profiles, 2008
Miami
Palm Beach County
Broward County
Orange County
HillsboroughCounty
Houston
MemphisCharlotte-
MecklenburgCounty
Baltimore
NewarkPhiladelphiaDetroitChicago
Albuquerque
San Francisco
Fresno
San BernardinoLos Angeles
San Diego
Asthma

WashingtonD.C.
Percentage of secondary schools with a full-time registered nurse who provides health services to students at school
10% - 24%
25% - 66%
67% - 79%
80% - 100%
No Data
School Health Profiles, 2008
Miami
Palm Beach County
Broward County
Orange County
HillsboroughCounty
Houston
MemphisCharlotte-
MecklenburgCounty
Baltimore
NewarkPhiladelphiaDetroitChicago
Albuquerque
San Francisco
Fresno
San BernardinoLos Angeles
San Diego
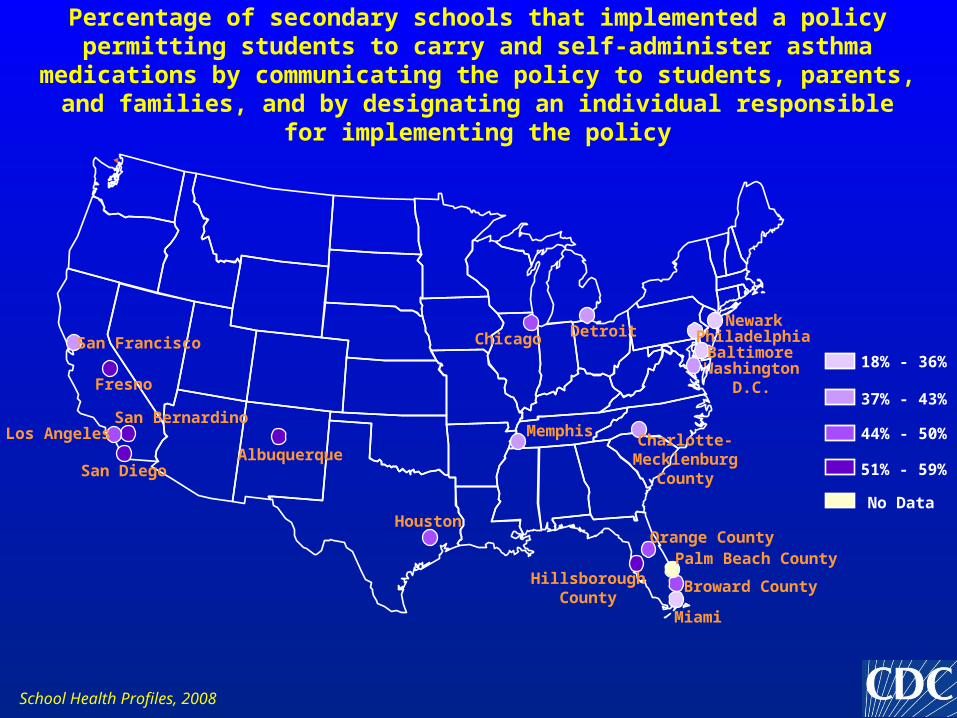
WashingtonD.C.
Percentage of secondary schools that implemented a policy permitting students to carry and self-administer asthma medications by communicating
the policy to students, parents, and families, and by designating an individual responsible for implementing the policy
18% - 36%
37% - 43%
44% - 50%
51% - 59%
No Data
School Health Profiles, 2008
Miami
Palm Beach County
Broward County
Orange County
HillsboroughCounty
Houston
MemphisCharlotte-
MecklenburgCounty
Baltimore
NewarkPhiladelphiaDetroitChicago
Albuquerque
San Francisco
Fresno
San BernardinoLos Angeles
San Diego

WashingtonD.C.
Percentage of secondary schools that had an asthma action plan on file for all students with known asthma
22% - 39%
40% - 50%
51% - 58%
59% - 80%
No Data
School Health Profiles, 2008
Miami
Palm Beach County
Broward County
Orange County
HillsboroughCounty
Houston
MemphisCharlotte-
MecklenburgCounty
Baltimore
NewarkPhiladelphiaDetroitChicago
Albuquerque
San Francisco
Fresno
San BernardinoLos Angeles
San Diego
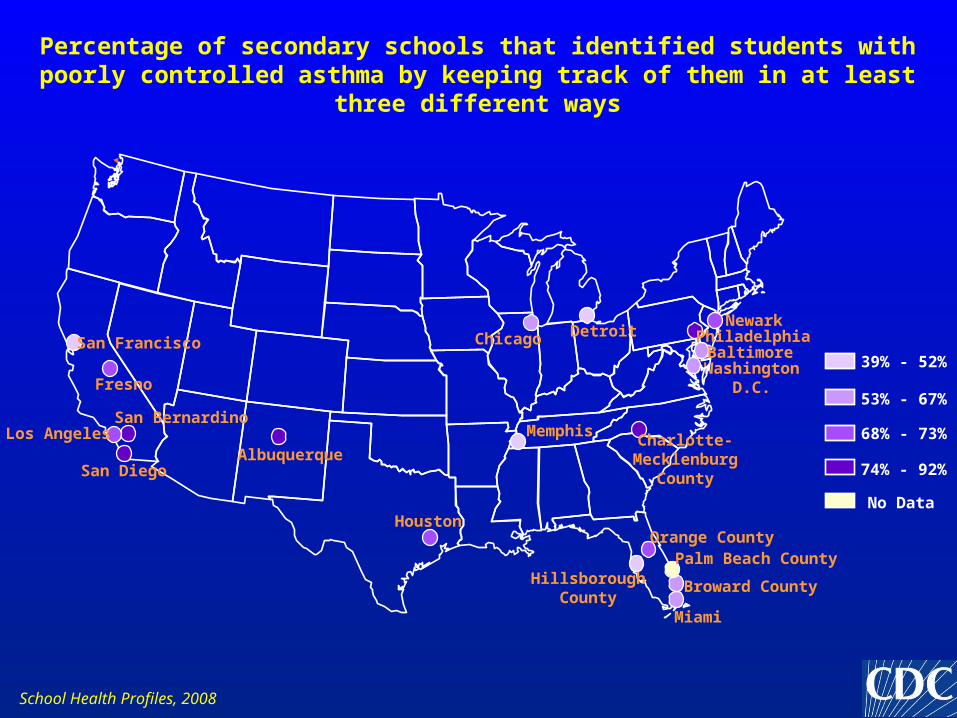
WashingtonD.C.
Percentage of secondary schools that identified students with poorly controlled asthma by keeping track of them in at least three different ways
39% - 52%
53% - 67%
68% - 73%
74% - 92%
No Data
School Health Profiles, 2008
Miami
Palm Beach County
Broward County
Orange County
HillsboroughCounty
Houston
MemphisCharlotte-
MecklenburgCounty
Baltimore
NewarkPhiladelphiaDetroitChicago
Albuquerque
San Francisco
Fresno
San BernardinoLos Angeles
San Diego
WashingtonD.C.
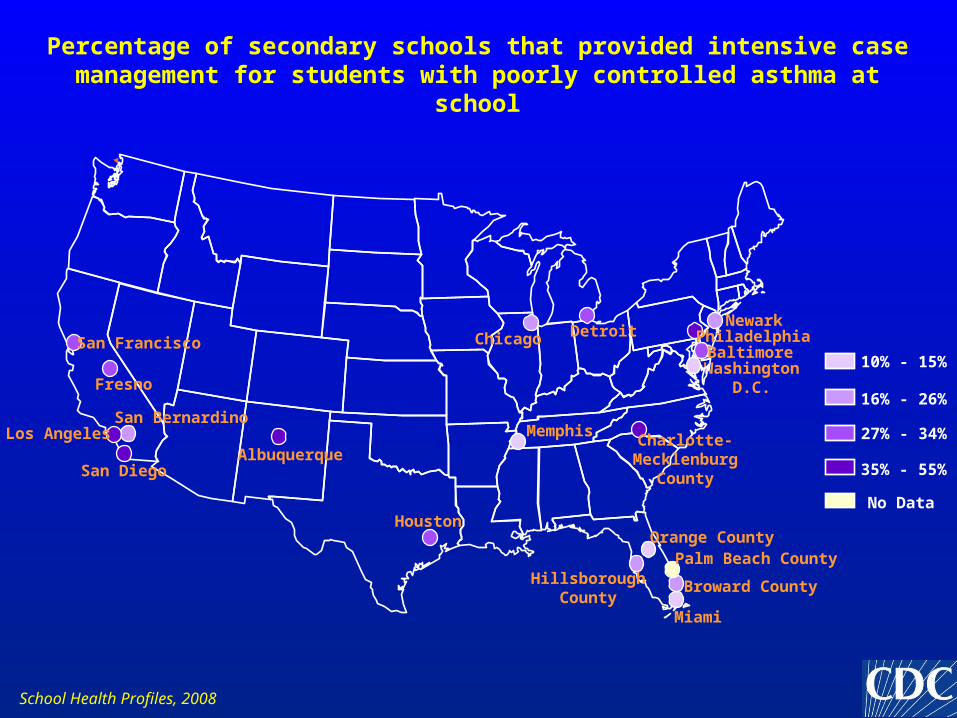
Percentage of secondary schools that provided intensive case management for students with poorly controlled asthma at school
10% - 15%
16% - 26%
27% - 34%
35% - 55%
No Data
School Health Profiles, 2008
Miami
Palm Beach County
Broward County
Orange County
HillsboroughCounty
Houston
MemphisCharlotte-
MecklenburgCounty
Baltimore
NewarkPhiladelphiaDetroitChicago
Albuquerque
San Francisco
Fresno
San BernardinoLos Angeles
San Diego

WashingtonD.C.
Percentage of secondary schools that required all school staff members to receive annual training on recognizing and responding to severe asthma
symptoms
31% - 40%
41% - 56%
57% - 69%
70% - 90%
No Data
School Health Profiles, 2008
Miami
Palm Beach County
Broward County
Orange County
HillsboroughCounty
Houston
MemphisCharlotte-
MecklenburgCounty
Baltimore
NewarkPhiladelphiaDetroitChicago
Albuquerque
San Francisco
Fresno
San BernardinoLos Angeles
San Diego

WashingtonD.C.
Percentage of secondary schools that provided parents and families of students with health information to increase their knowledge of asthma
14% - 25%
26% - 39%
40% - 48%
49% - 62%
No Data
School Health Profiles, 2008
Miami
Palm Beach County
Broward County
Orange County
HillsboroughCounty
Houston
MemphisCharlotte-
MecklenburgCounty
Baltimore
NewarkPhiladelphiaDetroitChicago
Albuquerque
San Francisco
Fresno
San BernardinoLos Angeles
San Diego

WashingtonD.C.
Percentage of secondary schools in which students’ family or community members helped develop or implement asthma management policies and
programs
15% - 23%
24% - 32%
33% - 37%
38% - 75%
No Data
School Health Profiles, 2008
Miami
Palm Beach County
Broward County
Orange County
HillsboroughCounty
Houston
MemphisCharlotte-
MecklenburgCounty
Baltimore
NewarkPhiladelphiaDetroitChicago
Albuquerque
San Francisco
Fresno
San BernardinoLos Angeles
San Diego