local seats for local people: reviewing the boundary review
DESCRIPTION
By Robert McIlveen. Edited by Natalie Evans. Local Seats for Local People? finds that the Boundary Review process in the UK is inefficient and produces undemocratic results. The last Boundary Review took seven years, whereas countries such as New Zealand and Australia manage to conduct theirs in six months. The report sets out proposals which will drastically reduce the time taken to conduct a review, depoliticise the process and ultimately improve representation.TRANSCRIPT
1
October 2010
Local Seats For Local People?
Reviewing the Boundary Review
Dr Robert McIlveen. Edited by Natalie Evans
Executive Summary
The government is pressing ahead with a rapid Boundary Review which aims to equalise the size of electorates
throughout the country. The aim of equal‐sized seats is correct and indeed overdue. However, the Bill before
Parliament does not go far enough, fast enough.
Bias in this research note is understood as the electoral system rewarding parties unevenly, not necessarily
unfairly. There are several different components of the electoral system’s uneven rewards, including
constituency size, turnout and the effects of minor parties. While constituency size is not the largest source of
bias (differing levels of turnout in seats won by the various parties is consistently worth more to Labour) it is
substantial and, more importantly, the only major source of unfair bias. In 2010, 18 seats out of a net total bias
to Labour of 54 seats were due to different constituency sizes.
There are significant regional and national differences in constituency size, with Wales being significantly
overrepresented. 38 out of 40 Welsh constituencies have a smaller electorate than the smallest constituency
in the South East of England, one of the most under‐represented regions. Also, 36 of 40 Welsh seats are
among the 100 smallest seats in the UK. The smallest mainland seat, Arfon, is less than half the size of 21 other
constituencies.
Locally there are absurd examples of different seat sizes – neighbouring London seats East Ham and Leyton
and Wanstead have electorates of 90,674 and 63,541 respectively. This is democratically indefensible.
The cause of the wildly varying size of electorates is the outdated way boundaries are redrawn. The Boundary
Commission process has become politicised, with professional party operatives touring the country lobbying
for the most generous boundaries they can achieve for their party. This drags the process out – the last review
took seven years. Australia and New Zealand manage the same process in 6 months. Even more impressively,
New Zealand managed to deal with all complaints in just six days in 2002.
The Bill proposes a maximum geographic size for constituencies, which is unjustifiable – around one fifth of
constituencies in Australia and Canada are larger than this limit, and each of those countries have two
research note October 2010
2
constituencies more than 100 times the size. Sparsely populated seats may require more travel or staffing
allowances but in the modern world they do not justify undemocratic over‐representation.
Analysing the last review demonstrates three important problems, all of which can be fixed quite simply. The
Bill before Parliament addresses two of these, but could do so better; while it ignores the third.
• The size of review areas – one or more local authority areas which is divided into constituencies – is
often far too small to enable equal‐sized seats. There is a correlation between how many seats are in
a review area and how even the result is. Larger review areas, such as Kent or West Yorkshire,
produce much more even outcomes.
• The public inquiry has been taken over by the political parties and actually makes the results less even
overall. As well as taking far too long, it should be depoliticised by removing the ability of the political
parties to lobby for more generous boundaries. The 1990s review was scored as a ‘win’ for Labour,
while the most recent review was more balanced. That the review is being scored like a sports match
demonstrates how politicised it has become.
• Finally, population change, especially when the review takes the best part of a decade, produces
extremely divergent constituencies. Some constituencies grew 16% between the start of the last
review and the first use of the boundaries, while others shrank by more than 14%. That the shrinking
seats tend to be in Labour strongholds is a major source of bias. Speeding up the review would help;
using projected electorate estimates would eliminate the problem entirely, making seats fair at the
election at which they are used.
The Bill currently before Parliament is a step in the right direction, but will not go far enough to ensure fair
seat sizes. The government should go further, faster.
Improving recommendations already in the Bill
1. The Boundary Review process should be reformed to depoliticise it and make it much more efficient. The
political parties have learnt to manipulate the public inquiry which has made it more vulnerable to
gerrymandering, albeit competitive and transparent gerrymandering. This should be changed to allow effective
local representation but to restrain the professional party operatives from turning the review into drawn‐out
theatre.
2. Representations to the Commission should be in writing and time‐limited. The proposed 12‐week limit
may be too generous to the political parties’ national organisations, and should be reconsidered. 30 days is
adequate for genuine local objections and too tight for national party organisations to try to gain benefit
everywhere.
3. There should be a single, UK‐wide electoral quota. After devolution there is no democratic justification for
over‐representation of Wales, Scotland or Northern Ireland which previously had more seats per population
3
than England. Scotland has already been brought into line with England; there is no reason Wales should
continue to be 25% over‐represented. This is part of the government’s proposals and must be implemented.
Recommendations to go further, faster or better
4. Time limits should be enacted to prevent the review taking excessively long. Australia and New Zealand
can draw up their seats in 6 months; it should not take longer than a year to re‐draw the UK’s.
5. The review should use projected electorate figures. Constituencies should be approximately equal at the
time of their use, not ten years after as was the case for the ‘new’ constituencies used in 2010. By shortening
the timescale of the review and using ONS projections the constituencies can be fair at the election they are
used in. At the very least, expected population change should be included in the list of factors the Commission
may take into account.
6. The Boundary Commission should group constituencies into larger review areas. Review areas of more
than 10 seats were much closer to the quota than smaller ones, due to simple mathematics. Equality of
representation is more important than local council boundaries, and this should be reflected in grouping seats
to ensure closer adherence to the mean which implies more frequent cross‐district seats. This would result in
more even sized seats in urban areas which tend to have far too small review areas, rather than having very
large and very small seats next to each other.
7. There should be a review immediately after each election. This would make each review less radical and
allow more time than the current proposals for the parties and local authorities to adjust to new boundaries.
Rather than have absolutely regular reviews, this maximises the gap between new constituencies being drawn
and their use, even though they have been drawn to have equal electorates at the time of use.
8. The maximum geographic size limit for constituencies should be removed. There is no democratic
justification for undersized constituencies in an age of very advanced communications. Extra transport or
staffing allowances might be justified; over‐representation is not.
Introduction
The coalition government’s Parliamentary Voting System and Constituencies Bill includes provisions to both
reduce the number of MPs and to equalise their electorates. Introducing the Bill, the Deputy Prime Minister
cited a “deep unfairness” in the current system, including the very unequal size of seats in different parts of
the country.1 He also made the case that the House of Commons is unusually large among other legislatures.
That constituency sizes vary significantly is a familiar part of the British system. This state of affairs has become
particularly important in the wake of devolution and the geographic polarisation that translates the difference
in constituency size into an advantage for the Labour Party. The key here is the electoral quota – the number
of electors the Boundary Commission aims to place into each constituency.
4
It has long been recognised that there is a bias in the electoral system, as a result of various different factors.
This has evolved from several sources: voter behaviour, party competition and the out‐of‐date way boundaries
are reviewed. For the last four elections there has been a very considerable bias to the Labour Party, giving it
massive majorities on historically unremarkable shares of the vote (1997 and 2001) and a large majority on the
lowest ever winning share (2005). In 2010 the electoral system rewarded Labour with a significant share of
seats in the House of Commons on the party’s second lowest share of the vote since 1918.
The fifth Boundary Review produced the new seats in use for the first time in the general election of 2010.
That it started in 2000, and took seven years to complete, should be a cause for reform in itself. That it
manifestly failed to deliver constituencies anywhere near equal size is more worrying. Previous reviews,
reporting in 1954, 1969, 1983 and 1995 demonstrate several trends: gradually improving equality of electorate
size, albeit from a low base and with remaining large variations, counterbalanced by growing politicisation and
increasing length of time taken over the review.
There are many ways in which the Boundary Review process itself could be improved. It has become so drawn
out in part because of a political competition between the parties to ‘win’ each review area – in other words,
competitive gerrymandering. This contrasts with the brisk efficiency of Australia and New Zealand which
typically take 6 months to redraw all boundaries.
There are two good reasons to reform how we draw constituency boundaries: efficiency and democracy.
Neither is well served by the current system – and neither will be sufficiently addressed by the reform on offer
by the government. They can, and should, go further, faster.
Key terms and dates
Electoral Quota: the number of voters the Boundary Commission aims to deliver in each constituency.
Previously different in each part of the union, the government proposes equalising it across the UK.
Review Areas: one or more local authority areas which the Boundary Commission divides up into
constituencies.
Periodic Review: the regular (every eight to twelve years) redrawing of constituency boundaries. The date
each reported is in the table:
First Periodic Review 1954
Second Periodic Review 1969
Third Periodic Review 1983
Fourth Periodic Review 1995
Fifth Periodic Review 2007
5
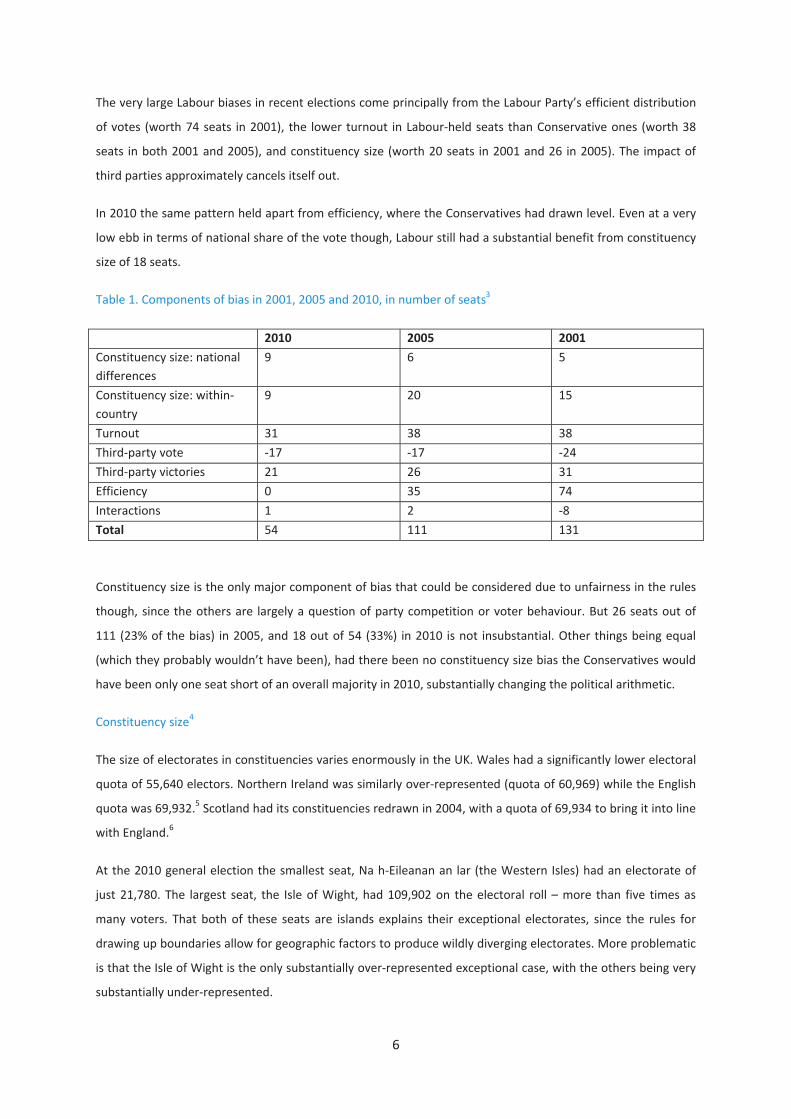
Bias in the electoral system
There has long been a partisan bias in the electoral system – defined as the system rewarding one party more
generously than the other from the same vote share. This is due to several different components. The total
bias has changed over time, from a moderately strong pro‐Conservative bias in the 1950s and early 1960s,
approximate neutrality from the early 1960s up to 1992, and then a very strong pro‐Labour bias since. In
Figure 1, a positive number indicates a pro‐Labour bias and a negative number a pro‐Conservative bias.2
Figure 1. Bias in UK general elections since 1950, in number of seats
Johnston et al disaggregated the components of the bias for the 2001, 2005 and 2010 elections (Table 1). This
is reported as number of seats the bias is worth to each party, with a positive figure being a pro‐Labour bias
and a negative one a pro‐Conservative bias.
100
150
-100
-50
0
50
1950
1951
1955
1959
1964
1966
1970
1974F
1974O
1979
1983
1987
1992
1997
2001
2005
2010
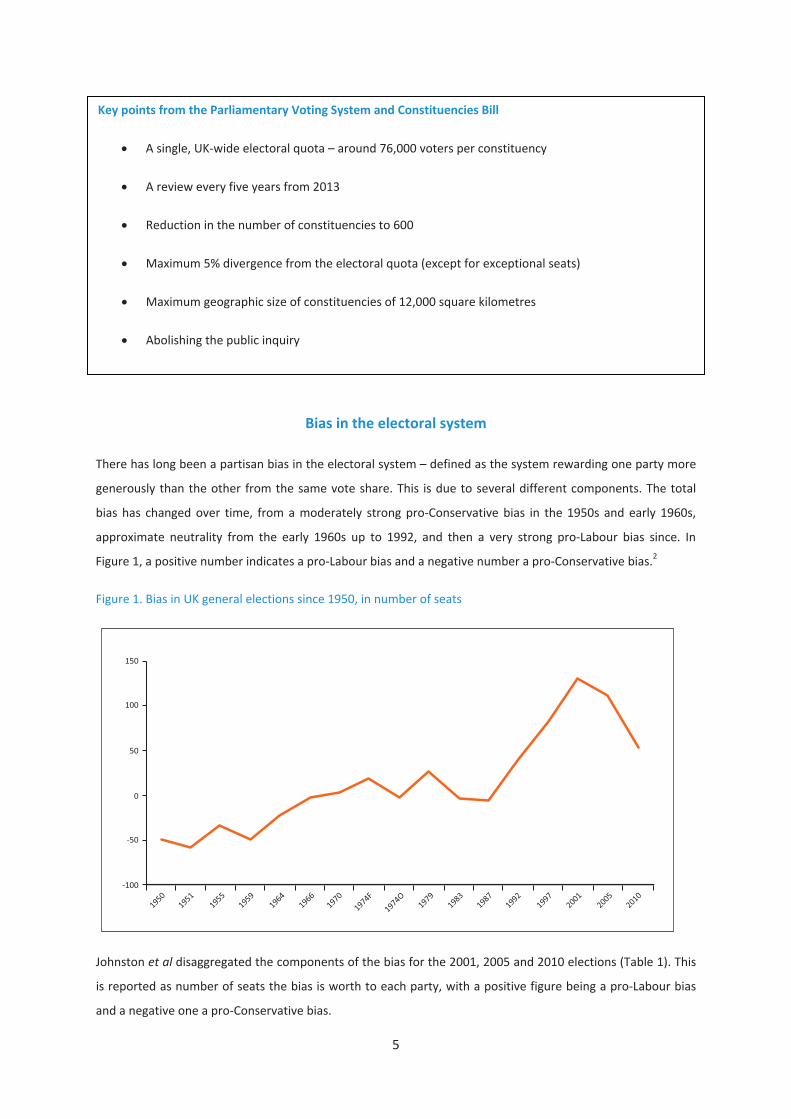
Key points from the Parliamentary Voting System and Constituencies Bill
• A single, UK‐wide electoral quota – around 76,000 voters per constituency
• A review every five years from 2013
• Reduction in the number of constituencies to 600
• Maximum 5% divergence from the electoral quota (except for exceptional seats)
• Maximum geographic size of constituencies of 12,000 square kilometres
• Abolishing the public inquiry
100
150
-100
-50
0
50
19501951
19551959
19641966
19701974F
1974O1979
19831987
19921997
20012005
2010
6
The very large Labour biases in recent elections come principally from the Labour Party’s efficient distribution
of votes (worth 74 seats in 2001), the lower turnout in Labour‐held seats than Conservative ones (worth 38
seats in both 2001 and 2005), and constituency size (worth 20 seats in 2001 and 26 in 2005). The impact of
third parties approximately cancels itself out.
In 2010 the same pattern held apart from efficiency, where the Conservatives had drawn level. Even at a very
low ebb in terms of national share of the vote though, Labour still had a substantial benefit from constituency
size of 18 seats.
Table 1. Components of bias in 2001, 2005 and 2010, in number of seats3
2010 2005 2001
Constituency size: national differences
9 6 5
Constituency size: within‐country
9 20 15
Turnout 31 38 38
Third‐party vote ‐17 ‐17 ‐24
Third‐party victories 21 26 31
Efficiency 0 35 74
Interactions 1 2 ‐8
Total 54 111 131
Constituency size is the only major component of bias that could be considered due to unfairness in the rules
though, since the others are largely a question of party competition or voter behaviour. But 26 seats out of
111 (23% of the bias) in 2005, and 18 out of 54 (33%) in 2010 is not insubstantial. Other things being equal
(which they probably wouldn’t have been), had there been no constituency size bias the Conservatives would
have been only one seat short of an overall majority in 2010, substantially changing the political arithmetic.
Constituency size4
The size of electorates in constituencies varies enormously in the UK. Wales had a significantly lower electoral
quota of 55,640 electors. Northern Ireland was similarly over‐represented (quota of 60,969) while the English
quota was 69,932.5 Scotland had its constituencies redrawn in 2004, with a quota of 69,934 to bring it into line
with England.6
At the 2010 general election the smallest seat, Na h‐Eileanan an lar (the Western Isles) had an electorate of
just 21,780. The largest seat, the Isle of Wight, had 109,902 on the electoral roll – more than five times as
many voters. That both of these seats are islands explains their exceptional electorates, since the rules for
drawing up boundaries allow for geographic factors to produce wildly diverging electorates. More problematic
is that the Isle of Wight is the only substantially over‐represented exceptional case, with the others being very
substantially under‐represented.
7
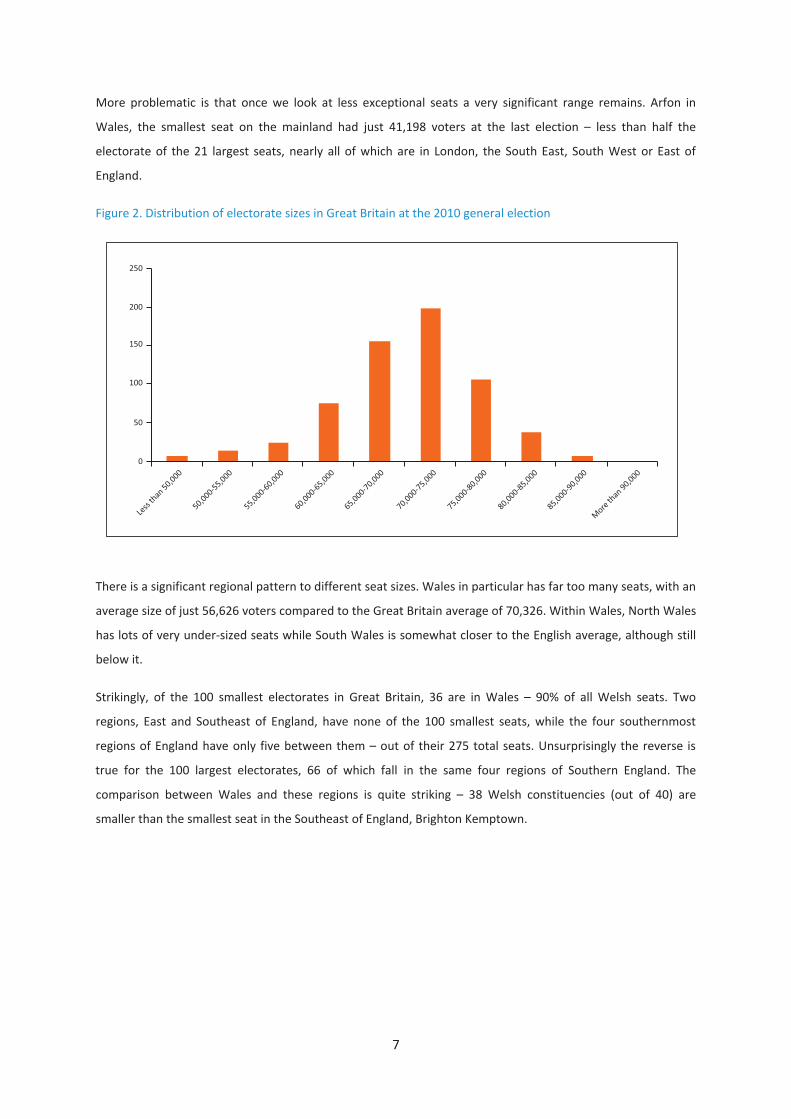
More problematic is that once we look at less exceptional seats a very significant range remains. Arfon in
Wales, the smallest seat on the mainland had just 41,198 voters at the last election – less than half the
electorate of the 21 largest seats, nearly all of which are in London, the South East, South West or East of
England.
Figure 2. Distribution of electorate sizes in Great Britain at the 2010 general election
There is a significant regional pattern to different seat sizes. Wales in particular has far too many seats, with an
average size of just 56,626 voters compared to the Great Britain average of 70,326. Within Wales, North Wales
has lots of very under‐sized seats while South Wales is somewhat closer to the English average, although still
below it.
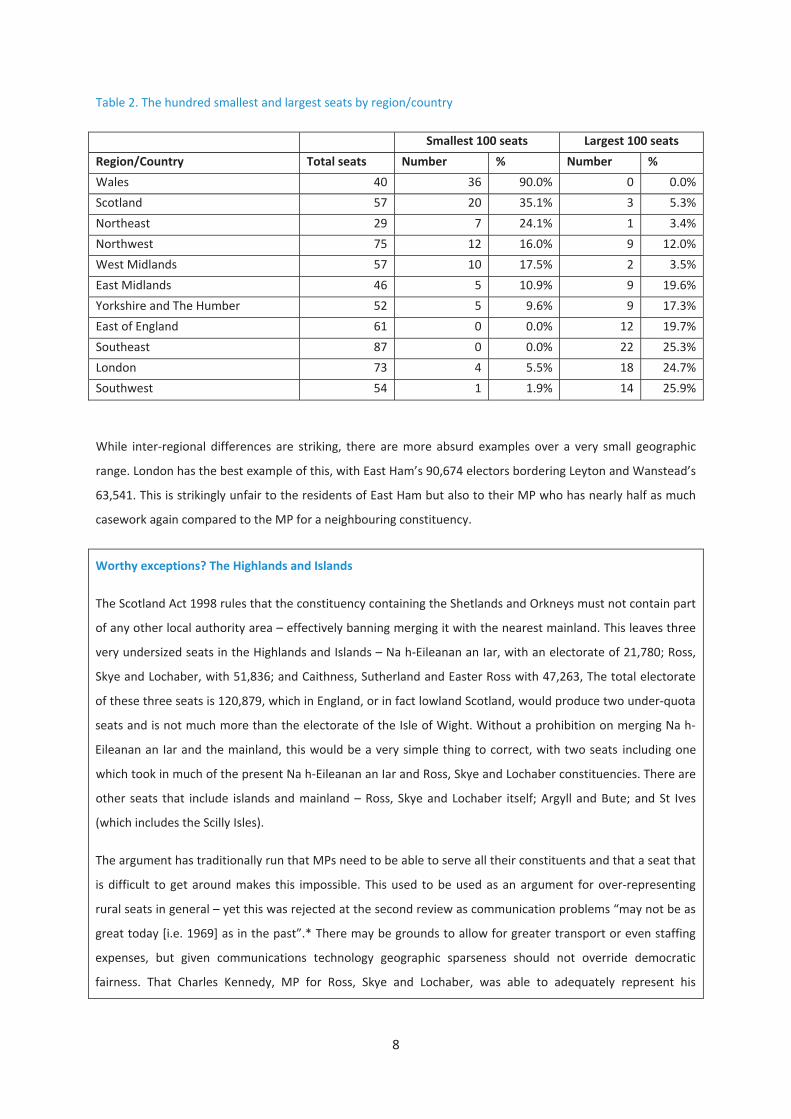
Strikingly, of the 100 smallest electorates in Great Britain, 36 are in Wales – 90% of all Welsh seats. Two
regions, East and Southeast of England, have none of the 100 smallest seats, while the four southernmost
regions of England have only five between them – out of their 275 total seats. Unsurprisingly the reverse is
true for the 100 largest electorates, 66 of which fall in the same four regions of Southern England. The
comparison between Wales and these regions is quite striking – 38 Welsh constituencies (out of 40) are
smaller than the smallest seat in the Southeast of England, Brighton Kemptown.
100
200
0
150
250
50
Less
than
50,000
50,000-55,000
55,000-60,000
60,000-65,000
65,000-70,000
70,000-75,000
75,000-80,000
80,000-85,000
85,000-90,000
More
than
90,000
8
Table 2. The hundred smallest and largest seats by region/country
Smallest 100 seats Largest 100 seats
Region/Country Total seats Number % Number %
Wales 40 36 90.0% 0 0.0%
Scotland 57 20 35.1% 3 5.3%
Northeast 29 7 24.1% 1 3.4%
Northwest 75 12 16.0% 9 12.0%
West Midlands 57 10 17.5% 2 3.5%
East Midlands 46 5 10.9% 9 19.6%
Yorkshire and The Humber 52 5 9.6% 9 17.3%
East of England 61 0 0.0% 12 19.7%
Southeast 87 0 0.0% 22 25.3%
London 73 4 5.5% 18 24.7%
Southwest 54 1 1.9% 14 25.9%
While inter‐regional differences are striking, there are more absurd examples over a very small geographic
range. London has the best example of this, with East Ham’s 90,674 electors bordering Leyton and Wanstead’s
63,541. This is strikingly unfair to the residents of East Ham but also to their MP who has nearly half as much
casework again compared to the MP for a neighbouring constituency.
Worthy exceptions? The Highlands and Islands
The Scotland Act 1998 rules that the constituency containing the Shetlands and Orkneys must not contain part
of any other local authority area – effectively banning merging it with the nearest mainland. This leaves three
very undersized seats in the Highlands and Islands – Na h‐Eileanan an Iar, with an electorate of 21,780; Ross,
Skye and Lochaber, with 51,836; and Caithness, Sutherland and Easter Ross with 47,263, The total electorate
of these three seats is 120,879, which in England, or in fact lowland Scotland, would produce two under‐quota
seats and is not much more than the electorate of the Isle of Wight. Without a prohibition on merging Na h‐
Eileanan an Iar and the mainland, this would be a very simple thing to correct, with two seats including one
which took in much of the present Na h‐Eileanan an Iar and Ross, Skye and Lochaber constituencies. There are
other seats that include islands and mainland – Ross, Skye and Lochaber itself; Argyll and Bute; and St Ives
(which includes the Scilly Isles).
The argument has traditionally run that MPs need to be able to serve all their constituents and that a seat that
is difficult to get around makes this impossible. This used to be used as an argument for over‐representing
rural seats in general – yet this was rejected at the second review as communication problems “may not be as
great today [i.e. 1969] as in the past”.* There may be grounds to allow for greater transport or even staffing
expenses, but given communications technology geographic sparseness should not override democratic
fairness. That Charles Kennedy, MP for Ross, Skye and Lochaber, was able to adequately represent his
9
constituents while leading a major UK political party does not support the case that it is not possible for an MP
to represent a sparsely‐populated constituency.
*Rossiter et al, The Boundary Commissions, p165
How many MPs?
Reducing the number of MPs is a separate issue to equal sized constituencies. The number of MPs has always
been set by Parliament, and is large by international standards, having more MPs than Germany despite a
smaller population, for example. Intriguingly, the size of most national legislatures are close to the cube root of
each country’s populations – the so‐called “cube root law”.7 For the UK this would produce a Parliament of
around 400, making the trimming of 50 MPs suggested by the government not remarkably radical. The
Parliament Act (1944) stipulated that Great Britain should have “not substantially greater or fewer than 591
constituencies”.8 This had crept up by the 1986 Act to 613.9 At 650 MPs, the House now substantially exceeds
this for no good democratic reason. In fact, if we were to take the reduction in Scottish seats after devolution
into account, that 613 becomes (by design or coincidence) the government’s figure of 600. The bigger change
is the precision around the number: previously it was “not substantially more or fewer than”; the Bill currently
going through Parliament stipulates exactly 600 seats.
Both the 1944 and 1986 acts included minimum numbers of MPs for the constituent parts of the UK other than
England. In the 1986 Act, Wales was guaranteed a minimum of 35 and Northern Ireland no more than 18 and
no fewer than 16. Prior to the Scotland Act (1998) which removed the entitlement, Scotland was entitled to no
fewer than 71. That Scotland’s minimum entitlement has been removed in the wake of devolution suggests
that Wales and Northern Ireland should no longer enjoy a minimum entitlement or the separate constituency
quota that entails. This is reflected in the absence of such a quota in the new Bill and the UK‐wide quota.
The process of the Boundary Review
There are seven steps in the Boundary Review process, which take a varying amount of time. The first task is
for the government to decide how many seats should be drawn up and thus what the electoral quota is.
Previously, this involved deciding how many seats to allocate to England, Wales, Scotland and Northern Ireland
separately, leading to quite divergent quotas for each country. The quota is the size of electorate the Boundary
Commission aims for in each seat. At the last review it was 69,932 electors per seat in England but only 55,640
in Wales.10
The second and third steps underline one of the most important aspects of how we draw boundaries. The
quota is applied to local authority areas, which in some cases are combined where they represent an
unfeasible number of seats, for example combining Richmond upon Thames, which has an entitlement to 1.74
10
seats with Kingston upon Thames, which has an entitlement of 1.43, creating a joint area with an entitlement
of 3.17 seats.
The next step is for the Boundary Commission to draw up provisional recommendations for constituencies and
publish them. These are then debated at the public inquiry stage, which can be lengthy. After the inquiry, the
Commission makes its final decisions and the recommendations go back to Parliament to be passed into law.11
The steps that might be considered for reform, especially in the context of aiming for equal‐sized seats, can be
grouped into those to do with the quota and groupings, and the local inquiry. Setting the quota is relatively
simple, although the inequality between different parts of the UK must surely be ripe for change. How local
authority areas are grouped is vital to consider since this is one major source of very uneven seat sizes. The
quota and groupings should be set in as transparent a manner as possible – at present the rules are very
ambiguous. While groupings are probably necessary to ensure the area under discussion is comprehensible to
those discussing it, they must be large enough to allow equal‐sized seats to be drawn.
The local inquiry has become rather politicised and causes the whole process to drag out for years longer than
it should. There is no real benefit to anyone other than the political parties in playing games with the
boundaries, especially as they tend to cancel out unless one party is much better than its competitors.
The history of the Boundary Reviews
Regular Boundary Reviews are surprisingly new, with the most recent one being only the fifth. The
requirement for periodic reviews was introduced only by the 1944 Act with subsequent reviews reporting
every ten years or so. While they have always been formally independent, the potential for political gaming
has always been present. For example, the second periodic review reported reasonably close to an expected
election, leading the Wilson government to seek to delay its introduction until after the election by instructing
its own backbenchers to vote it down. Conversely the fourth review, which was expected benefit the
incumbent Conservatives ahead of a difficult election was pushed through on a short timescale.12
The political party games do not end at timing. Within each review area, there is a contest between the major
parties to obtain the best boundaries for them. This is often achieved by getting their opponents’ strong wards
all in the same seat and tilting the rest of the area to themselves. As Rossiter et al note, all the political parties
“have become skilled at exploiting the public inquiry” to their own ends.13
The 1990s review was an excellent example of this. The battle between the two parties was scored by Rossiter
et al as being won by Labour by 40 review areas to 31. This was the fruit of a long‐run strategy within the party
that comprehensively outdid the Conservatives. The Boundary Strategy Group, headed by Margaret Beckett
among others, ensured that Labour took the 1990s review much more seriously than their opponents, with a
better funded team, more focus from senior party figures and a better understanding of how to maximise their
gains from it. The result was that the boundary changes that should have helped the Conservatives were
blunted.14
11
That any political party can ‘win’ a review tells us how politicised the process has become. In the fifth review,
which reported in 2007, the case of Kidsgrove ward in Staffordshire shows what can happen at the local
inquiry. This urban ward is very strongly Labour and had the potential to tip Staffordshire Moorlands from
being strongly Conservative to tightly marginal. In the public inquiry a very detailed debate took place between
Roger Pratt, the Conservative Party’s representative and the Charlotte Atkins, the Labour MP for the
predecessor seat covering (among other things) how to divide a village (whether a railway line was a more
significant boundary than a road) and how a school’s admissions would be affected by its two sites being in
different constituencies.15 In this case the Conservatives prevailed, and Kidsgrove was finally placed in Stoke‐
on‐Trent North, leaving Staffordshire Moorlands a comfortably safe Conservative seat.
There is an odd touring competition between party representatives. For the fifth review, Greg Cook for Labour
and Roger Pratt for the Conservatives spoke at local inquiries across the country, cross‐examining each other
and various other witnesses. This in part explains why it took so long, since none of the inquiries could take
place simultaneously. That the local inquiry had to be held in person with these party representatives is the
main reason for it taking seven years, which must be addressed.
The public inquiry is one of the major reasons that the Boundary Review process can take so long. Rossiter et
al note the large increase in submissions to the Boundary Review on the basis of ‘local ties’ between parts of
the constituency, which are often used as cover for political advantage. This is essentially gerrymandering,
although at least it is competitive and semi‐transparent.16
Local Government boundaries
Any reform of the process should address the importance of local authority boundaries relative to other
factors. They are currently given significant prominence in the rules of Boundary Reviews, being taken as
constituting ‘natural communities’. This is reflected in the reluctance of the Boundary Commission to cross
boundaries between bordering boroughs. While the Bill currently before Parliament does retain reference to
local authority boundaries, it does make clear that they are a secondary factor after equality of electorate size.
Local government wards are sensible building blocks for constituencies since they already exist for elections.
The problem comes in fitting them together within discrete local authorities to make constituencies. Since few
local authorities neatly divide into a whole number of constituencies there is a choice between either allowing
constituencies to cover wards from more than one local authority or to compromise on equal seat sizes.
The argument that local authorities represent ‘natural communities’ seems a weak justification for unequal
constituency sizes. While some county borders do have emotional importance – Cornish objections to a
constituency drawn across the border with Devon are already being made – most do not, and many have
themselves moved or been redrawn over time. Setting the rules out clearly to allow natural communities to be
taken into account but not at the cost of equal constituency sizes would be a sensible settlement between two
sometimes irreconcilable claims.
12
International alternatives17
Comparing the UK to other countries with similar constitutions – Canada, Australia and New Zealand – shows
several differences well worth considering. Canada has similar problems to the UK, including the distribution of
seats between provinces. Those with the slowest growing populations have become over‐represented over
time while the fastest‐growing provinces (Ontario, Alberta and British Columbia) have become progressively
under‐represented.
However, the really interesting cases are Australia and New Zealand. Perhaps most striking is how quickly they
are able to redraw seats. In New Zealand, the review must be complete within 6 months of starting and in
Australia the process typically takes a similar length of time. Objections in New Zealand are also dealt with very
quickly: 12 days in 1995, 11 days in 1998 and just 6 days in 2002 to consider all objections to those years’ re‐
districtings. Compare this to the length of the last Boundary Review in England, which started in February 2000
and was only laid before Parliament in February 2007.18
The status of the Boundary Commission is also slightly different. In New Zealand rather than having political
parties petitioning the review, two out of seven members of the commission are appointed by the main
political parties. Since they are heavily outvoted by non‐partisan civil servants who make up the rest of the
commission they only have influence through the power of their arguments. In both New Zealand and
Australia the Commission has the last say on boundaries, rather than simply recommending them to
Parliament. In New Zealand this cannot be challenged in the courts.
The red herring of the electoral roll
The opposition has criticised the government’s proposals as unfair, on the grounds that certain demographic
groups (people who are young, members of an ethnic minority or who live in urban areas) are more likely to be
missed off the register. Much of this criticism of using the roll is based on an Electoral Commission report
published in March 2010. This report demonstrated significant levels of under‐registration, especially in areas of
rapid population movement.
However, it also found that this approximately matched levels of inaccurate registration by people no longer
living at the registered address. Effectively, when someone moves house but does not re‐register, they become
inaccurate (incorrectly registered) in their old address and incomplete (not registered when they should be) in
their new address.
For the long term, improving registration when people move house should be a priority. However, for the
Boundary Review process it does not seem to be an insuperable problem: areas with lots of people missing are
also likely to have lots of people who are registered but have moved on. Given that, on current plans, the data
will be several years out of date anyway by the time the constituencies come into force this is not a serious
problem. More frequent, faster reviews will reduce the impact of this problem.
13
In both cases, the projected population figures are taken into account. In Australia there is a formal limit of
3.5% over 3 years and 6 months for how much an electorate can deviate over time. They even take account of
the 6 months of the Commission, using projected electorate figures for the expected end‐date of the
Commission in making decisions. This is in marked contrast to the UK, where the seats first used in 2010 were
based on the electorate in 2000. Even worse, in 2005 MPs were elected on 1991 electorates (except Scotland).
Both Australia and New Zealand have tight allowances for deviation from the quota – in Australia, plus or
minus 10% and in New Zealand only plus or minus 5%. This has the effect of reducing the process to an
“arithmetic exercise” rather than a more nuanced consideration of community ties, although in both cases
considerations such as transport links and physical geography are considered. The Bill before Parliament has
provision for plus or minus 5%, the same as New Zealand.
Geographic size
The coalition’s proposal of a maximum seat size looks a little pathetic when compared to Australian and
Canadian constituencies. While these two countries are obviously a lot larger, they have not seen the need to
over‐represent seats simply for their sparse populations. The largest Canadian constituencies do have lower
populations but this is because they are largely populated by indigenous peoples.
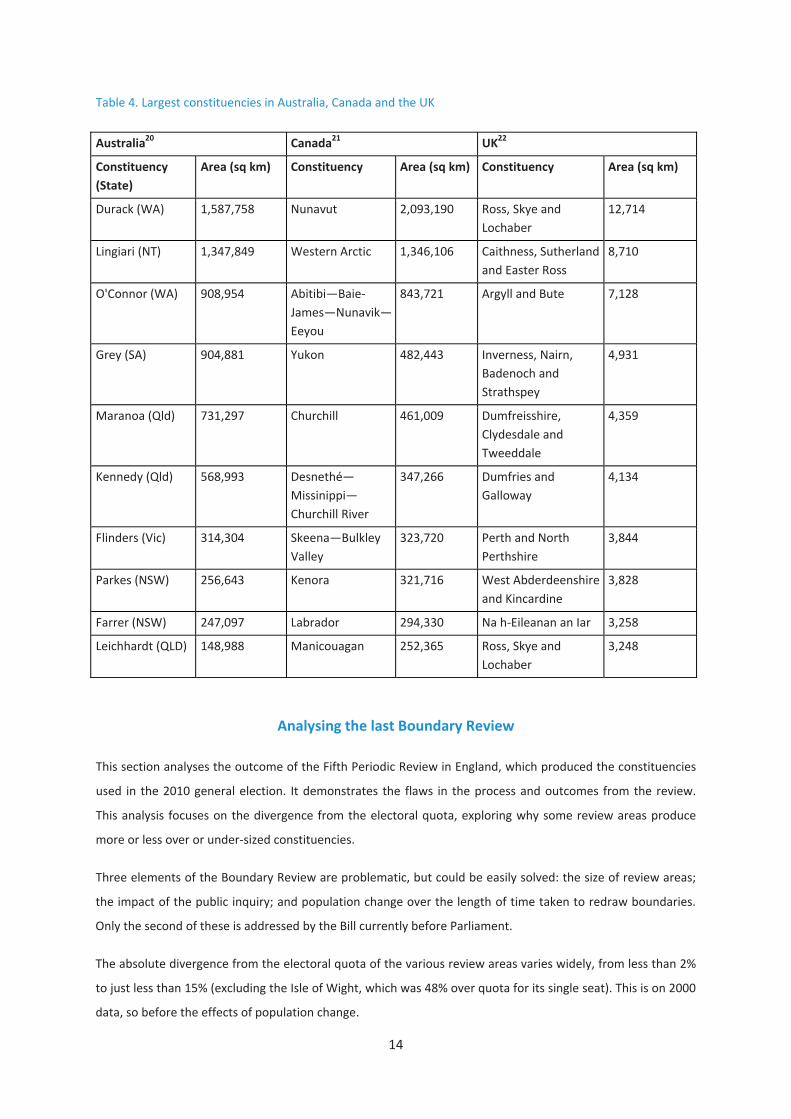
The Bill currently before Parliament sets a maximum geographic size of 13,000 square kilometres.19 The largest
seats in Australia and Canada are over 100 times this. 29 Australian constituencies (out of 150 total seats) are
larger than the proposed maximum constituency size in the UK. In Canada, 61 constituencies out of 308 are
over the proposed limit for the UK.
Both Australian and Canadian seats vary enormously in geographic size, but it is clear that distance is not
considered a barrier to effective representation. If around a fifth of constituencies in these countries are able
to be represented perfectly well by a single MP despite their geographic scale there seems no reason to permit
over‐representation in a much smaller country on grounds of geographic sparseness.
14
Table 4. Largest constituencies in Australia, Canada and the UK
Australia20 Canada21 UK22
Constituency (State)
Area (sq km) Constituency Area (sq km) Constituency Area (sq km)
Durack (WA) 1,587,758 Nunavut 2,093,190 Ross, Skye and Lochaber
12,714
Lingiari (NT) 1,347,849 Western Arctic 1,346,106 Caithness, Sutherland and Easter Ross
8,710
O'Connor (WA) 908,954 Abitibi—Baie‐James—Nunavik—Eeyou
843,721 Argyll and Bute 7,128
Grey (SA) 904,881 Yukon 482,443 Inverness, Nairn, Badenoch and Strathspey
4,931
Maranoa (Qld) 731,297 Churchill 461,009 Dumfreisshire, Clydesdale and Tweeddale
4,359
Kennedy (Qld) 568,993 Desnethé—Missinippi—Churchill River
347,266 Dumfries and Galloway
4,134
Flinders (Vic) 314,304 Skeena—Bulkley Valley
323,720 Perth and North Perthshire
3,844
Parkes (NSW) 256,643 Kenora 321,716 West Abderdeenshire and Kincardine
3,828
Farrer (NSW) 247,097 Labrador 294,330 Na h‐Eileanan an Iar 3,258
Leichhardt (QLD) 148,988 Manicouagan 252,365 Ross, Skye and Lochaber
3,248
Analysing the last Boundary Review
This section analyses the outcome of the Fifth Periodic Review in England, which produced the constituencies
used in the 2010 general election. It demonstrates the flaws in the process and outcomes from the review.
This analysis focuses on the divergence from the electoral quota, exploring why some review areas produce
more or less over or under‐sized constituencies.
Three elements of the Boundary Review are problematic, but could be easily solved: the size of review areas;
the impact of the public inquiry; and population change over the length of time taken to redraw boundaries.
Only the second of these is addressed by the Bill currently before Parliament.
The absolute divergence from the electoral quota of the various review areas varies widely, from less than 2%
to just less than 15% (excluding the Isle of Wight, which was 48% over quota for its single seat). This is on 2000
data, so before the effects of population change.
15
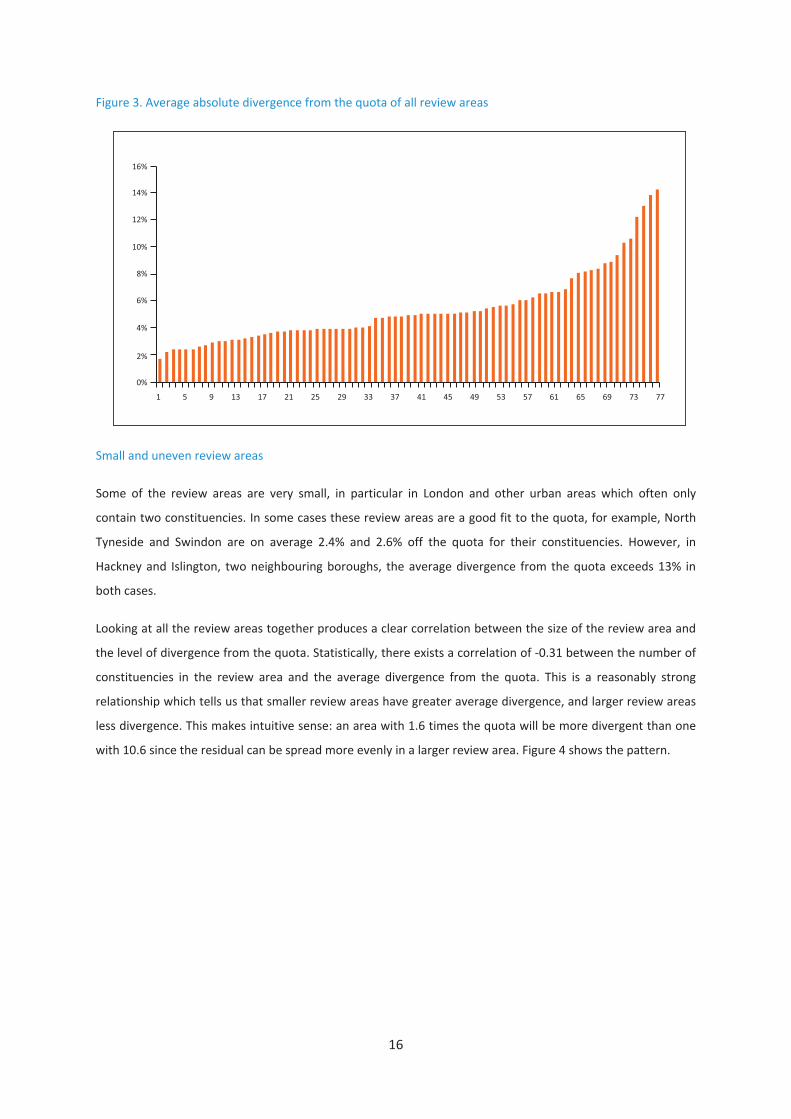
The wide range of divergence in Figure 3 demonstrates how uneven the outcome of the review is. This is
before the effect of population change, which makes some areas closer to the quota but others even further
away. The range of divergence should be unacceptable. It also excludes the Isle of Wight, which was 48% over
quota.
The data analysed
The data for this analysis comes from the Fifth Periodic Boundary review for England, for seats which came
into force at the 2010 general election. The key variables are the electorate of each seat in the provisional
recommendations and the corresponding electorate in the final recommendations, which went on to become
the new constituencies. For most seats this was a minor change; occasionally there were wards which changed
between review areas, or such radical change of how seats were drawn up that it was hard to identify which
provisional constituency became a final one.
The other key issue is grouping seats. For data entry the approach taken was to match review areas to how
they are presented in the Boundary Review archived documents, which is simple for all but the metropolitan
districts. In these cases, many seats overlap so the review areas are effectively merged anyway. Here, how to
group them for analysis was decided according to how well the districts fitted together. This should not have a
significant effect on the data.
The only areas where there were decisions without an easy solution were Westminster & City which contained
three wards from Brent in the provisional recommendations but not in the final ones; overlaps between
Stockport and several other Greater Manchester Boroughs; and on Merseyside where several wards of Sefton
Borough moved around. In two of these cases – Sefton and the rest of Merseyside and the Westminster, City,
Camden and Brent the changes are significant, so the only suitable solution was to merge the review areas in
the dataset. For reasons of consistency, this was then done with Stockport and Oldham, Rochdale and
Tameside also. This makes little difference to the outcome.
Policy Exchange is happy to make the dataset available on request.
16
Figure 3. Average absolute divergence from the quota of all review areas
Small and uneven review areas
Some of the review areas are very small, in particular in London and other urban areas which often only
contain two constituencies. In some cases these review areas are a good fit to the quota, for example, North
Tyneside and Swindon are on average 2.4% and 2.6% off the quota for their constituencies. However, in
Hackney and Islington, two neighbouring boroughs, the average divergence from the quota exceeds 13% in
both cases.
Looking at all the review areas together produces a clear correlation between the size of the review area and
the level of divergence from the quota. Statistically, there exists a correlation of ‐0.31 between the number of
constituencies in the review area and the average divergence from the quota. This is a reasonably strong
relationship which tells us that smaller review areas have greater average divergence, and larger review areas
less divergence. This makes intuitive sense: an area with 1.6 times the quota will be more divergent than one
with 10.6 since the residual can be spread more evenly in a larger review area. Figure 4 shows the pattern.
10%
14%
0%
12%
16%
2%
4%
8%
6%
1 5 9 13 17 21 25 29 33 37 41 45 49 53 57 61 65 69 73 77
17
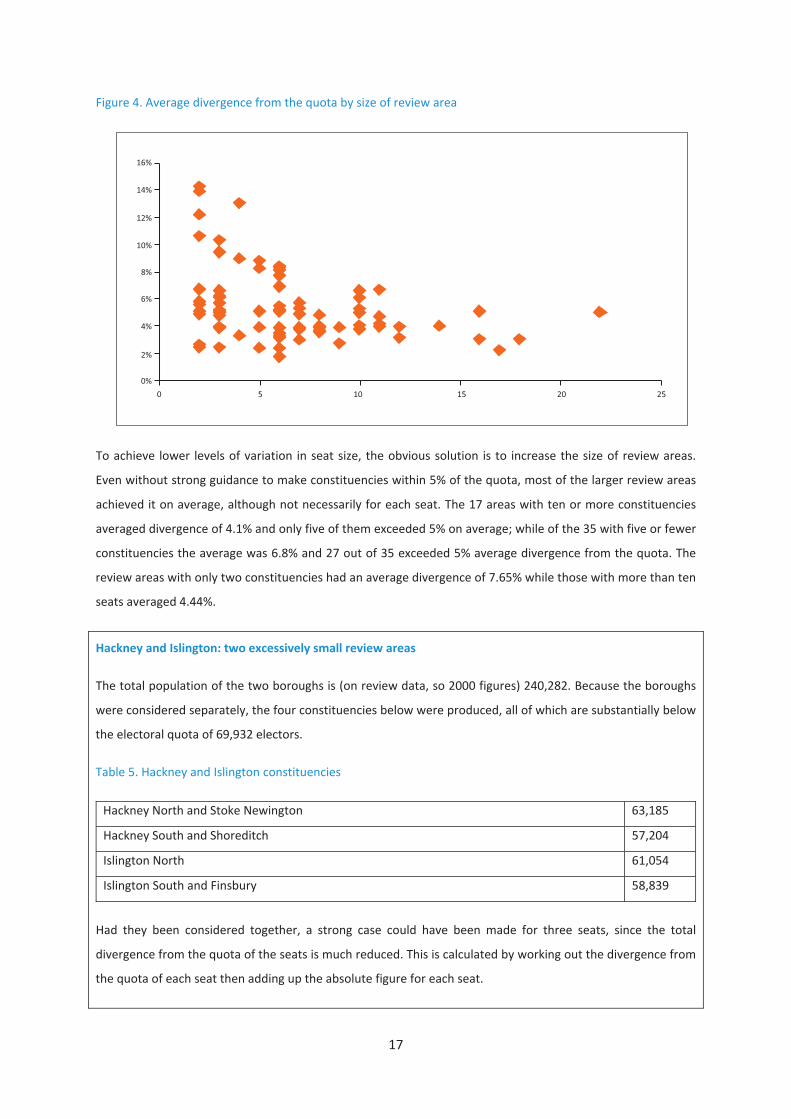
Figure 4. Average divergence from the quota by size of review area
To achieve lower levels of variation in seat size, the obvious solution is to increase the size of review areas.
Even without strong guidance to make constituencies within 5% of the quota, most of the larger review areas
achieved it on average, although not necessarily for each seat. The 17 areas with ten or more constituencies
averaged divergence of 4.1% and only five of them exceeded 5% on average; while of the 35 with five or fewer
constituencies the average was 6.8% and 27 out of 35 exceeded 5% average divergence from the quota. The
review areas with only two constituencies had an average divergence of 7.65% while those with more than ten
seats averaged 4.44%.
Hackney and Islington: two excessively small review areas
The total population of the two boroughs is (on review data, so 2000 figures) 240,282. Because the boroughs
were considered separately, the four constituencies below were produced, all of which are substantially below
the electoral quota of 69,932 electors.
Table 5. Hackney and Islington constituencies
Hackney North and Stoke Newington 63,185
Hackney South and Shoreditch 57,204
Islington North 61,054
Islington South and Finsbury 58,839
Had they been considered together, a strong case could have been made for three seats, since the total
divergence from the quota of the seats is much reduced. This is calculated by working out the divergence from
the quota of each seat then adding up the absolute figure for each seat.
10%
14%
0%
12%
16%
2%
4%
8%
6%
0 5 10 15 20 25
18
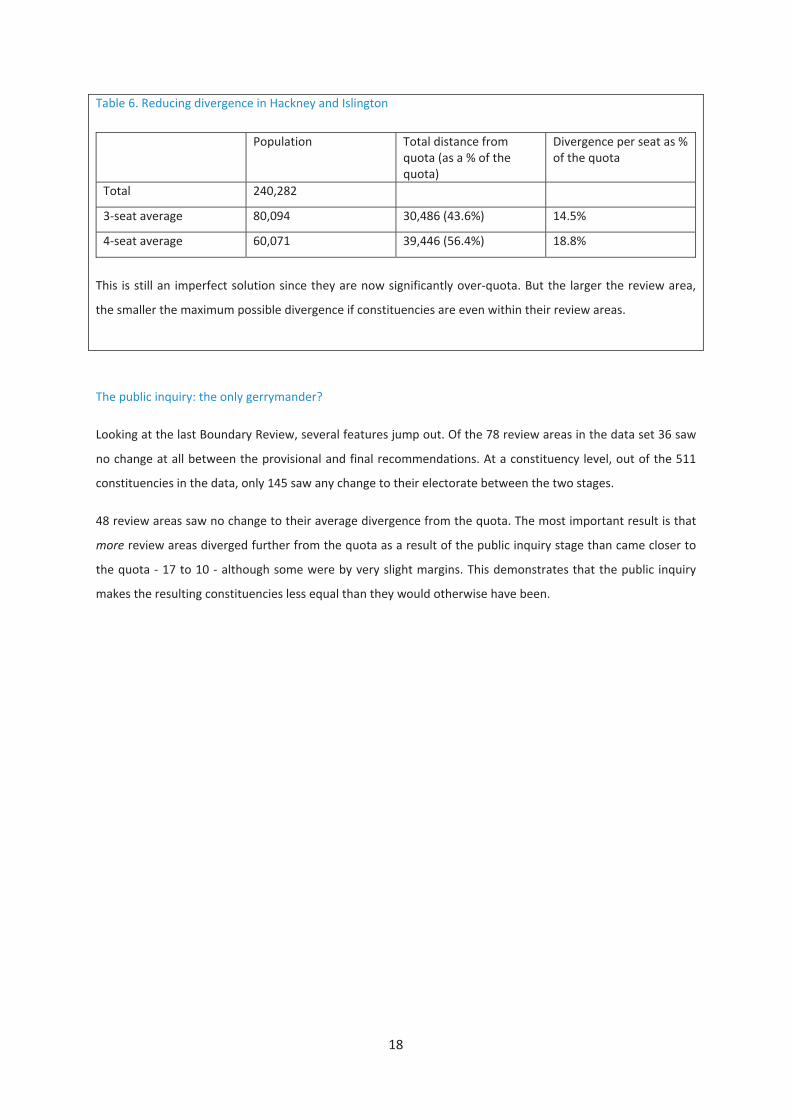
Table 6. Reducing divergence in Hackney and Islington
Population Total distance from quota (as a % of the quota)
Divergence per seat as % of the quota
Total 240,282
3‐seat average 80,094 30,486 (43.6%) 14.5%
4‐seat average 60,071 39,446 (56.4%) 18.8%
This is still an imperfect solution since they are now significantly over‐quota. But the larger the review area,
the smaller the maximum possible divergence if constituencies are even within their review areas.
The public inquiry: the only gerrymander?
Looking at the last Boundary Review, several features jump out. Of the 78 review areas in the data set 36 saw
no change at all between the provisional and final recommendations. At a constituency level, out of the 511
constituencies in the data, only 145 saw any change to their electorate between the two stages.
48 review areas saw no change to their average divergence from the quota. The most important result is that
more review areas diverged further from the quota as a result of the public inquiry stage than came closer to
the quota ‐ 17 to 10 ‐ although some were by very slight margins. This demonstrates that the public inquiry
makes the resulting constituencies less equal than they would otherwise have been.
19
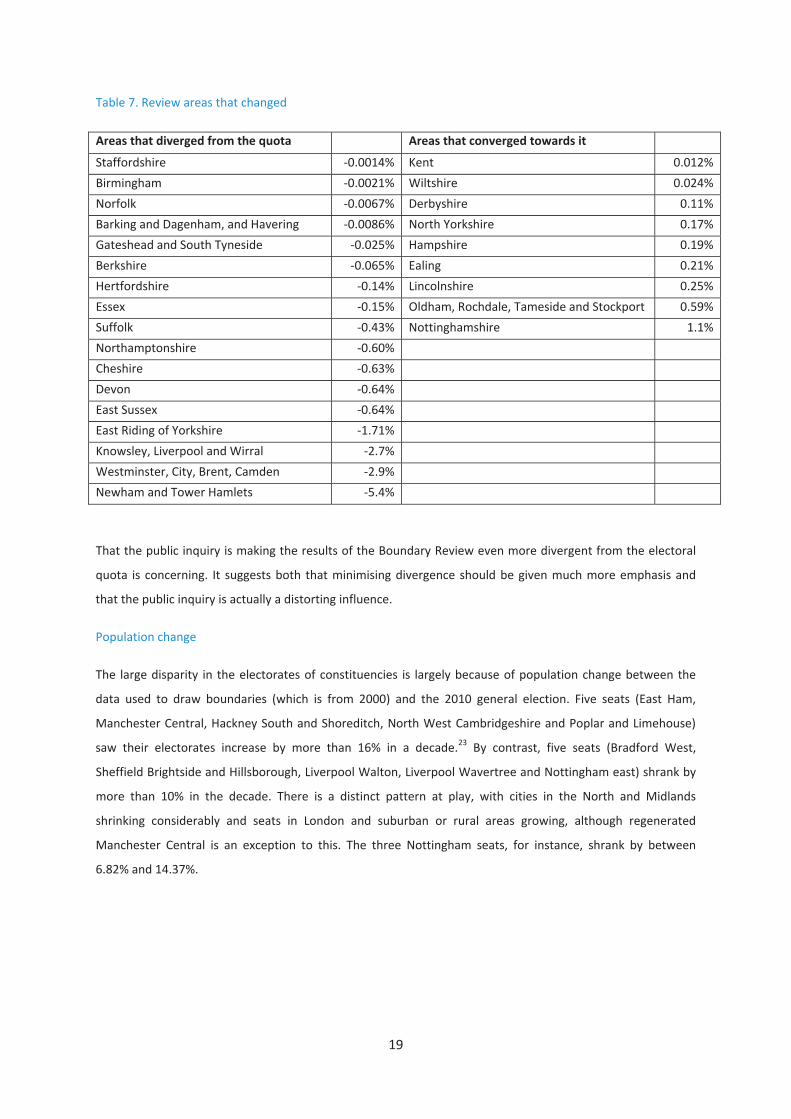
Table 7. Review areas that changed
Areas that diverged from the quota Areas that converged towards it
Staffordshire ‐0.0014% Kent 0.012%
Birmingham ‐0.0021% Wiltshire 0.024%
Norfolk ‐0.0067% Derbyshire 0.11%
Barking and Dagenham, and Havering ‐0.0086% North Yorkshire 0.17%
Gateshead and South Tyneside ‐0.025% Hampshire 0.19%
Berkshire ‐0.065% Ealing 0.21%
Hertfordshire ‐0.14% Lincolnshire 0.25%
Essex ‐0.15% Oldham, Rochdale, Tameside and Stockport 0.59%
Suffolk ‐0.43% Nottinghamshire 1.1%
Northamptonshire ‐0.60%
Cheshire ‐0.63%
Devon ‐0.64%
East Sussex ‐0.64%
East Riding of Yorkshire ‐1.71%
Knowsley, Liverpool and Wirral ‐2.7%
Westminster, City, Brent, Camden ‐2.9%
Newham and Tower Hamlets ‐5.4%
That the public inquiry is making the results of the Boundary Review even more divergent from the electoral
quota is concerning. It suggests both that minimising divergence should be given much more emphasis and
that the public inquiry is actually a distorting influence.
Population change
The large disparity in the electorates of constituencies is largely because of population change between the
data used to draw boundaries (which is from 2000) and the 2010 general election. Five seats (East Ham,
Manchester Central, Hackney South and Shoreditch, North West Cambridgeshire and Poplar and Limehouse)
saw their electorates increase by more than 16% in a decade.23 By contrast, five seats (Bradford West,
Sheffield Brightside and Hillsborough, Liverpool Walton, Liverpool Wavertree and Nottingham east) shrank by
more than 10% in the decade. There is a distinct pattern at play, with cities in the North and Midlands
shrinking considerably and seats in London and suburban or rural areas growing, although regenerated
Manchester Central is an exception to this. The three Nottingham seats, for instance, shrank by between
6.82% and 14.37%.
20
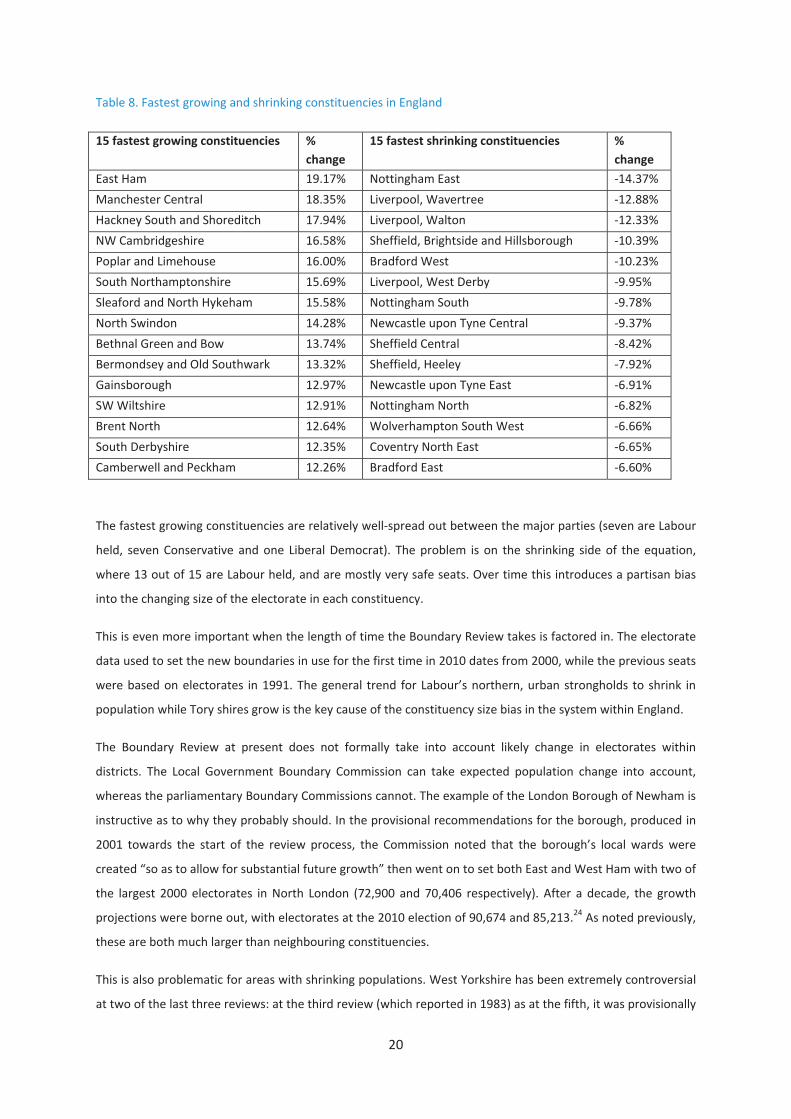
Table 8. Fastest growing and shrinking constituencies in England
15 fastest growing constituencies % change
15 fastest shrinking constituencies % change
East Ham 19.17% Nottingham East ‐14.37%
Manchester Central 18.35% Liverpool, Wavertree ‐12.88%
Hackney South and Shoreditch 17.94% Liverpool, Walton ‐12.33%
NW Cambridgeshire 16.58% Sheffield, Brightside and Hillsborough ‐10.39%
Poplar and Limehouse 16.00% Bradford West ‐10.23%
South Northamptonshire 15.69% Liverpool, West Derby ‐9.95%
Sleaford and North Hykeham 15.58% Nottingham South ‐9.78%
North Swindon 14.28% Newcastle upon Tyne Central ‐9.37%
Bethnal Green and Bow 13.74% Sheffield Central ‐8.42%
Bermondsey and Old Southwark 13.32% Sheffield, Heeley ‐7.92%
Gainsborough 12.97% Newcastle upon Tyne East ‐6.91%
SW Wiltshire 12.91% Nottingham North ‐6.82%
Brent North 12.64% Wolverhampton South West ‐6.66%
South Derbyshire 12.35% Coventry North East ‐6.65%
Camberwell and Peckham 12.26% Bradford East ‐6.60%
The fastest growing constituencies are relatively well‐spread out between the major parties (seven are Labour
held, seven Conservative and one Liberal Democrat). The problem is on the shrinking side of the equation,
where 13 out of 15 are Labour held, and are mostly very safe seats. Over time this introduces a partisan bias
into the changing size of the electorate in each constituency.
This is even more important when the length of time the Boundary Review takes is factored in. The electorate
data used to set the new boundaries in use for the first time in 2010 dates from 2000, while the previous seats
were based on electorates in 1991. The general trend for Labour’s northern, urban strongholds to shrink in
population while Tory shires grow is the key cause of the constituency size bias in the system within England.
The Boundary Review at present does not formally take into account likely change in electorates within
districts. The Local Government Boundary Commission can take expected population change into account,
whereas the parliamentary Boundary Commissions cannot. The example of the London Borough of Newham is
instructive as to why they probably should. In the provisional recommendations for the borough, produced in
2001 towards the start of the review process, the Commission noted that the borough’s local wards were
created “so as to allow for substantial future growth” then went on to set both East and West Ham with two of
the largest 2000 electorates in North London (72,900 and 70,406 respectively). After a decade, the growth
projections were borne out, with electorates at the 2010 election of 90,674 and 85,213.24 As noted previously,
these are both much larger than neighbouring constituencies.
This is also problematic for areas with shrinking populations. West Yorkshire has been extremely controversial
at two of the last three reviews: at the third review (which reported in 1983) as at the fifth, it was provisionally
21
recommended to lose a seat, going from 23 to 22 seats. In the 1980s this was due to rounding of all the local
authorities separately. When added up they produced 22 seats even though the county as a whole was
entitled to 23. The Commission had justified this on the basis of ‘natural communities’ but later reversed the
decision in the face of widespread local objections.25
At the fifth review West Yorkshire was again reduced to 22 seats after a long‐drawn out controversy and an
attempt to go to the High Court. This time it was because the county as a whole had slipped below 22.5 seats
by electorate, albeit only just ‐ on the 2000 electorate, West Yorkshire was entitled to 22.4959 seats, making a
very tight call either way.
Had the projected population figures been available as evidence, the case for a reduction would have been
unarguable. By 2009, it had already shrunk to an entitlement of 21.91 seats.26 Had this information been
available, or even just a projection showing declining electorate, there would have been no credible argument
against losing a seat.
Four Labour MPs in the Wakefield area – Ed Balls, Yvette Cooper, Mary Creagh and John Trickett – attempted
to take the case to the High Court, which dismissed the case. The outcome of this was that Ed Balls moved
constituencies within West Yorkshire, taking advantage of retirements in other safe Labour seats.
22
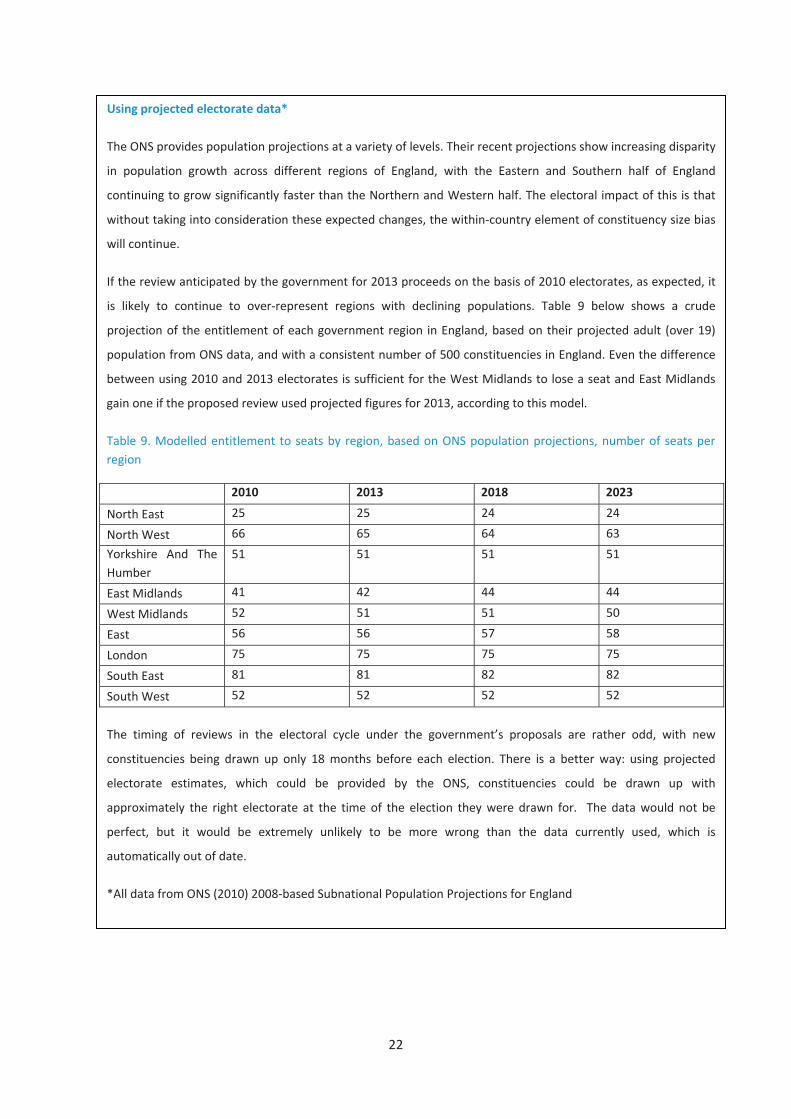
Using projected electorate data*
The ONS provides population projections at a variety of levels. Their recent projections show increasing disparity
in population growth across different regions of England, with the Eastern and Southern half of England
continuing to grow significantly faster than the Northern and Western half. The electoral impact of this is that
without taking into consideration these expected changes, the within‐country element of constituency size bias
will continue.
If the review anticipated by the government for 2013 proceeds on the basis of 2010 electorates, as expected, it
is likely to continue to over‐represent regions with declining populations. Table 9 below shows a crude
projection of the entitlement of each government region in England, based on their projected adult (over 19)
population from ONS data, and with a consistent number of 500 constituencies in England. Even the difference
between using 2010 and 2013 electorates is sufficient for the West Midlands to lose a seat and East Midlands
gain one if the proposed review used projected figures for 2013, according to this model.
Table 9. Modelled entitlement to seats by region, based on ONS population projections, number of seats per region
2010 2013 2018 2023
North East 25 25 24 24
North West 66 65 64 63
Yorkshire And The Humber
51 51 51 51
East Midlands 41 42 44 44
West Midlands 52 51 51 50
East 56 56 57 58
London 75 75 75 75
South East 81 81 82 82
South West 52 52 52 52
The timing of reviews in the electoral cycle under the government’s proposals are rather odd, with new
constituencies being drawn up only 18 months before each election. There is a better way: using projected
electorate estimates, which could be provided by the ONS, constituencies could be drawn up with
approximately the right electorate at the time of the election they were drawn for. The data would not be
perfect, but it would be extremely unlikely to be more wrong than the data currently used, which is
automatically out of date.
*All data from ONS (2010) 2008‐based Subnational Population Projections for England
23
Conclusions: How to draw boundaries better
The principles of democracy and efficiency point to several key ways to improve the Boundary Review. 7 years
is far too long for the process, especially since much of the time is taken up with local inquiries which have
become politicised. Finding a way to allow genuine local opinion to be expressed but preventing a party
political circus is key. A good option would be to require all submissions to be in writing rather than at a
hearing, which would allow the national parties to give submissions without allowing them to take over a
lengthy inquiry, squeezing out genuinely local concerns. If we value party political input, the New Zealand
model offers a way to include political parties without allowing them to dominate: appointing their experts to
the Commission as long as they are heavily outnumbered by non‐partisan appointees. The bill before
Parliament proposes allowing representations to be made within 12 weeks, and not in a local inquiry, implying
in writing. This should be shortened – 30 days would be adequate for genuine local objections but too tight for
national parties to submit to every review simultaneously. This would also require the Boundary Commission
to publish all its provisional recommendations simultaneously, which may require an increase in staff.
Putting in place strict deadlines would improve efficiency throughout the process. If Australia and New Zealand
can redraw all the boundaries in 6 months the UK should be able to do it within a year. The Boundary
Commission is relatively quick at producing provisional recommendations, and if submissions in writing had to
be produced within a short period, there is no reason the process could not be complete within a year. This
would reduce significantly the impact of population change during the inquiry, which is an absurd problem for
a mature democracy to suffer.
By adopting the use of projected population figures, the Commission could also draw seats which would be
accurate at the time of the next due election, not at a point in time prior to the review itself starting. This
would eliminate much of the within‐country constituency size bias which is due to population change, and
prevent new constituencies being wildly different in population.
The frequency of reviews should also be considered. If it is shortened to take a year there is no reason not to
hold one after every election, which would make each review less dramatic in its impact. If fixed‐term
parliaments are introduced this would be even more appealing, and could be done well in advance of each
election unlike the present proposals.
Small and uneven review areas have predictably unequal outcomes and are entirely avoidable. At the stage of
the review process where the Commission groups together local authority areas, the evidence from the
analysis here suggests that larger review areas smooth out differences significantly. A suggested minimum
area of 10 constituencies should be sufficient.
A single UK electoral quota should also be implemented. Scotland is already roughly in line with England and
there is no democratic reason why Wales should continue to be over‐represented by 25% after devolution.
The issue of exemptions will always be a difficult one. Scotland has several seats covering islands and mainland
24
areas, so why in an age of very easy communications the Western Isles, and the Shetland and Orkney Islands
need undersized seats is not clear from a democratic perspective, particularly since other seats contain islands.
It is even less justifiable for the undersized seats on the mainland. While they may genuinely be harder for an
MP to physically travel around, this could be addressed more fairly through additional expenses for travel or
even staff in recognition of the sparse population. It is worth noting that Charles Kennedy represented one of
these seats and found time to lead a national party as well as represent his constituents, suggesting that
getting around the seat cannot be as arduous as is often claimed.
The proposed maximum size limit is one of the weakest parts of the coalition government’s bill. One‐fifth of
Canadian and Australian constituencies are larger, including two in each country that are more than 100 times
the size of the proposed maximum limit. Nearly one‐fifth of Canadian constituencies exceed the limit. With
modern communications technology it should be perfectly possible for an MP to represent a sparsely
populated constituency.
Improving recommendations already in the Bill
1. The Boundary Review process should be reformed to depoliticise it and make it much more efficient. The
political parties have learnt to manipulate the public inquiry which has made it more vulnerable to
gerrymandering, albeit competitive and transparent gerrymandering. This should be changed to allow effective
local representation but to restrain the professional party operatives from turning the review into drawn‐out
theatre.
2. Representations to the Commission should be in writing and time‐limited. The proposed 12 week limit
may be too generous to the political parties’ national organisations, and should be reconsidered. 30 days is
adequate for genuine local objections and too tight for national party organisations to try to gain benefit
everywhere.
3. There should be a single, UK‐wide electoral quota. After devolution there is no democratic justification for
over‐representation of Wales, Scotland or Northern Ireland which previously had more seats per population
than England. Scotland has already been brought into line with England; there is no reason Wales should
continue to be 25% over‐represented. This is a part of the government’s proposals and must be implemented.
Recommendations to go further, faster or better
4. Time limits should be enacted to prevent the review taking excessively long. Australia and New Zealand
can draw up their seats in 6 months; it should not take longer than a year to re‐draw the UK’s.
5. The Review should use projected electorate figures. Constituencies should be approximately equal at the
time of their use, not ten years after as was the case for the ‘new’ constituencies used in 2010. By shortening
the timescale of the review and using ONS projections the constituencies can be fair at the election they are
25
used in. At the very least, expected population change should be included in the list of factors the Commission
may take into account.
6. The Boundary Commission should group constituencies into larger review areas. Review areas of more
than 10 seats were much closer to the quota than smaller ones, due to simple mathematics. Equality of
representation is more important than local council boundaries, and this should be reflected in grouping seats
to ensure closer adherence to the mean which implies more frequent cross‐district seats. This would result in
more even sized seats in urban areas which tend to have far too small review areas, rather than having very
large and very small seats next to each other.
7. There should be a review immediately after each election. This would make each review less radical and
allow more time than the current proposals for the parties and local authorities to adjust to new boundaries.
Rather than have absolutely regular reviews, this maximises the gap between new constituencies being drawn
and their use, even though they have been drawn to have equal electorates at the time of use.
8. The maximum geographic size limit for constituencies should be removed. There is no democratic
justification for undersized constituencies in an age of very advanced communications. Extra transport or
staffing allowances might be justified; over‐representation is not.
2
Endnotes 1 HC Debs 5th July, col 24 2 Data up to 1997 from Rossiter, D, Johnston, R, Pattie, C, Dorling, D, MacAllister, I and Tunstall, H (1999) Changing biases in the operation of the UK’s electoral system, British Journal of Politics and International Relations, 1 (2) pp133‐164; data for 2001 onwards from Johnston, R, Pattie, C, in Bartle, J and Allen, N (forthcoming, 2010) Britain at the Polls, Sage 3 Johnston and Pattie (forthcoming, 2010) 4 All data in this section from Pippa Norris “British Parliamentary Constituency Dataset 2010” from http://www.pippanorris.com/ unless otherwise stated 5 Boundary Commission for Wales, Boundary Commission for Northern Ireland 6 Boundary Commission for Scotland 7 See for example Taagepera, R and Recchia, P (2002) The size of second chambers and European assemblies, European Journal of Political Research, 41 (2) pp165‐185 8 House of Commons (Redistribution of seats) Act (1944) 9 Parliamentary Constituencies Act (1986) Schedule 2 1(1) 10 Boundary Commission for Wales 11 Rossiter et al, The Boundary Commissions, p135 12 Rossiter et al, The Boundary Commissions, p125 13 Rossiter et al, The Boundary Commissions, p402 14 Rossiter et al, The Boundary Commissions, p366 and pp248‐251 15 Minutes of the Local Inquiry for Staffordshire, 25 June 2002, pp18‐24 16 Rossiter et al, The Boundary Commissions, p139 17 This section draws on chapters from Handley L and Grofman B (eds) (2008) Redistricting in comparative perspective OUP, Oxford, in particular Courtney, J “From Gerrymandering to independence: district boundary readjustments in Canada”; Rod Medew: “redistricting in Australia: the importance of ‘one vote, one value’ and Alan McRobie: “An Independent Commission with political input: New Zealand’s electoral redistribution practices” 18 Boundary Commission for England newsletters 19 Parliamentary Voting System and Constituencies and Bill, p8 20 Australian Electoral Commission data, from http://www.aec.gov.au/profiles/index.htm 21 Elections Canada data, provided on request 22 Information by request from the House of Commons Information Office 23 Boundary Commission for England data, provided on request 24 Boundary Commission, North London Boroughs Provisional Recommendations 25 Rossiter et al, The Boundary Commissions, p149 26 Boundary Commission data, provided on request
6

October 2010
January 201
About the Author
Dr Robert McIlveen completed his PhD in Political Science in 2008 at the University of Sheffield. He has interests in statistical methods, game theory and rational choice. He joined Policy Exchange’s Environment and Energy Unit before returning to electoral and constitutional issues. This is the tenth and final report for Policy Exchange he was written, edited or contributed to. Natalie Evans is Deputy Director at Policy Exchange, responsible for the strategic direction and output of the research team.
Acknowledgements
Policy Exchange would like to thank all those who gave their advice, opinions and time to help this project. In particular, the author would like to thank Rebecca Greaves, Greg Lea and Katie Lintott for their data entry work without which the analysis presented here would not have been possible in the time available.
About Policy Exchange
Policy Exchange, an independent educational charity. Our mission is to develop and promote new policy ideas
which will foster a free society based on strong communities, limited government, national self confidence and
an enterprise culture. In contrast to many other think tanks Policy Exchange is committed to an evidence‐
based approach to policy development. Our impact speaks for itself: from housing to policing reform,
education to the NHS, our proposals have been taken on board by the main political parties. Registered charity
number 1096300.
For more information please contact us at: Clutha House, 10 Storey’s Gate, London, SW1P 3AY. Alternatively
we can be contacted on 020 7340 2650 and at [email protected]
Trustees
Charles Moore (Chairman of the Board), Richard Ehrman (Deputy Chair), Theodore Agnew, Richard Briance,
Robin Edwards, Simon Brocklebank‐Fowler, Virginia Fraser, George Robinson, Robert Rosenkranz, Andrew Sells, Tim Steel, Alice Thomson, Rachel Whetstone, Simon Wolfson
research note October 2010