localization of diagnostically relevant regions of interest in whole slide images ezgi mercan 1,...
TRANSCRIPT

Localization of Diagnostically Relevant
Regions of Interest in Whole Slide Images
Ezgi Mercan1, Selim Aksoy2, Linda G. Shapiro1, Donald L. Weaver3, Tad Brunye4, Joann G. Elmore5
1Dept. of Computer Science and Engineering, University of Washington, Seattle, WA2Dept. of Computer Engineering, Bilkent University, Ankara, Turkey
3Dept. of Pathology, University of Vermont, Burlington, VT4Dept. of Psychology, Tufts University, Medford, MA
5Dept. of Medicine, University of Washington, Seattle, WA
2
Outline
1. Motivation
2. Methodology1. Learning a Visual Dictionary2. Training using expert ROIs3. Testing using tracking data
• Interpretation of tracking data and computation of evaluation data set
3. Experiments and Results
8/26/2014

3
Bigger Picture
• Our Digipath grant from the U.S. National Cancer Institute is to study the scanning behaviors of pathologists while they diagnose breast biopsy slides.• We use a mouse tracking system to record their
panning and zooming behaviors.• They also draw a rectangle on the one area of each
slide they think was most important to diagnosis.• The long-term goal of our work is understand what
pathologists are doing when they diagnose both correctly and incorrectly.
8/26/2014

4
Motivation• Pathologists study whole slide biopsy images in order to
make a diagnosis.
• They stop at and/or zoom on regions of interest they think are important for diagnosis.
• We would like to understand and partially automate this process using the rectangles they draw and the mouse tracking system.
8/26/2014
our predicted probability map
ground truth from viewport logs
5
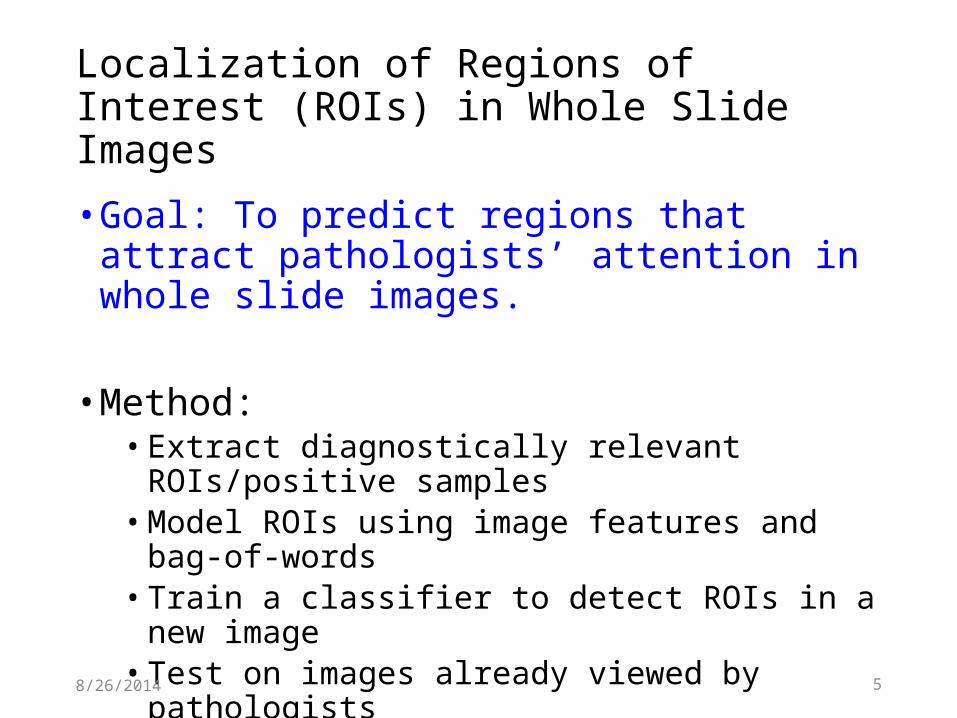
Localization of Regions of Interest (ROIs) in Whole Slide Images
• Goal: To predict regions that attract pathologists’ attention in whole slide images.
• Method: • Extract diagnostically relevant ROIs/positive samples• Model ROIs using image features and bag-of-words• Train a classifier to detect ROIs in a new image• Test on images already viewed by pathologists
8/26/2014
6
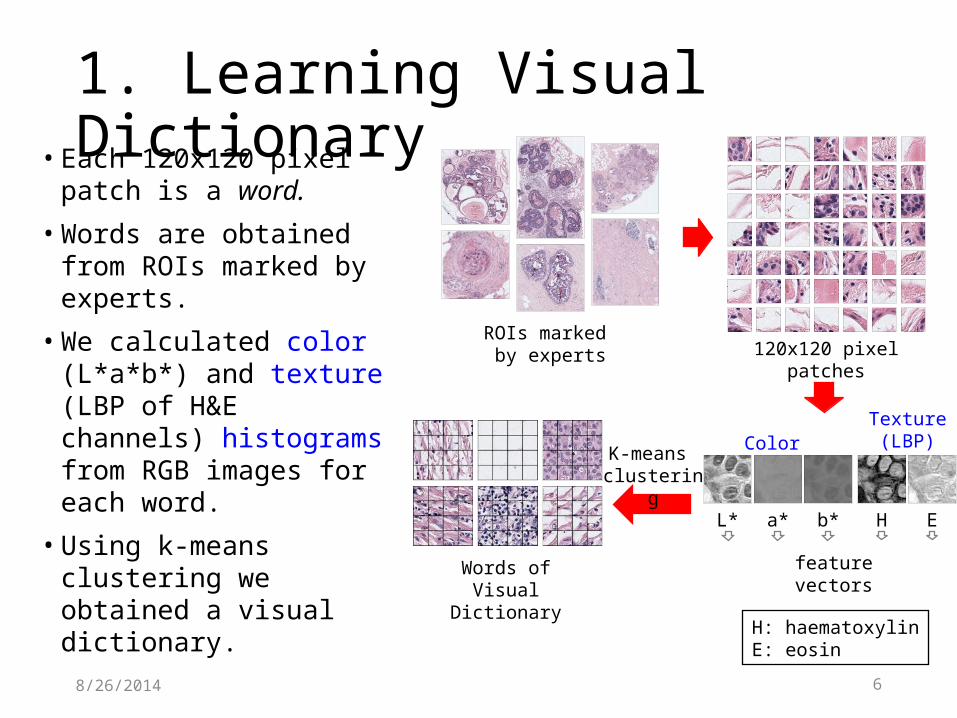
1. Learning Visual Dictionary• Each 120x120 pixel patch
is a word.
• Words are obtained from ROIs marked by experts.
• We calculated color (L*a*b*) and texture (LBP of H&E channels) histograms from RGB images for each word.
• Using k-means clustering we obtained a visual dictionary.
8/26/2014
120x120 pixel patchesROIs marked
by experts
feature vectorsWords of Visual Dictionary
L* a* b* EH
Color Texture
(LBP)
H: haematoxylinE: eosin
K-means clustering
7
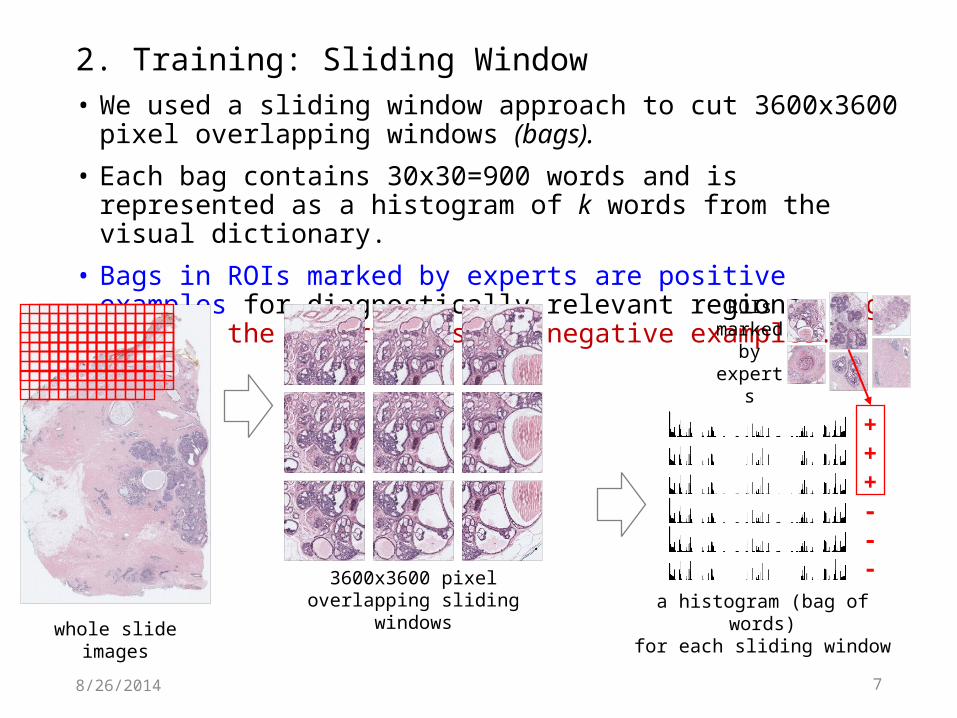
• We used a sliding window approach to cut 3600x3600 pixel overlapping windows (bags).
• Each bag contains 30x30=900 words and is represented as a histogram of k words from the visual dictionary.
• Bags in ROIs marked by experts are positive examples for diagnostically relevant regions. Bags outside the expert ROIs are negative examples.
8/26/2014
whole slide images
3600x3600 pixeloverlapping sliding windows
2. Training: Sliding Window
a histogram (bag of words)for each sliding window
+++---
ROIs marked
by experts

88/26/2014
bag of words for each sliding window
…
whole slide image
3600x3600 pixelsliding windows
probability of being a ROI
Binary Classifier(LogReg and SVM)
3. Testingvisual dictionary
trained on expert ROIs
9
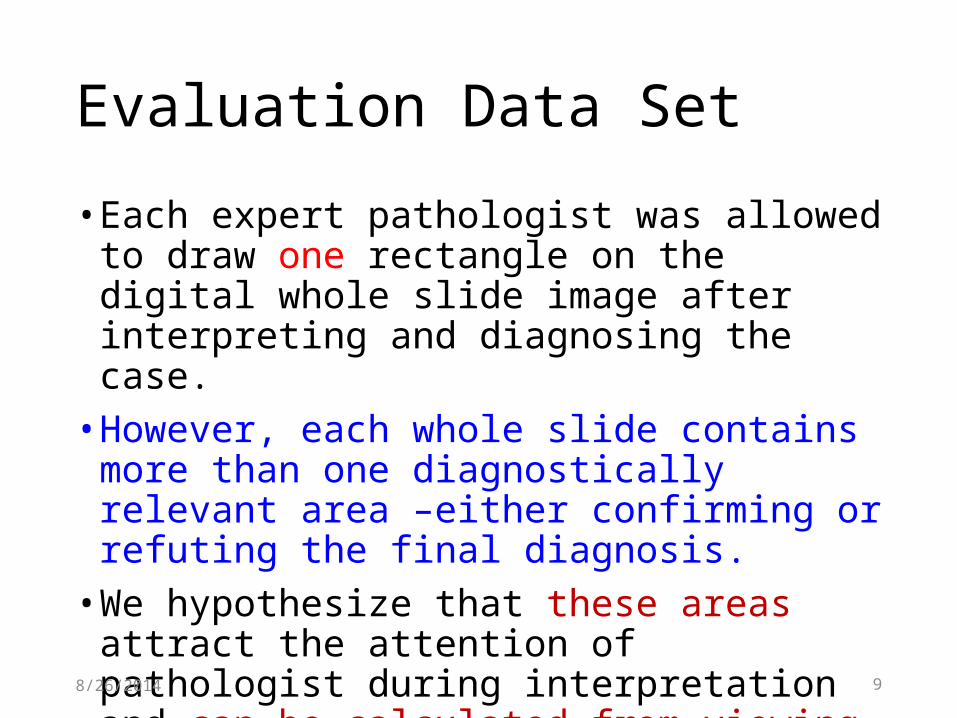
Evaluation Data Set
• Each expert pathologist was allowed to draw one rectangle on the digital whole slide image after interpreting and diagnosing the case. • However, each whole slide contains more than one
diagnostically relevant area –either confirming or refuting the final diagnosis.• We hypothesize that these areas attract the
attention of pathologist during interpretation and can be calculated from viewing logs.
8/26/2014
10
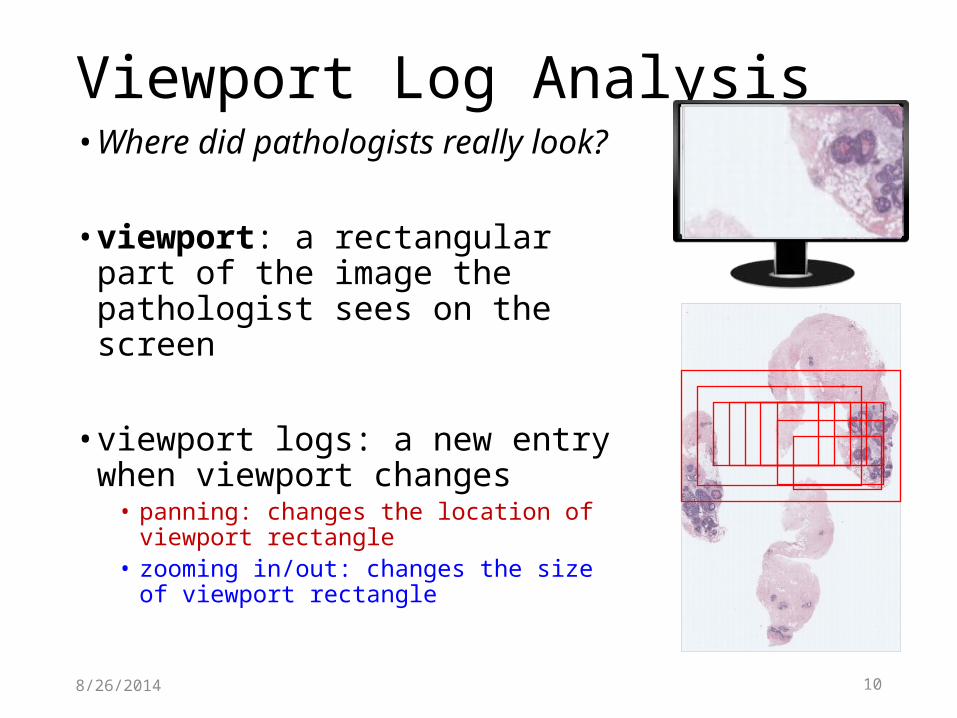
• Where did pathologists really look?
• viewport: a rectangular part of the image the pathologist sees on the screen
• viewport logs: a new entry when viewport changes• panning: changes the location of viewport
rectangle• zooming in/out: changes the size of viewport
rectangle
8/26/2014
Viewport Log Analysis

11
Zoom LevelThe value of the magnification per each log entry during an image interpretation session. It ranges from 1 to 60. Higher the zoom, the smaller the rectangle.
8/26/2014
disp
lace
men
t (pi
xels
)zoom
level / duration (seconds)
viewports / log entries
12
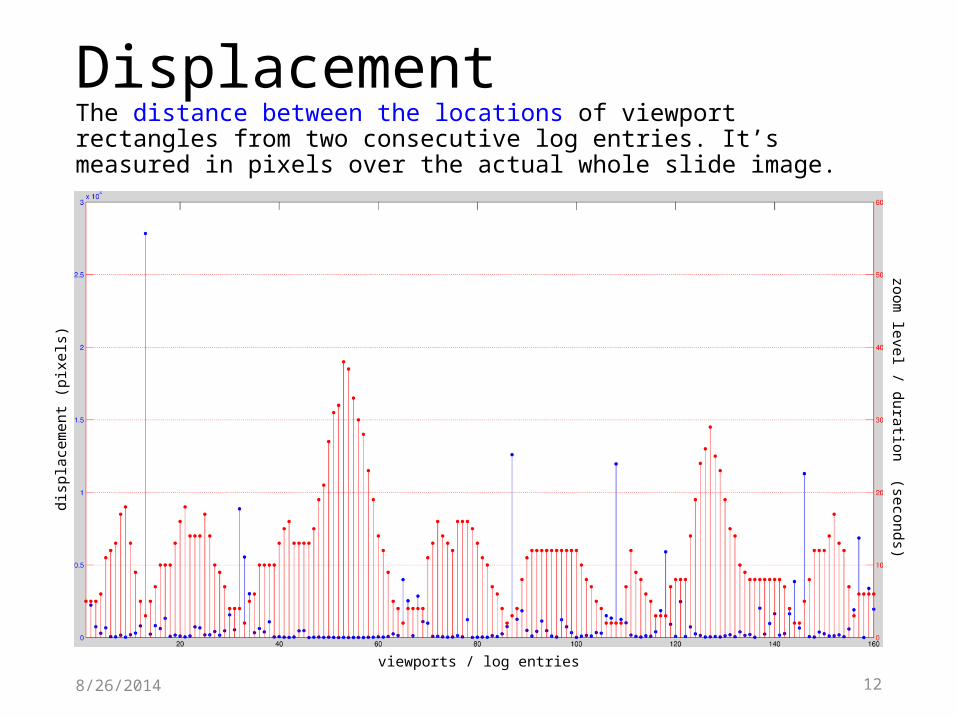
DisplacementThe distance between the locations of viewport rectangles from two consecutive log entries. It’s measured in pixels over the actual whole slide image.
8/26/2014
disp
lace
men
t (pi
xels
)zoom
level / duration (seconds)
viewports / log entries

13
DurationThe amount of time a pathologist spent looking at each rectangle that corresponds to a log entry. A log entry is created whenever the viewport changes.
8/26/2014
disp
lace
men
t (pi
xels
)zoom
level / duration (seconds)
viewports / log entries
148/26/2014
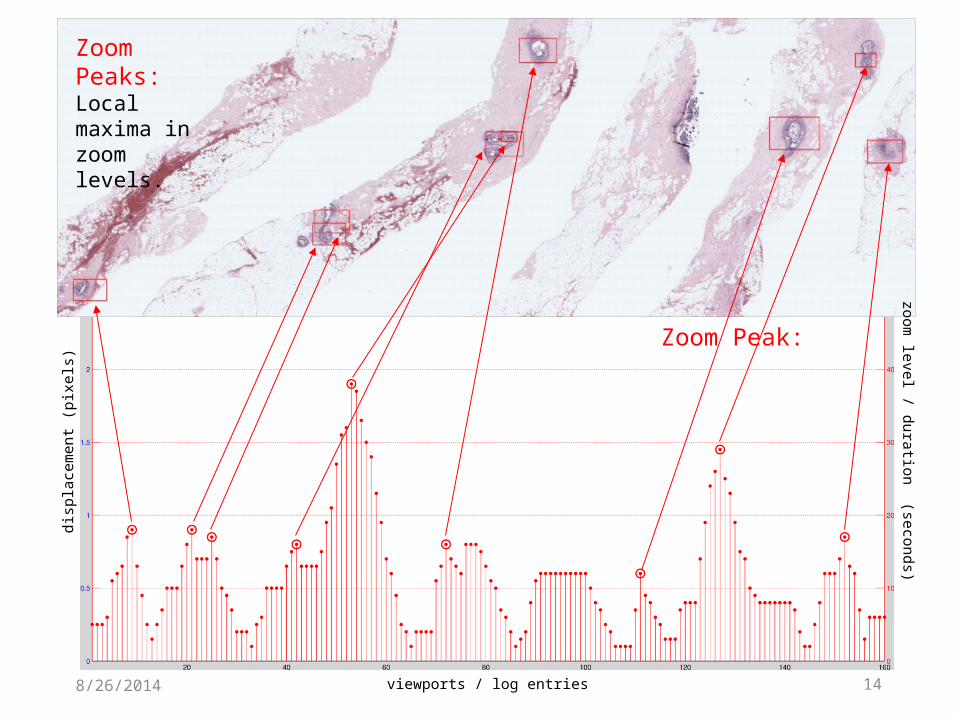
Zoom Peak:
disp
lace
men
t (pi
xels
)zoom
level / duration (seconds)
viewports / log entries
Zoom Peaks: Local maxima in zoom levels.
158/26/2014
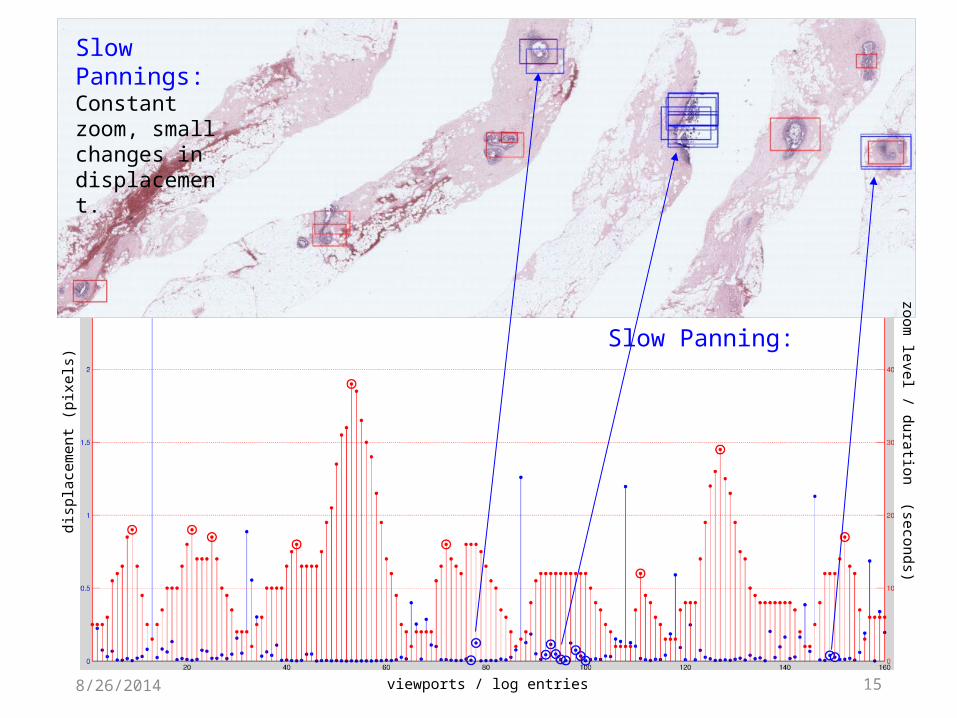
Slow Panning:
disp
lace
men
t (pi
xels
)zoom
level / duration (seconds)
viewports / log entries
Slow Pannings:Constant zoom, small changes in displacement.
168/26/2014
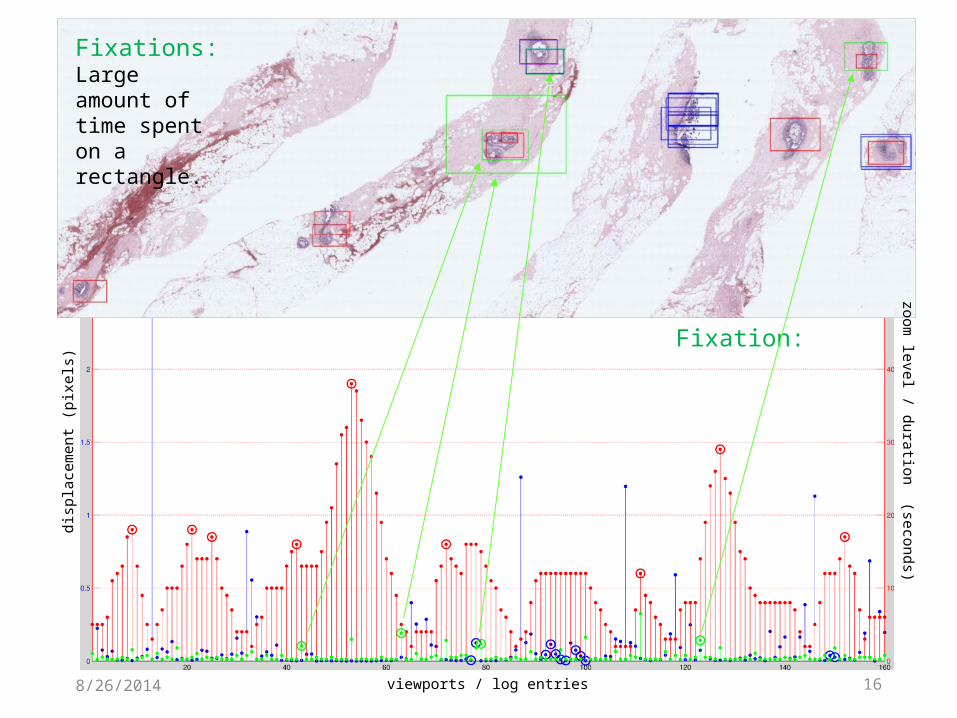
Fixation:
disp
lace
men
t (pi
xels
)zoom
level / duration (seconds)
viewports / log entries
Fixations:Large amount of time spent on a rectangle.
178/26/2014
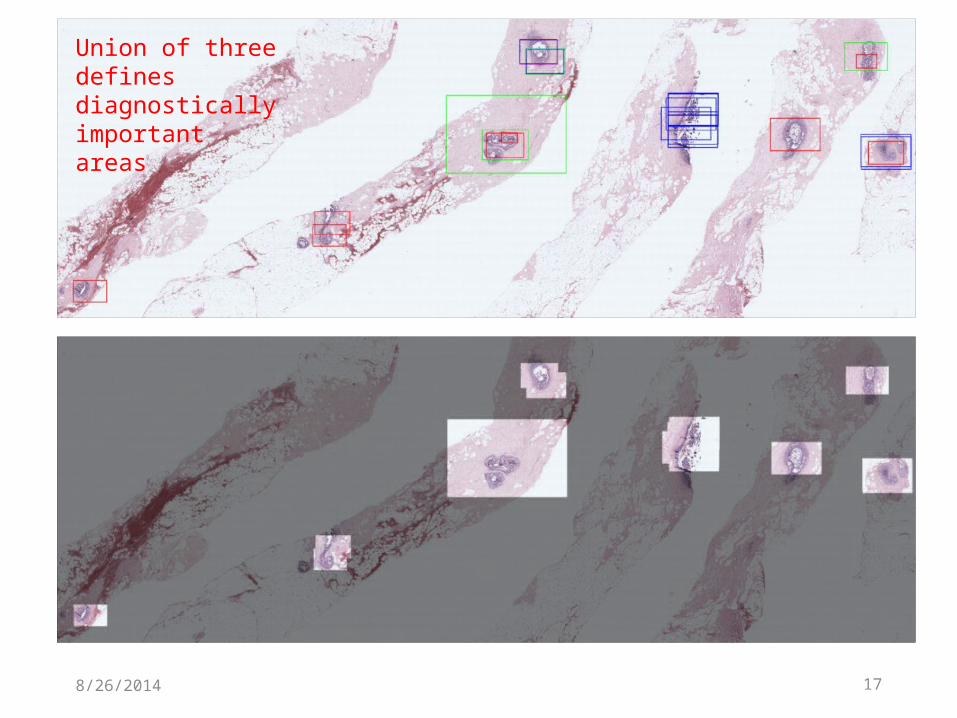
Union of three defines diagnostically important areas
18
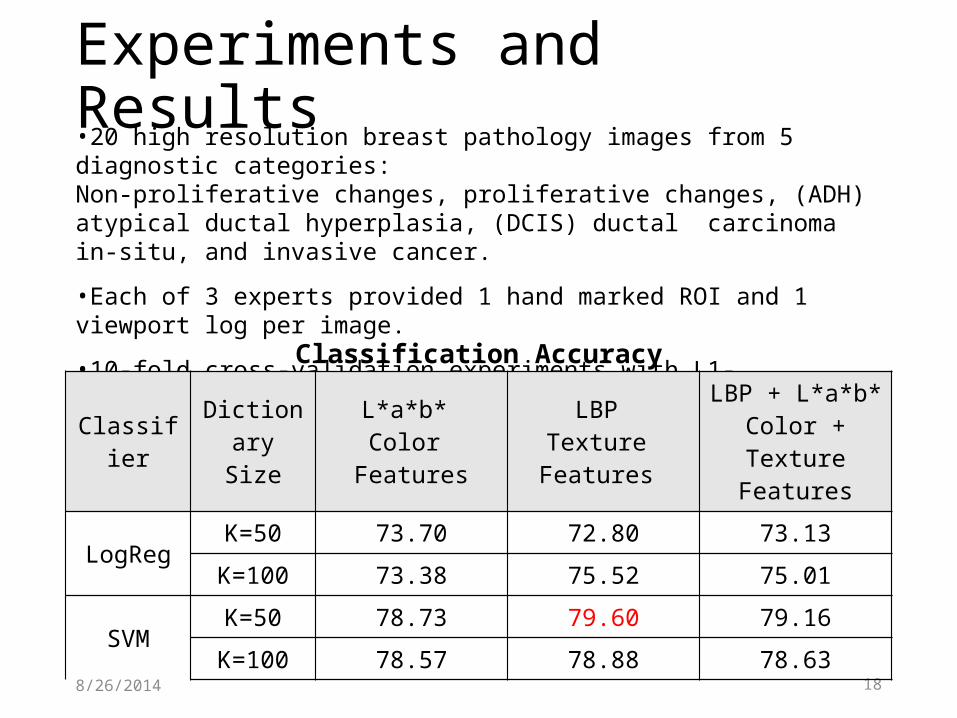
Experiments and Results•20 high resolution breast pathology images from 5 diagnostic categories: Non-proliferative changes, proliferative changes, (ADH) atypical ductal hyperplasia, (DCIS) ductal carcinoma in-situ, and invasive cancer.
•Each of 3 experts provided 1 hand marked ROI and 1 viewport log per image.
•10-fold cross-validation experiments with L1- regularized logistic regression and SVM. The differences between Logistic Regression and SVM are statistically significant.
8/26/2014
Classifier DictionarySize
L*a*b* Color
Features
LBP Texture
Features
LBP + L*a*b*Color + Texture
Features
LogRegK=50 73.70 72.80 73.13
K=100 73.38 75.52 75.01
SVMK=50 78.73 79.60 79.16
K=100 78.57 78.88 78.63
Classification Accuracy
198/26/2014
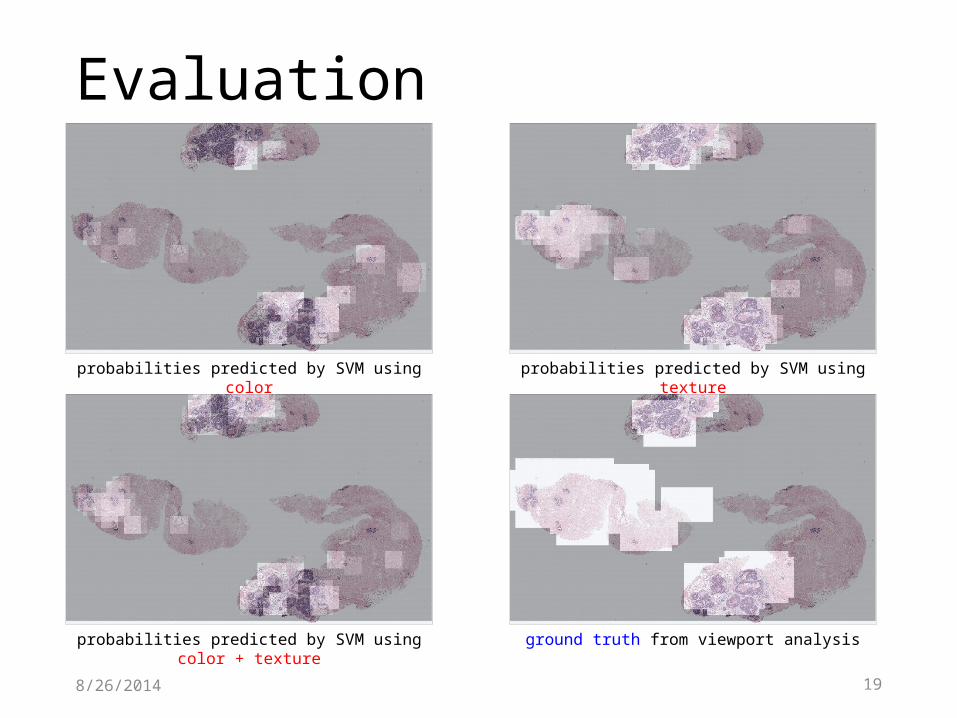
Evaluation
ground truth from viewport analysisprobabilities predicted by SVM using color + texture
probabilities predicted by SVM using color probabilities predicted by SVM using texture
20
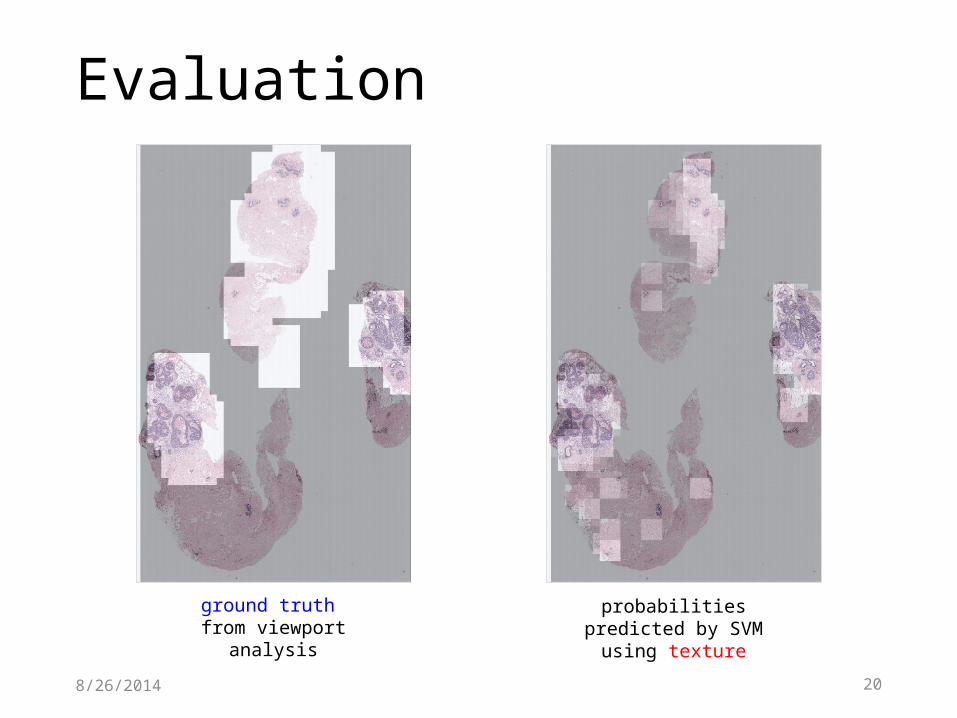
Evaluation
8/26/2014
ground truth from viewport analysis
probabilities predicted by SVM using texture
21
Discussion
• A method to predict regions of interest in whole slide images:
• learns a visual dictionary of different patches• models the regions as the frequencies of visual words
• 80% overlap between predictions and the actual regions pathologists look at
8/26/2014
22
• In training, hand-marked ROIs are used because the actual relevant regions retrieved from viewport logs include a lot of background.
• In testing, ground truth consists of everything pathologists see on the screen, including background around edges, decreasing accuracy.
8/26/2014
Discussion
23
Future Work
• Additional features based on superpixels.• Add eye-tracking to the mouse tracking data.• Apply multi-instance learning using multiple ROIs
with different labels from the same image.• Construct graphs from the tracking data that
summarize how each pathologist scans each slide.• Study data from 100 community pathologists in
addition to the current 3 expert pathologists.
8/26/2014
This work was supported by the National Cancer Institute under Grant No. R01-CA172343and Grant No. K05-CA104699. S. Aksoy was supported by a Fulbright Visiting Scholar grant.