locating of series facts devices for multi-objective ...ijeee.iust.ac.ir/article-1-1025-en.pdf ·...
TRANSCRIPT

Iranian Journal of Electrical & Electronic Engineering, Vol. 13, No. 1, March 201732
1. Introduction
In deregulated environment, the process of the powergrid such as generation, transmission, distribution andcontrol are separated entities and market contributors in-terdepend themselves in order to sell or buy the electricityin a way to maximize their turnover. To meet the preferredtransacting, power flow in the transmission system in-vades some of the physical restrictions of the transmissionnetworks. Accordingly, transmission system is congested.Congestion may occur due to absent of management be-tween generation and transmission utilities or because ofunexpected probabilities likes power producer’s outage,unexpected increase of load demand, or failure of equip-ment. The unattractive result of the congestion causes in-consistency of the system safety and increment of thepower cost. Congestion can be reduced by reschedulingactive power of generators, load limitation and operationof phase shifters or FACTS devices. A proper controlling
action is needed effectively to mitigate the line overloadsto the safety limits. There are many publications availablethat qualify methods for mitigating congestion in restruc-tured power system. In [1], Ashwani Kumar et al havedone a bibliographical review on congestion managementsystems in a competitive electricity market. The authorsshowed that one of the most skillful and understandabletechnique of congestion handling is redistributing thepower outputs of generators in the system. In [2], two ef-fective methods are suggested for solving congestion han-dling problem in a day ahead market by generatorrescheduling. In [3], a novel ant lion optimizer has beenappointed to solve the problem of congestion by redistri-bution of active power of generators. In [4], a new ap-proach is suggested for palliation congestion relievingcost by feeding needed reactive power of system in addi-tion to re-dispatching active power of generators and loadshedding. A new locational marginal pricing (LMP) cal-culation method is suggested in [5] to deviate the mainhitches with DC power flow based on LMP calculations.LMP is usually crumbled into three components, marginalcost of energy, loss and congestion which are proposed in[6]. Particle swarm optimization (PSO) is employed tosolve the OPF problem in congestion management usingre-dispatch of transactions in a pool market [7]. The ideaof game theory in the restructured electricity market has
Locating of Series FACTS Devices for Multi-Objective
Congestion Management Using Components of Nodal
Prices
A. R. Moradi*, Y. Alinejad-Beromi*(C.A.) and K. Kiani*
Abstract: Congestion and overloading for lines are the main problems in the exploitation of power grids.The consequences of these problems in deregulated systems can be mentioned as sudden jumps in prices insome parts of the power system, lead to an increase in market power and reduction of competition in it.FACTS devices are efficient, powerful and economical tools in controlling power flows through transmissionlines that play a fundamental role in congestion management. However, after removing congestion, powersystems due to targeting security restrictions may be managed with a lower voltage or transient stabilityrather than before removing. Thus, power system stability should be considered within the construction ofcongestion management. In this paper, a multi-objective structure is presented for congestion managementthat simultaneously optimizes goals such as total operating cost, voltage and transient security. In order toachieve the desired goals, locating and sizing of series FACTS devices are done with using components ofnodal prices and the newly developed grey wolf optimizer (GWO) algorithm, respectively. In order to eval-uate reliability of mentioned approaches, a simulation is done on the 39-bus New England network.
Keywords: Congestion management, electricity markets, FACTS devices, multi-objective optimization,power system stability margin
Iranian Journal of Electrical & Electronic Engineering, 2017.Paper received 24 November 2016 and accepted 8 April 2017.* The authors are with the Faculty of Electrical and Computer Engi-neering, Semnan University, Semnan, Iran.E-mails: [email protected], [email protected] [email protected] Author: Y. Alinejad-Beromi.
Dow
nloa
ded
from
ijee
e.iu
st.a
c.ir
at 5
:32
IRD
T o
n T
uesd
ay J
uly
3rd
2018
[
DO
I: 10
.220
68/IJ
EE
E.1
3.1.
4 ]

Iranian Journal of Electrical & Electronic Engineering, Vol. 13, No. 1, March 2017 33
established communicatively to display how symmetrypoint of electricity market departs under the strategicgaming in [8]. The pricing of marginal transmission lossesin the LMP approach in the ISO New England standardmarket design are presented by Litvinov et al [9]. Differ-ent calculations models and stable properties on LMPbased on different market designs are propounded in [10].A multilayer feed forward neural network is proposed forremoving line overloads in real time for restructuredpower system [11]. In [12], the authors showed that thecongestion release could be attained by re-dispatchingmethod considering the collective operation of hydro andthermal generating companies in a deregulated environ-ment. To solve the multi-objective optimization problemof the congestion management, a new effective multi-ob-jective mathematical programming solution approachbased on normalized normal constraint method is pre-sented in [13]. Flexible AC Transmission System(FACTS) plays a significant role in increasing load abilityand removing congestion in the network. FACTS devicescan improve the efficiency extremely by controlling thepower flows in the network without generation re-dis-patching or structure changes [14-15]. Different ap-proaches have been proposed for optimal location ofFACTS devices including sensitivity analysis [6, 16], con-gestion handling by unified power flow controller (UPFC)[17] and interline power flow controller (IPFC) [18]. Theauthors in [19] review a fuzzy interactive multi-objectiveapproach for the optimal location of UPFC to enhancepower system operation. To manage transmission linecongestion in hybrid electricity markets, the capability ofSen Transformer has been used in [20]. A PSO-based al-gorithm is used to find the optimal position and the pa-rameters setting of UPFC to increase load ability [21]. In[22], it reviews a fuzzy-genetic algorithm (GA) approachfor the optimal placement of FACTS devices in a powersystem for congestion management. A GA-based algo-rithm is used in [23] to find the optimal locating and theparameters setting of Thyristor Controlled Series Com-pensator (TCSC) to increase loadability. In [24], theTCSC are located for congestion management in thepower system by considering the non-smooth fuel costfunction and penalty cost of emission. In this reference,bacterial foraging and Nelder-Mead algorithm is appliedto solve TCSC placement problem for congestion man-agement.
None of the mentioned references has consideredpower system security concerns. Thus, power system sta-bility should be considered within the construction of con-gestion management. On the other hand, in order toimprove power system security, significant references arepresented to apply FACTS devices. In [25], trajectory sen-sitivity approach for optimal locating of series FACTS de-vices is presented to enhance transient stability. Tomaintain the voltage stability in the power transmission
system, a novel technique is presented in [26], to optimizethe FACTS devices. In this reference, the PSO and theadaptive gravitational search algorithm (GSA) techniqueare presented for improving the voltage stability of thepower transmission systems.
In this paper, a multi-objective structure is presentedfor congestion management that simultaneously optimizesgoals such as total operating cost, voltage and transientsecurity. Voltage Stability Margin (VSM) [27] and Cor-rected Transient Energy Margin (CTEM) [28] indices areapplied in this paper for measuring of voltage and tran-sient security margins, respectively. In order to achievethe desired goals, locating and sizing of series FACTS de-vices (TCSC is considered as a series FACTS device) aredone via using the components of nodal prices and thenewly developed grey wolf optimizer (GWO) algorithm,respectively.
Most of the references use methods based on the iter-ation for optimal locating of FACTS devices. These meth-ods may not achieve optimal solution and they consumelots of time. Therefore, for solving these challenges, thispaper tries to indicate a new methodology to locate thebest position of FACTS devices for congestion manage-ment in the deregulated electricity markets. Also, thismethod indicates the accuracy explanation of each nodalprice, by categorizing each nodal price into variety of el-ements corresponding to the important factors, as gener-ations, transmission density, voltage constraints and otherlimitations. The decomposition is unique and componentsin each nodal price are identical to increase the valuesfrom the economic criteria by utilizing of derivations thatare based on the marginal conditions. This full informa-tion for nodal prices can be used not only to improve theefficient usage of power grid and congestion management,but also this information tries to design a suitable pricingstructure of power systems, to prepare economic signalsfor generation or transmission investment. The proposedmethod is applicable to any type of series FACTS devices.
On the other hand, a new algorithm based on theswarm intelligence named as GWO for sizing of TCSChas been used. This algorithm is inspired by the social be-havior of grey wolves in nature. It can be expressed thatthe GWO algorithm has a better convergence in contrastwith the other algorithms that are similar because of em-ploying the same mathematical model in order to searchoptimal solutions. It should be mentioned that GWO al-gorithm check the search space with high speed in the ini-tial steps for finding the optimal solution then by reachingthe final steps, it reduces speed of changing position. So,convergence of an algorithm is guaranteed in the searchspace. The efficiency of these methods is performed with39-bus New England system.
Structure of the article is as follows: 2th chapter pres-ents the mathematical model of TCSC. Derivation ofnodal price is in 3th chapter. 4th chapter describes the pro-
Dow
nloa
ded
from
ijee
e.iu
st.a
c.ir
at 5
:32
IRD
T o
n T
uesd
ay J
uly
3rd
2018
[
DO
I: 10
.220
68/IJ
EE
E.1
3.1.
4 ]

Iranian Journal of Electrical & Electronic Engineering, Vol. 13, No. 1, March 201734
posed placement methodology for series FACTS devicesin deregulated market. 5th, 6th chapters are simulation re-sults and conclusion, respectively.
2. Modelling of TCSC
The transmission line model with a TCSC joint be-tween the two buses i and j is shown in Fig. 1. TCSC canbe considered as a static reactance of magnitude equiva-lent to -jX_C. The controllable reactance is directly usedas a control variable to be implemented in power flowequation.
The variation in the line flow because of series capac-itance can be illustrated as a line without series capaci-tance with power injected at the both ends of the line insending and receiving as shown in Fig. 2.
The active and reactive power infusions due to TCSCat bus-i and bus-j can be expressed as,
(1)
(2)
(3)
(4)
where
(5)
(6)
This model of TCSC is applied to properly change theparameters of transmission line with TCSC for optimallocation.
3. Extraction of nodal price
3.1 Problem formulation
In this paper, a multi-objective congestion managementstructure is formulated to determine the optimal locatingand sizing of TCSC. The proposed structure minimizesthe total operating cost and maximizes voltage stabilitymargin (VSM) and corrected transient energy margin(CTEM) to enhance the stability of the power system. Thephrases for these goals are given as follows:
- Minimize f1: Total operating cost
(7)
where SD and SG are the set of participating demands andgenerators in the market, respectively. Also B_Dk andC_Gk are the benefit curve of kth demand and bid curveof kth generator, respectively. It is noteworthy that thebenefit curve of demands and bid curve of generators areconsidered as quadratic functions [29].
- Maximize f2: Voltage stability margin (VSM)
In this paper, VSM [27] is the index used for measuringvoltage security and continuation power flow (CPF) isused to define the maximum load ability limit.
After using congestion management, the final VSM isgiven below:
(8)
where VSM0 is the VSM value before using congestionmanagement and the phrase for ∆VSM is given as follows[30]:
h
Fig. 2. Injection model of TCSC
Fig. 1. Model of Transmission line with TCSC
Dow
nloa
ded
from
ijee
e.iu
st.a
c.ir
at 5
:32
IRD
T o
n T
uesd
ay J
uly
3rd
2018
[
DO
I: 10
.220
68/IJ
EE
E.1
3.1.
4 ]
Iranian Journal of Electrical & Electronic Engineering, Vol. 13, No. 1, March 2017 35
(9)
where i and j are the two buses of the branch where theTCSC is installed. Q_ic and Q_jc are reactive powers in-jected to buses because of installing TCSC as shown inFig. 2. Q_Dk is reactive power consumption of kth de-mand and SD is the set of participating demands in themarket.
- Maximize f3: Corrected transient energy margin
(CTEM)
In this paper, CTEM [28] is the index used to measuretransient security. CTEM is defined as a function of gen-erators’ active power generation.
After using congestion management, the final CTEMis given as follows:
(10)
where CTEM0 is the CTEM value before using conges-tion management and the phrase for ∆CTEM is given asfollows [30]:
(11)
where PGk is active power production of kth generatorand SG is the set of participating generators in the mar-ket.
The optimization is performed under the followingequality and inequality constraints:
- Equality constraints:
a) Power balance equation
(12)
(13)
If TCSC is located in line between buses i and j, thepower balance equations in nodes i and j are given by:
(14)
(15)
(16)
(17)
where PGi and QGi are active and reactive power produc-tion at bus i, PDi and QDi are active and reactive powerconsumption at bus i, Pic and Qic are the net active andreactive power injection at bus i.
- Inequality constraints:
a) Apparent line flow limit
(18)
b) Power generation limit
(19)
(20)
c) Demand limit
(21)
(22)
d) Bus voltage limit
(23)
e) TCSC reactance limit
(24)
f) VSM limit
(25)
g) CTEM limit
(26)
where PGimin and PGi
max are minimum and maximum activepower production at bus i, QGi
min and QGimax are minimum
and maximum reactive power production at bus i, PDimin
and PDimax are minimum and maximum active power con-
sumption at bus i, QDimin and QDi
max are minimum andmaximum reactive power consumption at bus i, Vi
min andVi
max are minimum and maximum voltage at bus i, Sij isthe apparent power in transmission line connecting busesi and j, and Sij
max is its maximum limit, xcmin and xc
max arethe minimum and maximum limits of TCSC reactance,and N is the number of buses in the system.
Dow
nloa
ded
from
ijee
e.iu
st.a
c.ir
at 5
:32
IRD
T o
n T
uesd
ay J
uly
3rd
2018
[
DO
I: 10
.220
68/IJ
EE
E.1
3.1.
4 ]

Iranian Journal of Electrical & Electronic Engineering, Vol. 13, No. 1, March 201736
3.2 Nodal price
Define the Lagrangian function as L, then
(27)
where λ= (λ1, …, λn1) and ρ= (ρ1, …, ρn2) are the la-grangian multipliers associated with equality and inequal-ity constraints, respectively, in addition to it they areusually explained as shadow prices from the economicspoint of view.
Then at an optimal solution (X, λ, ρ) and for a set ofgiven (P, Q), the nodal prices of real and reactive powerfor each bus are presented for k = 1,…, n as follows:
(28)
(29)
A remarkable trait for nodal prices is that each nodalprice is absolutely defined simply as a linear summationof all factors according to Eq. (28) and (29) equation be-cause each nodal price, e.g.,π_(P,k) can be rewritten as,
(30)
On the other hand, this trait is completely differentfrom that of AC load flow, which is generally nonlinearto each route or source. Therefore, theoretically it is pos-sible to trace the contributions of all factors engaging inperformance of power systems to each nodal price.
4. Proposed methodology
There are numerous constraints or factors affecting theoperation of power systems, e.g., line flow limitation, gen-erators, voltage limitation, and power flow balance situa-tion. Some of them (e.g., voltage constraint) have marketvalues that may be relaxed and taken as some tradablethings rely on market needs. The relaxation for these lim-its may be figured out by facility investments or technol-ogy innovations, etc. However, some of them reallycannot be traded, e.g., for real power flow balance situa-tion at each bus, the summation of all injected real powerat each bus must be zero which cannot be relaxed or vio-lated because it is a physical law. However, the evaluationfor the factors with no market value is pointless, eventhough we can theoretically follow the shares of all factorsinvolving in the performances of power systems to eachnodal price. Hence, before breaking down the nodalprices, we have to classify all constraints in the perform-ances of power systems into two groups [31], i.e., no trad-able constraints that are forcible constraints during the
operation and are not components of nodal prices, andtradable constraints, which should be components of eachnodal price. Let M be the constraints which we do not in-tend expressly to count their charges for nodal prices (notradable constraints), and N be the remaining constraints(tradable constraints). Define α to be the Lagrangian mul-tipliers corresponding to the constraints of M, and β to bethe remaining Lagrangian multipliers corresponding to N.
By considering X and 𝛼 as functions of (P, Q), the La-grangian function of Eq. (27) can be rewritten as follows[31]:
(31)
Therefore, differentiating L of Eq. (31) with respect top_k and q_k, nodal prices of Eq. (28) and (29) become,
(32)
(33)
Next, we display that Eq. (32) is actually the decom-posed nodal prices. If the objective function is constructedby many factors, i.e., f=∑ifi , thenfxXpk+fpk=∑i((∂fi/∂x)(∂x/∂pk)+(∂fi/∂pk)) for the firstterm of Eq. (32). Let N=(N1, N2, …)T and β=(β1, β2, …)where Nj and βj are the jth equation of N and its respectivelagrangian multiplier. Then the second term of Eq. (32)can be represented asβ(NxXpk+Npk)=∑Jβj((∂Nj/∂x)(∂x/∂pk)+(∂Nj/∂pk)).Therefore, ((∂fi/∂x)(∂x/∂pk)+(∂fi/∂pk)) is the componentassociated to the factor fi (e.g., the ith generator) for realpower, while βj((∂Nj/∂x)(∂x/∂Pk )+(∂Nj/∂pk)) representthe term of the respective constraint Nj for real power.Generally, each term in Eq. (32) is nonzero at an optimalsolution, in contrast with the terms of Eq. (28).
5. Simulation results and discussion
Because of the high cost of power flow control devicesinstallation and variety of these devices and also changingthe price of these devices with changing capacity, the sys-tem operator should study carefully in order to select type,capacity and a good place to install these devices. Eco-nomical installation costs of FACTS devices in the net-work should be checked from the point of view ofconsumer, producer and operator. It is very important eco-nomically and it has tried to check the subject in order toanalyze the impact of devices on the network to obtainproperly analysis.
L(X, , ,P,Q) = f(X,P,Q) + G(X,P,Q) + H(X,P,Q)
Dow
nloa
ded
from
ijee
e.iu
st.a
c.ir
at 5
:32
IRD
T o
n T
uesd
ay J
uly
3rd
2018
[
DO
I: 10
.220
68/IJ
EE
E.1
3.1.
4 ]

Iranian Journal of Electrical & Electronic Engineering, Vol. 13, No. 1, March 2017 37
In this paper, for 39-bus New England system whichis shown in Fig. 3, four scenarios have been described ac-cording to Table 1 that shows minimum and maximumdemand of spring and summer seasons. To simulate con-gestion, these scenarios have been considered as incre-ment factor (λ) and multiply in all system loads. Tocalculate the amount of power flow on each line, busesvoltage, active and reactive power generation of powerplants, consumption of active and reactive power of loadbuses and other values, optimal power flow (OPF) foreach scenario has been performed. Then, component ofnodal price method indicates the accuracy for explanationof each nodal price, by categorizing each nodal price intovariety of elements corresponding to the important fac-tors, as generations, transmission density, voltage con-straints and other limitations. After performing OPF in allscenarios, each nodal price is checked to find impact ofactivated constraint in network on each bus price. By cal-culating component of nodal price, enough informationfor the analysis of prices and deciding on the allocationof devices is obtained.
In this paper, to manage congestion, dense lines in dif-ferent scenarios are separated from another line and thenthe most effective dense line that has more effect on nodalprices is selected. This means that because of rising de-mand in the system, number of dense lines in the systemis increased too, and because it is not possible to installFACTS devices in several lines due to more cost of instal-lation, the system operator must choose most effectiveline between the all dense lines. Therefore, the importanceof the allocation of the power flow control devices to con-trol density on the network is increased.
5. 1. Analysis of network in the presence of conges-
tion of transmission lines
Table 2 shows the results after implementing optimalpower flow for four scenarios in 39-bus New England sys-tem. In this paper, the capacity of lines 1-2, 6-7, 12-11 and
17-27 are set to 150, 330, 40 and 50 MVA, respectively,as extra suppositions [30].
Checking the activated constraints in four scenariosshow that by changing the load levels in the system, lim-itations would occur that these limitations include ap-proaching plants generation to the highest and lowestlevel of their generation. In both cases, this limitation hasimpact on the network power flow and the price of buses.Another limitation is the voltage level of buses. As it isknown, the voltage level must be provided in a specified
Fig. 3. 39-bus New England system
Table 1. Scenarios defined
= Load Level
0.3 Scenario1 Spring 1 Scenario2
0.8 Scenario3 Summer 1.023 Scenario4
Table 2. Active constraints in each scenario
Dow
nloa
ded
from
ijee
e.iu
st.a
c.ir
at 5
:32
IRD
T o
n T
uesd
ay J
uly
3rd
2018
[
DO
I: 10
.220
68/IJ
EE
E.1
3.1.
4 ]
Iranian Journal of Electrical & Electronic Engineering, Vol. 13, No. 1, March 201738
tolerance for the consumer because power systems equip-ment and consumer equipment would be damaged whenvoltage level achieves to high or low level. Also, theselimitations make problems in the network that are com-promised by the stability of the power system, so theymust be removed. The final limitation is overloading oftransmission lines that the importance of this constraintin the power network is great. Since the transmission linesare connector between the producer and consumer, andsince the amount of consumption in network is increaseddaily and new consumer feed from this system, powersystem operator must create a competitive market that allparticipants can access to network easily and freely.
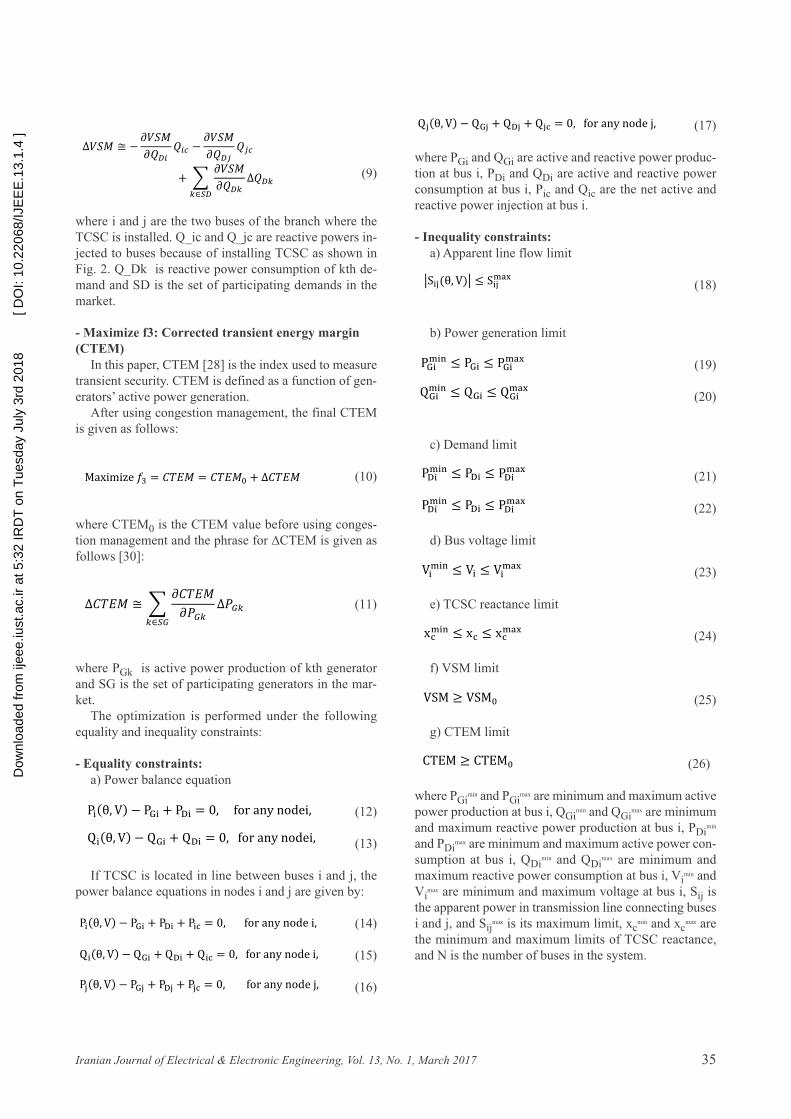
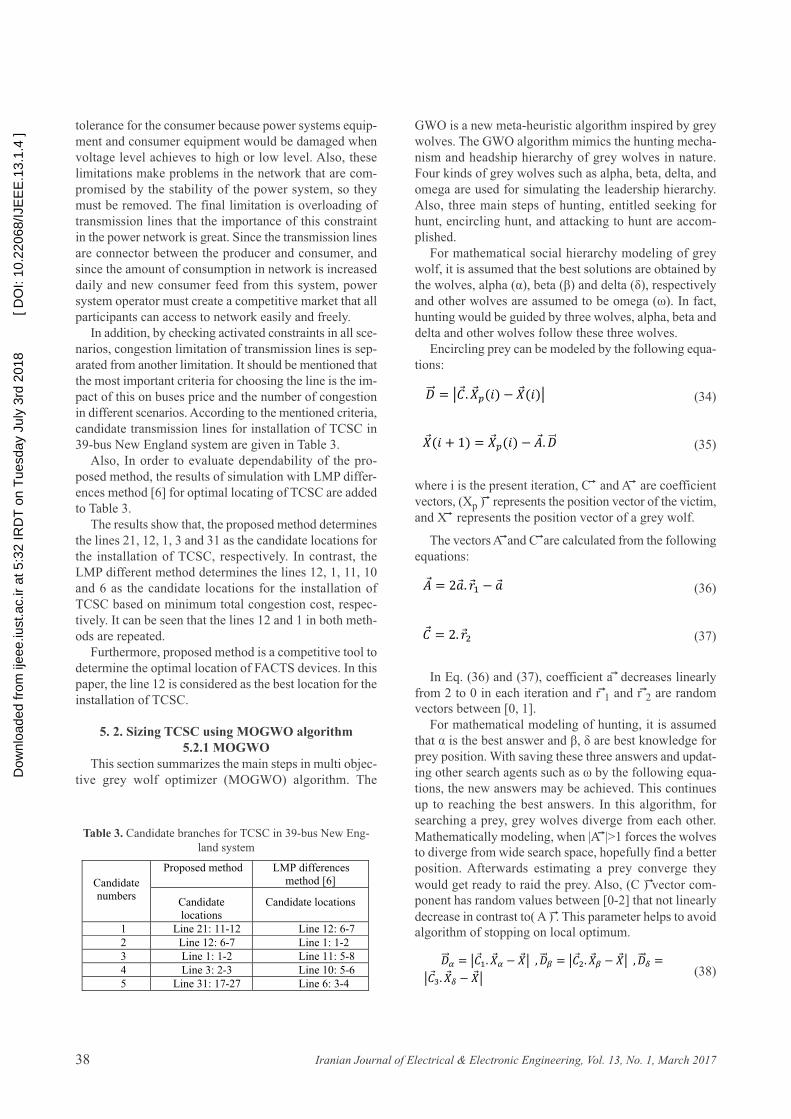
In addition, by checking activated constraints in all sce-narios, congestion limitation of transmission lines is sep-arated from another limitation. It should be mentioned thatthe most important criteria for choosing the line is the im-pact of this on buses price and the number of congestionin different scenarios. According to the mentioned criteria,candidate transmission lines for installation of TCSC in39-bus New England system are given in Table 3.
Also, In order to evaluate dependability of the pro-posed method, the results of simulation with LMP differ-ences method [6] for optimal locating of TCSC are addedto Table 3.
The results show that, the proposed method determinesthe lines 21, 12, 1, 3 and 31 as the candidate locations forthe installation of TCSC, respectively. In contrast, theLMP different method determines the lines 12, 1, 11, 10and 6 as the candidate locations for the installation ofTCSC based on minimum total congestion cost, respec-tively. It can be seen that the lines 12 and 1 in both meth-ods are repeated.
Furthermore, proposed method is a competitive tool todetermine the optimal location of FACTS devices. In thispaper, the line 12 is considered as the best location for theinstallation of TCSC.
5. 2. Sizing TCSC using MOGWO algorithm
5.2.1 MOGWO
This section summarizes the main steps in multi objec-tive grey wolf optimizer (MOGWO) algorithm. The
GWO is a new meta-heuristic algorithm inspired by greywolves. The GWO algorithm mimics the hunting mecha-nism and headship hierarchy of grey wolves in nature.Four kinds of grey wolves such as alpha, beta, delta, andomega are used for simulating the leadership hierarchy.Also, three main steps of hunting, entitled seeking forhunt, encircling hunt, and attacking to hunt are accom-plished.
For mathematical social hierarchy modeling of greywolf, it is assumed that the best solutions are obtained bythe wolves, alpha (α), beta (β) and delta (δ), respectivelyand other wolves are assumed to be omega (ω). In fact,hunting would be guided by three wolves, alpha, beta anddelta and other wolves follow these three wolves.
Encircling prey can be modeled by the following equa-tions:
(34)
(35)
where i is the present iteration, C ⃗ and A ⃗ are coefficientvectors, (Xp ) ⃗ represents the position vector of the victim,and X ⃗ represents the position vector of a grey wolf.
The vectors A ⃗ and C ⃗ are calculated from the followingequations:
(36)
(37)
In Eq. (36) and (37), coefficient a ⃗ decreases linearlyfrom 2 to 0 in each iteration and r ⃗1 and r ⃗2 are randomvectors between [0, 1].
For mathematical modeling of hunting, it is assumedthat α is the best answer and β, δ are best knowledge forprey position. With saving these three answers and updat-ing other search agents such as ω by the following equa-tions, the new answers may be achieved. This continuesup to reaching the best answers. In this algorithm, forsearching a prey, grey wolves diverge from each other.
Mathematically modeling, when |A ⃗ |>1 forces the wolvesto diverge from wide search space, hopefully find a betterposition. Afterwards estimating a prey converge they
would get ready to raid the prey. Also, (C ) ⃗vector com-ponent has random values between [0-2] that not linearly
decrease in contrast to( A ) ⃗. This parameter helps to avoidalgorithm of stopping on local optimum.
(38)
(38
Table 3. Candidate branches for TCSC in 39-bus New Eng-land system
LMP differences method [6]
Proposed method Candidate numbers Candidate locations Candidate
locations Line 12: 6-7 Line 21: 11-12 1 Line 1: 1-2 Line 12: 6-7 2 Line 11: 5-8 Line 1: 1-2 3 Line 10: 5-6 Line 3: 2-3 4 Line 6: 3-4 Line 31: 17-27 5
Dow
nloa
ded
from
ijee
e.iu
st.a
c.ir
at 5
:32
IRD
T o
n T
uesd
ay J
uly
3rd
2018
[
DO
I: 10
.220
68/IJ
EE
E.1
3.1.
4 ]

Iranian Journal of Electrical & Electronic Engineering, Vol. 13, No. 1, March 2017 39
(39)
(40)
Fig. 4 shows that in a two-dimensional space, how thesearch agents are updated by alpha, beta and delta posi-tions. In other words, Fig. 4 shows that α, β and δ estimateprobable position of the prey (best answer) in the searchspace and other wolves update their position in the ran-dom place within a circle around the α, β and δ.
Two new components: first, an archive that is respon-sible for storage of optimal solutions of non-dominatedPareto and second, leader selection strategy that helps tochoose the best leader between archive, are added here inorder to create multi objective GWO algorithm [32]. Aux-iliary components added are similar to MOPSO method.An archive that is added for creating multi objectiveGWO algorithm is a simple storage unit. This unit storesthe best optimal solutions of non-dominated Pareto ob-tained so far.
The second component helps us choose the leader byusing roulette wheel method and probability function thatis introduced in the following:
(41)
C1: a constant number greater than 1Ni: Number of obtained Pareto optimal solutions in the
ith segment.
More comprehensive description of the MOGWO al-gorithm is given in [32].
5.2.2 Utilization of MOGWO in sizing TCSC
In this section, the MOGWO algorithm for sizing ofTCSC is presented. In this algorithm, first, initial popula-
tion of wolves, parameter a ⃗, coefficient vectors( A) ⃗, C ⃗and maximum numbers of iteration are defined. Then, ini-tial population of wolves are spread randomly in the de-fined search space that the position of each wolf has beenconsidered as value of TCSC. For each position, optimalpower flow runs in order to calculate the fitness functionsaccording to equations (7), (8), and (10), subject to satisfyconstraints (12) to (26). Then, the non-dominant solutionsare determined and the archive is initialized according tothem. The best position of wolves in the archive, are
named as 𝛼, β and δ and the position of the rest of wolvesare called ω. Then, the value of parameter a ⃗ decreaseslinearly from 2 to 0 in each iteration in order to confirmexploration and exploitation.
At this point, the position of the other wolves (ω) rel-ative to top wolves' position (alpha, beta and delta), is up-dated according to equations (38) and (39). This update,takes places according to distance of rest of the wolves(ω) from top wolves' position (alpha, beta and delta) andare named as X1, X2 and X3. Then, next new position isobtained by calculating average of the positions X1, X2and X3 according to equation (40). The value of fitnessfunctions for this position is calculated. At this time, thenon-dominant solutions are determined and the archive isupdated according to them. Then if the archive would befull, the grid mechanism runs to omit one of the currentarchive members and add the new solution to the archive.
Fig. 4. Position updating in GWO
Dow
nloa
ded
from
ijee
e.iu
st.a
c.ir
at 5
:32
IRD
T o
n T
uesd
ay J
uly
3rd
2018
[
DO
I: 10
.220
68/IJ
EE
E.1
3.1.
4 ]
Iranian Journal of Electrical & Electronic Engineering, Vol. 13, No. 1, March 201740
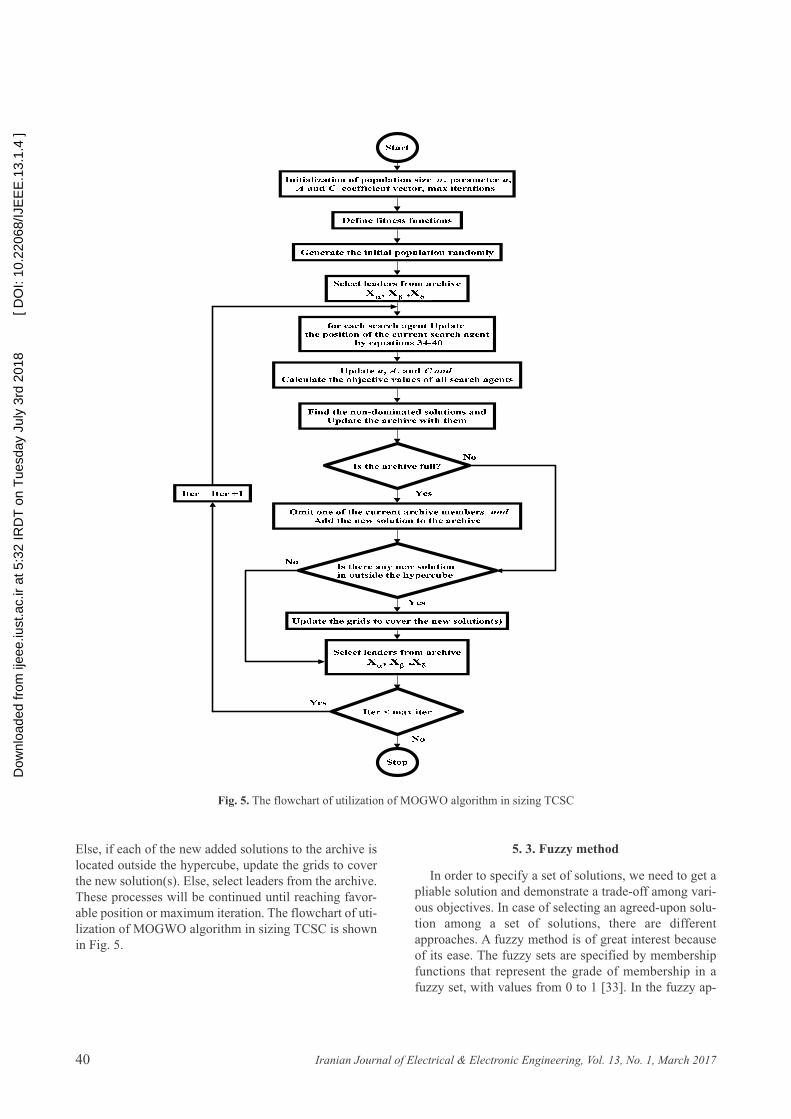
Else, if each of the new added solutions to the archive islocated outside the hypercube, update the grids to coverthe new solution(s). Else, select leaders from the archive.These processes will be continued until reaching favor-able position or maximum iteration. The flowchart of uti-lization of MOGWO algorithm in sizing TCSC is shownin Fig. 5.
5. 3. Fuzzy method
In order to specify a set of solutions, we need to get apliable solution and demonstrate a trade-off among vari-ous objectives. In case of selecting an agreed-upon solu-tion among a set of solutions, there are differentapproaches. A fuzzy method is of great interest becauseof its ease. The fuzzy sets are specified by membershipfunctions that represent the grade of membership in afuzzy set, with values from 0 to 1 [33]. In the fuzzy ap-
Fig. 5. The flowchart of utilization of MOGWO algorithm in sizing TCSC
Dow
nloa
ded
from
ijee
e.iu
st.a
c.ir
at 5
:32
IRD
T o
n T
uesd
ay J
uly
3rd
2018
[
DO
I: 10
.220
68/IJ
EE
E.1
3.1.
4 ]

Iranian Journal of Electrical & Electronic Engineering, Vol. 13, No. 1, March 2017 41
proach, a strictly monotonically decreasing and continu-ous membership function is defined for each objective.
The membership function illustrates the extent inwhich a solution is satisfying the objective functions q. Alinear membership function can be applied for all objec-tives:
(42)
Fig. 6 shows the graph of this membership function.
By taking the individual minimum and maximum val-ues of each objective function into account, the member-ship function μ_(f_q ) (X ̅ ) for each objective function
can be specified in a subjective method. Then, for a multi-objective optimization problem with Q objective func-tions, the final solution can be found as:
(43)
5. 4. Results
The proposed methodology for optimal locating ofTCSC is performed for two cases, as follows:
First case: Optimal locating of TCSC for single-objec-tive congestion management: In this case, total operatingcost would be considered as a single objective for optimalplacement.
Second case: Optimal locating of TCSC for multi-ob-jective congestion management: In this case, total oper-ating cost, voltage and transient security would beconsidered as three objectives for optimal placement.
Here, it should be noted that all calculations and analy-ses are performed for peak load demand and there is morecongestion in the network at the same time.
The optimized results for the first case are shown inTable 4. In addition, In order to evaluate the dependabilityof the proposed method, the results of simulation withmodified augmented ԑ-constraint method [30] are addedto Table 4.
Variation of operating cost curve based on the first caseusing GWO algorithm has been shown in Fig. 7. To solvethe problem of sizing TCSC by proposed algorithm,
Fig. 6. Linear type membership function
Fig. 7. The variation of operating cost curve based on the first case using GWO
Cost ($/hour) TCSC (%) TCSC branch (Candidate location)
7958.89 70 Line 12: 6-7 proposed methodology
7959.69 70 Line 12: 6-7 Modified augmented -constraint method [30]
Table 4. Optimal solution based on the first case
Dow
nloa
ded
from
ijee
e.iu
st.a
c.ir
at 5
:32
IRD
T o
n T
uesd
ay J
uly
3rd
2018
[
DO
I: 10
.220
68/IJ
EE
E.1
3.1.
4 ]

Iranian Journal of Electrical & Electronic Engineering, Vol. 13, No. 1, March 201742
GWO algorithm has been run 50 times for this case, andcontrolling parameter of GWO algorithm is as follow:
Number of grey wolves = 30The CPU time is needed for sizing TCSC is less than
5 second at each iteration. The evaluation platform is aworkstation system with a 2.66 GHZ Intel Core 2 DuoCPU and 4GBs of RAM.
The optimized results for the second case are shown inTable 5. In addition, In order to evaluate the dependabilityof the proposed method, the results of simulation withmodified augmented ԑ-constraint method [30] are addedto Table 5.
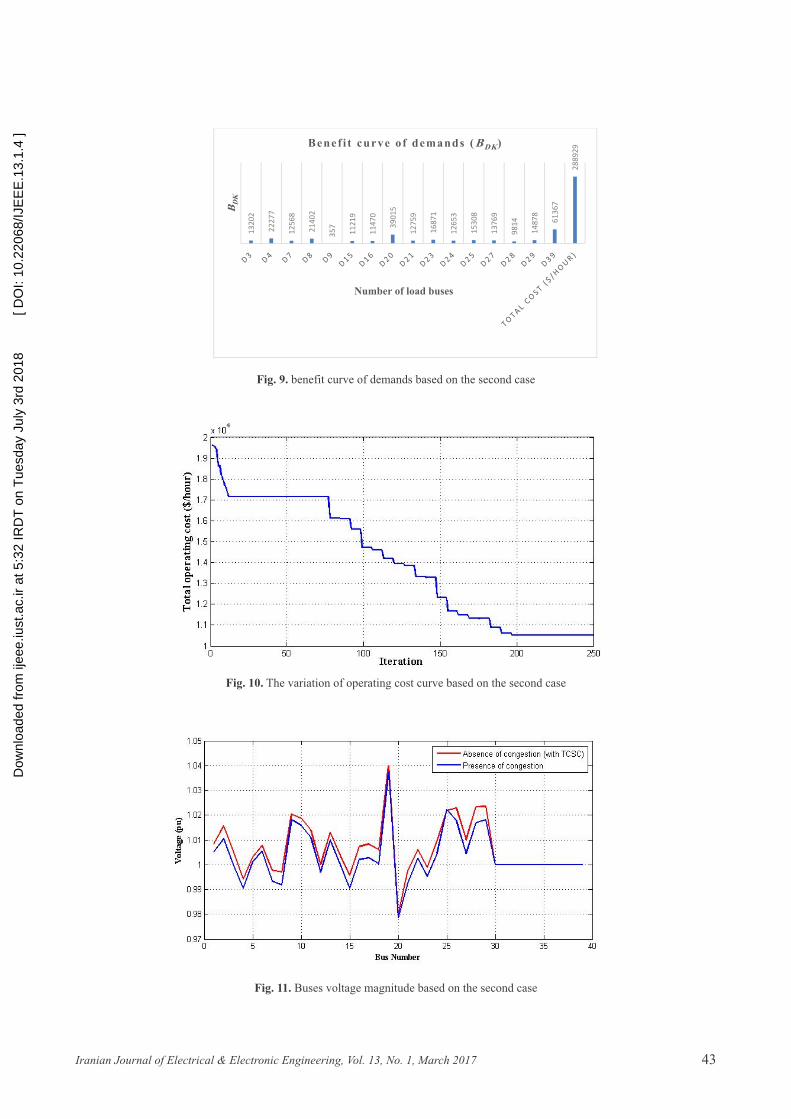
The bid curve of generators and benefit curve of de-mands based on the second case are shown in Fig. 8 and9, respectively. According to Fig. 8 and 9, the total oper-ating cost (according to Eq. (7)) based on the second caseis about US$/hour 10526.
Variation of operating cost curve based on the secondcase using proposed algorithm has been shown in Fig. 10.The buses voltage magnitude based on the second casehas been shown in Fig. 11.
According to Fig. 11, the buses voltage magnitude isincreased compared to presence of congestion (withoutTCSC). The Pareto-approximation fronts (PAFs) achievedfrom the second case using GWO algorithm is shown inFig. 12. To solve the problem of sizing TCSC by proposedalgorithm, GWO algorithm has been run 50 times for thiscase, and controlling parameter of GWO algorithm is asfollow:
Number of grey wolves= 30The CPU time is needed for sizing TCSC is less than
20 second at each iteration.
Fig. 12(a)-(c) shows the Pareto-approximation frontsfor multi-objective congestion management. Fig. 12(a)shows a relation between the VSM and total operatingcost. Increasing the total operating cost, the VSM indexis not changed considerably. It is noted that VSM is func-tion of (PDk, QDk). In voltage stability studies, PDk andQDk are usually elevated with a constant power factor byCPF. Therefore, we can say that variables of P_Dk andQDk are dependent and thus VSM can be assumed as a
VSM (%) CTEM (per unit)
Cost ($/hour) TCSC (%) TCSC branch (Candidate location)
40 43.66 10526.37 70 Line 12: 6-7 proposed methodology
44.18 33.18 14675.93 70 Line 12: 6-7 Modified augmented -constraint method [30]
Table 5. Optimal solutions based on the second case
2550
2
0.00
0128
8
2420
2
2625
1
3084
0
2632
7
3620
4
4198
7
1730
0 7084
2
2994
55
CG
K
Number of Generators
B id curve of genera tors (C GK)
Fig. 8. bid curve of generators based on the second case
Dow
nloa
ded
from
ijee
e.iu
st.a
c.ir
at 5
:32
IRD
T o
n T
uesd
ay J
uly
3rd
2018
[
DO
I: 10
.220
68/IJ
EE
E.1
3.1.
4 ]
Iranian Journal of Electrical & Electronic Engineering, Vol. 13, No. 1, March 2017 43
1320
2
2227
7
1256
8
2140
2
357
1121
9
1147
0
3901
5
1275
9
1687
1
1265
3
1530
8
1376
9
9814
1487
8
6136
7
2889
29
B DK
Number of load buses
Benef i t curve of demands (B DK)
Fig. 9. benefit curve of demands based on the second case
Fig. 10. The variation of operating cost curve based on the second case
Fig. 11. Buses voltage magnitude based on the second case
Dow
nloa
ded
from
ijee
e.iu
st.a
c.ir
at 5
:32
IRD
T o
n T
uesd
ay J
uly
3rd
2018
[
DO
I: 10
.220
68/IJ
EE
E.1
3.1.
4 ]

Iranian Journal of Electrical & Electronic Engineering, Vol. 13, No. 1, March 201744
function of only QDk, so, by changing the unit’s genera-tion and cost, it will not be changes considerably. Fig.12(b) shows a relation between the CTEM and total op-erating cost. Increasing the CTEM index increases thetotal operating cost considerably. When cost is consideredas a target, the unit’s generation is changed to achieve theminimum cost. On the other hand, when CTEM is con-sidered as a target, due to dependence of CTEM to unit’s
generation and difference between unit’s generation andoptimal value, the cost will be increased. Also, CTEM isfunction of (PGk), so, by changing unit’s generation andcost, it can be increased. Fig. 12(c) shows a relation be-tween the VSM and CTEM. Increasing the CTEM, theVSM index is not changed considerably.
)a(
)b(
)b(
)c(
Fig. 12. The PAFs for multi-objective congestion management and trade-offs between (a) VSM and total operating cost. (b) CTEMand total operating cost. (c) VSM and CTEM.
Dow
nloa
ded
from
ijee
e.iu
st.a
c.ir
at 5
:32
IRD
T o
n T
uesd
ay J
uly
3rd
2018
[
DO
I: 10
.220
68/IJ
EE
E.1
3.1.
4 ]
Iranian Journal of Electrical & Electronic Engineering, Vol. 13, No. 1, March 2017 45
6. Conclusion
This paper focuses on describing a multi-objective con-gestion management structure to determine the optimallocating of TCSC. Candidate transmission lines for instal-lation of TCSC are selected by using components of nodalprices. For introducing group of non-dominated solutions,MOGWO algorithm based on OPF is applied. Then fuzzydecision making approach is used to lead to the best re-sponse. The results of simulation are compared with otherpublished research papers. The results show that by com-bining components of nodal prices and grey wolf opti-mizer, the optimal locating and sizing of the series FACTSdevices for multi-objective congestion management canbe achieved in restructured power systems by higher con-vergence speed and more flexibility.
References
[1]. A. Kumar, S. C. Srivastava and S. N. Singh, “Con-gestion management in competitive Power SystemsResearch power market: a bibliographical survey”,Electric, Vol. 76, pp. 153-164, 2005.
[2]. K. Vijayakumar, “Multiobjective OptimizationMethods for Congestion Management in Deregu-lated Power Systems”, Journal of Electrical andComputer Engineering, Vol. 2012, pp. 1-8, 2012.
[3]. S. Verma and V. Mukherjee, “Optimal real powerrescheduling of generators for congestion manage-ment using a novel ant lion optimiser”, IET Gener-ation, Transmission & Distribution, Vol. 10, No. 10,pp. 2548-2561, 2016.
[4]. M. Heydaripour and A. Akbari Foroud, “A NewFramework for congestion management with ExactModeling of Impacting Factors”, Iranian Journal ofElectrical & Electronic Engineering, Vol. 8, No. 4,pp. 329-340, 2012.
[5]. B. KumarPanigrahi, “Locational Marginal Pricing(LMP) in Deregulated Electricity Market”, Inter-national Journal of Electronics Signals and Sys-tems, Vol. 1, No. 2, pp. 101-105, 2012.
[6]. N. Acharya and N. Mithulananthan, “Locating se-ries FACTS devices for congestion management inderegulated electricity markets”, Electric PowerSystems Research, Vol. 77, pp. 352-360, 2007.
[7]. T. Bhattacharjee and A. Kumar Chakraborty, “Con-gestion management in a deregulated power systemby rescheduling of sensitive generators and loadcurtailment using PSO”, International Journal ofEmerging Technology and Advanced Engineering,Vol. 2, No. 3, pp. 284-289, 2012.
[8]. N. S. Modi and B. R. Parekh, “Transmission Net-work Congestion in Deregulated Wholesale Elec-tricity Market”, Proceedings of the InternationalMulti Conference of Engineers and Computer Sci-entists, Hong Kong, Vol. 2, pp. 1-5, 2009.
[9]. E. Eugene Litvinov, T. Zheng, G. Rosenwald and
P. Shamsollahi, “Marginal Loss Modeling in LMPCalculation”, IEEE Transactions on power systems,Vol. 19, No. 2, pp. 880-888, 2004.
[10]. F. Yong and L. Zuyi, “Different Models and Proper-ties on LMP Calculations”, IEEE Power EngineeringSociety general meeting, Montreal, Que, 2006.
[11]. S. Balaraman and N. Kamaraj, “Real Time Conges-tion Management in Deregulated Electricity MarketUsing Artificial Neural Network”, Iranian Journalof Electrical and Computer Engineering, Vol. 10,No. 1, pp. 34-40, 2011.
[12]. K. Singh, N. P. Padhy and J. Sharma, “Congestionmanagement considering hydro-thermal combinedoperation in a pool based electricity market”, Elec-trical Power and Energy Systems, Vol. 33, pp.1513-1519, 2011.
[13]. S. A. Hosseini, N. Amjady and M. Shafie-khah, “Anew multi-objective solution approach to solvetransmission congestion management problem ofenergy markets”, Applied Energy, Vol. 165, pp.462-471, 2016.
[14]. H. Patel and R. Paliwal, “Congestion managementin deregulated power system using facts devices”,International Journal of Advances in Engineering& Technology, Vol. 8, No. 2, pp. 175-184, 2015.
[15]. M. Gitizadeh and M. Kalantar, “FACTS devices al-location to congestion alleviation incorporatingvoltage dependence of loads”, Iranian Journal ofElectrical & Electronic Engineering, Vol. 4, No. 4,pp. 176-190, 2008.
[16]. N. R. Kumari and K. C. Sekhar, “Optimal Place-ment of TCSC Based on Sensitivity Analysis forCongestion Management”, International Journal ofElectrical and Computer Engineering (IJECE), Vol.6, No. 5, pp. 2041-2047, 2016.
[17]. K. Arun Kumar Reddy and P. S. Shiv, “Congestionmitigation using UPFC”, IET Generation, Trans-mission & Distribution, Vol. 10, No. 10, pp. 2433-2442, 2016.
[18]. A. Mishra and V. N. Kumar Gundavarapu, “Lineutilisation factor-based optimal allocation of IPFCand sizing using fire fly algorithm for congestionmanagement”, IET Generation, Transmission &Distribution, Vol. 10, No. 1, pp. 115-122, 2016.
[19]. R. Jahani, H. ChahkandiNejad, A. ShafighiMalek-shah and H. A. Shayanfar, “A New AdvancedHeuristic Method for Optimal Placement of Uni-fied Power Flow Controllers in Electrical PowerSystems”, Int. Rev. Electr. Eng. (IREE), Vol. 5, No.6, pp. 2786-2794, 2001.
[20]. A. Kumar and C. Sekhar, “Comparison of SenTransformer and UPFC for congestion manage-ment in hybrid electricity markets”, InternationalJournal of Electrical Power & Energy Systems, Vol.47, pp. 295-304, 2013.
Dow
nloa
ded
from
ijee
e.iu
st.a
c.ir
at 5
:32
IRD
T o
n T
uesd
ay J
uly
3rd
2018
[
DO
I: 10
.220
68/IJ
EE
E.1
3.1.
4 ]
Iranian Journal of Electrical & Electronic Engineering, Vol. 13, No. 1, March 201746
[21]. A. LashkarAra, J. Aghaei and M. Shabani, “Introduc-ing a Fuzzy Interactive Multi-objective Approach toOptimal Location of UPFC”, Int. Rev. Electr. Eng.(IREE), Vol. 5, No. 6, pp. 2896-2906, 2010.
[22]. B. Bhattacharyya and V. K. Gupta, “Fuzzy GeneticAlgorithm Approach for the Optimal Placement ofFlexible AC Transmission Systems Devices in aPower System”, Electric Power Components andSystems, Vol. 42, No. 8, pp. 779-787, 2014.
[23]. A. Y. Abdelaziz, M. A. El-Sharkawy and M. A. Attia,“Optimal location of thyristor-controlled series com-pensators in power systems for increasing loadabilityby genetic algorithm”, Electric Power Componentsand Systems, Vol. 39, pp. 1373-1387, 2011.
[24]. R. A. Hooshmand, M. J. Morshed and M. Paraste-gari, “Congestion management by determining op-timal location of series FACTS devices usinghybrid bacterial foraging and Nelder-Mead algo-rithm”, Applied Soft Computing, Vol. 28, pp. 57-68, 2015.
[25]. A. Zamora-Cárdenas and C. R. Fuerte-Esquivel,“Multi-parameter trajectory sensitivity approach forlocation of series-connected controllers to enhancepower system transient stability”, Electric Power Sys-tems Research, Vol. 80, pp. 1096-1103, 2010.
[26]. S. R. Inkollu and V. R. Kota, “Optimal setting ofFACTS devices for voltage stability improvementusing PSO adaptive GSA hybrid algorithm”, Inter-national Journal Engineering Science and Technol-ogy, Vol. 19, No. 3, pp. 1166-1176, 2016.
[27]. N. Amjady and M. Esmaili, “Improving voltage se-curity assessment and ranking vulnerable buseswith consideration of power system limits”, Inter-national Journal of Electrical Power & Energy Sys-tems, Vol. 25, pp. 705-715, 2003.
[28]. F. Da-Zhong, T. S. Chung, Z. Yao and S. Wennan,“Transient stability limit conditions analysis usinga corrected transient energy function approach”,IEEE Transactions on Power Systems, Vol. 15, pp.804-810, 2000.
[29]. P. Kumar Tiwari and Y. Raj Sood, “An Approachfor Optimal Placement, Rating and Investment CostRecovery of a TCSC in Double Auction PowerMarket”, Proceedings of International Conferenceon Power Systems, Energy, Environment, pp. 91-97, 2014.
[30]. M. Esmaili, H. A. Shayanfar and R. Moslemi, “Lo-cating series FACTS devices for multi-objectivecongestion management improving voltage andtransient stability”, European Journal of Opera-tional Research, Vol. 236, pp. 763-773, 2014.
[31]. L. Chen, H. Suzuki, T. Wachi and Y. Shimura,“Components of Nodal Prices for Electric PowerSystems”, IEEE Trans. Power Apparat. Syst., Vol.17, No. 1, pp. 41-49, 2002.
[32]. S. Mirjalili, S. Saremi., S. M. Mirjalili and L.Coelho, “Multi-objective grey wolf optimizer: Anovel algorithm for multi-criterion optimization”,Expert Systems with Applications, Vol. 47, pp.106-119, 2016.
[33]. P. Maghouli, S. H. Hosseini, M. Buygi and M.Shahidepour, “A multi-objective framework fortransmission expansion planning in deregulated en-vironments”, IEEE Trans. on Power Syst., Vol. 24,No. 2, pp. 1051-1061, 2009.
Alireza Moradi was born inSemnan, Iran, in 1986. He re-ceived the B.Sc. and M.Sc. de-grees in electrical engineeringfrom Semnan and Birjand Uni-versity in 2010 and 2012, respec-tively. He is currently a Ph.D.
student at the Semnan University. His research in-terests include security assessment of power sys-tems, power system planning, power quality,artificial intelligence, and its application to theproblems of the power systems.
Yousef Alinejad-Beromi wasborn in Damghan, Iran. He re-ceived the B.Sc. degree in elec-trical engineering from K.N.T.University, Tehran, Iran, and theM.Sc. and Ph.D. degrees fromUWCC, Cardiff, U.K., in 1989
and 1992, respectively. He is currently an AssociateProfessor with the Faculty of Electrical and Com-puter Engineering, Semnan University, Semnan,Iran.
Kourosh Kiani was born in Sem-nan, Iran. He received the B.Sc.and M.Sc., degrees in electricalengineering from Delft Univer-sity of Technology in Delft, theNetherlands in 1993 and thePh.D. degree in Medical infor-
mation from Erasmus University in Rotterdam, theNetherlands in 1997. He is currently an AssistantProfessor with the Faculty of Electrical and Com-puter Engineering, Semnan University, Semnan,Iran. His research interests include artificial intel-ligence, neural network, and fuzzy logic.
Dow
nloa
ded
from
ijee
e.iu
st.a
c.ir
at 5
:32
IRD
T o
n T
uesd
ay J
uly
3rd
2018
[
DO
I: 10
.220
68/IJ
EE
E.1
3.1.
4 ]