location-efficient affordable housing as a pre-requisite for a safe, healthy, and equitable...
TRANSCRIPT
Affordable Housing as a Prerequisite for a Safe, Healthy, Equitable Transportation System: Evidence from a nationwide evaluation of location efficiency within the Low-Income Housing Tax Credit (LIHTC) program
Arlie Adkins, PhDTREC Transportation SeminarPortland State UniversityOctober 9, 2015

Thank you TREC.
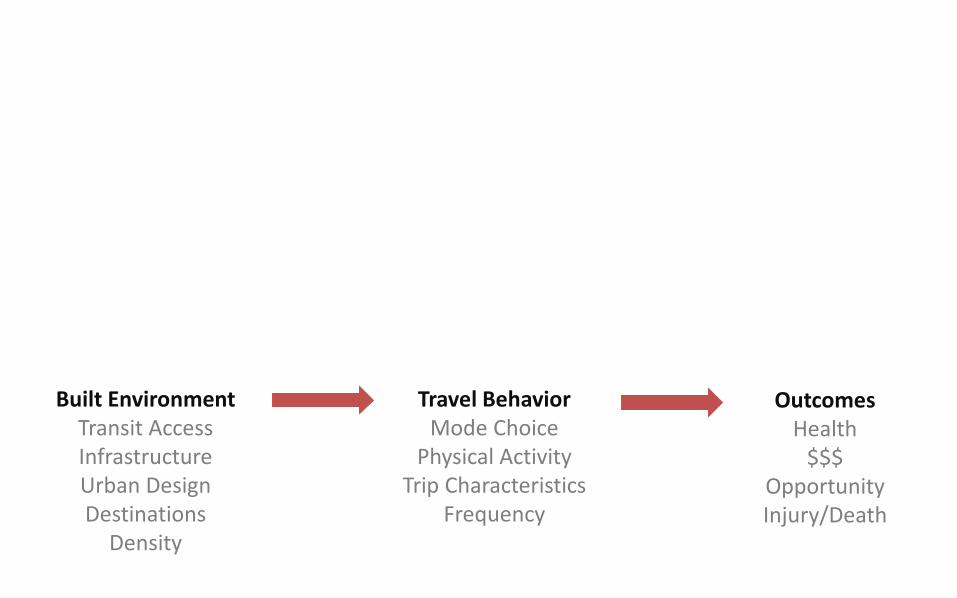
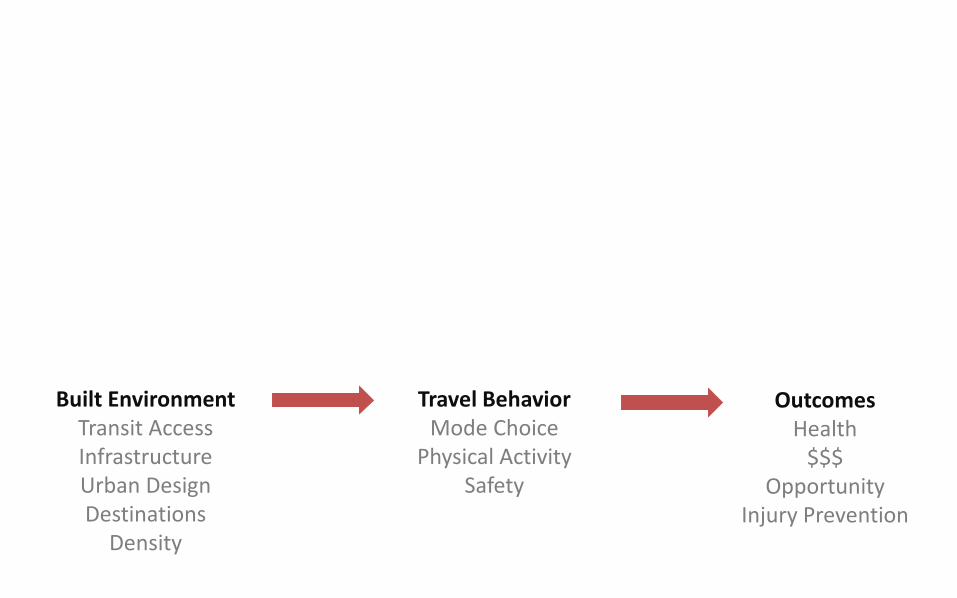
Built EnvironmentTransit AccessInfrastructureUrban DesignDestinations
Density
Travel BehaviorMode Choice
Physical ActivityTrip Characteristics
Frequency
OutcomesHealth
$$$OpportunityInjury/Death
Outcomes: EconomicLow-income households often spend a much higher percentage of income on transportation.
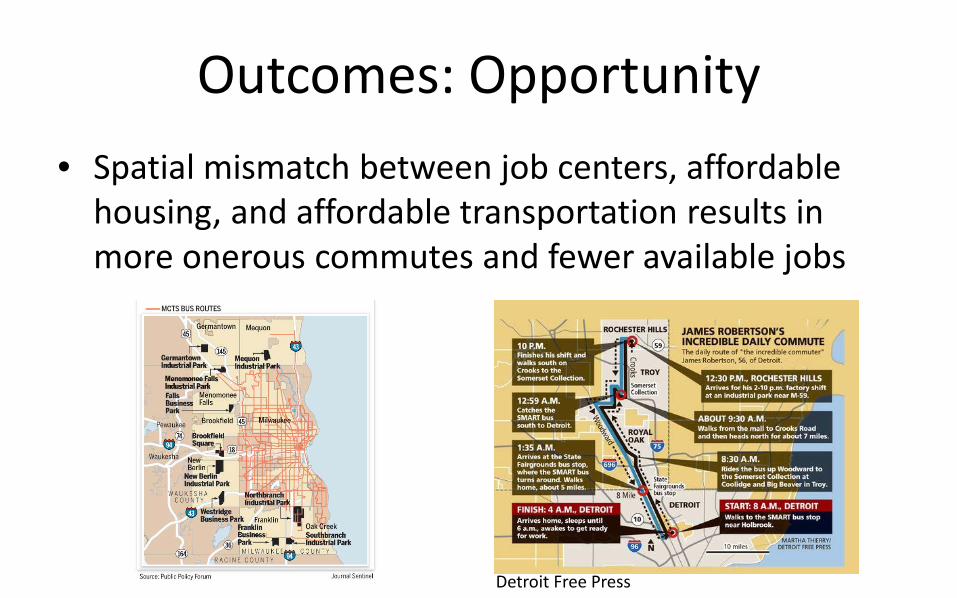
Outcomes: Opportunity• Spatial mismatch between job centers, affordable
housing, and affordable transportation results in more onerous commutes and fewer available jobs
Detroit Free Press
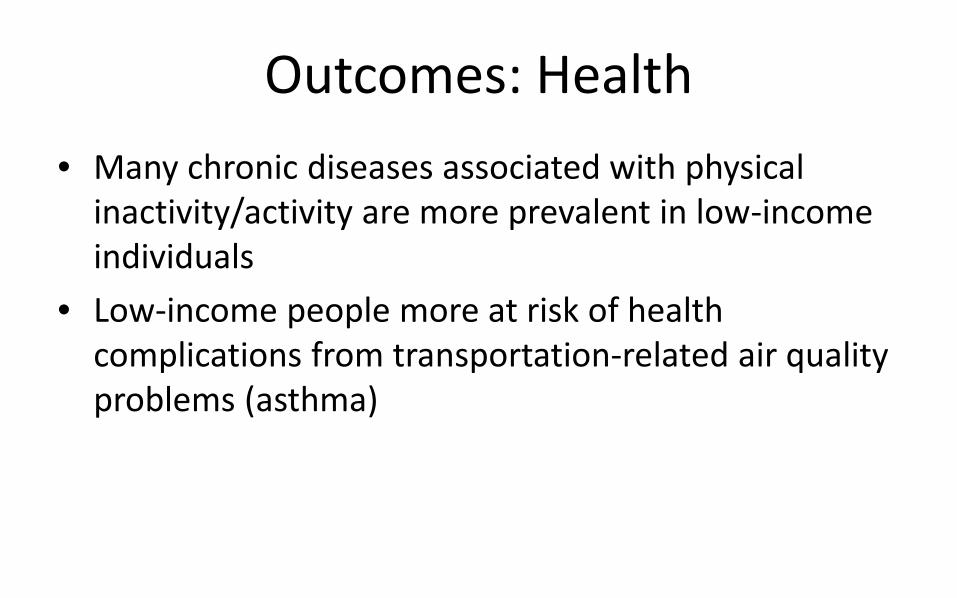
Outcomes: Health• Many chronic diseases associated with physical
inactivity/activity are more prevalent in low-income individuals
• Low-income people more at risk of health complications from transportation-related air quality problems (asthma)
Outcomes: Health
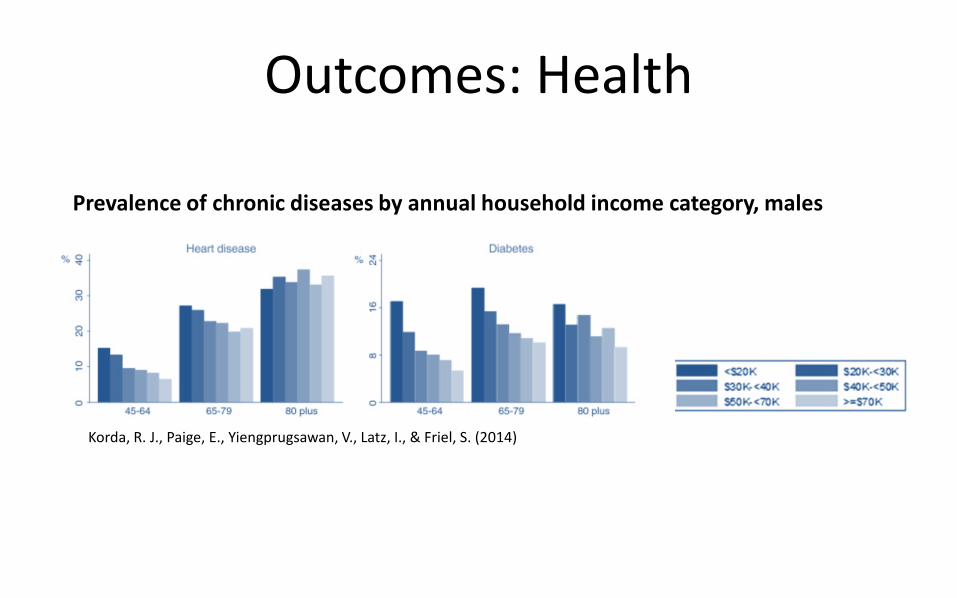
Prevalence of chronic diseases by annual household income category, males
Korda, R. J., Paige, E., Yiengprugsawan, V., Latz, I., & Friel, S. (2014)
Outcomes: Health
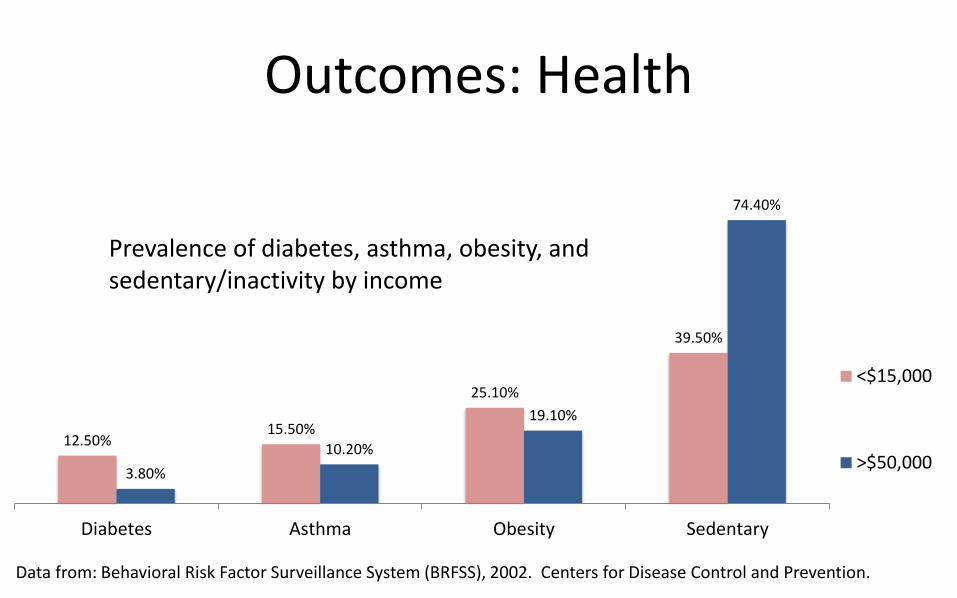
12.50%15.50%
25.10%
39.50%
3.80%10.20%
19.10%
74.40%
Diabetes Asthma Obesity Sedentary
<$15,000
>$50,000
Prevalence of diabetes, asthma, obesity, and sedentary/inactivity by income
Data from: Behavioral Risk Factor Surveillance System (BRFSS), 2002. Centers for Disease Control and Prevention.
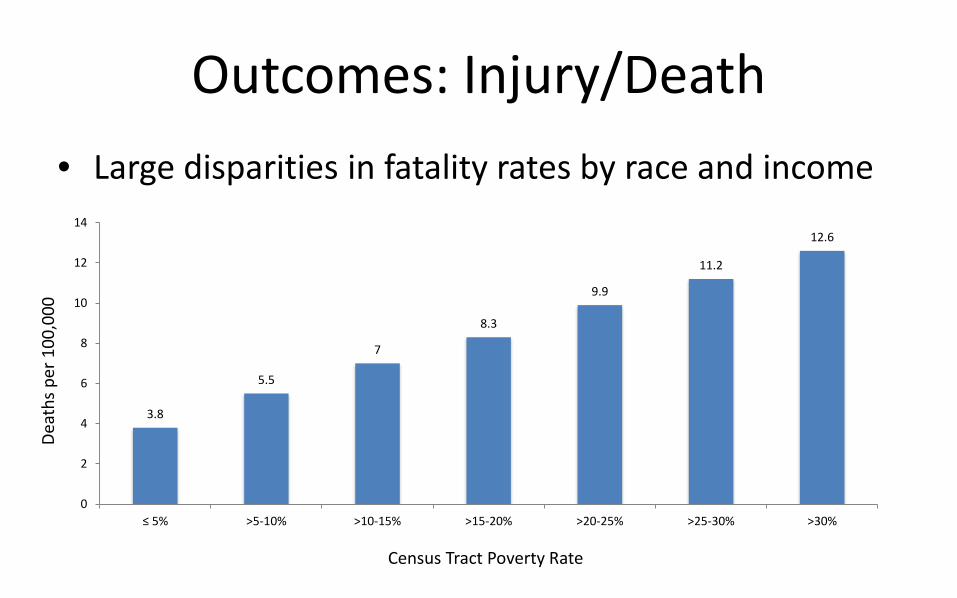
Outcomes: Injury/Death • Large disparities in fatality rates by race and income
3.8
5.5
7
8.3
9.9
11.2
12.6
0
2
4
6
8
10
12
14
≤ 5% >5-10% >10-15% >15-20% >20-25% >25-30% >30%
Deat
hs p
er 1
00,0
00
Census Tract Poverty Rate
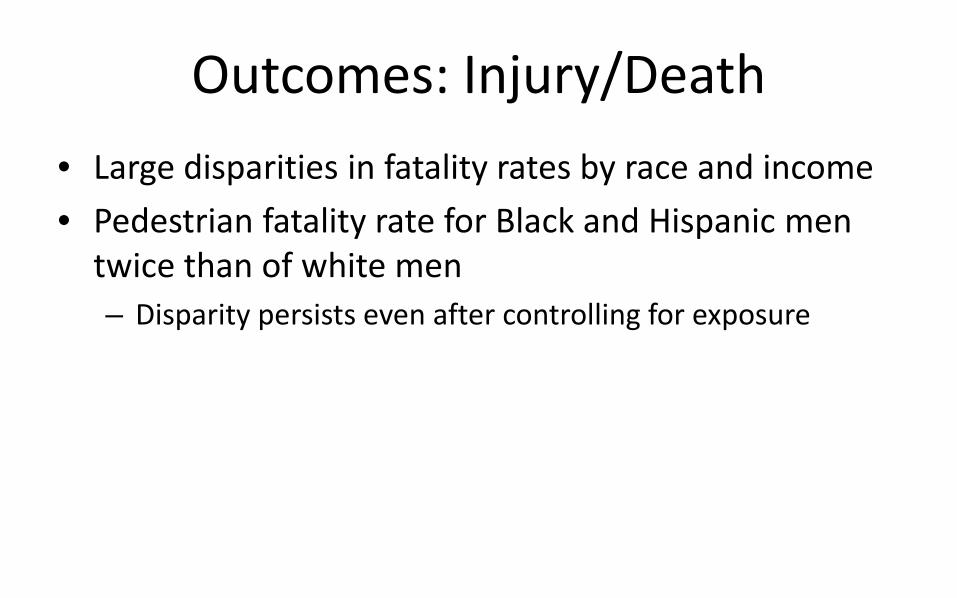
Outcomes: Injury/Death • Large disparities in fatality rates by race and income• Pedestrian fatality rate for Black and Hispanic men
twice than of white men– Disparity persists even after controlling for exposure
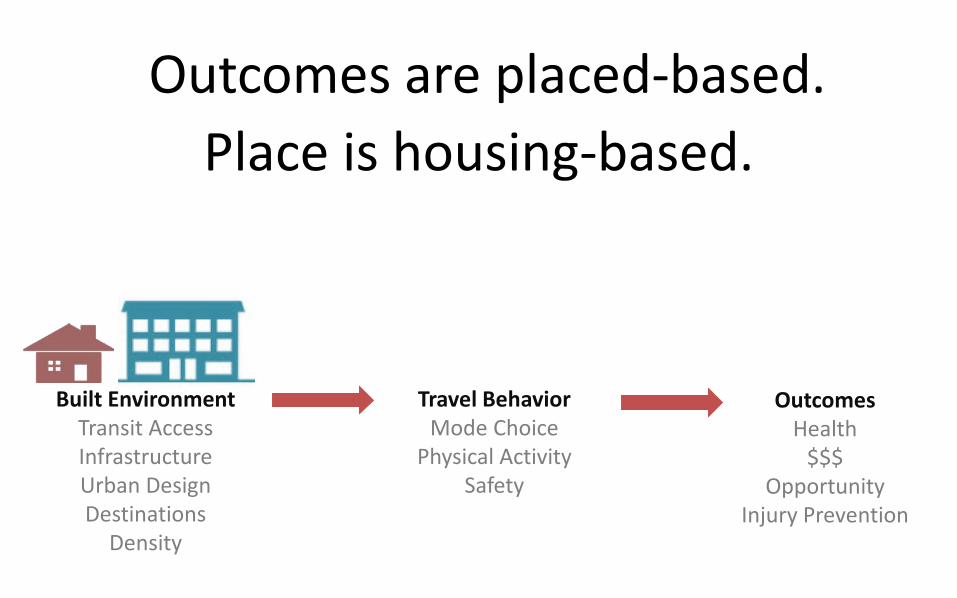
Built EnvironmentTransit AccessInfrastructureUrban DesignDestinations
Density
Travel BehaviorMode Choice
Physical ActivitySafety
OutcomesHealth
$$$Opportunity
Injury Prevention
Place is housing-based.Outcomes are placed-based.
Affordable housing is a requirement for an equitable transportation system

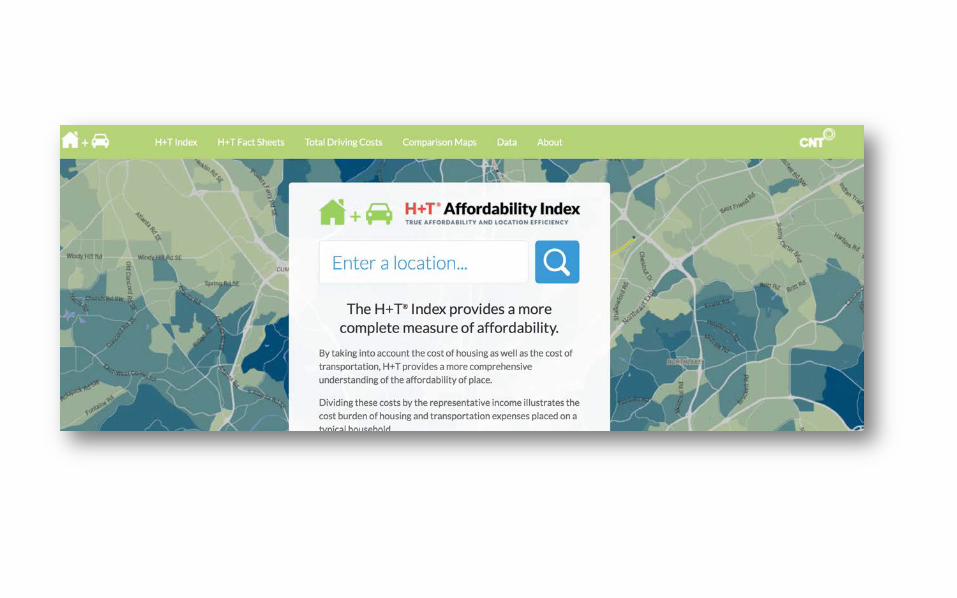
Housing + Transportation• Increasing acknowledgement that transportation
costs need to be considered in calculations of housing costs
• Combined cost of place – “location affordability”• New tools aimed at helping households make
“location affordable” decisions about housing locations

But…
Basic rule of urban economics: transportation improvements increase land values.
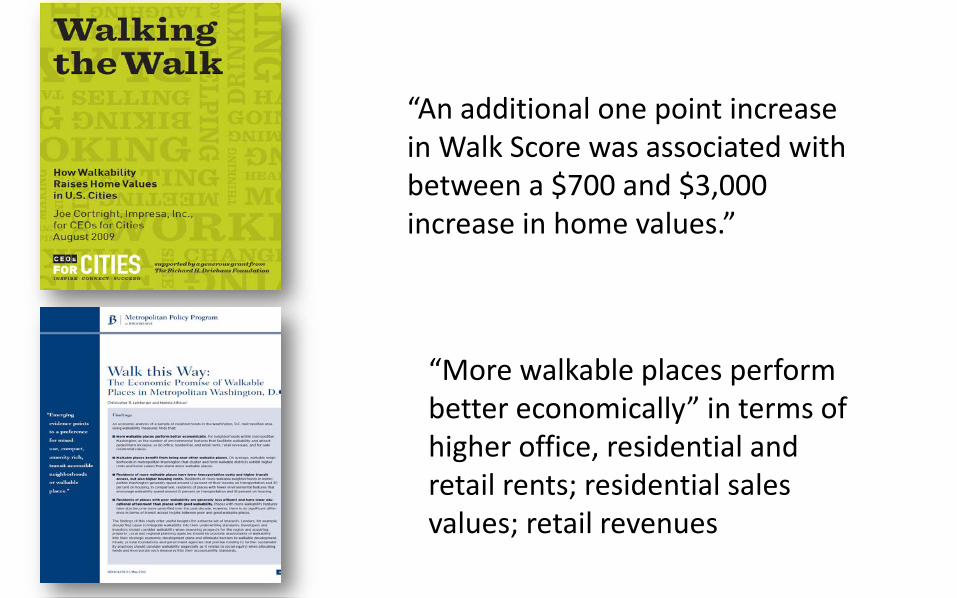
“An additional one point increase in Walk Score was associated with between a $700 and $3,000 increase in home values.”
“More walkable places perform better economically” in terms of higher office, residential and retail rents; residential sales values; retail revenues
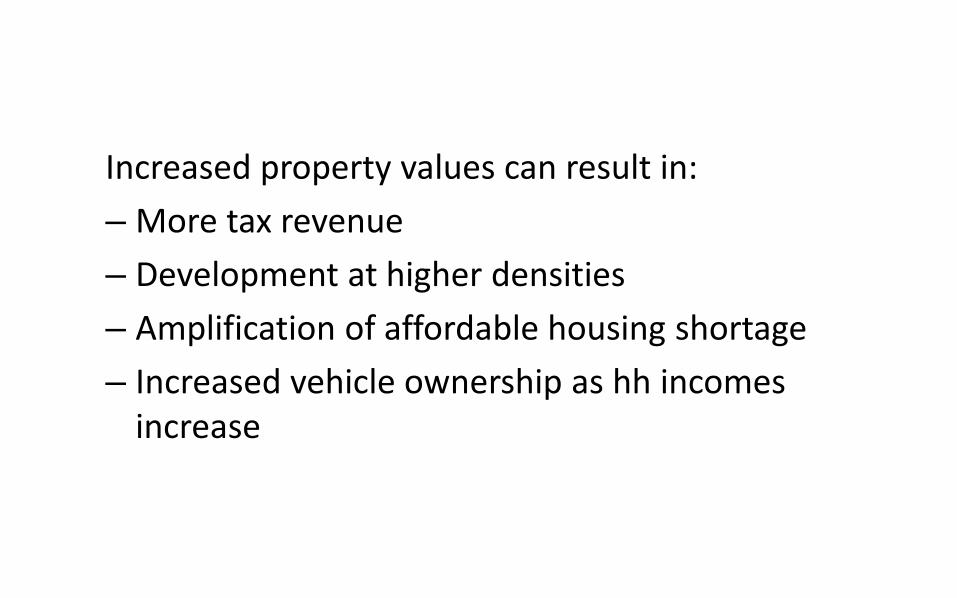
Increased property values can result in: – More tax revenue– Development at higher densities– Amplification of affordable housing shortage– Increased vehicle ownership as hh incomes
increase
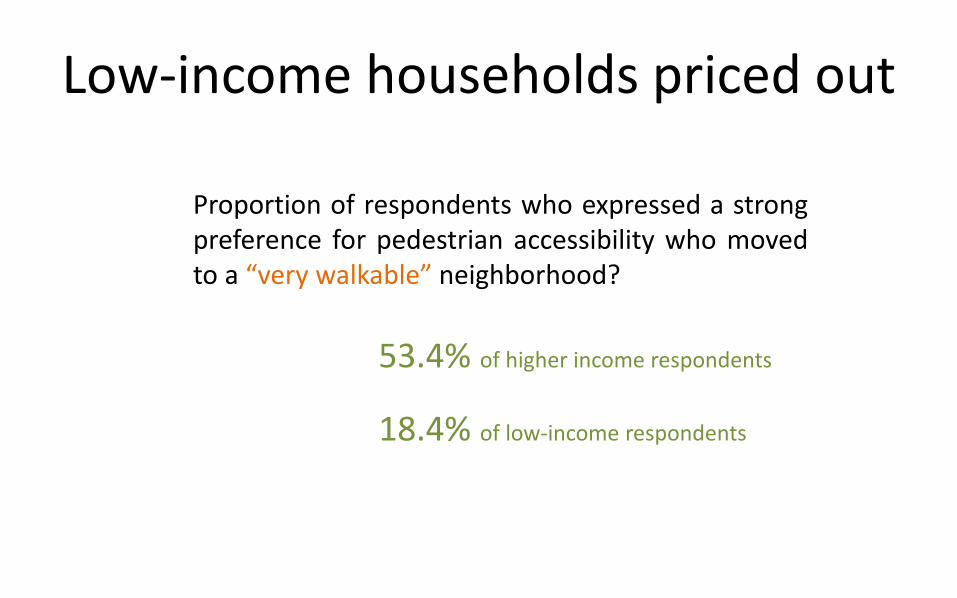
Proportion of respondents who expressed a strongpreference for pedestrian accessibility who movedto a “very walkable” neighborhood?
53.4% of higher income respondents
18.4% of low-income respondents
Low-income households priced out
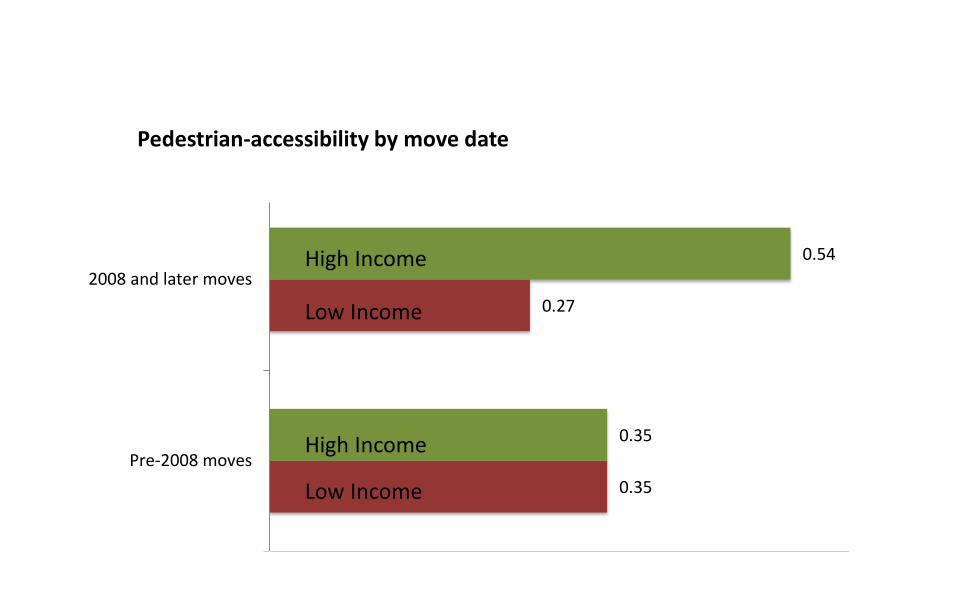
0.35
0.27
0.35
0.54
- 0.10 0.20 0.30 0.40 0.50 0.60
Pre-2008 moves
2008 and later movesHigh Income
Low Income
High Income
Low Income
Pedestrian-accessibility by move date
Decrease Increase
High Income Group
Low Income Group
Poverty Group
Housing Subsidy Group
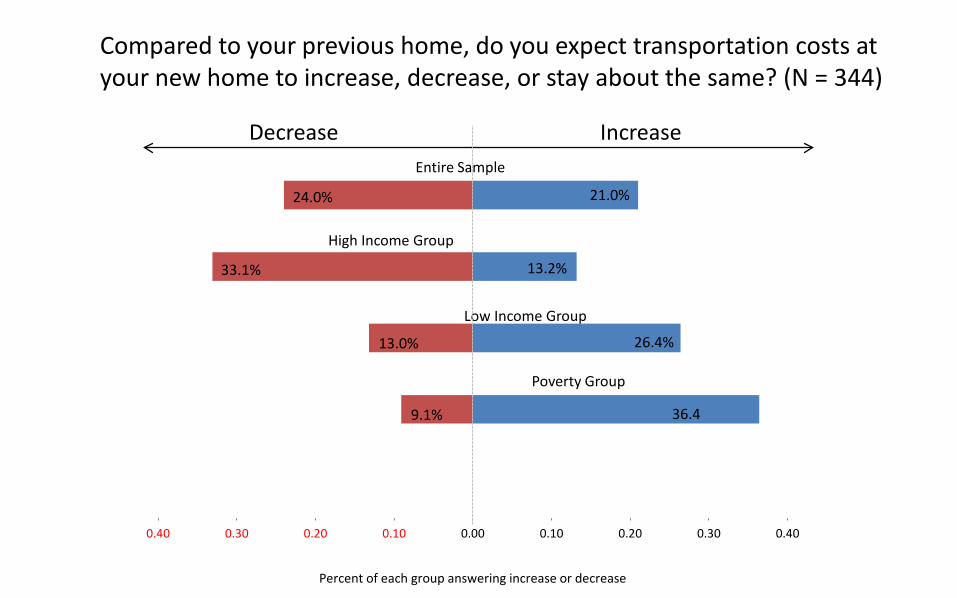
Compared to your previous home, do you expect transportation costs at your new home to increase, decrease, or stay about the same? (N = 344)
Percent of each group answering increase or decrease
0.40 0.30 0.20 0.10 0.00 0.10 0.20 0.30 0.40
13.0%
Entire Sample
High Income Group
Low Income Group
Poverty Group
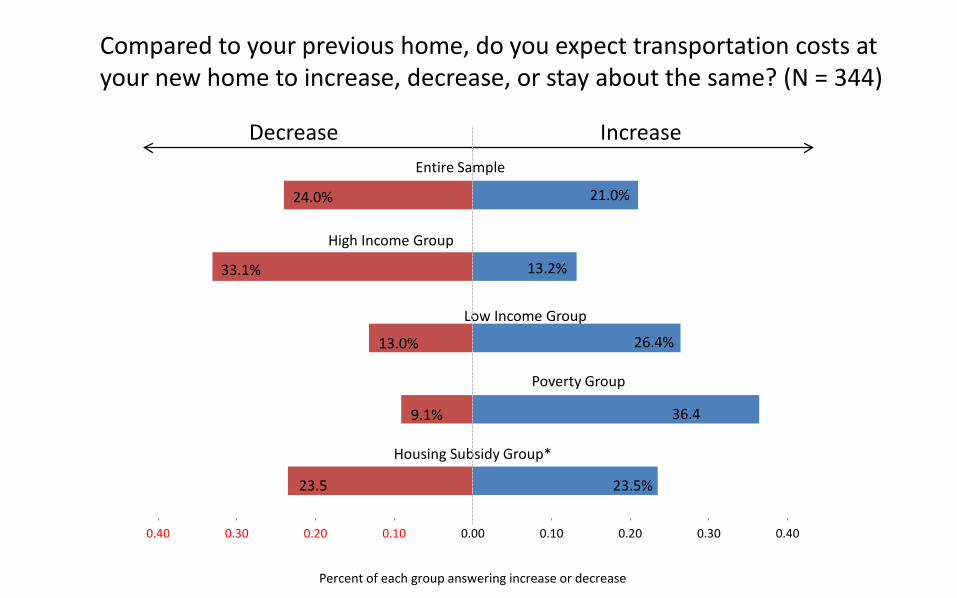
Housing Subsidy Group*
24.0% 21.0%
33.1% 13.2%
26.4%
9.1% 36.4
23.5 23.5%
Decrease Increase
High Income Group
Low Income Group
Poverty Group
Housing Subsidy Group
Compared to your previous home, do you expect transportation costs at your new home to increase, decrease, or stay about the same? (N = 344)
Percent of each group answering increase or decrease
0.40 0.30 0.20 0.10 0.00 0.10 0.20 0.30 0.40
13.0%
Entire Sample
High Income Group
Low Income Group
Poverty Group
Housing Subsidy Group*
24.0% 21.0%
33.1% 13.2%
26.4%
9.1% 36.4
23.5 23.5%
Built EnvironmentTransit AccessInfrastructureUrban DesignDestinations
Density
Travel BehaviorMode Choice
Physical ActivitySafety
OutcomesHealth
$$$Opportunity
Injury Prevention
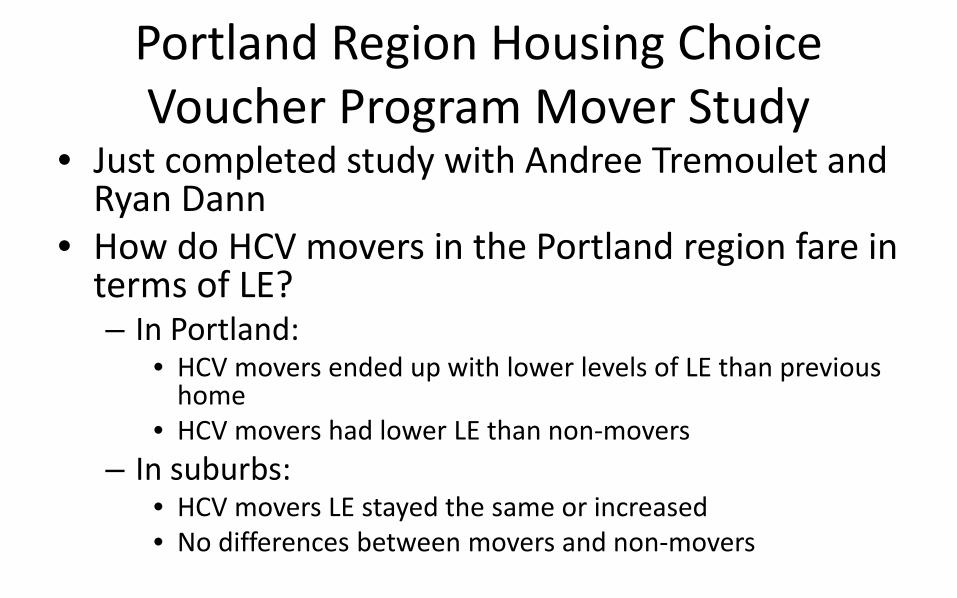
Portland Region Housing Choice Voucher Program Mover Study
• Just completed study with Andree Tremoulet and Ryan Dann
• How do HCV movers in the Portland region fare in terms of LE?– In Portland:
• HCV movers ended up with lower levels of LE than previous home
• HCV movers had lower LE than non-movers– In suburbs:
• HCV movers LE stayed the same or increased• No differences between movers and non-movers
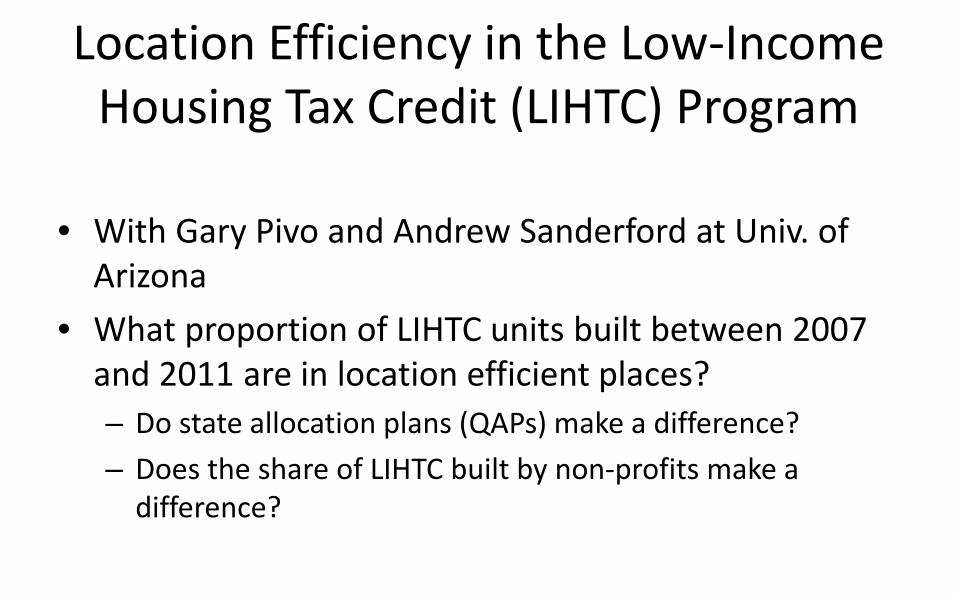
Location Efficiency in the Low-Income Housing Tax Credit (LIHTC) Program
• With Gary Pivo and Andrew Sanderford at Univ. of Arizona
• What proportion of LIHTC units built between 2007 and 2011 are in location efficient places?– Do state allocation plans (QAPs) make a difference?– Does the share of LIHTC built by non-profits make a
difference?

Location Efficiency in the Low-Income Housing Tax Credit (LIHTC) Program
Source: Citylab.com
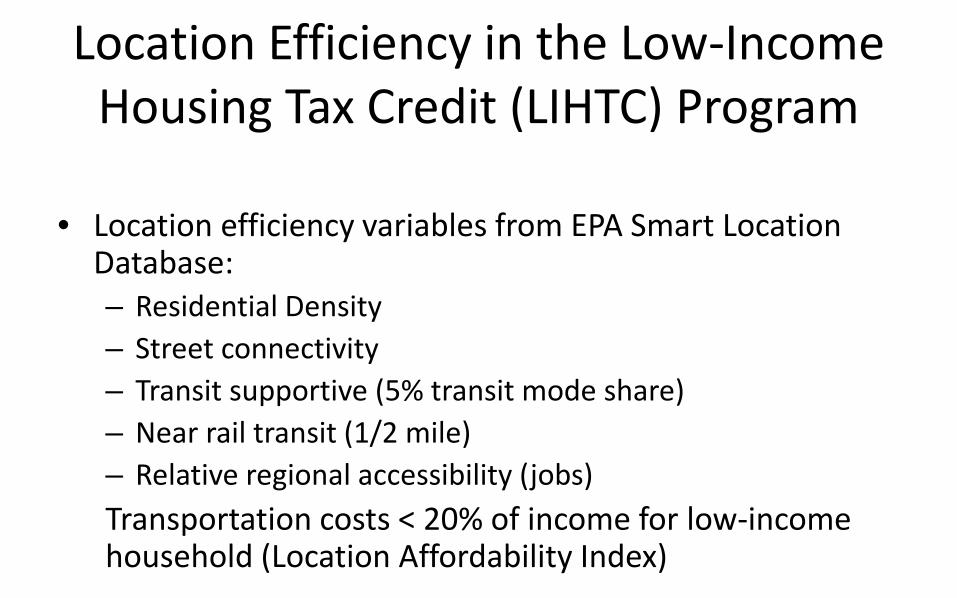
Location Efficiency in the Low-Income Housing Tax Credit (LIHTC) Program
• Location efficiency variables from EPA Smart Location Database:– Residential Density– Street connectivity– Transit supportive (5% transit mode share)– Near rail transit (1/2 mile)– Relative regional accessibility (jobs)Transportation costs < 20% of income for low-income household (Location Affordability Index)
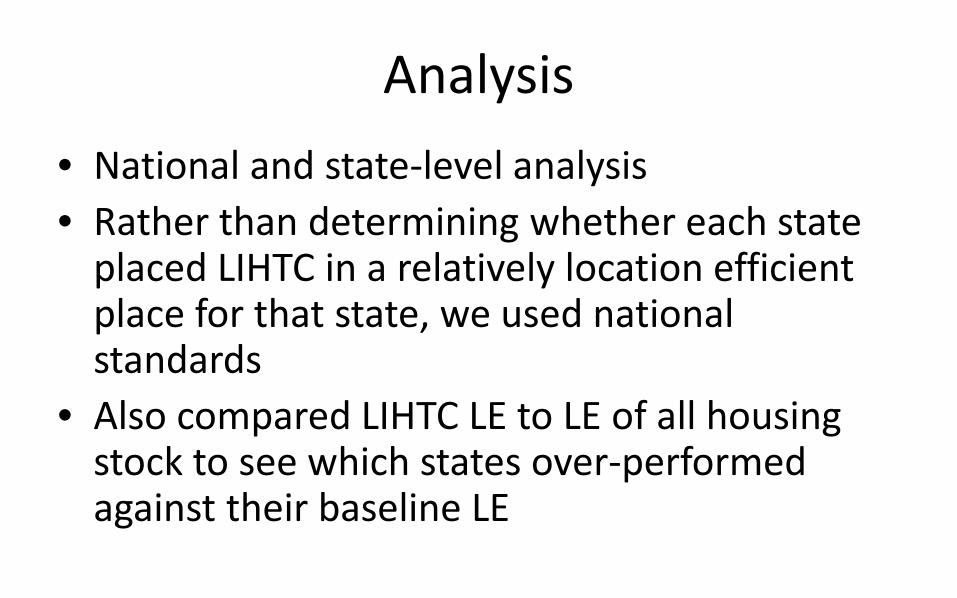
Analysis• National and state-level analysis• Rather than determining whether each state
placed LIHTC in a relatively location efficient place for that state, we used national standards
• Also compared LIHTC LE to LE of all housing stock to see which states over-performed against their baseline LE
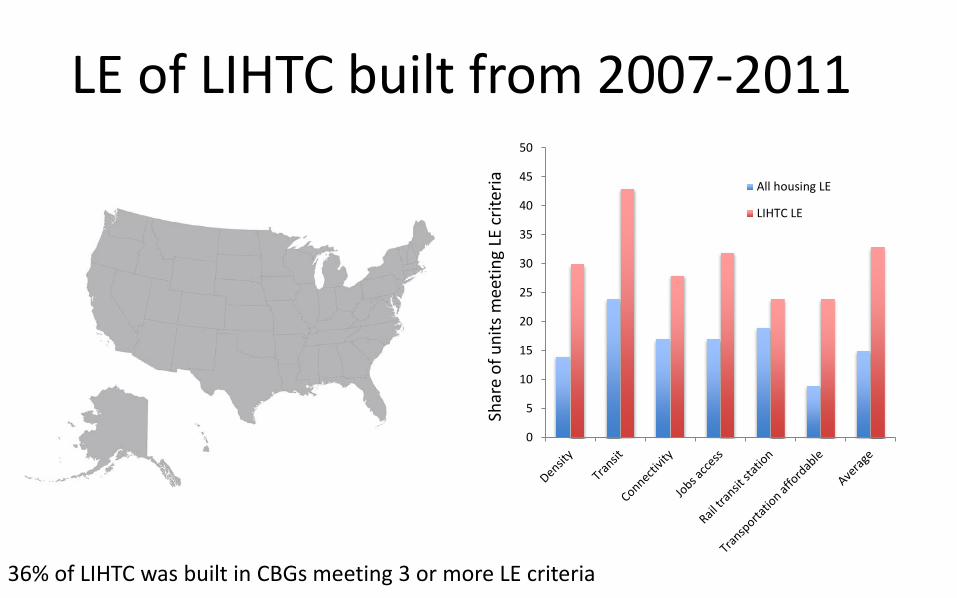
LE of LIHTC built from 2007-2011
0
5
10
15
20
25
30
35
40
45
50
All housing LE
LIHTC LE
36% of LIHTC was built in CBGs meeting 3 or more LE criteria
Shar
e of
uni
ts m
eetin
g LE
crit
eria
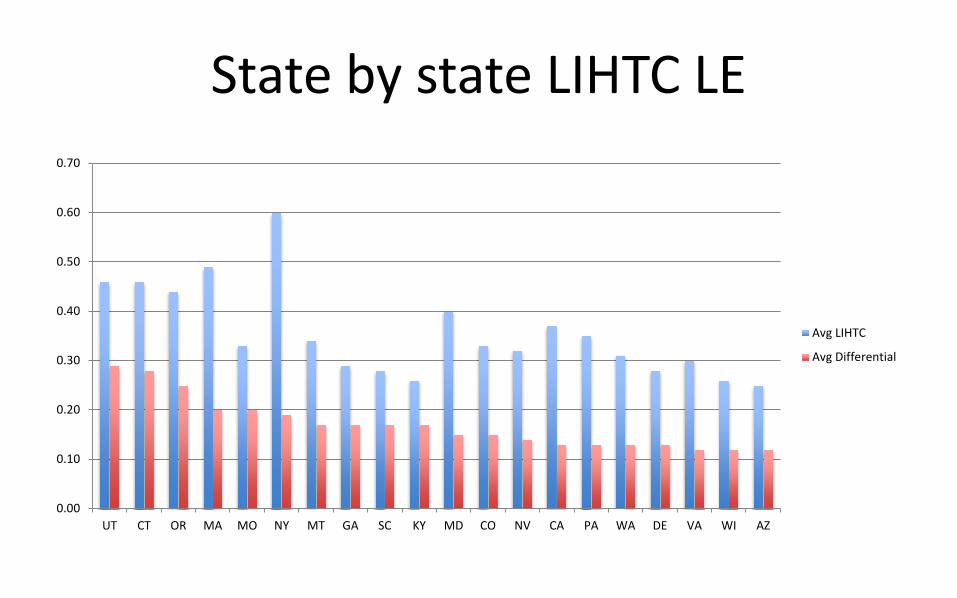
State by state LIHTC LE
0.00
0.10
0.20
0.30
0.40
0.50
0.60
0.70
UT CT OR MA MO NY MT GA SC KY MD CO NV CA PA WA DE VA WI AZ
Avg LIHTC
Avg Differential

Differential: Residential Density
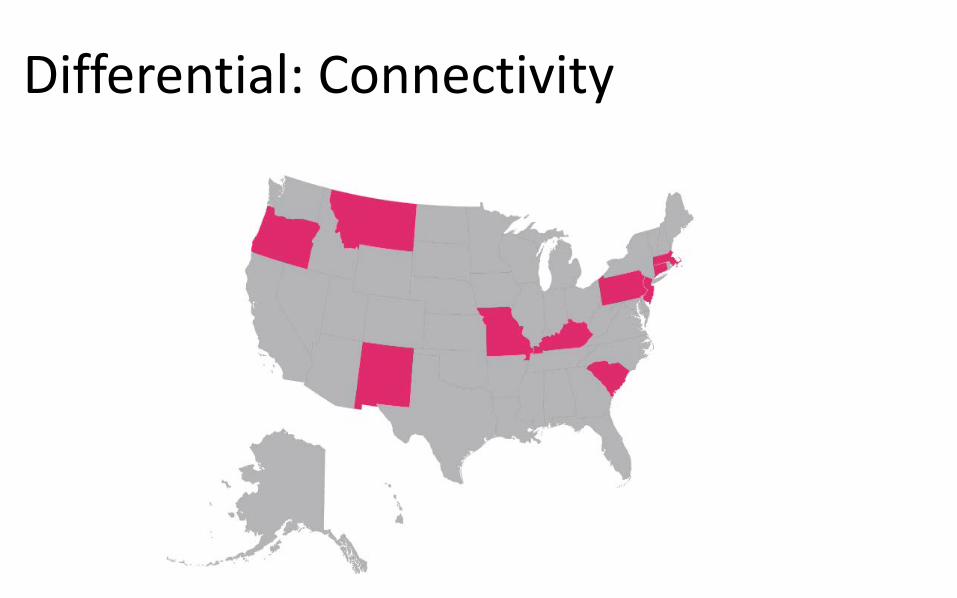
Differential: Connectivity
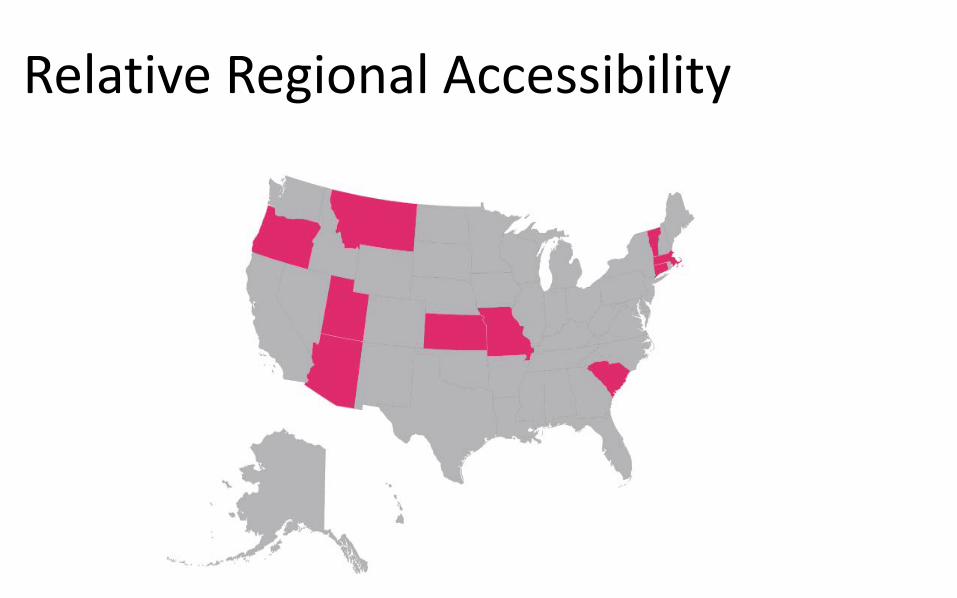
Relative Regional Accessibility
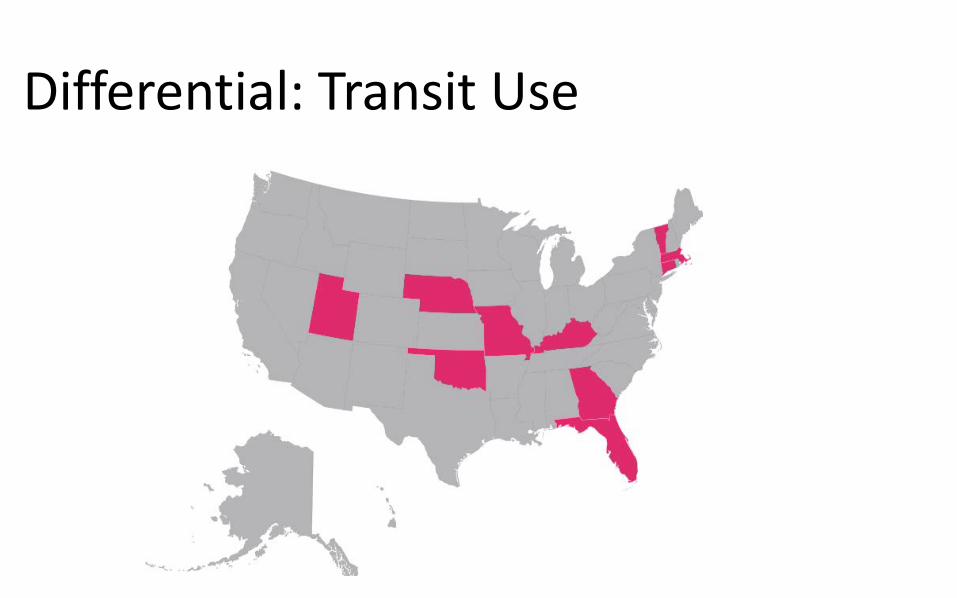
Differential: Transit Use
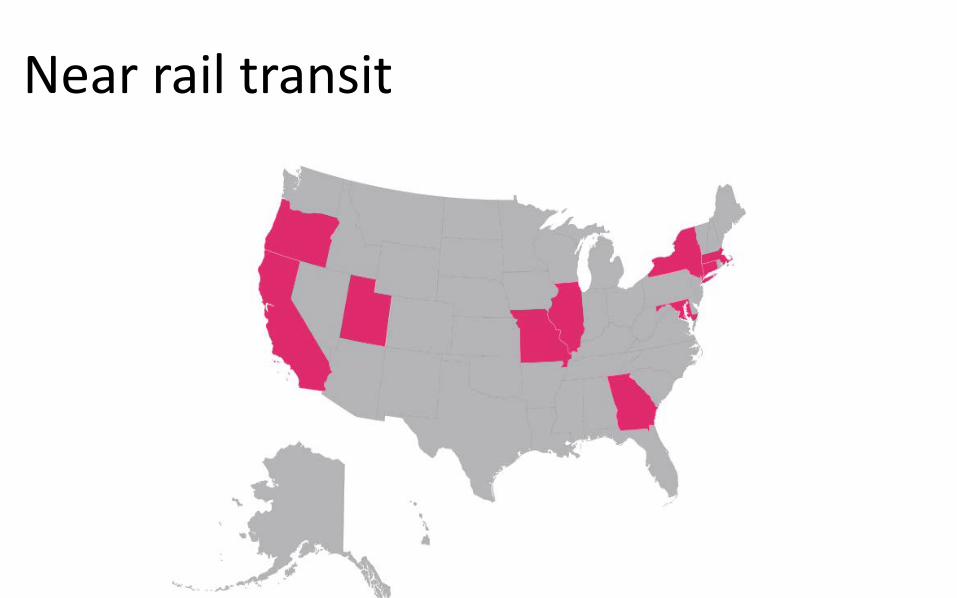
Near rail transit
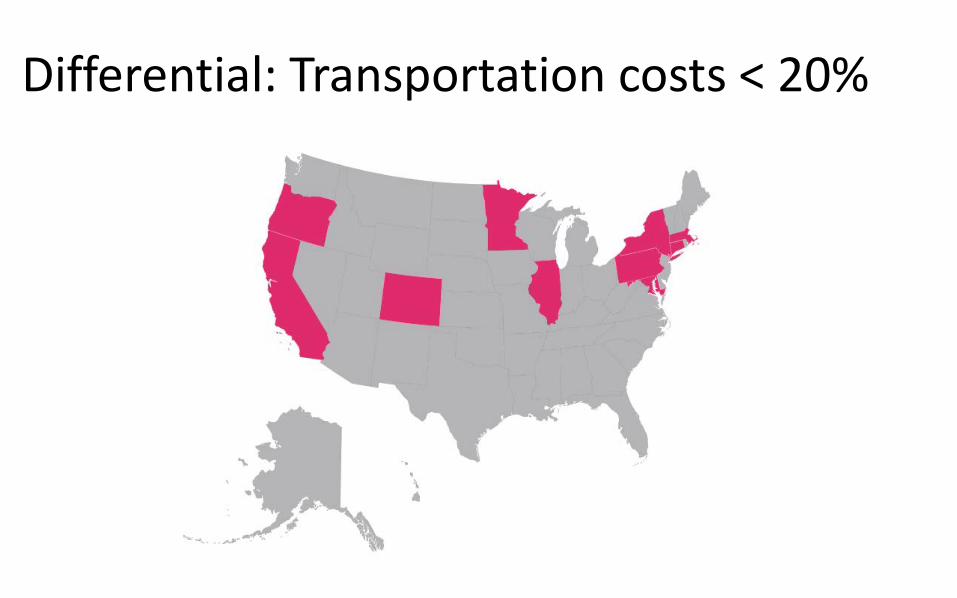
Differential: Transportation costs < 20%

Differential: LIHTC LE (averaged)
Regression Analysis • Model predicting state LIHTC LE:
– After controlling for other market characteristics• State qualified allocation plans’ LE criteria and share
of LIHTC developed by non-profit sector are predictors of LIHTC LE differential

In conclusion• LIHTC more location efficient than other housing• Potential to be more LE, especially in some states• Policy support and non-profit involvement help• Limited scope of HCV and LIHTC; more needs to be
done• Big limitation: we do not directly address risk of further
concentration of poverty; we don’t know what the right % of LE LIHTC is
• Next steps: metro area comparisons, effect of QAP changes
Lessons for transportation planners
Do not:1) Stop making transportation improvements
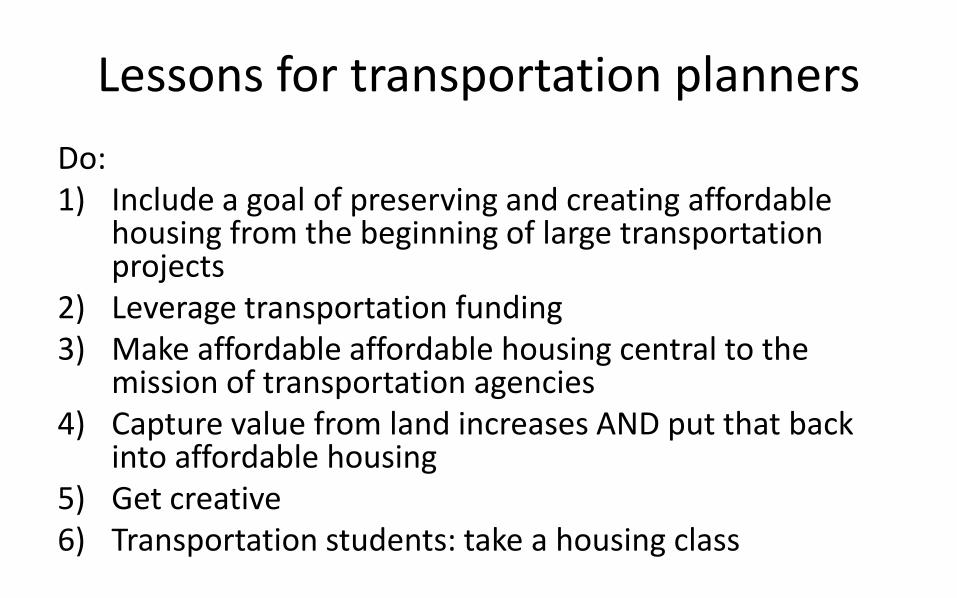
Lessons for transportation plannersDo:1) Include a goal of preserving and creating affordable
housing from the beginning of large transportation projects
2) Leverage transportation funding 3) Make affordable affordable housing central to the
mission of transportation agencies4) Capture value from land increases AND put that back
into affordable housing5) Get creative6) Transportation students: take a housing class
American Institute of Certified Planners Code of EthicsSelected “Principles to Which We Aspire”
We shall have special concern for the long-range consequences of present actions.
American Institute of Certified Planners Code of EthicsSelected “Principles to Which We Aspire”
We shall pay special attention to the interrelatedness of decisions.

American Institute of Certified Planners Code of EthicsSelected “Principles to Which We Aspire”
We shall seek social justice by working to expand choice and opportunity for all persons, recognizing a special responsibility to plan for the needs of the disadvantaged and to promote racial and economic integration. We shall urge the alteration of policies, institutions, and decisions that oppose such needs.