lockdownthe lockdown lockdown week
TRANSCRIPT

Aishwarya Sonker
[email protected] | Tel: 9122 66303351
Harshita Kain
[email protected] | Tel: 9122 66301851
Suhas Harinarayanan
[email protected] | Tel: 9122 66303037
Arshad Perwez
[email protected] | Tel: 9122 66303080
Daily case growth inches up in India
28 Jun 2020
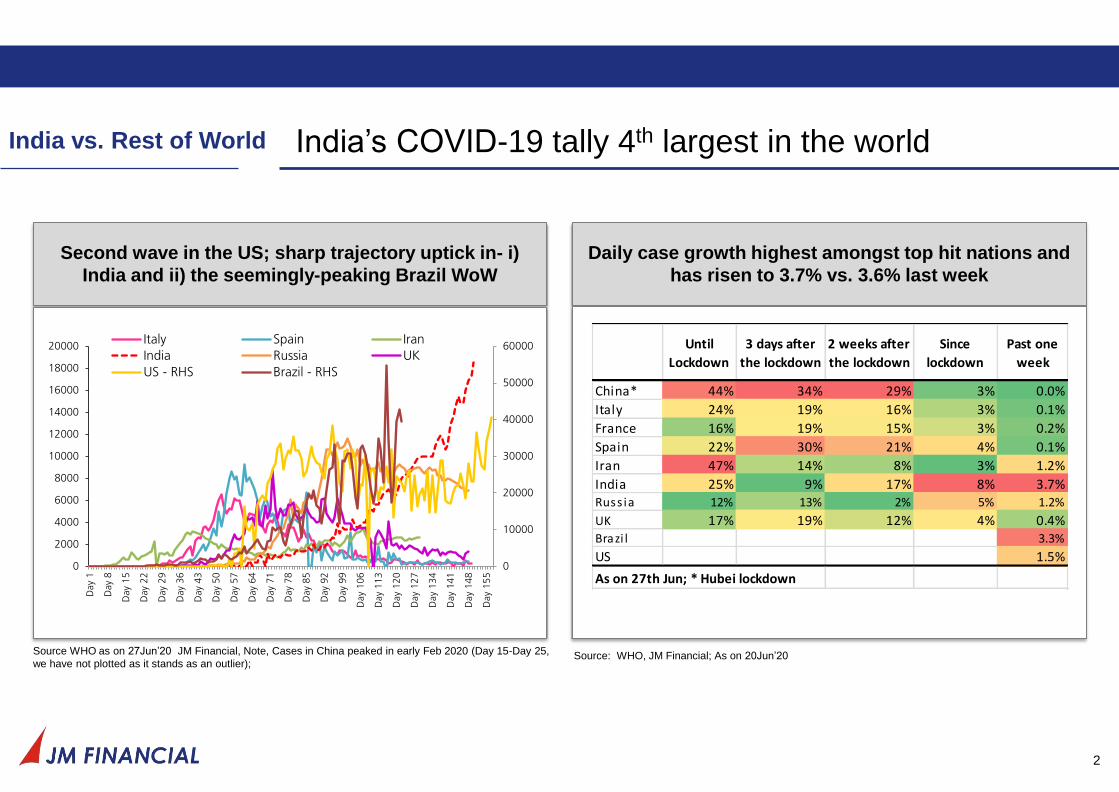
Second wave in the US; sharp trajectory uptick in- i)
India and ii) the seemingly-peaking Brazil WoW
India’s COVID-19 tally 4th largest in the world
Source WHO as on 27Jun’20 JM Financial, Note, Cases in China peaked in early Feb 2020 (Day 15-Day 25,
we have not plotted as it stands as an outlier);
Daily case growth highest amongst top hit nations and
has risen to 3.7% vs. 3.6% last week
Source: WHO, JM Financial; As on 20Jun’20
2
India vs. Rest of World
0
10000
20000
30000
40000
50000
60000
0
2000
4000
6000
8000
10000
12000
14000
16000
18000
20000
Day
1
Day
8
Day
15
Day
22
Day
29
Day
36
Day
43
Day
50
Day
57
Day
64
Day
71
Day
78
Day
85
Day
92
Day
99
Day
10
6
Day
11
3
Day
12
0
Day
12
7
Day
13
4
Day
141
Day
14
8
Day
15
5
Italy Spain Iran
India Russia UK
US - RHS Brazil - RHS
Until
Lockdown
3 days after
the lockdown
2 weeks after
the lockdown
Since
lockdown
Past one
week
China* 44% 34% 29% 3% 0.0%
Italy 24% 19% 16% 3% 0.1%
France 16% 19% 15% 3% 0.2%
Spain 22% 30% 21% 4% 0.1%
Iran 47% 14% 8% 3% 1.2%
India 25% 9% 17% 8% 3.7%Russ ia 12% 13% 2% 5% 1.2%
UK 17% 19% 12% 4% 0.4%Brazi l 3.3%
US 1.5%
As on 27th Jun; * Hubei lockdown
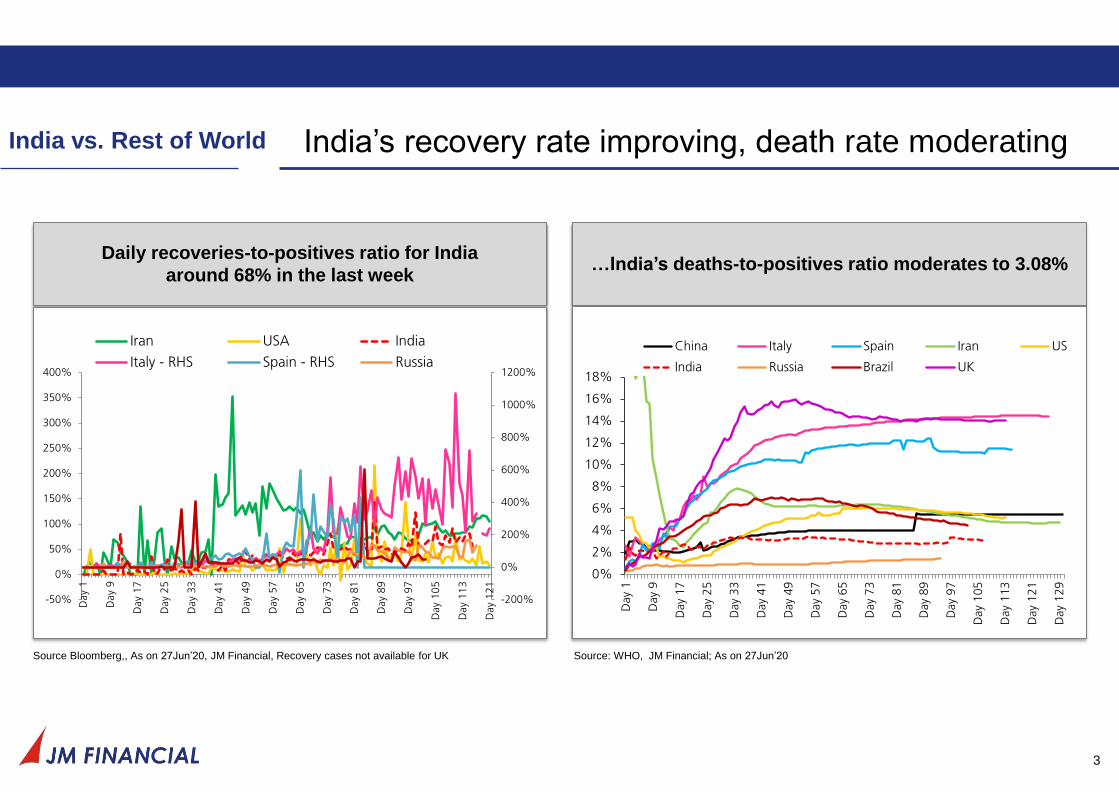
Daily recoveries-to-positives ratio for India
around 68% in the last week
India’s recovery rate improving, death rate moderating
Source Bloomberg,, As on 27Jun’20, JM Financial, Recovery cases not available for UK
…India’s deaths-to-positives ratio moderates to 3.08%
Source: WHO, JM Financial; As on 27Jun’20
3
India vs. Rest of World
-200%
0%
200%
400%
600%
800%
1000%
1200%
-50%
0%
50%
100%
150%
200%
250%
300%
350%
400%
Day
1
Day
9
Day
17
Day
25
Day
33
Day
41
Day
49
Day
57
Day
65
Day
73
Day
81
Day
89
Day
97
Day
10
5
Day
11
3
Day
12
1
Iran USA India
Italy - RHS Spain - RHS Russia
0%
2%
4%
6%
8%
10%
12%
14%
16%
18%
Day
1
Day
9
Day
17
Day
25
Day
33
Day
41
Day
49
Day
57
Day
65
Day
73
Day
81
Day
89
Day
97
Day
105
Day
113
Day
121
Day
129
China Italy Spain Iran US
India Russia Brazil UK
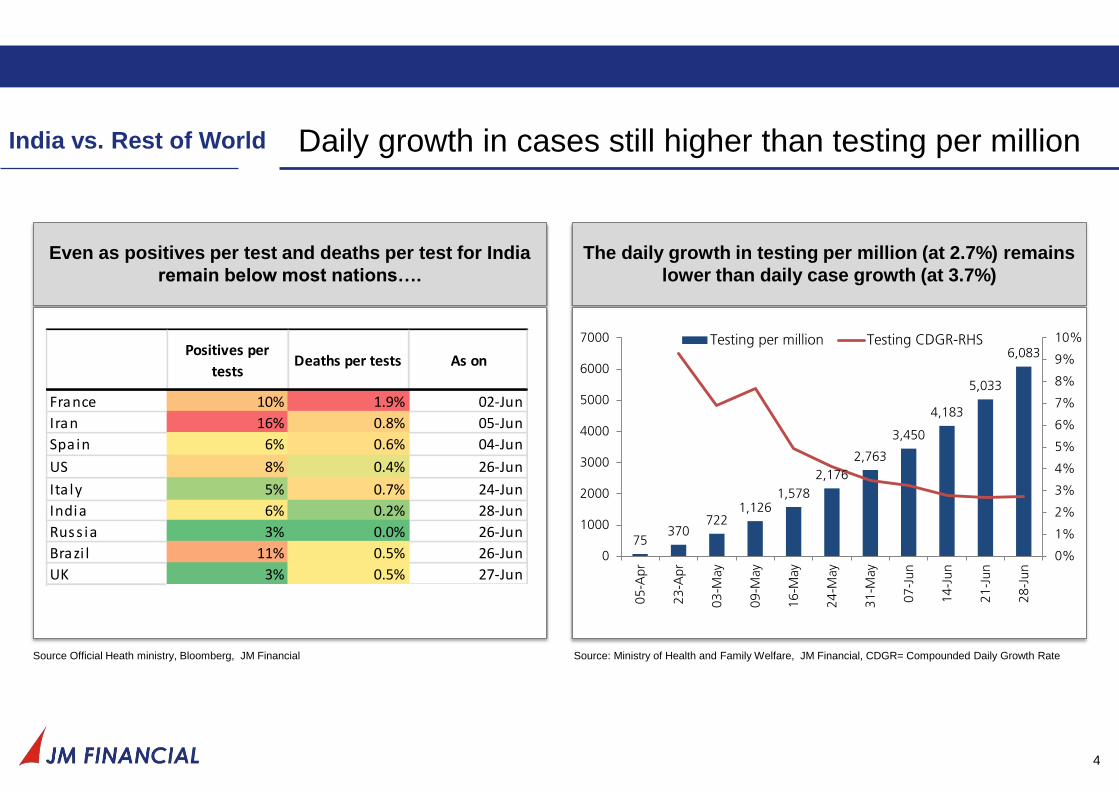
Even as positives per test and deaths per test for India
remain below most nations….
Daily growth in cases still higher than testing per million
Source Official Heath ministry, Bloomberg, JM Financial
The daily growth in testing per million (at 2.7%) remains
lower than daily case growth (at 3.7%)
Source: Ministry of Health and Family Welfare, JM Financial, CDGR= Compounded Daily Growth Rate
4
India vs. Rest of World
Positives per
testsDeaths per tests As on
France 10% 1.9% 02-Jun
Iran 16% 0.8% 05-Jun
Spain 6% 0.6% 04-Jun
US 8% 0.4% 26-Jun
Ita ly 5% 0.7% 24-Jun
India 6% 0.2% 28-Jun
Russ ia 3% 0.0% 26-Jun
Brazi l 11% 0.5% 26-Jun
UK 3% 0.5% 27-Jun
75370
7221,126
1,578
2,176
2,763
3,450
4,183
5,033
6,083
0%
1%
2%
3%
4%
5%
6%
7%
8%
9%
10%
0
1000
2000
3000
4000
5000
6000
7000
05
-Apr
23
-Apr
03
-May
09
-May
16
-May
24
-May
31
-May
07
-Ju
n
14
-Ju
n
21
-Ju
n
28
-Ju
n
Testing per million Testing CDGR-RHS
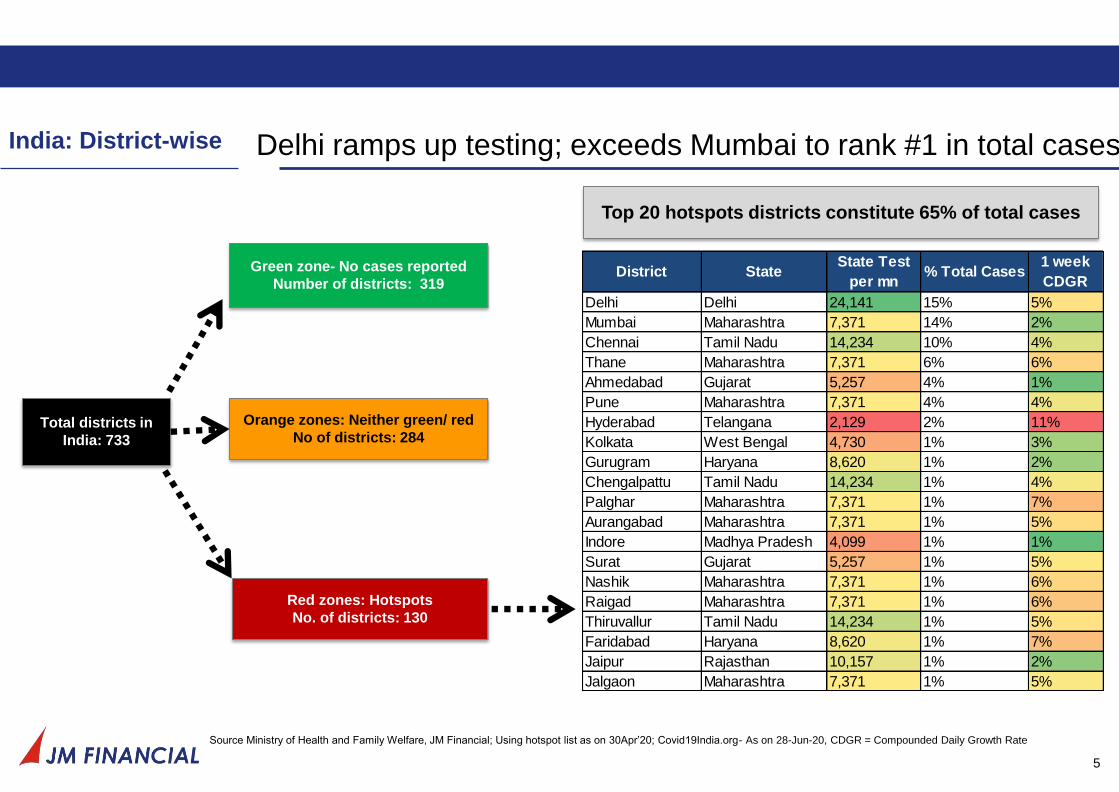
Delhi ramps up testing; exceeds Mumbai to rank #1 in total cases
5
Source Ministry of Health and Family Welfare, JM Financial; Using hotspot list as on 30Apr’20; Covid19India.org- As on 28-Jun-20, CDGR = Compounded Daily Growth Rate
India: District-wise
Total districts in
India: 733
Green zone- No cases reported
Number of districts: 319
Orange zones: Neither green/ red
No of districts: 284
Red zones: Hotspots
No. of districts: 130
Top 20 hotspots districts constitute 65% of total cases
District StateState Test
per mn% Total Cases
1 week
CDGR
Delhi Delhi 24,141 15% 5%
Mumbai Maharashtra 7,371 14% 2%
Chennai Tamil Nadu 14,234 10% 4%
Thane Maharashtra 7,371 6% 6%
Ahmedabad Gujarat 5,257 4% 1%
Pune Maharashtra 7,371 4% 4%
Hyderabad Telangana 2,129 2% 11%
Kolkata West Bengal 4,730 1% 3%
Gurugram Haryana 8,620 1% 2%
Chengalpattu Tamil Nadu 14,234 1% 4%
Palghar Maharashtra 7,371 1% 7%
Aurangabad Maharashtra 7,371 1% 5%
Indore Madhya Pradesh 4,099 1% 1%
Surat Gujarat 5,257 1% 5%
Nashik Maharashtra 7,371 1% 6%
Raigad Maharashtra 7,371 1% 6%
Thiruvallur Tamil Nadu 14,234 1% 5%
Faridabad Haryana 8,620 1% 7%
Jaipur Rajasthan 10,157 1% 2%
Jalgaon Maharashtra 7,371 1% 5%
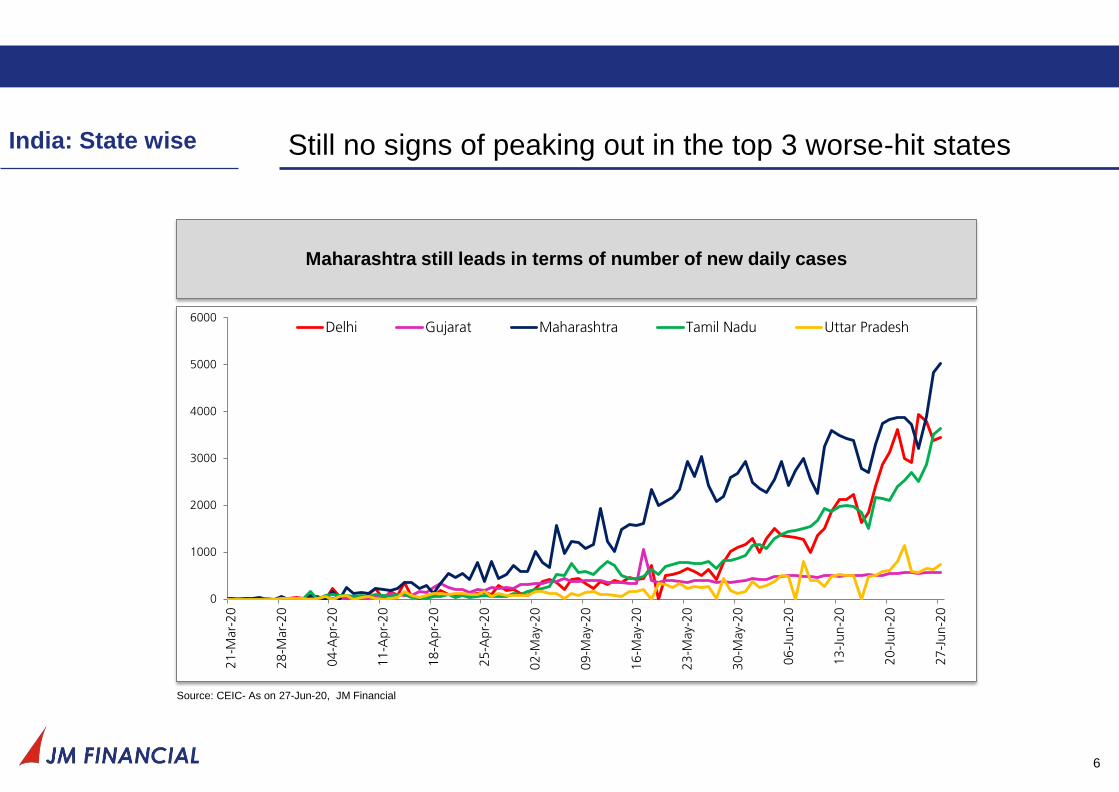
Still no signs of peaking out in the top 3 worse-hit states
6
India: State wise
Maharashtra still leads in terms of number of new daily cases
Source: CEIC- As on 27-Jun-20, JM Financial
0
1000
2000
3000
4000
5000
6000
21
-Mar-
20
28
-Mar-
20
04
-Apr-
20
11
-Apr-
20
18
-Apr-
20
25
-Apr-
20
02
-May-
20
09
-May-
20
16
-May-
20
23
-May-
20
30
-May-
20
06
-Ju
n-2
0
13
-Ju
n-2
0
20
-Ju
n-2
0
27
-Ju
n-2
0
Delhi Gujarat Maharashtra Tamil Nadu Uttar Pradesh
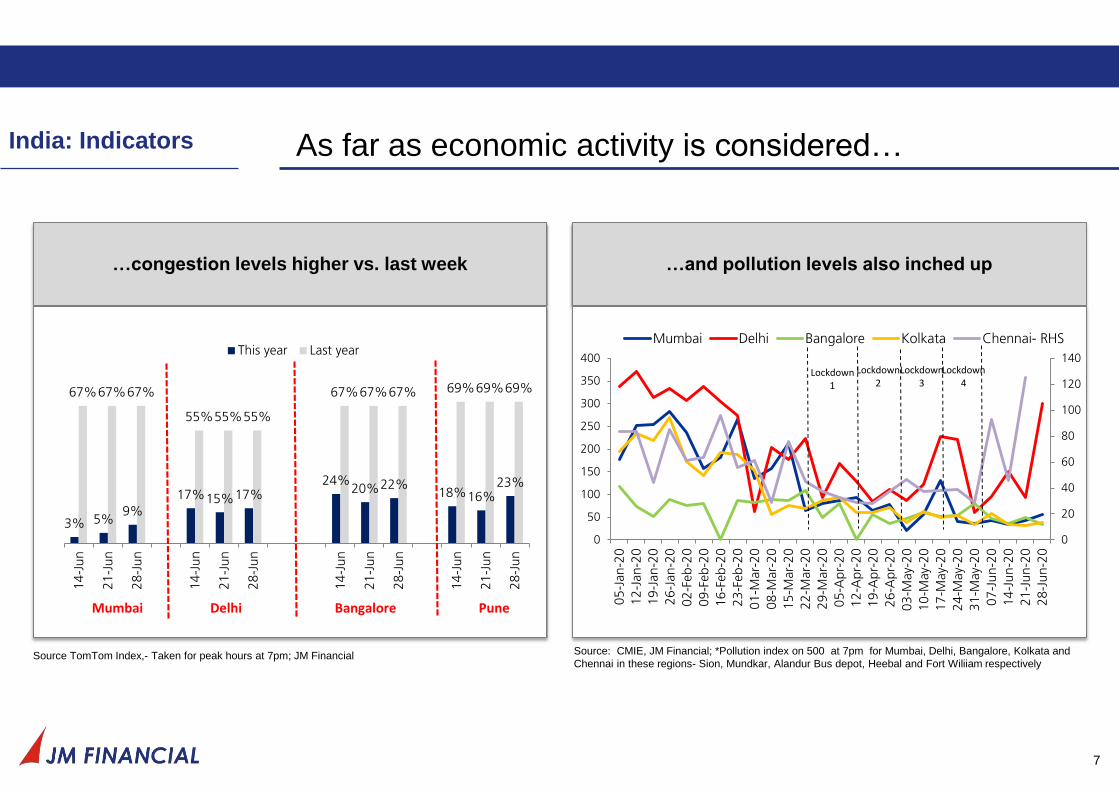
…and pollution levels also inched up
As far as economic activity is considered…
7
…congestion levels higher vs. last week
Source TomTom Index,- Taken for peak hours at 7pm; JM Financial Source: CMIE, JM Financial; *Pollution index on 500 at 7pm for Mumbai, Delhi, Bangalore, Kolkata and
Chennai in these regions- Sion, Mundkar, Alandur Bus depot, Heebal and Fort Wiliiam respectively
India: Indicators
3% 5%9%
17%15%17%24%
20%22%18%16%
23%
67%67%67%
55%55%55%
67%67%67% 69%69%69%
14
-Ju
n
21
-Ju
n
28
-Ju
n
14
-Ju
n
21
-Ju
n
28
-Ju
n
14
-Ju
n
21
-Ju
n
28
-Ju
n
14
-Ju
n
21
-Ju
n
28
-Ju
n
This year Last year
Mumbai Delhi Bangalore Pune
0
20
40
60
80
100
120
140
0
50
100
150
200
250
300
350
400
05
-Jan-2
0
12
-Jan-2
0
19
-Jan-2
0
26
-Jan-2
0
02
-Feb-2
0
09
-Feb-2
0
16
-Feb-2
0
23
-Feb-2
0
01
-Mar-
20
08
-Mar-
20
15
-Mar-
20
22
-Mar-
20
29
-Mar-
20
05
-Apr-
20
12
-Apr-
20
19
-Apr-
20
26
-Apr-
20
03
-May-
20
10
-May-
20
17
-May-
20
24
-May-
20
31
-May-
20
07
-Ju
n-2
0
14
-Ju
n-2
0
21
-Ju
n-2
0
28
-Ju
n-2
0
Mumbai Delhi Bangalore Kolkata Chennai- RHS
Lockdown1
Lockdown2
Lockdown3
Lockdown4
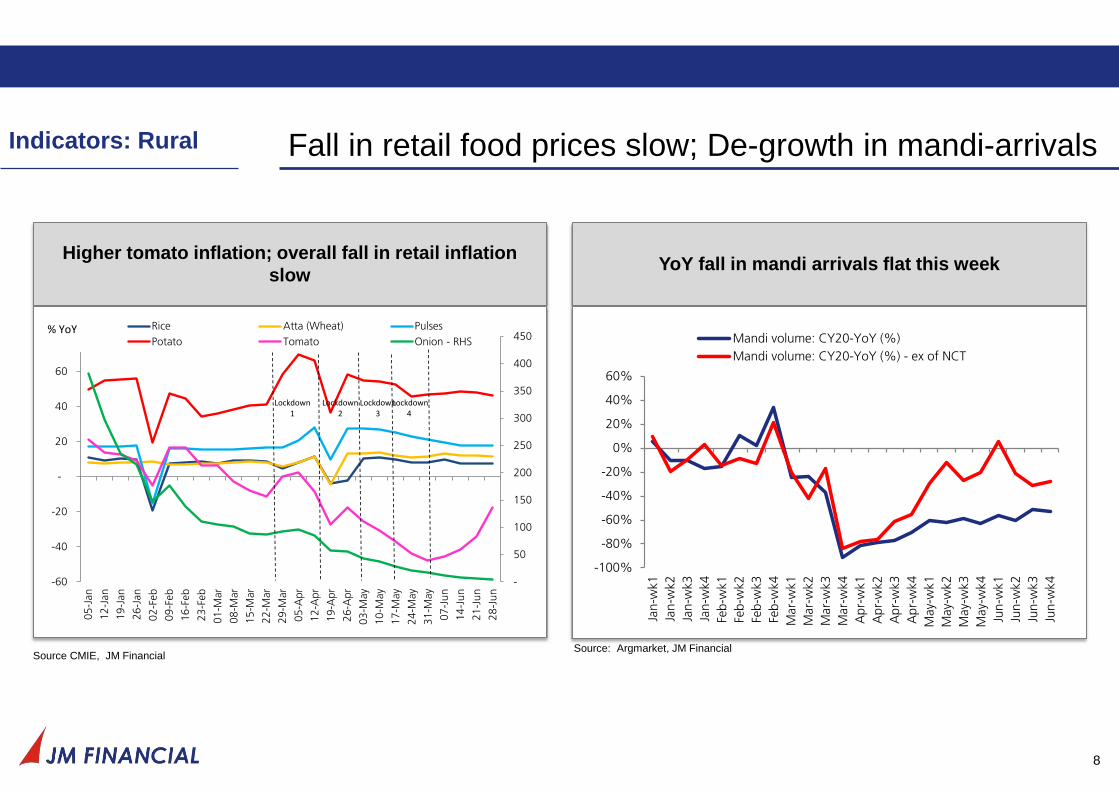
Fall in retail food prices slow; De-growth in mandi-arrivals
8
Higher tomato inflation; overall fall in retail inflation
slow
Source CMIE, JM Financial
YoY fall in mandi arrivals flat this week
Source: Argmarket, JM Financial
Indicators: Rural
-
50
100
150
200
250
300
350
400
450
-60
-40
-20
-
20
40
60
80
05
-Jan
12
-Jan
19
-Jan
26
-Jan
02
-Feb
09
-Feb
16
-Feb
23
-Feb
01
-Mar
08
-Mar
15
-Mar
22
-Mar
29
-Mar
05
-Apr
12
-Apr
19
-Apr
26
-Apr
03
-May
10
-May
17
-May
24
-May
31
-May
07
-Ju
n
14
-Ju
n
21
-Ju
n
28
-Ju
n
Rice Atta (Wheat) Pulses
Potato Tomato Onion - RHS% YoY
Lockdown 2
Lockdown 1
Lockdown 3
Lockdown 4
-100%
-80%
-60%
-40%
-20%
0%
20%
40%
60%
Jan-w
k1
Jan-w
k2
Jan-w
k3
Jan-w
k4
Feb-w
k1
Feb-w
k2
Feb-w
k3
Feb-w
k4
Mar-
wk1
Mar-
wk2
Mar-
wk3
Mar-
wk4
Ap
r-w
k1
Ap
r-w
k2
Ap
r-w
k3
Ap
r-w
k4
May-
wk1
May-
wk2
May-
wk3
May-
wk4
Jun-w
k1
Jun-w
k2
Jun-w
k3
Jun-w
k4
Mandi volume: CY20-YoY (%)
Mandi volume: CY20-YoY (%) - ex of NCT
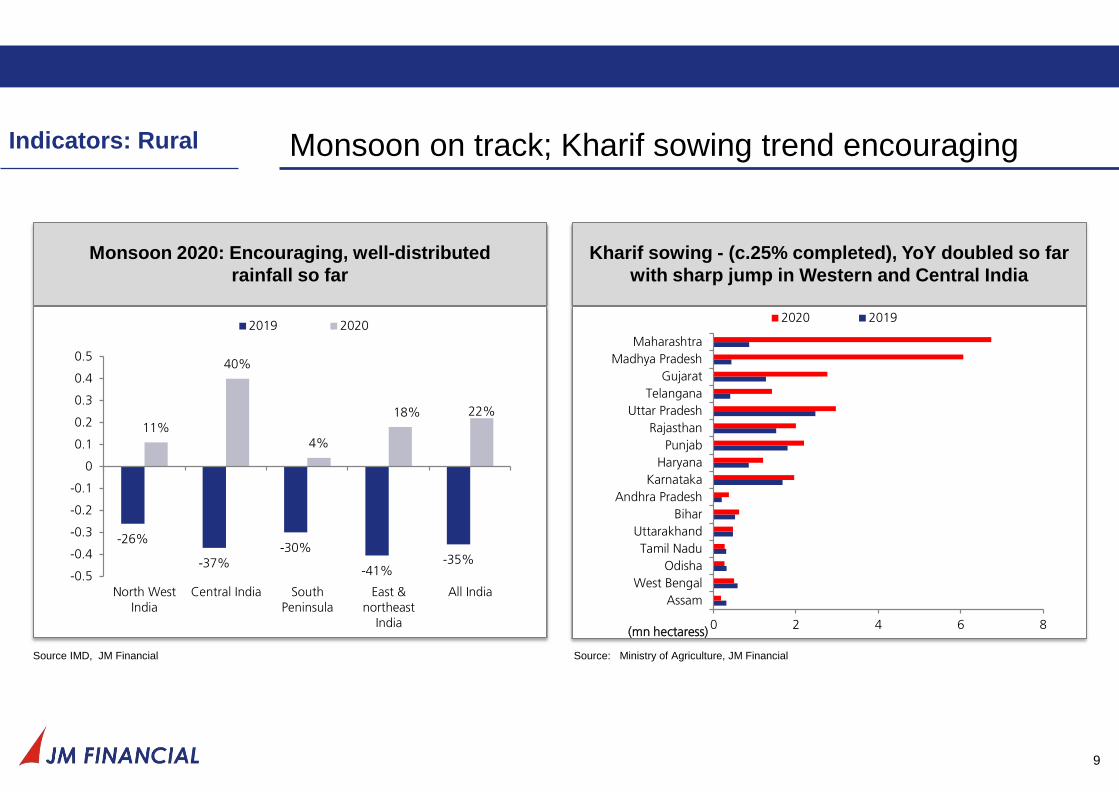
Monsoon on track; Kharif sowing trend encouraging
9
Monsoon 2020: Encouraging, well-distributed
rainfall so far
Source IMD, JM Financial
Kharif sowing - (c.25% completed), YoY doubled so far
with sharp jump in Western and Central India
Source: Ministry of Agriculture, JM Financial
Indicators: Rural
-26%
-37%-30%
-41%-35%
11%
40%
4%
18% 22%
-0.5
-0.4
-0.3
-0.2
-0.1
0
0.1
0.2
0.3
0.4
0.5
North WestIndia
Central India SouthPeninsula
East &northeast
India
All India
2019 2020
0 2 4 6 8
Assam
West Bengal
Odisha
Tamil Nadu
Uttarakhand
Bihar
Andhra Pradesh
Karnataka
Haryana
Punjab
Rajasthan
Uttar Pradesh
Telangana
Gujarat
Madhya Pradesh
Maharashtra
(mn hectaress)
2020 2019
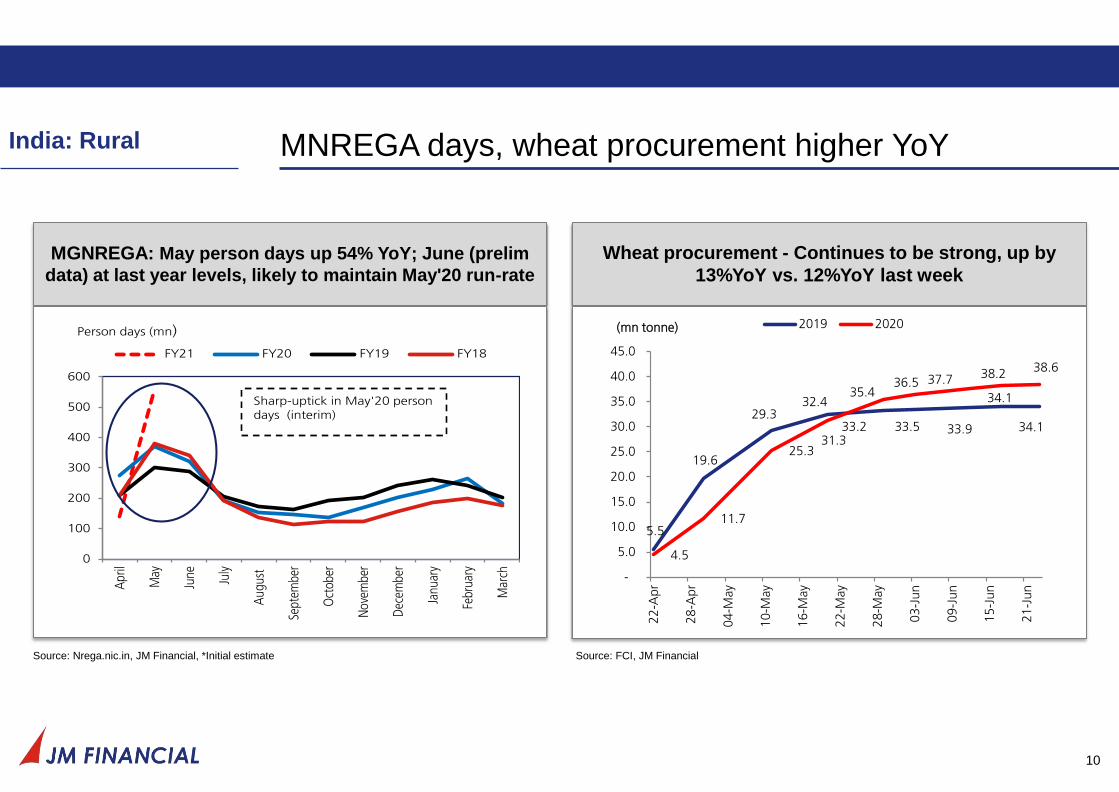
MNREGA days, wheat procurement higher YoY
10
India: Rural
MGNREGA: May person days up 54% YoY; June (prelim
data) at last year levels, likely to maintain May'20 run-rate
Wheat procurement - Continues to be strong, up by
13%YoY vs. 12%YoY last week
Source: Nrega.nic.in, JM Financial, *Initial estimate Source: FCI, JM Financial
0
100
200
300
400
500
600
Ap
ril
May
June July
Au
gust
Sept
embe
r
Oct
ober
No
vem
ber
Dec
embe
r
Janu
ary
Febr
uary
Mar
ch
FY21 FY20 FY19 FY18
Person days (mn)
Sharp-uptick in May'20 person days (interim)
5.5
19.6
29.3 32.4
33.2 33.5 33.9 34.1
34.1
4.5
11.7
25.3 31.3
35.4 36.5 37.7 38.2
38.6
-
5.0
10.0
15.0
20.0
25.0
30.0
35.0
40.0
45.0
22
-Ap
r
28
-Ap
r
04-M
ay
10-M
ay
16-M
ay
22-M
ay
28-M
ay
03-J
un
09-J
un
15-J
un
21-J
un
(mn tonne) 2019 2020
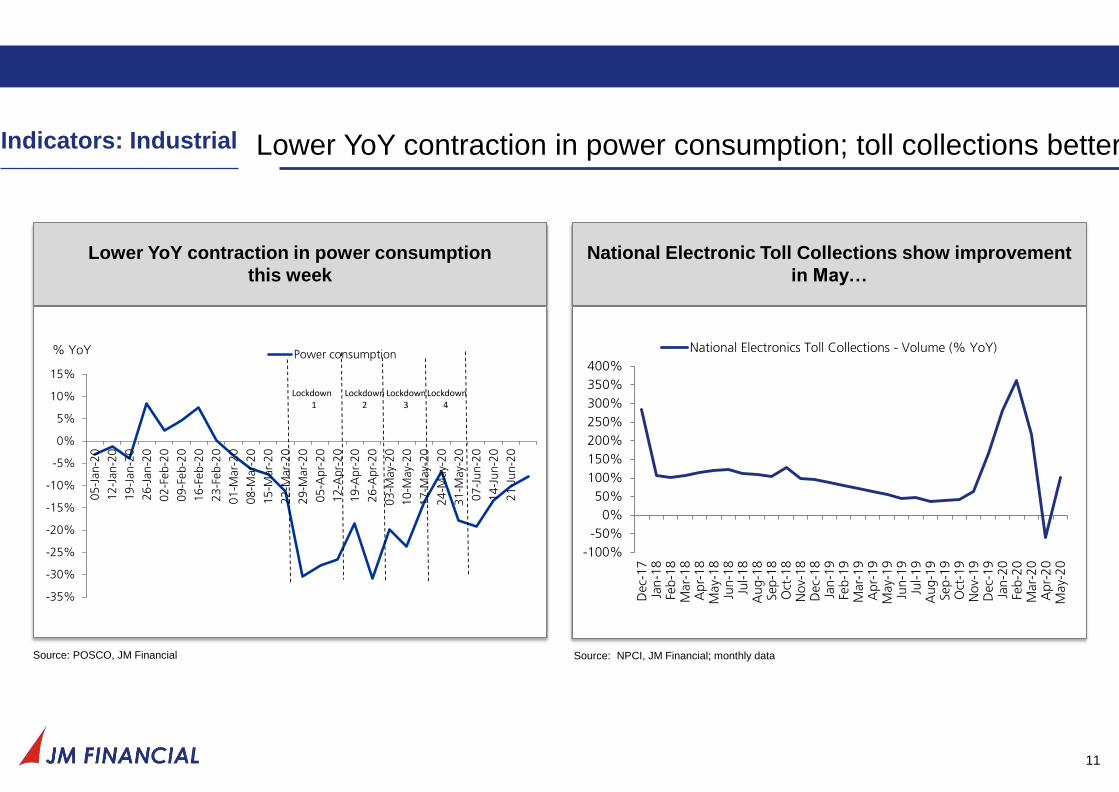
Lower YoY contraction in power consumption; toll collections better
11
Lower YoY contraction in power consumption
this week
Source: POSCO, JM Financial
National Electronic Toll Collections show improvement
in May…
Source: NPCI, JM Financial; monthly data
-100%
-50%
0%
50%
100%
150%
200%
250%
300%
350%
400%
Dec-
17
Jan
-18
Feb-1
8M
ar-
18
Apr-
18
May-
18
Jun-1
8Ju
l-1
8A
ug-1
8Sep
-18
Oct
-18
Nov-
18
Dec-
18
Jan
-19
Feb-1
9M
ar-
19
Apr-
19
May-
19
Jun-1
9Ju
l-1
9A
ug-1
9Sep
-19
Oct
-19
Nov-
19
Dec-
19
Jan
-20
Feb-2
0M
ar-
20
Apr-
20
May-
20
National Electronics Toll Collections - Volume (% YoY)
Indicators: Industrial
-35%
-30%
-25%
-20%
-15%
-10%
-5%
0%
5%
10%
15%
05
-Jan-2
0
12
-Jan-2
0
19
-Jan-2
0
26
-Jan-2
0
02
-Feb-2
0
09
-Feb-2
0
16
-Feb-2
0
23
-Feb-2
0
01
-Mar-
20
08
-Mar-
20
15
-Mar-
20
22
-Mar-
20
29
-Mar-
20
05
-Apr-
20
12
-Apr-
20
19
-Apr-
20
26
-Apr-
20
03
-May-
20
10
-May-
20
17
-May-
20
24
-May-
20
31
-May-
20
07
-Ju
n-2
0
14
-Ju
n-2
0
21
-Ju
n-2
0
Power consumption% YoY
Lockdown 2
Lockdown1
Lockdown 3
Lockdown 4
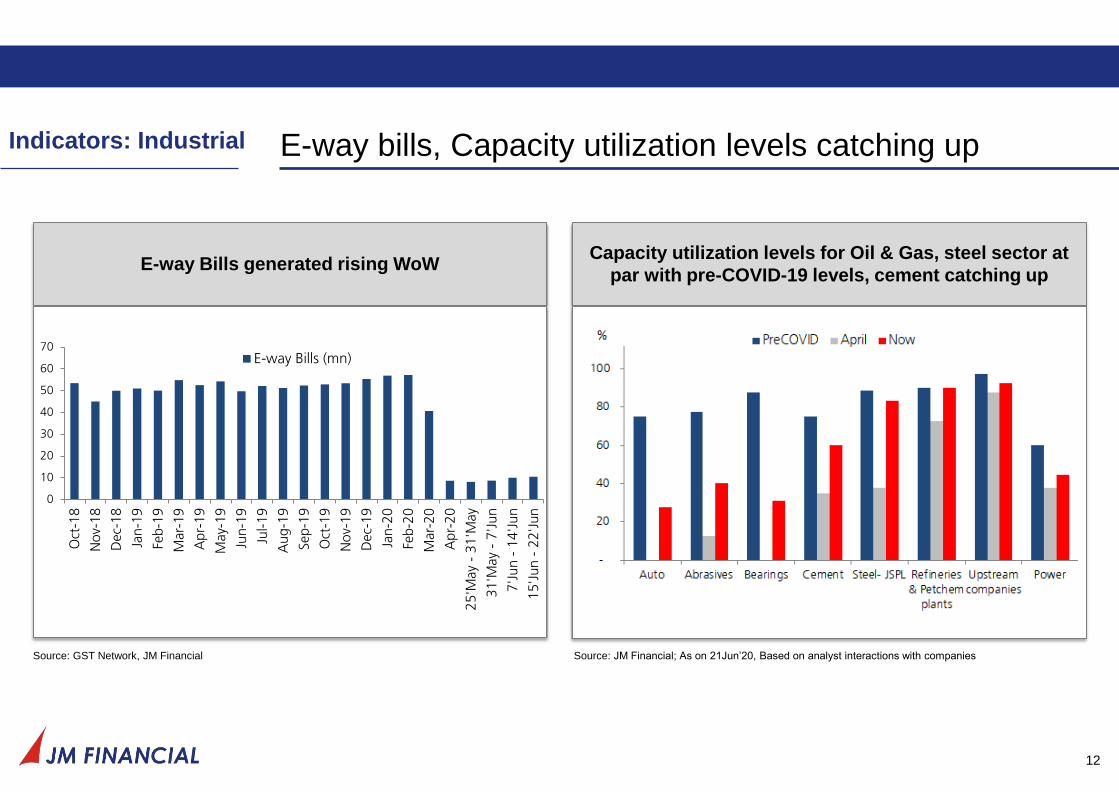
E-way bills, Capacity utilization levels catching up
12
E-way Bills generated rising WoW
Source: GST Network, JM Financial
Capacity utilization levels for Oil & Gas, steel sector at
par with pre-COVID-19 levels, cement catching up
Source: JM Financial; As on 21Jun’20, Based on analyst interactions with companies
Indicators: Industrial
0
10
20
30
40
50
60
70
Oct
-18
No
v-1
8
Dec-
18
Jan
-19
Feb-1
9
Mar-
19
Ap
r-1
9
May-
19
Jun-1
9
Jul-1
9
Au
g-1
9
Sep-1
9
Oct
-19
No
v-1
9
Dec-
19
Jan
-20
Feb-2
0
Mar-
20
Ap
r-2
0
25'M
ay
- 3
1'M
ay
31'M
ay
- 7
'Ju
n
7'J
un -
14
'Ju
n
15'J
un
- 2
2'J
un
E-way Bills (mn)
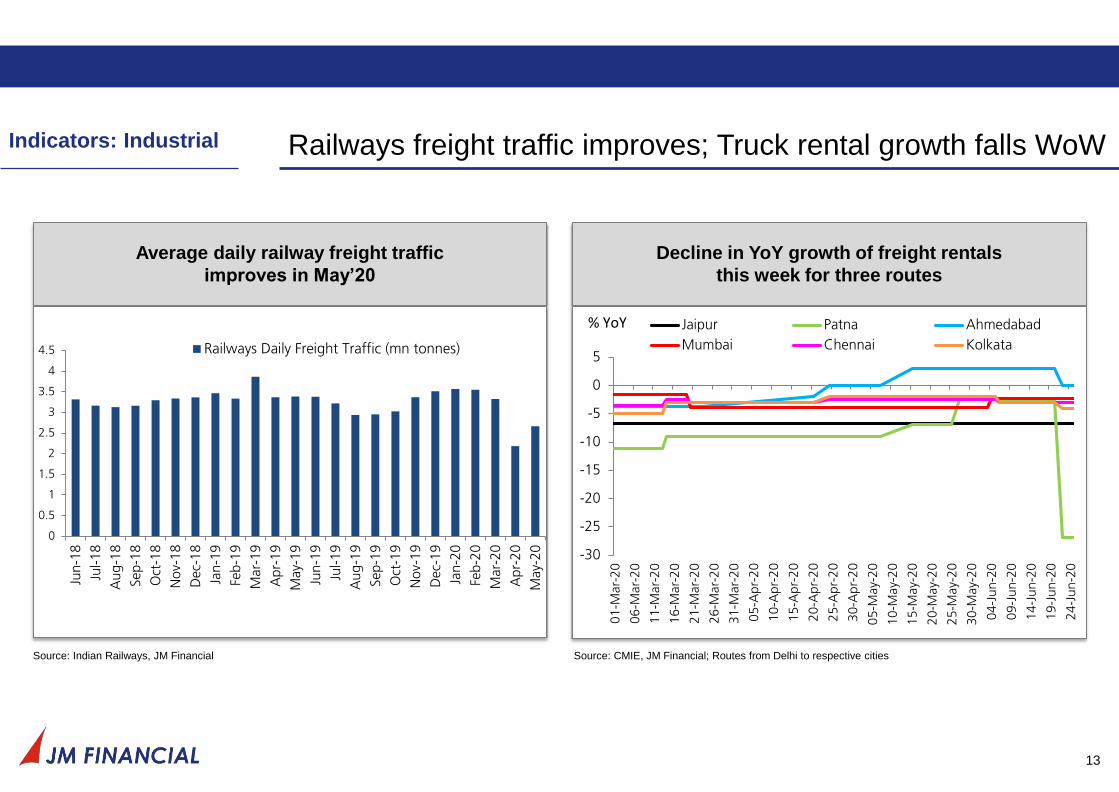
Railways freight traffic improves; Truck rental growth falls WoW
13
Average daily railway freight traffic
improves in May’20
Decline in YoY growth of freight rentals
this week for three routes
Source: Indian Railways, JM Financial Source: CMIE, JM Financial; Routes from Delhi to respective cities
Indicators: Industrial
-30
-25
-20
-15
-10
-5
0
5
01-M
ar-
20
06-M
ar-
20
11-M
ar-
20
16-M
ar-
20
21-M
ar-
20
26-M
ar-
20
31-M
ar-
20
05-A
pr-
20
10-A
pr-
20
15-A
pr-
20
20-A
pr-
20
25-A
pr-
20
30-A
pr-
20
05-M
ay-
20
10-M
ay-
20
15-M
ay-
20
20-M
ay-
20
25-M
ay-
20
30-M
ay-
20
04-J
un
-20
09-J
un
-20
14-J
un
-20
19-J
un
-20
24-J
un
-20
Jaipur Patna Ahmedabad
Mumbai Chennai Kolkata
% YoY
0
0.5
1
1.5
2
2.5
3
3.5
4
4.5
Jun-1
8
Jul-1
8
Aug-1
8
Sep-1
8
Oct
-18
No
v-1
8
Dec-
18
Jan
-19
Feb-1
9
Mar-
19
Apr-
19
May-
19
Jun-1
9
Jul-1
9
Aug-1
9
Sep-1
9
Oct
-19
No
v-1
9
Dec-
19
Jan
-20
Feb-2
0
Mar-
20
Apr-
20
May-
20
Railways Daily Freight Traffic (mn tonnes)
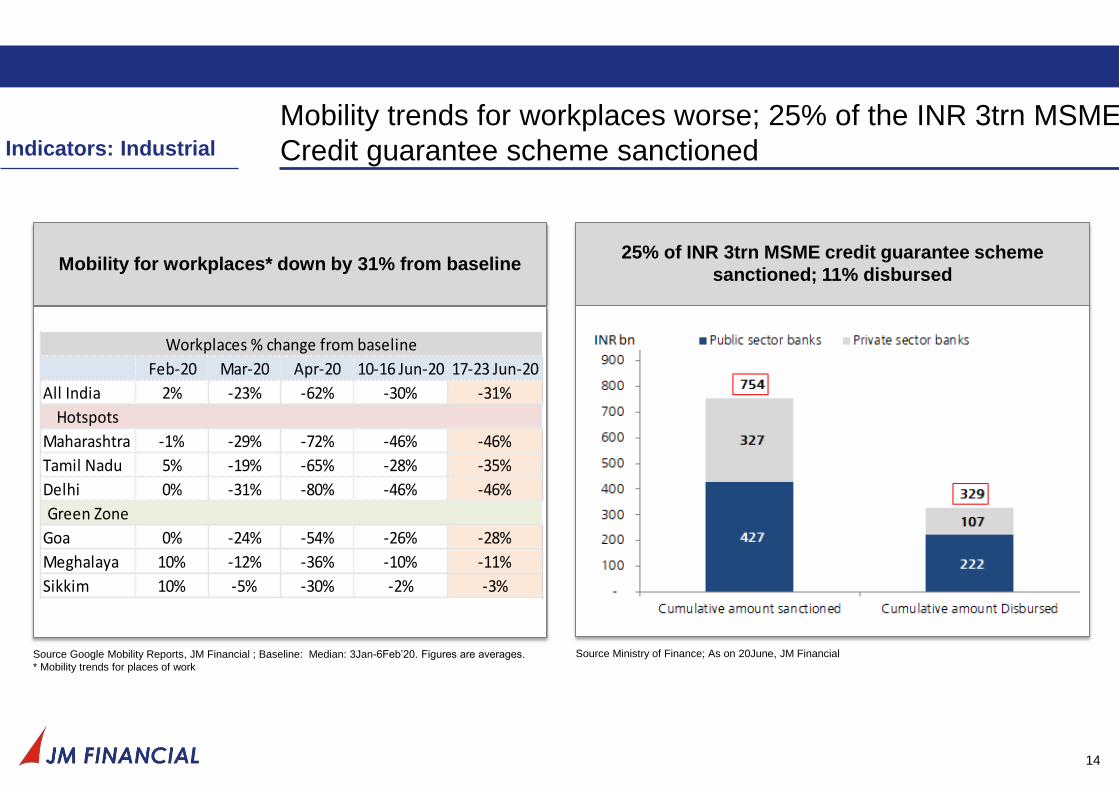
Mobility trends for workplaces worse; 25% of the INR 3trn MSME
Credit guarantee scheme sanctioned
14
Mobility for workplaces* down by 31% from baseline
Source Google Mobility Reports, JM Financial ; Baseline: Median: 3Jan-6Feb’20. Figures are averages.
* Mobility trends for places of work
Indicators: Industrial
25% of INR 3trn MSME credit guarantee scheme
sanctioned; 11% disbursed
Source Ministry of Finance; As on 20June, JM Financial
Feb-20 Mar-20 Apr-20 10-16 Jun-20 17-23 Jun-20
All India 2% -23% -62% -30% -31%
Hotspots
Maharashtra -1% -29% -72% -46% -46%
Tamil Nadu 5% -19% -65% -28% -35%
Delhi 0% -31% -80% -46% -46%
Green Zone
Goa 0% -24% -54% -26% -28%
Meghalaya 10% -12% -36% -10% -11%
Sikkim 10% -5% -30% -2% -3%
Workplaces % change from baseline
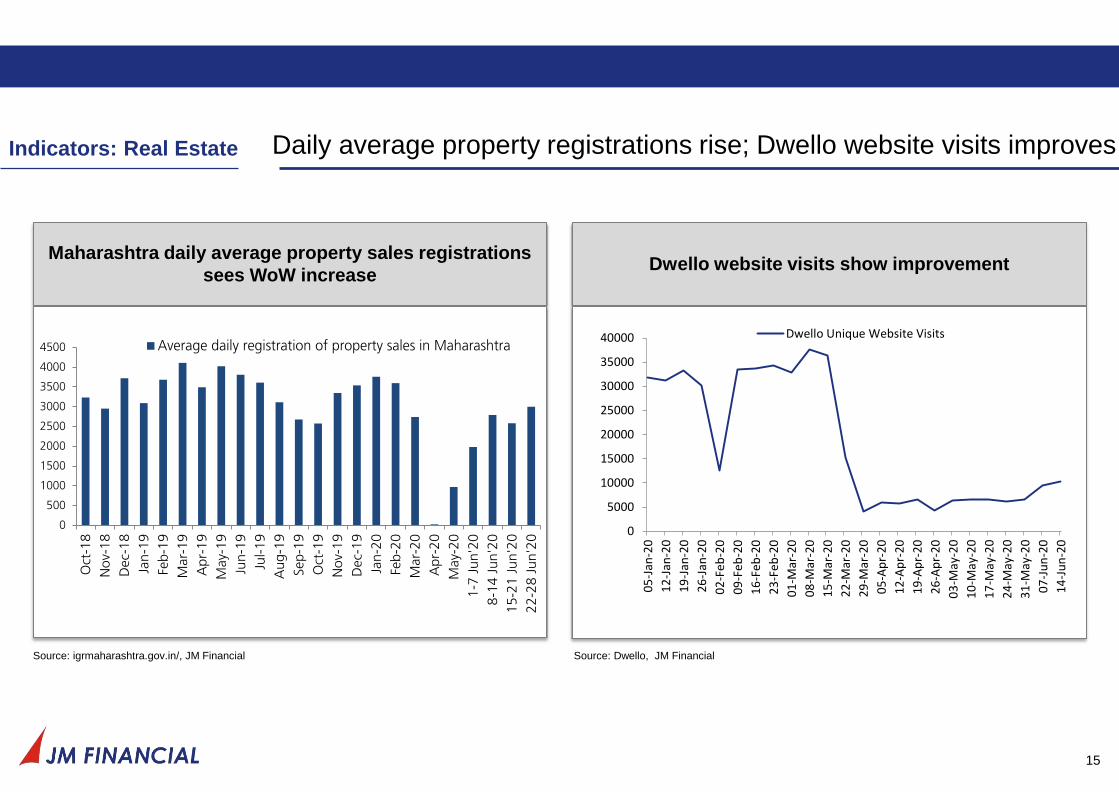
Daily average property registrations rise; Dwello website visits improves
15
Maharashtra daily average property sales registrations
sees WoW increase Dwello website visits show improvement
Source: igrmaharashtra.gov.in/, JM Financial Source: Dwello, JM Financial
0
5000
10000
15000
20000
25000
30000
35000
40000
05
-Jan
-20
12
-Jan
-20
19
-Jan
-20
26
-Jan
-20
02
-Fe
b-2
0
09
-Fe
b-2
0
16
-Fe
b-2
0
23
-Fe
b-2
0
01
-Mar
-20
08
-Mar
-20
15
-Mar
-20
22
-Mar
-20
29
-Mar
-20
05
-Ap
r-2
0
12
-Ap
r-2
0
19
-Ap
r-2
0
26
-Ap
r-2
0
03
-May
-20
10
-May
-20
17
-May
-20
24
-May
-20
31
-May
-20
07
-Ju
n-2
0
14
-Ju
n-2
0
Dwello Unique Website Visits
Indicators: Real Estate
0
500
1000
1500
2000
2500
3000
3500
4000
4500
Oct
-18
No
v-1
8
Dec-
18
Jan
-19
Feb-1
9
Mar-
19
Ap
r-1
9
May-
19
Jun-1
9
Jul-19
Au
g-1
9
Sep-1
9
Oct
-19
No
v-1
9
Dec-
19
Jan
-20
Feb-2
0
Mar-
20
Ap
r-2
0
May-
20
1-7
Ju
n'2
0
8-1
4 J
un
'20
15-2
1 J
un'2
0
22-2
8 J
un
'20
Average daily registration of property sales in Maharashtra
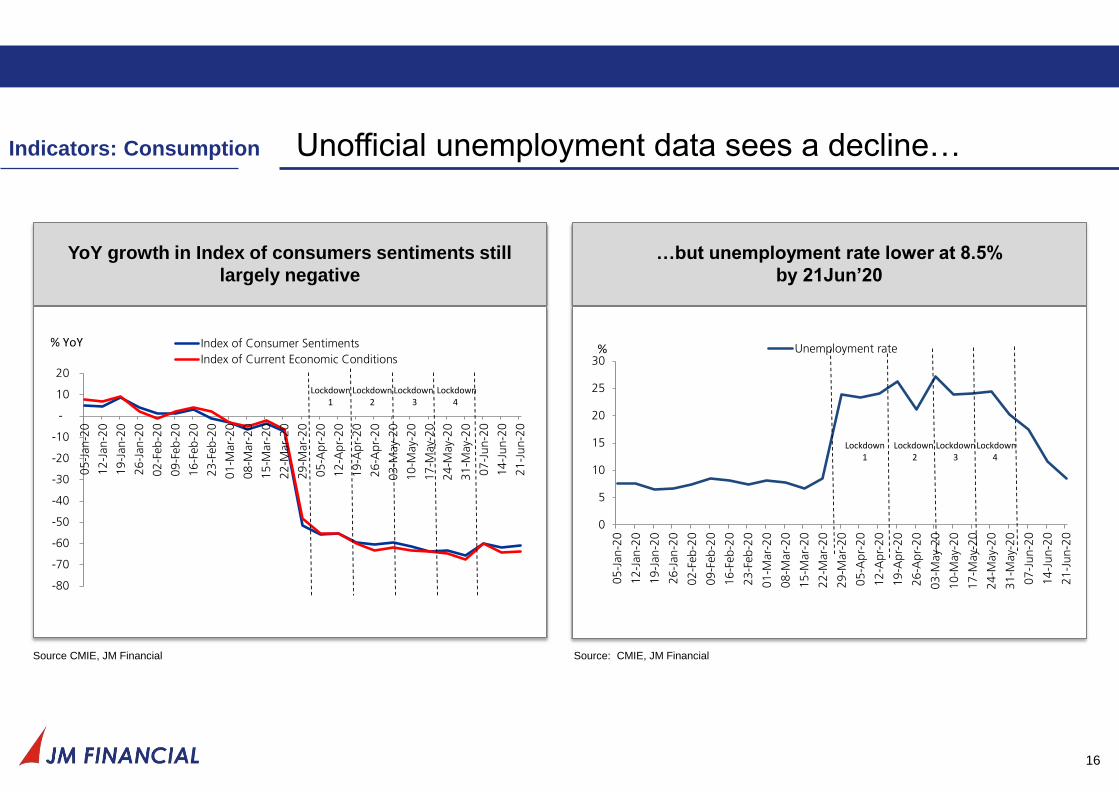
Unofficial unemployment data sees a decline…
16
YoY growth in Index of consumers sentiments still
largely negative
Source CMIE, JM Financial
…but unemployment rate lower at 8.5%
by 21Jun’20
Source: CMIE, JM Financial
Indicators: Consumption
-80
-70
-60
-50
-40
-30
-20
-10
-
10
20
05
-Jan
-20
12
-Jan
-20
19
-Jan
-20
26
-Jan
-20
02
-Feb
-20
09
-Feb
-20
16
-Feb
-20
23
-Feb
-20
01
-Mar-
20
08
-Mar-
20
15
-Mar-
20
22
-Mar-
20
29
-Mar-
20
05
-Ap
r-2
0
12
-Ap
r-2
0
19
-Ap
r-2
0
26
-Ap
r-2
0
03
-May-
20
10
-May-
20
17
-May-
20
24
-May-
20
31
-May-
20
07
-Ju
n-2
0
14
-Ju
n-2
0
21
-Ju
n-2
0
Index of Consumer Sentiments
Index of Current Economic Conditions
% YoY
Lockdown 2
Lockdown 1
Lockdown3
Lockdown 4
0
5
10
15
20
25
30
05
-Jan
-20
12
-Jan
-20
19
-Jan
-20
26
-Jan
-20
02
-Feb
-20
09
-Feb
-20
16
-Feb
-20
23
-Feb
-20
01
-Mar-
20
08
-Mar-
20
15
-Mar-
20
22
-Mar-
20
29
-Mar-
20
05
-Ap
r-2
0
12
-Ap
r-2
0
19
-Ap
r-2
0
26
-Ap
r-2
0
03
-May-
20
10
-May-
20
17
-May-
20
24
-May-
20
31
-May-
20
07
-Ju
n-2
0
14
-Ju
n-2
0
21
-Ju
n-2
0
Unemployment rate%
Lockdown2
Lockdown 1
Lockdown 3
Lockdown 4
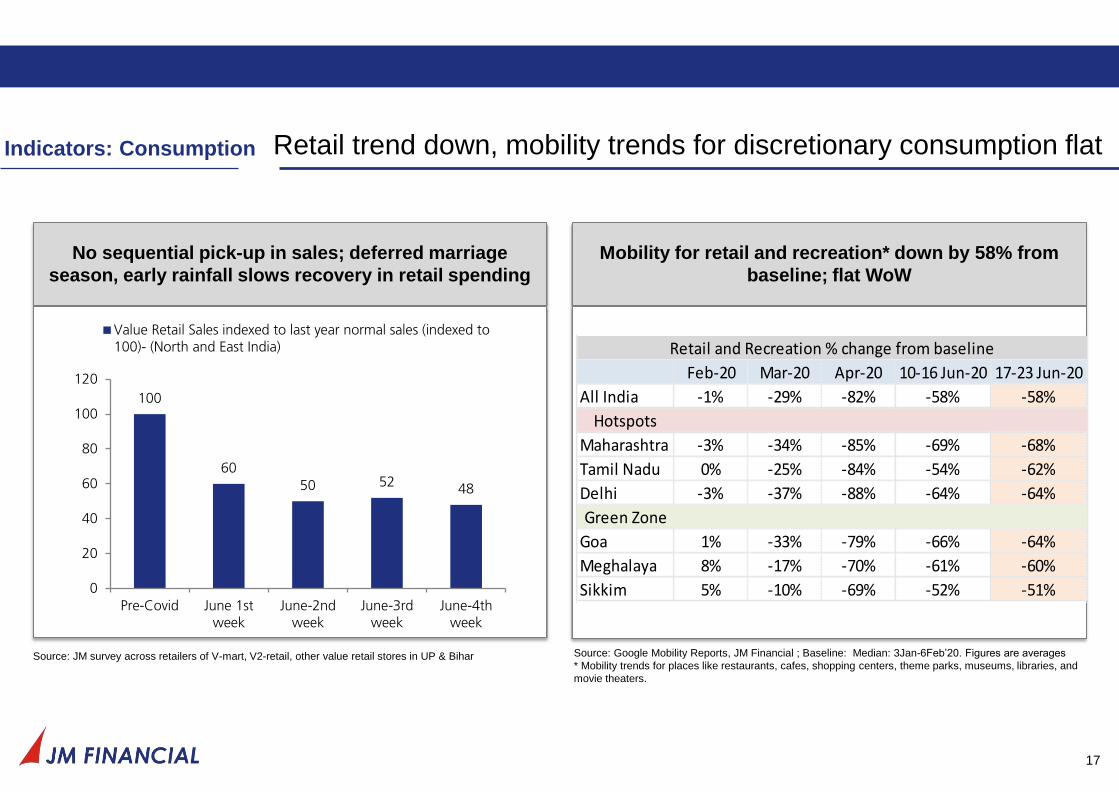
Retail trend down, mobility trends for discretionary consumption flat
17
No sequential pick-up in sales; deferred marriage
season, early rainfall slows recovery in retail spending
Mobility for retail and recreation* down by 58% from
baseline; flat WoW
Source: Google Mobility Reports, JM Financial ; Baseline: Median: 3Jan-6Feb’20. Figures are averages
* Mobility trends for places like restaurants, cafes, shopping centers, theme parks, museums, libraries, and
movie theaters.
Indicators: Consumption
Source: JM survey across retailers of V-mart, V2-retail, other value retail stores in UP & Bihar
Feb-20 Mar-20 Apr-20 10-16 Jun-20 17-23 Jun-20
All India -1% -29% -82% -58% -58%
Hotspots
Maharashtra -3% -34% -85% -69% -68%
Tamil Nadu 0% -25% -84% -54% -62%
Delhi -3% -37% -88% -64% -64%
Green Zone
Goa 1% -33% -79% -66% -64%
Meghalaya 8% -17% -70% -61% -60%
Sikkim 5% -10% -69% -52% -51%
Retail and Recreation % change from baseline
100
60
50 5248
0
20
40
60
80
100
120
Pre-Covid June 1stweek
June-2ndweek
June-3rdweek
June-4thweek
Value Retail Sales indexed to last year normal sales (indexed to100)- (North and East India)
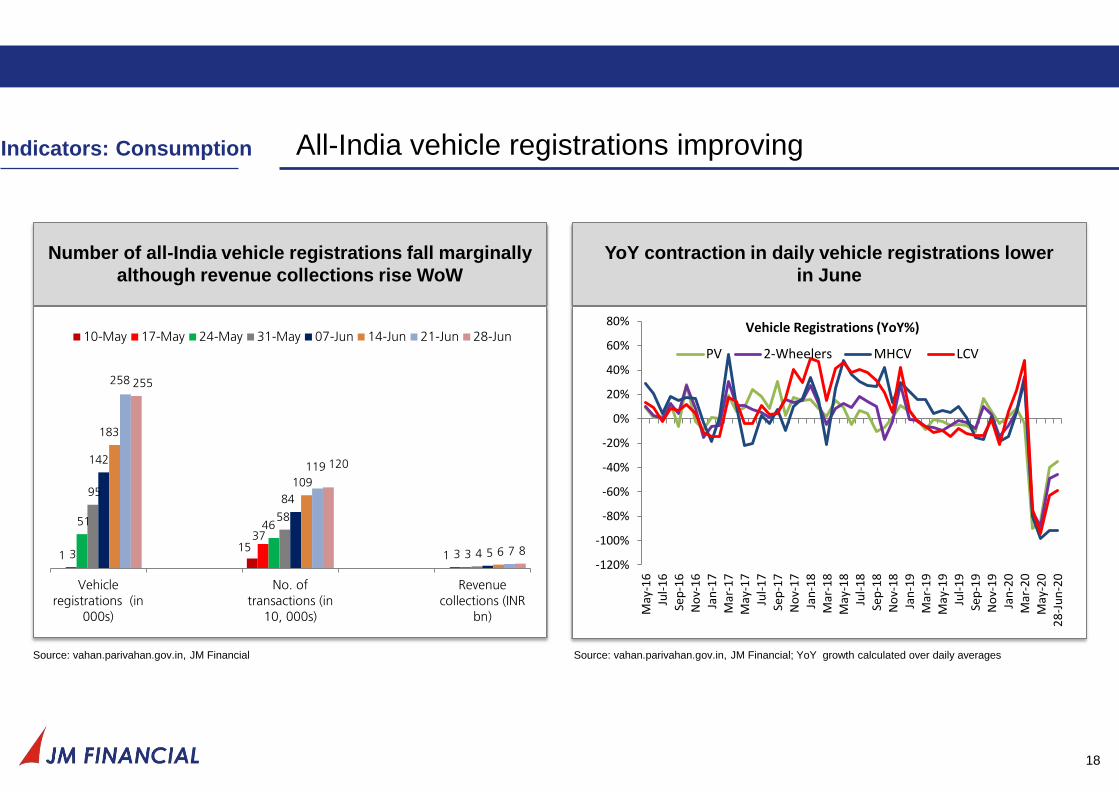
All-India vehicle registrations improving
18
Number of all-India vehicle registrations fall marginally
although revenue collections rise WoW
Source: vahan.parivahan.gov.in, JM Financial
YoY contraction in daily vehicle registrations lower
in June
Source: vahan.parivahan.gov.in, JM Financial; YoY growth calculated over daily averages
Indicators: Consumption
1 15
1 3
37
3
51 46
3
95
58
4
142
84
5
183
109
6
258
119
7
255
120
8
Vehicle
registrations (in000s)
No. of
transactions (in10, 000s)
Revenue
collections (INRbn)
10-May 17-May 24-May 31-May 07-Jun 14-Jun 21-Jun 28-Jun
-120%
-100%
-80%
-60%
-40%
-20%
0%
20%
40%
60%
80%
May
-16
Jul-
16
Sep
-16
No
v-1
6Ja
n-1
7M
ar-1
7M
ay-1
7Ju
l-1
7Se
p-1
7N
ov-
17
Jan
-18
Mar
-18
May
-18
Jul-
18
Sep
-18
No
v-1
8Ja
n-1
9M
ar-1
9M
ay-1
9Ju
l-1
9Se
p-1
9N
ov-
19
Jan
-20
Mar
-20
May
-20
28
-Ju
n-2
0
PV 2-Wheelers MHCV LCV
Vehicle Registrations (YoY%)
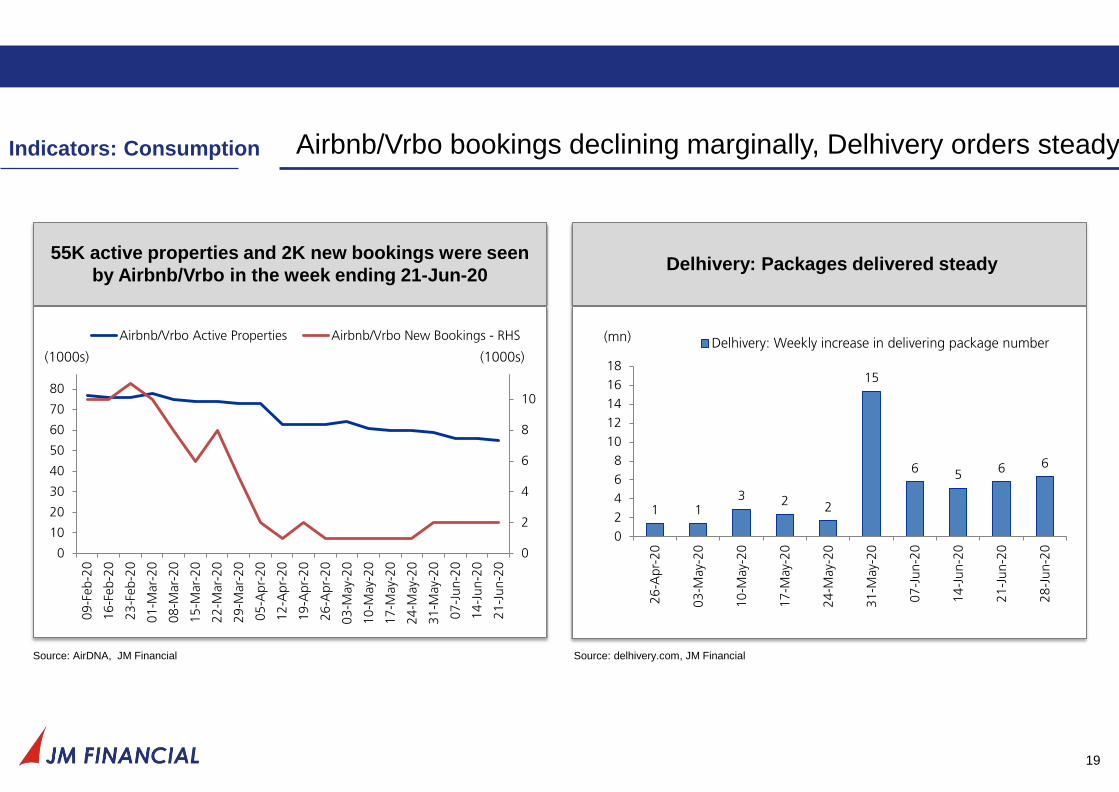
Airbnb/Vrbo bookings declining marginally, Delhivery orders steady
19
55K active properties and 2K new bookings were seen
by Airbnb/Vrbo in the week ending 21-Jun-20
Source: AirDNA, JM Financial
Delhivery: Packages delivered steady
Source: delhivery.com, JM Financial
Indicators: Consumption
0
2
4
6
8
10
12
0
10
20
30
40
50
60
70
80
90
09
-Feb-2
0
16
-Feb-2
0
23
-Feb-2
0
01
-Mar-
20
08
-Mar-
20
15
-Mar-
20
22
-Mar-
20
29
-Mar-
20
05
-Apr-
20
12
-Apr-
20
19
-Apr-
20
26
-Apr-
20
03
-May-
20
10
-May-
20
17
-May-
20
24
-May-
20
31
-May-
20
07
-Ju
n-2
0
14
-Ju
n-2
0
21
-Ju
n-2
0
Airbnb/Vrbo Active Properties Airbnb/Vrbo New Bookings - RHS
(1000s) (1000s)
1 13 2 2
15
65
6 6
0
2
4
6
8
10
12
14
16
18
26
-Apr-
20
03
-May-
20
10
-May-
20
17
-May-
20
24
-May-
20
31
-May-
20
07
-Ju
n-2
0
14
-Ju
n-2
0
21
-Ju
n-2
0
28
-Ju
n-2
0
Delhivery: Weekly increase in delivering package number(mn)
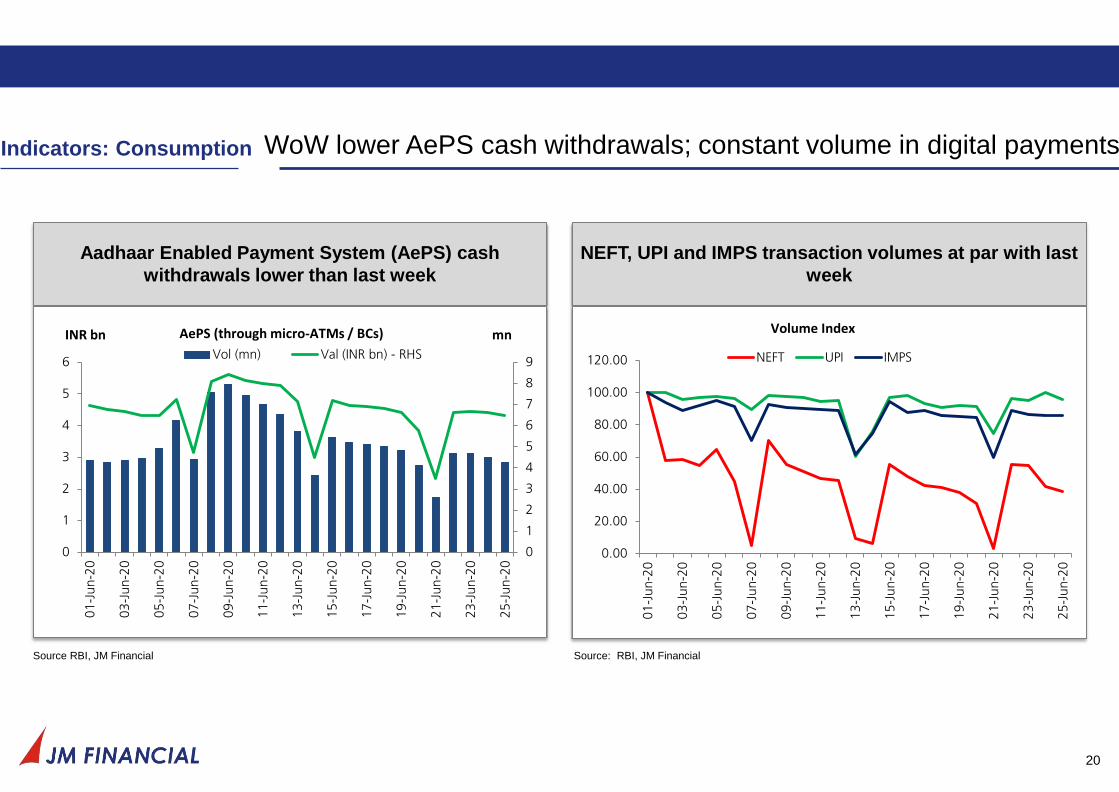
WoW lower AePS cash withdrawals; constant volume in digital payments
20
Aadhaar Enabled Payment System (AePS) cash
withdrawals lower than last week
Source RBI, JM Financial
NEFT, UPI and IMPS transaction volumes at par with last
week
Source: RBI, JM Financial
Indicators: Consumption
0
1
2
3
4
5
6
7
8
9
0
1
2
3
4
5
6
01
-Ju
n-2
0
03
-Ju
n-2
0
05
-Ju
n-2
0
07
-Ju
n-2
0
09
-Ju
n-2
0
11
-Ju
n-2
0
13
-Ju
n-2
0
15
-Ju
n-2
0
17
-Ju
n-2
0
19
-Ju
n-2
0
21
-Ju
n-2
0
23
-Ju
n-2
0
25
-Ju
n-2
0
Vol (mn) Val (INR bn) - RHS
AePS (through micro-ATMs / BCs) mnINR bn
0.00
20.00
40.00
60.00
80.00
100.00
120.00
01
-Ju
n-2
0
03
-Ju
n-2
0
05
-Ju
n-2
0
07
-Ju
n-2
0
09
-Ju
n-2
0
11
-Ju
n-2
0
13
-Ju
n-2
0
15
-Ju
n-2
0
17
-Ju
n-2
0
19
-Ju
n-2
0
21
-Ju
n-2
0
23
-Ju
n-2
0
25
-Ju
n-2
0
NEFT UPI IMPS
Volume Index
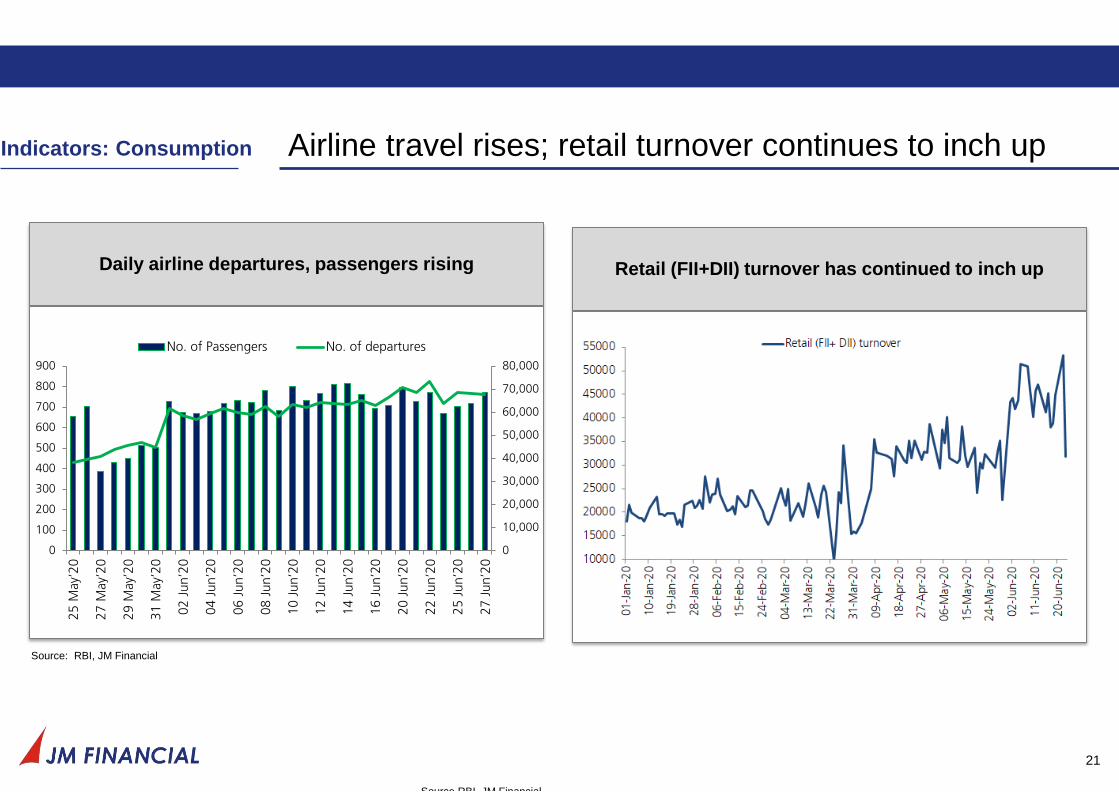
Airline travel rises; retail turnover continues to inch up
21
Retail (FII+DII) turnover has continued to inch up
Source RBI, JM Financial
Daily airline departures, passengers rising
Source: RBI, JM Financial
Indicators: Consumption
0
100
200
300
400
500
600
700
800
900
25 M
ay’
20
27 M
ay’
20
29 M
ay’
20
31 M
ay’
20
02 J
un’2
0
04 J
un’2
0
06 J
un’2
0
08 J
un’2
0
10 J
un’2
0
12 J
un’2
0
14 J
un’2
0
16 J
un’2
0
20 J
un’2
0
22 J
un’2
0
25 J
un’2
0
27 J
un’2
0
0
10,000
20,000
30,000
40,000
50,000
60,000
70,000
80,000
No. of Passengers No. of departures
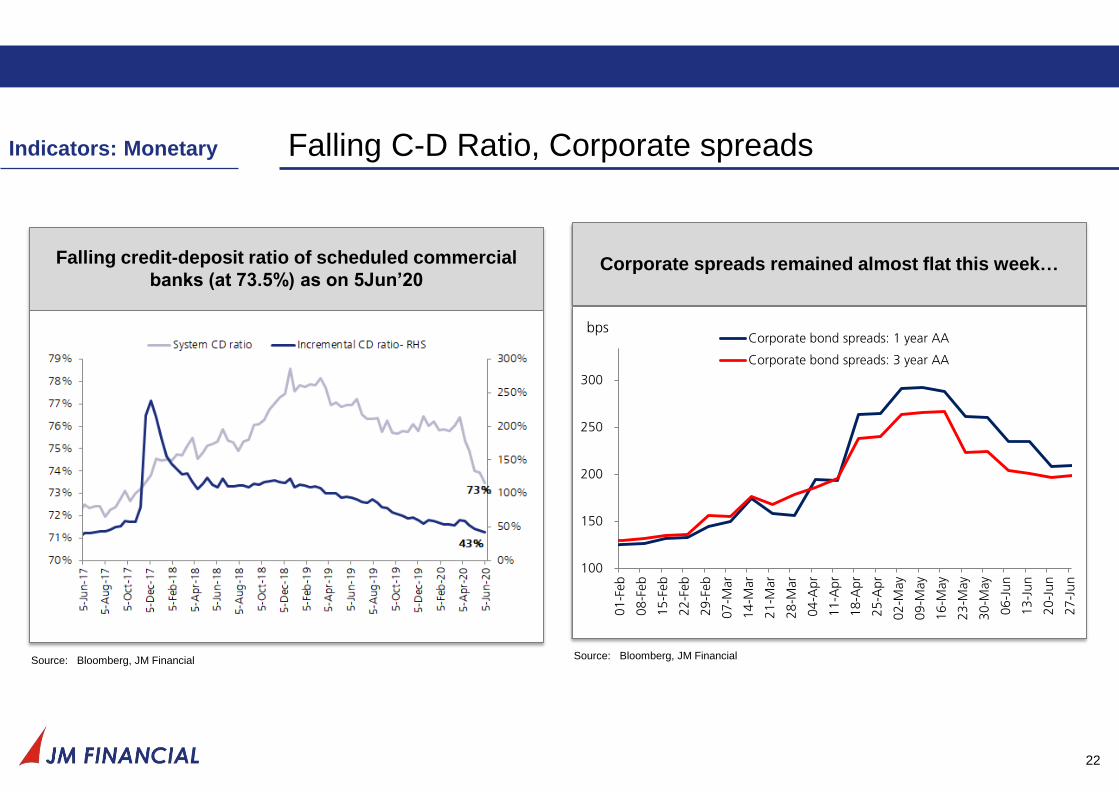
Falling C-D Ratio, Corporate spreads
22
Falling credit-deposit ratio of scheduled commercial
banks (at 73.5%) as on 5Jun’20
Source: Bloomberg, JM Financial
Indicators: Monetary
Corporate spreads remained almost flat this week…
Source: Bloomberg, JM Financial
100
150
200
250
300
350
01
-Feb
08
-Feb
15
-Feb
22
-Feb
29
-Feb
07
-Mar
14
-Mar
21
-Mar
28
-Mar
04
-Apr
11
-Apr
18
-Apr
25
-Apr
02
-May
09
-May
16
-May
23
-May
30
-May
06
-Ju
n
13
-Ju
n
20
-Ju
n
27
-Ju
n
Corporate bond spreads: 1 year AA
Corporate bond spreads: 3 year AA
bps
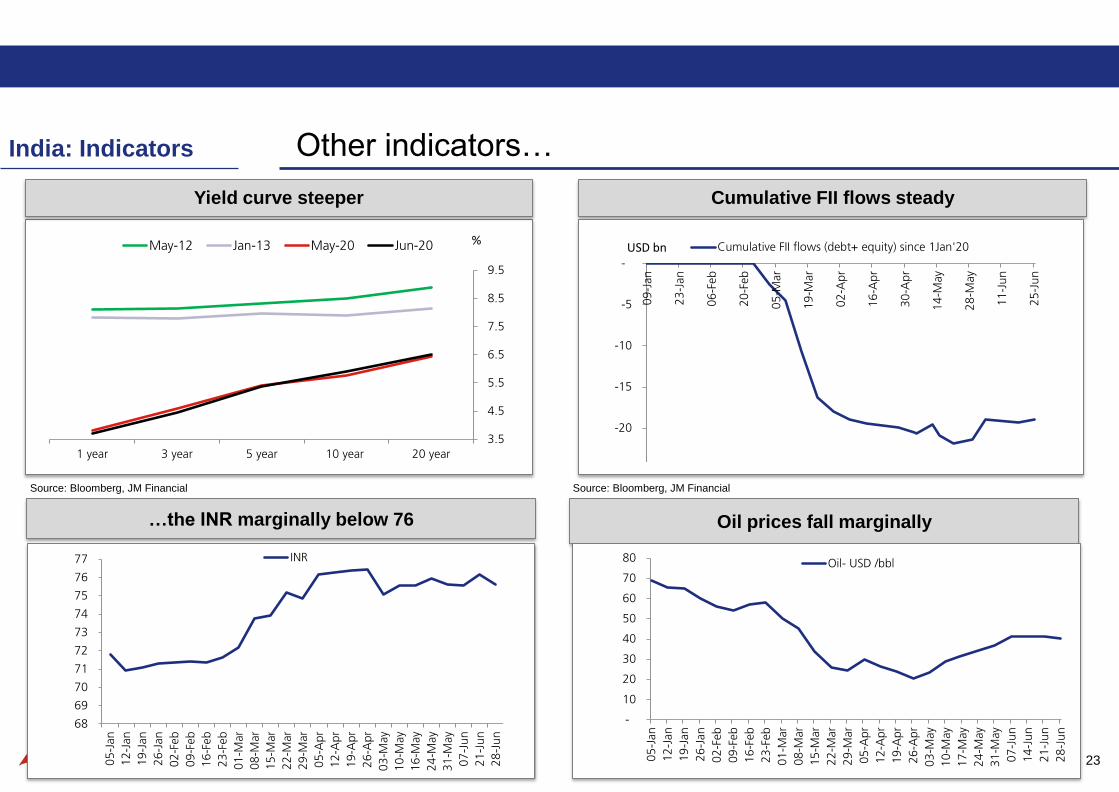
Other indicators…
23
India: Indicators
Oil prices fall marginally …the INR marginally below 76
Source: Bloomberg, JM Financial
Cumulative FII flows steady
Yield curve steeper
Source: Bloomberg, JM Financial
-
10
20
30
40
50
60
70
80
05
-Jan
12
-Jan
19
-Jan
26
-Jan
02
-Feb
09
-Feb
16
-Feb
23
-Feb
01
-Mar
08
-Mar
15
-Mar
22
-Mar
29
-Mar
05
-Apr
12
-Apr
19
-Apr
26
-Apr
03
-May
10
-May
17
-May
24
-May
31
-May
07
-Ju
n
14
-Ju
n
21
-Ju
n
28
-Ju
n
Oil- USD /bbl
68
69
70
71
72
73
74
75
76
77
05
-Jan
12
-Jan
19
-Jan
26
-Jan
02
-Feb
09
-Feb
16
-Feb
23
-Feb
01
-Mar
08
-Mar
15
-Mar
22
-Mar
29
-Mar
05
-Apr
12
-Apr
19
-Apr
26
-Apr
03
-May
10
-May
16
-May
24
-May
31
-May
07
-Ju
n
21
-Ju
n
28
-Ju
n
INR
-25
-20
-15
-10
-5
-
09
-Jan
23
-Jan
06
-Feb
20
-Feb
05
-Mar
19
-Mar
02
-Apr
16
-Apr
30
-Apr
14
-May
28
-May
11
-Ju
n
25
-Ju
n
Cumulative FII flows (debt+ equity) since 1Jan'20USD bn
3.5
4.5
5.5
6.5
7.5
8.5
9.5
20 year10 year5 year3 year1 year
May-12 Jan-13 May-20 Jun-20 %
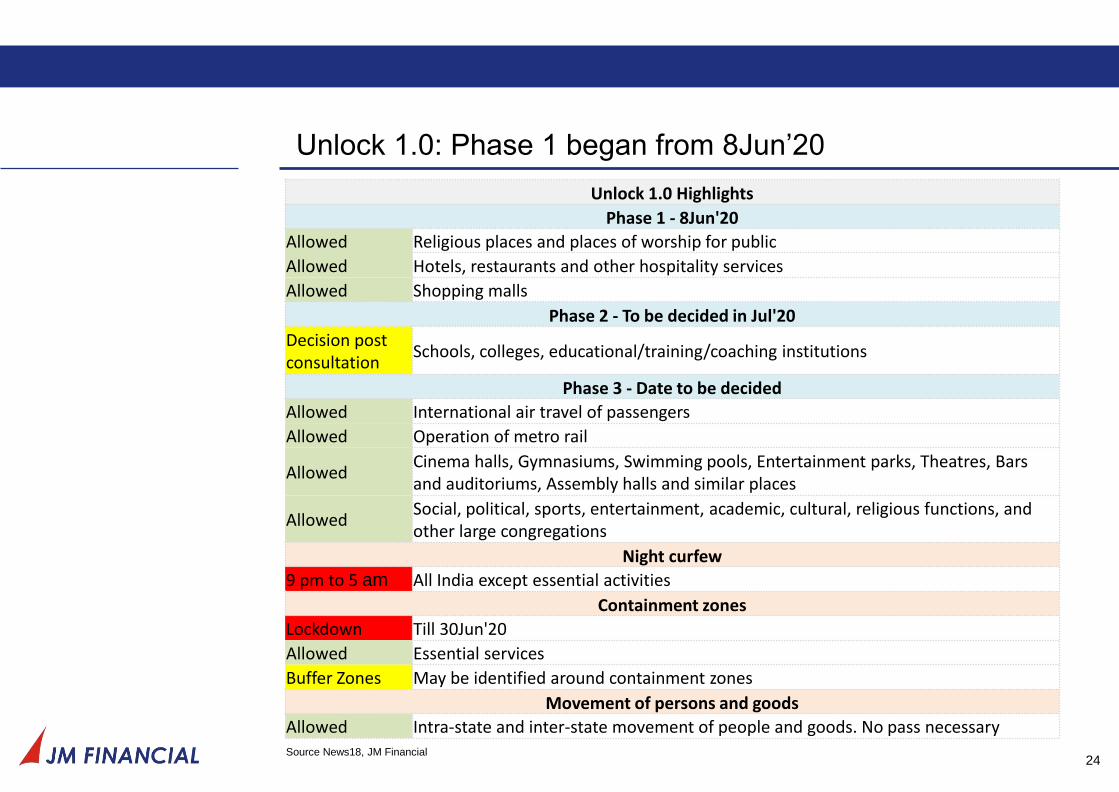
Unlock 1.0: Phase 1 began from 8Jun’20
24
Unlock 1.0 Highlights
Phase 1 - 8Jun'20
Allowed Religious places and places of worship for public
Allowed Hotels, restaurants and other hospitality services
Allowed Shopping malls
Phase 2 - To be decided in Jul'20
Decision post consultation
Schools, colleges, educational/training/coaching institutions
Phase 3 - Date to be decided
Allowed International air travel of passengers
Allowed Operation of metro rail
Allowed Cinema halls, Gymnasiums, Swimming pools, Entertainment parks, Theatres, Bars and auditoriums, Assembly halls and similar places
Allowed Social, political, sports, entertainment, academic, cultural, religious functions, and other large congregations
Night curfew
9 pm to 5 am All India except essential activities
Containment zones
Lockdown Till 30Jun'20
Allowed Essential services
Buffer Zones May be identified around containment zones
Movement of persons and goods
Allowed Intra-state and inter-state movement of people and goods. No pass necessary Source News18, JM Financial
Refer to our other earlier tracker reports
25
• COVID-19 Tracker_21Jun2020
• COVID-19 Tracker_14Jun2020
• COVID-19 Tracker_7Jun2020
• COVID-19 Tracker_31May2020
• COVID-19 Tracker_25May2020
• COVID-19 Tracker_18May2020
• COVID-19 Tracker_14May2020
• COVID-19 Tracker_8May2020
Important Disclosures
This research report has been prepared by JM Financial Institutional Securities Limited (JM Financial Institutional Securities) to provide information about the company(ies) and sector(s), if any, covered
in the report and may be distributed by it and/or its associates solely for the purpose of information of the select recipient of this report. This report and/or any part thereof, may not be duplicated in any
form and/or reproduced or redistributed without the prior written consent of JM Financial Institutional Securities. This report has been prepared independent of the companies covered herein.
JM Financial Institutional Securities is registered with the Securities and Exchange Board of India (SEBI) as a Research Analyst and a Stock Broker having trading memberships of the BSE Ltd. (BSE),
National Stock Exchange of India Ltd. (NSE) and Metropolitan Stock Exchange of India Ltd. (MSEI). No material disciplinary action has been taken by SEBI against JM Financial Institutional Securities in
the past two financial years which may impact the investment decision making of the investor.
JM Financial Institutional Securities renders stock broking services primarily to institutional investors and provides the research services to its institutional clients/investors. JM Financial Institutional
Securities and its associates are part of a multi-service, integrated investment banking, investment management, brokerage and financing group. JM Financial Institutional Securities and/or its associates
might have provided or may provide services in respect of managing offerings of securities, corporate finance, investment banking, mergers & acquisitions, broking, financing or any other advisory
services to the company(ies) covered herein. JM Financial Institutional Securities and/or its associates might have received during the past twelve months or may receive compensation from the
company(ies) mentioned in this report for rendering any of the above services.
JM Financial Institutional Securities and/or its associates, their directors and employees may; (a) from time to time, have a long or short position in, and buy or sell the securities of the company(ies)
mentioned herein or (b) be engaged in any other transaction involving such securities and earn brokerage or other compensation or act as a market maker in the financial instruments of the company(ies)
covered under this report or (c) act as an advisor or lender/borrower to, or may have any financial interest in, such company(ies) or (d) considering the nature of business/activities that JM Financial
Institutional Securities is engaged in, it may have potential conflict of interest at the time of publication of this report on the subject company(ies).
Neither JM Financial Institutional Securities nor its associates or the Research Analyst(s) named in this report or his/her relatives individually own one per cent or more securities of the company(ies)
covered under this report, at the relevant date as specified in the SEBI (Research Analysts) Regulations, 2014.
The Research Analyst(s) principally responsible for the preparation of this research report and members of their household are prohibited from buying or selling debt or equity securities, including but not
limited to any option, right, warrant, future, long or short position issued by company(ies) covered under this report. The Research Analyst(s) principally responsible for the preparation of this research
report or their relatives (as defined under SEBI (Research Analysts) Regulations, 2014); (a) do not have any financial interest in the company(ies) covered under this report or (b) did not receive any
compensation from the company(ies) covered under this report, or from any third party, in connection with this report or (c) do not have any other material conflict of interest at the time of publication of
this report. Research Analyst(s) are not serving as an officer, director or employee of the company(ies) covered under this report.
Research Analyst(s) Certification The Research Analyst(s), with respect to each issuer and its securities covered by them in this research report, certify that:
All of the views expressed in this research report accurately reflect his or her or their personal views about all of the issuers and their securities; and
No part of his or her or their compensation was, is, or will be directly or indirectly related to the specific recommendations or views expressed in this research report.
Definition of ratings
Rating Meaning
Buy Total expected returns of more than 15%. Total expected return includes dividend yields.
Hold Price expected to move in the range of 10% downside to 15% upside from the current market price.
Sell Price expected to move downwards by more than 10%
JM Financial Institutional Securities Limited
Corporate Identity Number: U67100MH2017PLC296081
Member of BSE Ltd., National Stock Exchange of India Ltd. and Metropolitan Stock Exchange of India Ltd.
SEBI Registration Nos.: –Stock Broker - INZ000163434, Research Analyst – INH000000610
Registered Office: 7th Floor, Cnergy, Appasaheb Marathe Marg, Prabhadevi, Mumbai 400 025, India.
Board: +9122 6630 3030 | Fax: +91 22 6630 3488 | Email: [email protected] | www.jmfl.com
Compliance Officer: Mr. Sunny Shah | Tel: +91 22 6630 3383 | Email: [email protected]
26
While reasonable care has been taken in the preparation of this report, it does not purport to be a complete description of the securities, markets or developments referred to herein, and JM Financial Institutional Securities does
not warrant its accuracy or completeness. JM Financial Institutional Securities may not be in any way responsible for any loss or damage that may arise to any person from any inadvertent error in the information contained in
this report. This report is provided for information only and is not an investment advice and must not alone be taken as the basis for an investment decision. The investment discussed or views expressed or
recommendations/opinions given herein may not be suitable for all investors. The user assumes the entire risk of any use made of this information. The information contained herein may be changed without notice and JM
Financial Institutional Securities reserves the right to make modifications and alterations to this statement as they may deem fit from time to time.
This report is neither an offer nor solicitation of an offer to buy and/or sell any securities mentioned herein and/or not an official confirmation of any transaction.
This report is not directed or intended for distribution to, or use by any person or entity who is a citizen or resident of or located in any locality, state, country or other jurisdiction, where such distribution, publication, availability or
use would be contrary to law, regulation or which would subject JM Financial Institutional Securities and/or its affiliated company(ies) to any registration or licensing requirement within such jurisdiction. The securities described
herein may or may not be eligible for sale in all jurisdictions or to a certain category of investors. Persons in whose possession this report may come, are required to inform themselves of and to observe such restrictions.
Persons who receive this report from JM Financial Singapore Pte Ltd may contact Mr. Ruchir Jhunjhunwala ([email protected]) on +65 6422 1888 in respect of any matters arising from, or in connection with, this
report.
Additional disclosure only for U.S. persons: JM Financial Institutional Securities has entered into an agreement with JM Financial Securities, Inc. ("JM Financial Securities"), a U.S. registered broker-dealer and member of the
Financial Industry Regulatory Authority ("FINRA") in order to conduct certain business in the United States in reliance on the exemption from U.S. broker-dealer registration provided by Rule 15a-6, promulgated under the U.S.
Securities Exchange Act of 1934 (the "Exchange Act"), as amended, and as interpreted by the staff of the U.S. Securities and Exchange Commission ("SEC") (together "Rule 15a-6").
This research report is distributed in the United States by JM Financial Securities in compliance with Rule 15a-6, and as a "third party research report" for purposes of FINRA Rule 2241. In compliance with Rule 15a-6(a)(3) this
research report is distributed only to "major U.S. institutional investors" as defined in Rule 15a-6 and is not intended for use by any person or entity that is not a major U.S. institutional investor. If you have received a copy of this
research report and are not a major U.S. institutional investor, you are instructed not to read, rely on, or reproduce the contents hereof, and to destroy this research or return it to JM Financial Institutional Securities or to JM
Financial Securities.
This research report is a product of JM Financial Institutional Securities, which is the employer of the research analyst(s) solely responsible for its content. The research analyst(s) preparing this research report is/are resident
outside the United States and are not associated persons or employees of any U.S. registered broker-dealer. Therefore, the analyst(s) are not subject to supervision by a U.S. broker-dealer, or otherwise required to satisfy the
regulatory licensing requirements of FINRA and may not be subject to the Rule 2241 restrictions on communications with a subject company, public appearances and trading securities held by a research analyst account.
JM Financial Institutional Securities only accepts orders from major U.S. institutional investors. Pursuant to its agreement with JM Financial Institutional Securities, JM Financial Securities effects the transactions for major U.S.
institutional investors. Major U.S. institutional investors may place orders with JM Financial Institutional Securities directly, or through JM Financial Securities, in the securities discussed in this research report.
Additional disclosure only for U.K. persons: Neither JM Financial Institutional Securities nor any of its affiliates is authorised in the United Kingdom (U.K.) by the Financial Conduct Authority. As a result, this report is for
distribution only to persons who (i) have professional experience in matters relating to investments falling within Article 19(5) of the Financial Services and Markets Act 2000 (Financial Promotion) Order 2005 (as amended, the
"Financial Promotion Order"), (ii) are persons falling within Article 49(2)(a) to (d) ("high net worth companies, unincorporated associations etc.") of the Financial Promotion Order, (iii) are outside the United Kingdom, or (iv) are
persons to whom an invitation or inducement to engage in investment activity (within the meaning of section 21 of the Financial Services and Markets Act 2000) in connection with the matters to which this report relates may
otherwise lawfully be communicated or caused to be communicated (all such persons together being referred to as "relevant persons"). This report is directed only at relevant persons and must not be acted on or relied on by
persons who are not relevant persons. Any investment or investment activity to which this report relates is available only to relevant persons and will be engaged in only with relevant persons.
Additional disclosure only for Canadian persons: This report is not, and under no circumstances is to be construed as, an advertisement or a public offering of the securities described herein in Canada or any province or territory
thereof. Under no circumstances is this report to be construed as an offer to sell securities or as a solicitation of an offer to buy securities in any jurisdiction of Canada. Any offer or sale of the securities described herein in
Canada will be made only under an exemption from the requirements to file a prospectus with the relevant Canadian securities regulators and only by a dealer properly registered under applicable securities laws or, alternatively,
pursuant to an exemption from the registration requirement in the relevant province or territory of Canada in which such offer or sale is made. This report is not, and under no circumstances is it to be construed as, a prospectus
or an offering memorandum. No securities commission or similar regulatory authority in Canada has reviewed or in any way passed upon these materials, the information contained herein or the merits of the securities described
herein and any representation to the contrary is an offence. If you are located in Canada, this report has been made available to you based on your representation that you are an “accredited investor” as such term is defined in
National Instrument 45-106 Prospectus Exemptions and a “permitted client” as such term is defined in National Instrument 31-103 Registration Requirements, Exemptions and Ongoing Registrant Obligations. Under no
circumstances is the information contained herein to be construed as investment advice in any province or territory of Canada nor should it be construed as being tailored to the needs of the recipient. Canadian recipients are
advised that JM Financial Securities, Inc., JM Financial Institutional Securities Limited, their affiliates and authorized agents are not responsible for, nor do they accept, any liability whatsoever for any direct or consequential loss
arising from any use of this research report or the information contained herein.
27