loco-radio designing high-density augmented reality audio...
TRANSCRIPT
1
Loco-Radio – Designing High-Density Augmented Reality
Audio Browsers
by
Wu-Hsi Li
S.M., Media Arts and Sciences, MIT (2008) M.S. & B.S., Electrical Engineering, National Taiwan University (2004, 2002)
Submitted to the Program in Media Arts and Sciences
School of Architecture and Planning in partial fulfillment of the requirements for the degree of
Doctor of Philosophy in Media Arts and Sciences
at the
MASSACHUSETTS INSTITUTE OF TECHNOLOGY
February 2014
© Massachusetts Institute of Technology 2013. All rights reserved.
Author........……………………………………………………………….…...………………………….….. Wu-Hsi Li
Program in Media Arts and Sciences September 30, 2013
Certified by……………………………………………………………….…...………………………….….. Christopher Schmandt
Principal Research Scientist, MIT Media Lab Thesis Supervisor
Accepted by………………………...…………………………………………………………….……….…. Pattie Maes
Associate Academic Head, Professor of Media Arts and Sciences

2
3
Loco-Radio – Designing High-Density
Augmented Reality Audio Browsers
by
Wu-Hsi Li
Submitted to the Program in Media Arts and Sciences,
School of Architecture and Planning on September 30, 2013
in partial fulfillment of the requirements for the degree of
Doctor of Philosophy in Media Arts and Sciences
Abstract
In this dissertation research, we explore ways of using audio on AR applications, as
it is especially suitable for mobile users when their eyes and hands are not necessarily
available and they have limited attention capacity. While most previous mobile AR audio
systems were mostly tested in sparse audio maps, we want to create a system that can
be challenged by a city load of information.
We design and implement Loco-Radio, a mobile augmented reality audio browsing
system. It uses GPS and a geomagnetic-based sensing module to provide outdoor and
indoor location sensing. To enhance the audio browsing experience in high-density
spatialized audio environments, we introduce auditory spatial scaling, which enables
users or the system to adjust the spatial density of perceived sounds based on context.
The audio comes from a custom geo-tagged audio database, which contains a set of
channels designed for different use cases. In the first scenario, iconic music is assigned to
represent restaurants. As users move in the city, they encounter a series of songs and
the perception enhances their awareness of the numbers, styles, and locations of
restaurants. It is tested by car drivers, bikers, and pedestrians. In the second scenario,
audio clips of media lab research demos are tagged around the building. As a result,
users can participate in an augmented reality audio lab tours. We argue that AR audio
systems should consider not only where users are but also how they move. Discussion
will be focus on strategies of using spatial audio in high-density audio environments and
how they should change in different moving modes.
Thesis Supervisor: Christopher Schmandt
Title: Principal Research Scientist, MIT Media Lab

4
5
Doctoral Dissertation Committee
Advisor:____________________________________________________________
Chris Schmandt
Principal Research Scientist
MIT Media Lab
Reader:_____________________________________________________________
Barry L. Vercoe
Professor Emeritus of Media Arts and Sciences
MIT Media Lab
Reader:_____________________________________________________________
Joseph A. Paradiso
Associate Professor of Media Arts and Sciences
Co-Director, Think That Think Consortium
MIT Media Lab

6
7
Acknowledgements
What a journey it has been! Thank you to everyone who has given me support,
insight, and pleasure. In particular:
Barry (Vercoe), my mentor, for accepting me into the Media Lab, for your invaluable
advice and ultimate support, and for seeing me as a great artist and believing that I
will make spectacular works.
Chris (Schmandt), my second mentor, for helping me through the finish line, for your
understanding of my sometimes unorganized life, for all the stories you have shared,
and for your insightful critiques.
My two advisors are my sense and sensibility. They helped the two selves in me
grow at the same time.
My third thesis committee, Joe (Paradiso), for your great support, feedback and
encouragement.
Special thanks to Nanwei (Gong), for offering great help in making location badges
and fixing my coffee roaster.
Linda (Peterson) and her office, lab directors Frank (Moss) and Joi (Ito), for your
great support.
Music Mind Machine Group: Anna (Huang), Mihir (Sarkar), Judy (Brown), Dale
(Joachim), Owen (Meyers), Kelly (Snook), Brian (Whitman), Ricardo (Garcia)
Speech & Mobility Group: Drew (Harry), Charlie (DeTar), Jaewoo (Chung), Andrea
(Colaço), Matt (Donahoe), Misha (Sra), Sinchan (Banerjee), Sujoy (Chowdhury),
Cindy Hsin-Liu (Kao)
My general exam and master's thesis committee members: Pattie (Maes), Mitch
(Resnick), Tod (Machover). Other incredible teachers, especially Judith (Donath),
Rosalind (Picard), Chris (Csikszentmihalyi), Henry (Holtman), Marie-Jose
(Montpetit)
8
Sandy (Sener), Kristin (Hall), Danielle (Nadeau), Paula (Aguilera), Will (Glesnes),
Peter (Planz) and the Necsys office, Greg (Tucker) and the facilities team, for the
help and support. Amna (Carreiro), for sharing good coffee times with me
Friends in Media Lab: Edward (Shen), James Chao-Ming (Teng), Jackie Chia-Hsun
(Lee), Chaochi (Chang), Michael Chia-Liang (Lin), Nanwei (Gong), Dori (Lin),
Chih-Chao (Chuang), Peggy (Chi), Nan (Chao), Gershon (Dublon), Nicholas (Joliat),
Noah (Vawter), Santiago (Alfaro), Dawei (Shen), Ben (Waber), Aaron (Zinman), ML
Softball Team
Friends in Boston: Cheng-Yang (Lee), Jin-Li (Pai), Fly Yi-Hsiang (Chao), Cuba
Hung-Yang (Chien), Hsing-Chih (Lee), Ming-Jen (Hsueh), Li-Jin (Chen), Tzu-Ming
(Liu), Tsung-Han (Tsai), Kevin Jeremiah (Tu), Chu-Lan (Kao), Yu-Chih (Ko), Lisa
(Kang), Daphne (Chang), Adrian (Yeng), Mei-Feng (Tsai),
Friends in other cities: Leo (Tsai), Keng-Ming (Liu), Ho-Hsiang (Wu), Millie (Lin),
Jeremy (Liao)
Simon's Coffee Store and Simon Too, where I wrote more than half of this thesis.
Jason, the coolest barista in the whole world, who is like the evil twin brother to me
And, most importantly, my dad and mom, thank you for everything. I won't be here
without you. My older brother Wu-Cheng (Li), for being the role model for me since
childhood, for offering resource and advise. My dog (lulu), who was the best dog ever.
My cat (meow-meow). My in laws: dad, mom, and brother Lien-Sheng.
Yu-Hsien, for your love and affection, for the sacrifices you have made to live
together in Boston, for the warm and comfort you gave me, and for the colors you
have brought to my life. The future is ours to paint.
9
Table of Contents
1 Introduction ................................................................................................ 17
1.1 The Sensory Experience in Everyday Mobility......................................................... 18
1.2 From Mobility to Augmented Reality ........................................................................... 21
1.3 Everyday Listening .............................................................................................................. 21
1.4 Scale and Scaling .................................................................................................................. 23
1.5 Organization of the Thesis ............................................................................................... 25
2 Background and Related Work ............................................................ 27
2.1 Spatial Audio .......................................................................................................................... 27
2.2 Mobile Augmented Reality Audio .................................................................................. 40
2.3 Evaluate the Uses of 3D Spatial Audio ......................................................................... 55
2.4 Summary ................................................................................................................................. 60
3 Auditory Spatial Scaling .......................................................................... 63
3.1 Introduction ........................................................................................................................... 63
3.2 Auditory Zooming ................................................................................................................ 63
3.3 Design Principles ................................................................................................................. 66
3.4 The First Iteration - Musicscape .................................................................................... 66
3.5 The Second Iteration - Musicscape Mobile ................................................................ 74
3.6 The Third Iteration.............................................................................................................. 79
3.7 Designing for Scale .............................................................................................................. 81
4 Loco-Radio Outdoor ................................................................................. 87
4.1 Introduction ........................................................................................................................... 87
4.2 Audio Map ............................................................................................................................... 88
4.3 Designing Scale for Mobility ............................................................................................ 89
4.4 Design and Implementation ............................................................................................ 94
4.5 Audio Processing ............................................................................................................... 100
4.6 Evaluation Design .............................................................................................................. 101
4.7 Evaluation Data .................................................................................................................. 102
4.8 User Feedback ..................................................................................................................... 112
10
4.9 Discussion ............................................................................................................................. 118
5 Loco-Radio Indoor ................................................................................. 123
5.1 Introduction ......................................................................................................................... 123
5.2 Compass Badge ................................................................................................................... 124
5.4 Audio Map - Media Lab AR Audio Tour ..................................................................... 127
5.3 Design and Implementation .......................................................................................... 127
5.5 Evaluation ............................................................................................................................. 129
5.6 Discussion ............................................................................................................................. 131
6 Conclusion ................................................................................................ 133
6.1 Contribution......................................................................................................................... 135
6.2 Future Works ...................................................................................................................... 135
Reference ....................................................................................................... 137
11
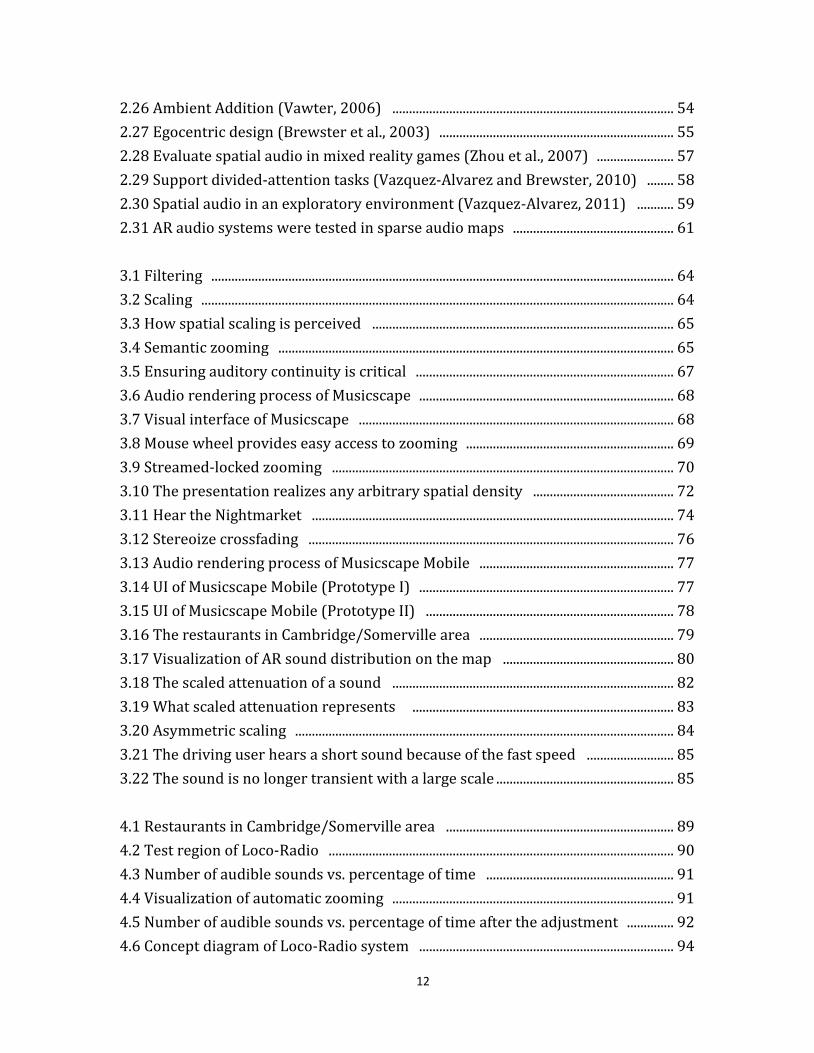
List of Figures
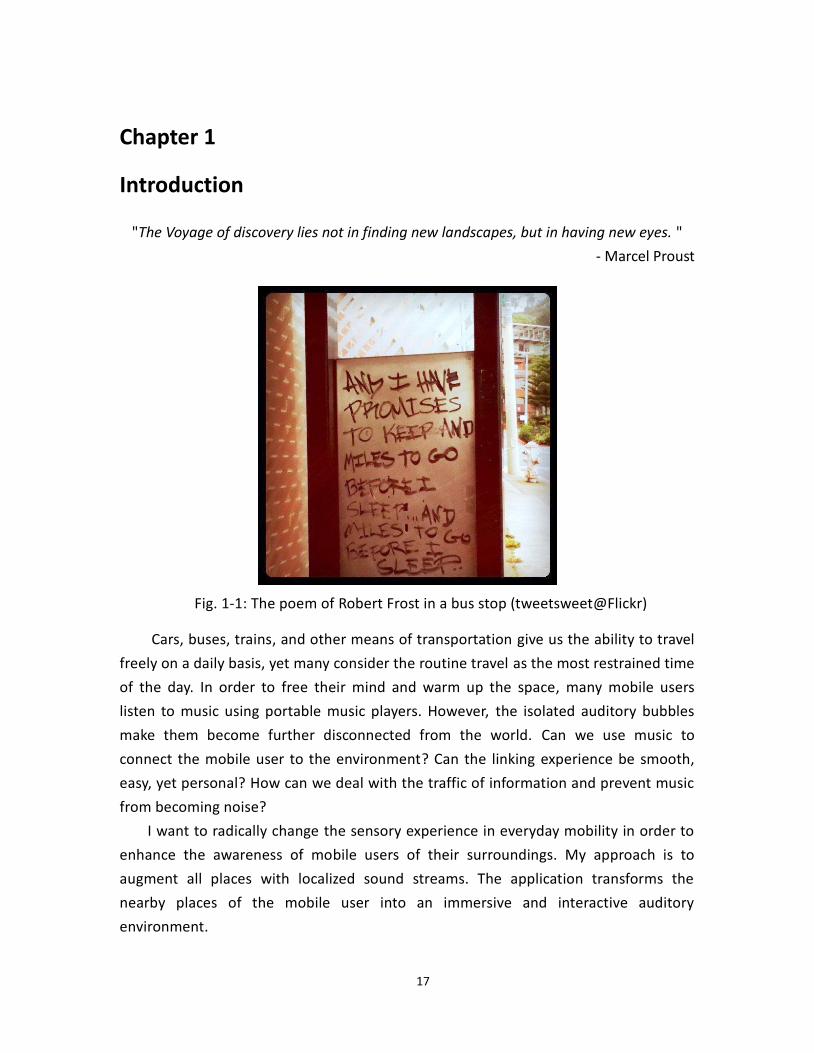
1.1 The poem of Robert Frost in a bus stop (tweetsweet@Flickr) ............................... 17
1.2 City walk (Holslag, 1998) ........................................................................................................ 19
1.3 My scooter in Boston ................................................................................................................ 20
1.4 A room with a view (Houben et al., 2003) ........................................................................ 21
1.5 Everyday listening (Gaver, 1993) ........................................................................................ 22
1.6 The scale describes the virtual physics of sound ........................................................... 24
1.7 Visualizations of how far sounds propagate .................................................................... 25
2.1 The concept of spatial audio .................................................................................................. 27
2.2 The cone of confusion ............................................................................................................... 29
2.3 Shoulder mounted stereo speakers in Nomadic Radio (Sawhney, 1998) ............ 31
2.4 Virtual acoustic display system (Wenzel et al., 1988) ................................................... 33
2.5 Dynamic Soundscape (Kobayashi, 1996) .......................................................................... 35
2.6 Braided audio (Maher, 1998) ................................................................................................ 36
2.7 Original hallway (Maher, 1998) ........................................................................................... 37
2.8 Modified hallway (Maher, 1998) .......................................................................................... 37
2.9 Navigating in room (Maher, 1998) ...................................................................................... 38
2.10 Lens effect (Mahler, 1998) ................................................................................................... 38
2.11 Sonic Browser (Brazil et al., 2002) ................................................................................... 39
2.12 Reality-virtuality continuum (Milgram et al., 1995) .................................................. 40
2.13 Current wireless-based positioning systems (Liu et al., 2011) ............................. 43
2.14 Location badge in Compass Badge (Chung, 2012) ..................................................... 44
2.15 The scalable presentation (Sawhney and Schmandt, 2000) ................................... 46
2.16 Nomadic Radio (Sawhney and Schmandt, 2000) ........................................................ 46
2.17 Aura. The stuff around the stuff around you (Symons, 2004) ............................... 48
2.18 Sound garden system(Vazquez-Alvarez et al., 2011) ................................................ 49
2.19 Two levels of audio feedback (Vazquez-Alvarez et al., 2011) ................................ 49
2.20 InTheMix (Chapin et al., 2000) ........................................................................................... 50
2.21 Audio Spotlight (Pompei, 1999) ........................................................................................ 50
2.22 Triple Audio Spotlight (Vercoe, 2003) ............................................................................ 51
2.23 Sonic Graffiti (Lee, 2007) ...................................................................................................... 52
2.24 Sound Mapping (Mott et al., 1998) ................................................................................... 53
2.25 Soundbike (Thompson, 2006) ............................................................................................ 53
12
2.26 Ambient Addition (Vawter, 2006) .................................................................................... 54
2.27 Egocentric design (Brewster et al., 2003) ...................................................................... 55
2.28 Evaluate spatial audio in mixed reality games (Zhou et al., 2007) ....................... 57
2.29 Support divided-attention tasks (Vazquez-Alvarez and Brewster, 2010) ........ 58
2.30 Spatial audio in an exploratory environment (Vazquez-Alvarez, 2011) ........... 59
2.31 AR audio systems were tested in sparse audio maps ................................................ 61
3.1 Filtering .......................................................................................................................................... 64
3.2 Scaling ............................................................................................................................................. 64
3.3 How spatial scaling is perceived .......................................................................................... 65
3.4 Semantic zooming ...................................................................................................................... 65
3.5 Ensuring auditory continuity is critical ............................................................................. 67
3.6 Audio rendering process of Musicscape ............................................................................ 68
3.7 Visual interface of Musicscape .............................................................................................. 68
3.8 Mouse wheel provides easy access to zooming .............................................................. 69
3.9 Streamed-locked zooming ...................................................................................................... 70
3.10 The presentation realizes any arbitrary spatial density .......................................... 72
3.11 Hear the Nightmarket ............................................................................................................ 74
3.12 Stereoize crossfading ............................................................................................................. 76
3.13 Audio rendering process of Musicscape Mobile .......................................................... 77
3.14 UI of Musicscape Mobile (Prototype I) ............................................................................ 77
3.15 UI of Musicscape Mobile (Prototype II) .......................................................................... 78
3.16 The restaurants in Cambridge/Somerville area .......................................................... 79
3.17 Visualization of AR sound distribution on the map ................................................... 80
3.18 The scaled attenuation of a sound .................................................................................... 82
3.19 What scaled attenuation represents .............................................................................. 83
3.20 Asymmetric scaling ................................................................................................................. 84
3.21 The driving user hears a short sound because of the fast speed .......................... 85
3.22 The sound is no longer transient with a large scale ..................................................... 85
4.1 Restaurants in Cambridge/Somerville area .................................................................... 89
4.2 Test region of Loco-Radio ....................................................................................................... 90
4.3 Number of audible sounds vs. percentage of time ........................................................ 91
4.4 Visualization of automatic zooming .................................................................................... 91
4.5 Number of audible sounds vs. percentage of time after the adjustment .............. 92
4.6 Concept diagram of Loco-Radio system ............................................................................ 94
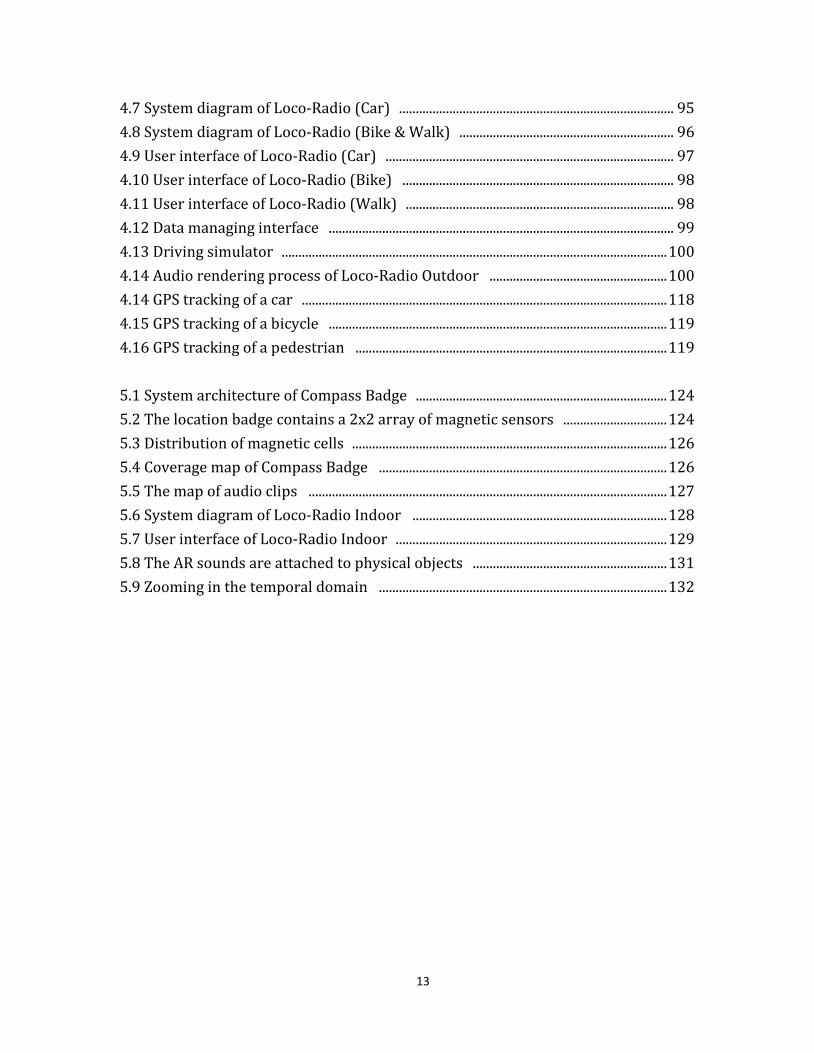
13
4.7 System diagram of Loco-Radio (Car) .................................................................................. 95
4.8 System diagram of Loco-Radio (Bike & Walk) ................................................................ 96
4.9 User interface of Loco-Radio (Car) ...................................................................................... 97
4.10 User interface of Loco-Radio (Bike) ................................................................................. 98
4.11 User interface of Loco-Radio (Walk) ................................................................................ 98
4.12 Data managing interface ....................................................................................................... 99
4.13 Driving simulator ................................................................................................................... 100
4.14 Audio rendering process of Loco-Radio Outdoor ..................................................... 100
4.14 GPS tracking of a car ............................................................................................................. 118
4.15 GPS tracking of a bicycle ..................................................................................................... 119
4.16 GPS tracking of a pedestrian ............................................................................................. 119
5.1 System architecture of Compass Badge ........................................................................... 124
5.2 The location badge contains a 2x2 array of magnetic sensors ............................... 124
5.3 Distribution of magnetic cells .............................................................................................. 126
5.4 Coverage map of Compass Badge ...................................................................................... 126
5.5 The map of audio clips ........................................................................................................... 127
5.6 System diagram of Loco-Radio Indoor ............................................................................ 128
5.7 User interface of Loco-Radio Indoor ................................................................................. 129
5.8 The AR sounds are attached to physical objects .......................................................... 131
5.9 Zooming in the temporal domain ...................................................................................... 132

14
15
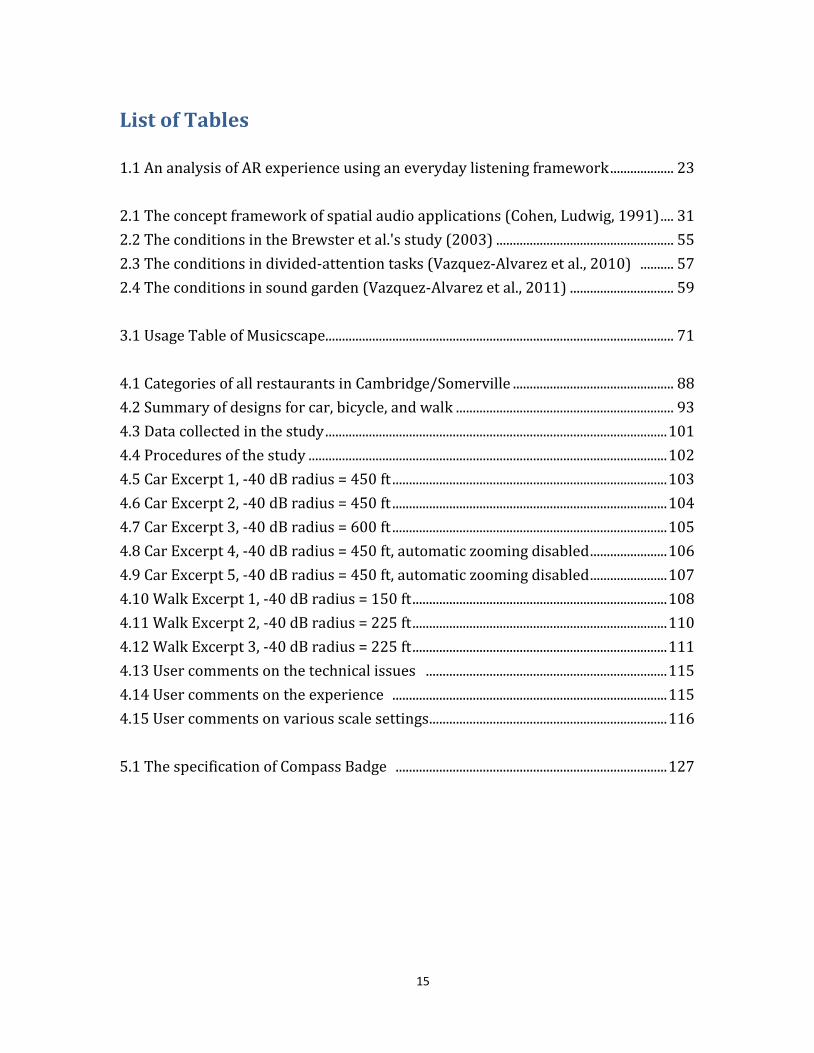
List of Tables
1.1 An analysis of AR experience using an everyday listening framework ................... 23
2.1 The concept framework of spatial audio applications (Cohen, Ludwig, 1991) .... 31
2.2 The conditions in the Brewster et al.'s study (2003) ..................................................... 55
2.3 The conditions in divided-attention tasks (Vazquez-Alvarez et al., 2010) .......... 57
2.4 The conditions in sound garden (Vazquez-Alvarez et al., 2011) ............................... 59
3.1 Usage Table of Musicscape........................................................................................................ 71
4.1 Categories of all restaurants in Cambridge/Somerville ................................................ 88
4.2 Summary of designs for car, bicycle, and walk ................................................................. 93
4.3 Data collected in the study ...................................................................................................... 101
4.4 Procedures of the study ........................................................................................................... 102
4.5 Car Excerpt 1, -40 dB radius = 450 ft .................................................................................. 103
4.6 Car Excerpt 2, -40 dB radius = 450 ft .................................................................................. 104
4.7 Car Excerpt 3, -40 dB radius = 600 ft .................................................................................. 105
4.8 Car Excerpt 4, -40 dB radius = 450 ft, automatic zooming disabled ....................... 106
4.9 Car Excerpt 5, -40 dB radius = 450 ft, automatic zooming disabled ....................... 107
4.10 Walk Excerpt 1, -40 dB radius = 150 ft ............................................................................ 108
4.11 Walk Excerpt 2, -40 dB radius = 225 ft ............................................................................ 110
4.12 Walk Excerpt 3, -40 dB radius = 225 ft ............................................................................ 111
4.13 User comments on the technical issues ........................................................................ 115
4.14 User comments on the experience .................................................................................. 115
4.15 User comments on various scale settings ....................................................................... 116
5.1 The specification of Compass Badge ................................................................................. 127

16
17
Chapter 1
Introduction
"The Voyage of discovery lies not in finding new landscapes, but in having new eyes. "
- Marcel Proust
Fig. 1-1: The poem of Robert Frost in a bus stop (tweetsweet@Flickr)
Cars, buses, trains, and other means of transportation give us the ability to travel
freely on a daily basis, yet many consider the routine travel as the most restrained time
of the day. In order to free their mind and warm up the space, many mobile users
listen to music using portable music players. However, the isolated auditory bubbles
make them become further disconnected from the world. Can we use music to
connect the mobile user to the environment? Can the linking experience be smooth,
easy, yet personal? How can we deal with the traffic of information and prevent music
from becoming noise?
I want to radically change the sensory experience in everyday mobility in order to
enhance the awareness of mobile users of their surroundings. My approach is to
augment all places with localized sound streams. The application transforms the
nearby places of the mobile user into an immersive and interactive auditory
environment.
18
The system needs to render numerous audio streams simultaneously, and it is
essential for the AR audio environment for the following reasons: First, I want the
listener to pay less attention to the qualities of individual sounds. Playing multiple
streams at the same time can naturally place the user in the scenario of everyday
listening. Second, the listener tends to interpret temporal properties of sound as
events. Playing sound streams continuously and simultaneously can avoid distractions
and confusions for the listener. Most of all, hearing more streams at the same time
helps the listener to accumulate high-level information and perceive the environment
as a whole.
However, simultaneous sounds can be obtrusive and distracting if the system is not
sensing and adapting to the context of the user. For instance, an AR audio system should
consider not only where the user is but also how he moves. How does the environment
support the user to focus or to explore in mobile situations? How does the interface
enable the user to flexibly manage the cognitive load? Moreover, another challenge is to
create a smooth yet informative auditory experience while dealing with a large amount
of information with geographic constraints. How does the AR environment adapt to an
extremely uneven distribution of sound streams?
To address the challenges, I propose a design framework based on scale. Since
scale defines the relations between space and sound, it can impact user behavior and
transform the auditory experience. The designs of scale will be discussed in three
dimensions: number, distribution, and time. I introduce auditory spatial scaling. The
technique is designed to stretch the scale dynamically, which enables the user or
system to adjust the spatial density of perceived sounds according to the context.
Previous AR audio applications were mostly based on GPS. They were designed for
city/street scale and were tested in sparse audio maps. In this dissertation research,
we design and implement Loco-Radio, a mobile AR audio browsing system. It uses GPS
and a geomagnetic-based sensing module to provide outdoor and indoor location
sensing. The system is designed for three different modes of mobility.
Two geo-tagged audio databases are created. In the first scenario, iconic music is
assigned to represent restaurants. As users move in the city, they encounter a series of
music and the perception enhances their awareness of the numbers, styles, and
locations of restaurants. It is tested by car drivers, bikers, and pedestrians. In the
second scenario, audio clips of media lab research demos are tagged around the
building. As a result, users can participate in an AR auditory lab tour. The indoor system
will integrate with the geo-magnetic based location-sensing module developed by
Chung (2012).
19
1.1 The Sensory Experience in Everyday Mobility
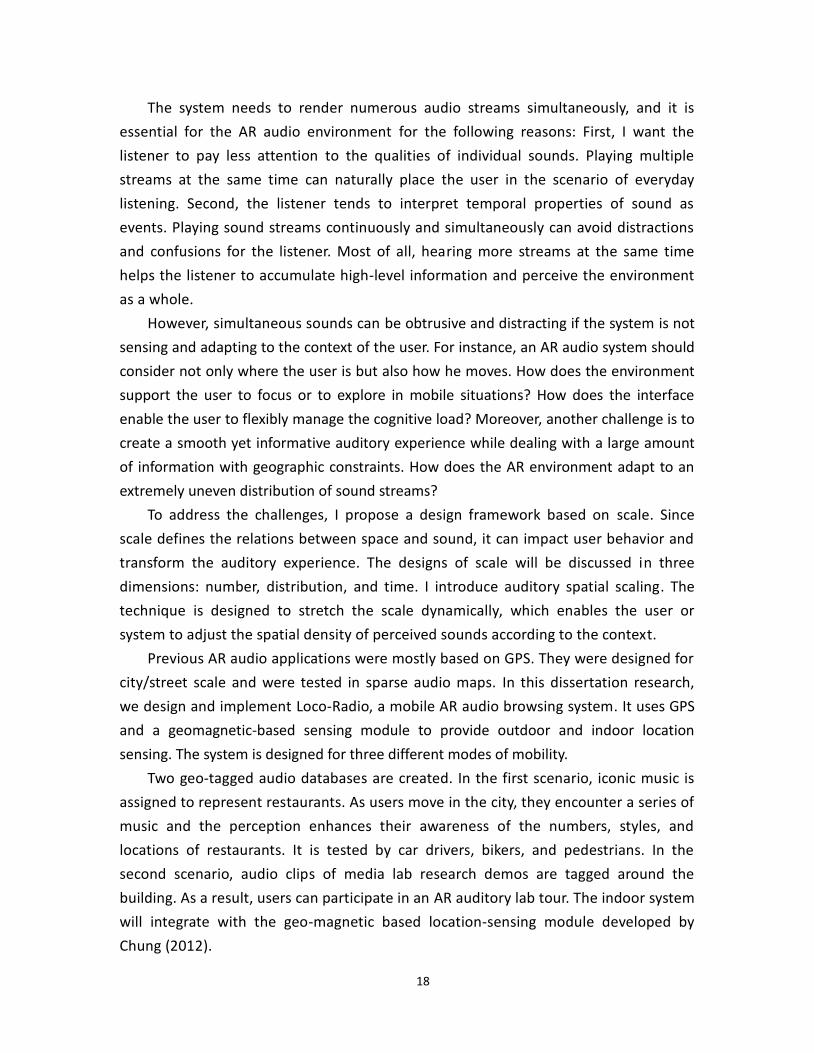
1.1.1 Walk
Walking is an intimate way for exploring a place. It is the slowest mode of
transportation; it gives the pedestrian the most time to read the surroundings. It also
carries fewer constraints than driving or riding a bike, which makes walking more
interactive. For instance, the pedestrian can usually walk at any comfortable pace, and
can stop when attractions appear. If driving is like watching a movie, then walking is
like reading a book. Moreover, pedestrians are generally more flexible in routing.
Drivers need to make split second decisions from time to time and thus it is often
preferred to use a GPS navigator or plan the route in advance. For pedestrians, making
a wrong turn or two seems to be acceptable since it may lead to discovery. Getting lost
a few times can be fun since it may lead to serendipities. Most of all, walking provides
the best chance for a pedestrian to take advantage of all senses. There is no windshield
or engine noise. It is hard to find a more intimate connection between a person and
the environment than one's feet stepping on the ground.
Fig. 1-1: "City walk" (Holslag, 1998)
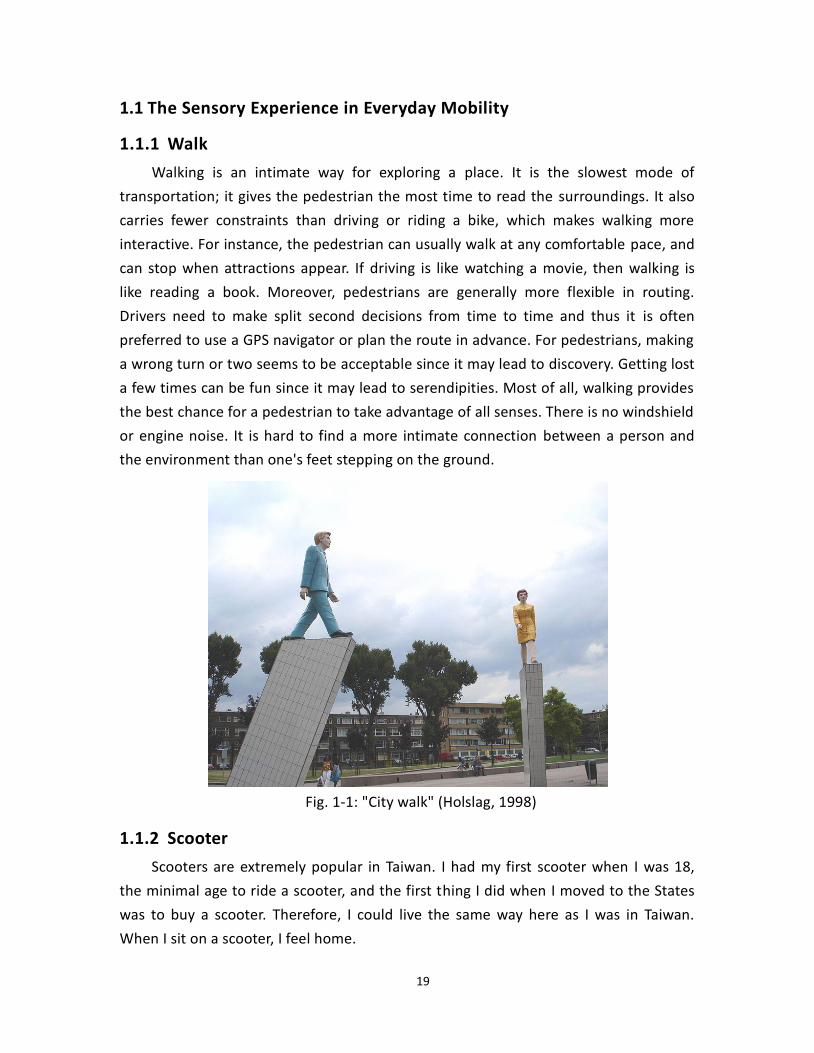
1.1.2 Scooter
Scooters are extremely popular in Taiwan. I had my first scooter when I was 18,
the minimal age to ride a scooter, and the first thing I did when I moved to the States
was to buy a scooter. Therefore, I could live the same way here as I was in Taiwan.
When I sit on a scooter, I feel home.
20
A scooter can take me almost as far as a car can, but the sensory experience it
creates is close to a bicycle. My senses are exposed to the surroundings on a scooter:
I can feel the wind blow. I can smell the food when I pass by a restaurant or vendor.
Most of all, I can hear the surroundings during the ride. The exposed senses even make
the scooter ride more social. I still remember a scene during one of those scooter road
trips in college: when the scooters stopped in front of the red light, we all started
chatting, joking around, and laughing until the light turned green. It seemed that a red
light was more anticipating than a green light.
Fig. 1-3: My scooter in Boston
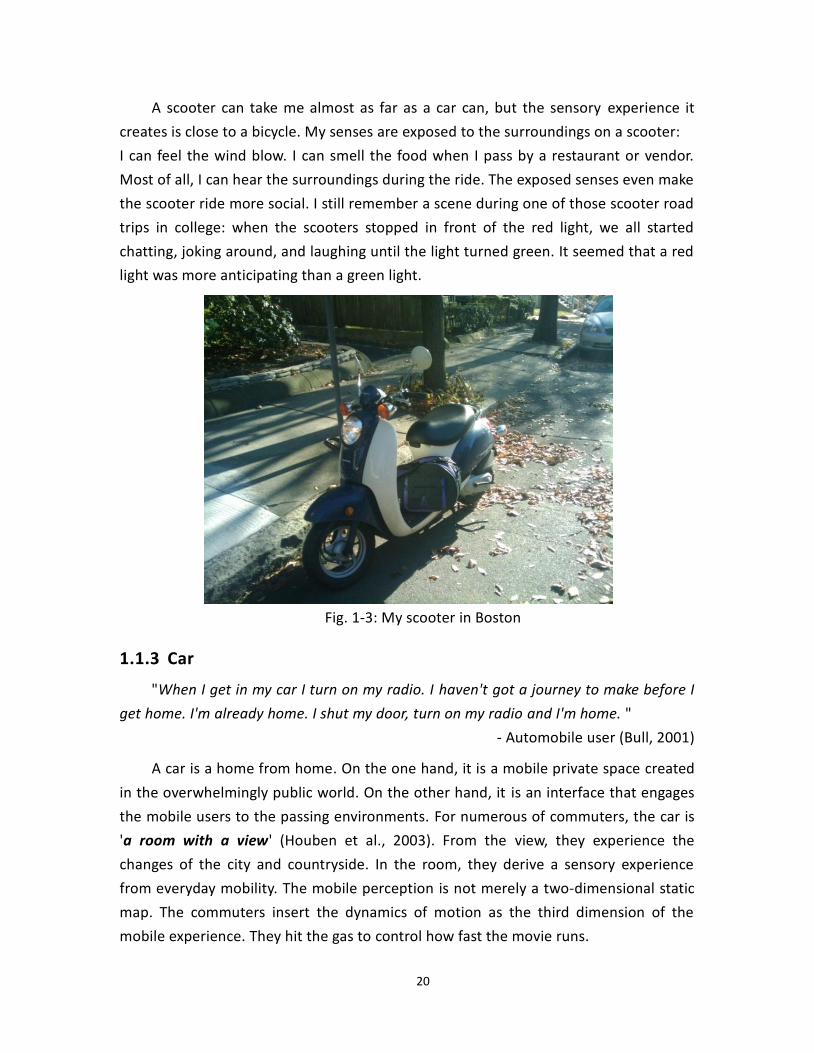
1.1.3 Car
"When I get in my car I turn on my radio. I haven't got a journey to make before I
get home. I'm already home. I shut my door, turn on my radio and I'm home. "
- Automobile user (Bull, 2001)
A car is a home from home. On the one hand, it is a mobile private space created
in the overwhelmingly public world. On the other hand, it is an interface that engages
the mobile users to the passing environments. For numerous of commuters, the car is
'a room with a view' (Houben et al., 2003). From the view, they experience the
changes of the city and countryside. In the room, they derive a sensory experience
from everyday mobility. The mobile perception is not merely a two-dimensional static
map. The commuters insert the dynamics of motion as the third dimension of the
mobile experience. They hit the gas to control how fast the movie runs.
21
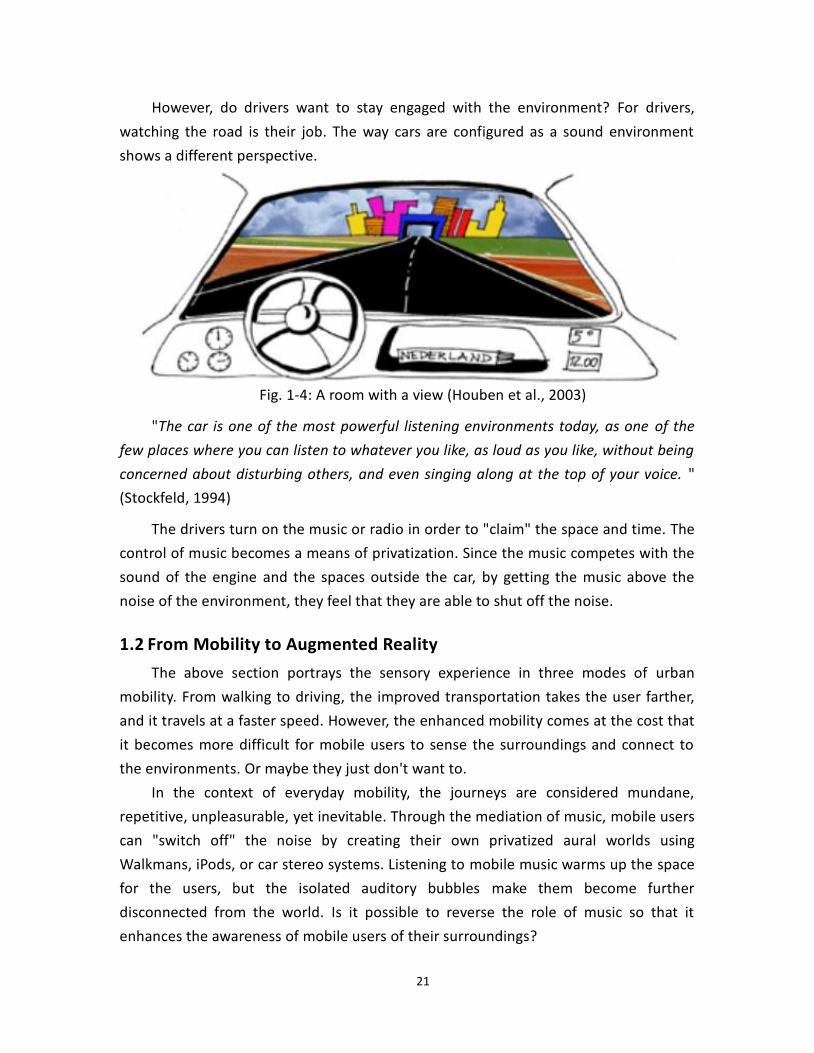
However, do drivers want to stay engaged with the environment? For drivers,
watching the road is their job. The way cars are configured as a sound environment
shows a different perspective.
Fig. 1-4: A room with a view (Houben et al., 2003)
"The car is one of the most powerful listening environments today, as one of the
few places where you can listen to whatever you like, as loud as you like, without being
concerned about disturbing others, and even singing along at the top of your voice. "
(Stockfeld, 1994)
The drivers turn on the music or radio in order to "claim" the space and time. The
control of music becomes a means of privatization. Since the music competes with the
sound of the engine and the spaces outside the car, by getting the music above the
noise of the environment, they feel that they are able to shut off the noise.
1.2 From Mobility to Augmented Reality
The above section portrays the sensory experience in three modes of urban
mobility. From walking to driving, the improved transportation takes the user farther,
and it travels at a faster speed. However, the enhanced mobility comes at the cost that
it becomes more difficult for mobile users to sense the surroundings and connect to
the environments. Or maybe they just don't want to.
In the context of everyday mobility, the journeys are considered mundane,
repetitive, unpleasurable, yet inevitable. Through the mediation of music, mobile users
can "switch off" the noise by creating their own privatized aural worlds using
Walkmans, iPods, or car stereo systems. Listening to mobile music warms up the space
for the users, but the isolated auditory bubbles make them become further
disconnected from the world. Is it possible to reverse the role of music so that it
enhances the awareness of mobile users of their surroundings?
22
To achieve the goal, one possible approach is to create augmented reality (AR)
audio applications. AR exploits and enhances the mobile user's surrounding context by
supplementing the real world with a virtual environment in which the user can interact
with. Sound is a proper medium for augmented information in mobile situations since
the hands and eyes of users may not be available. However, designing AR audio
environments will bring more challenges. For instance, sound can be obtrusive and
distracting if the system does not sense and react to the user’s change of context.
Therefore, it is critical for applications to be context-aware. Moreover, how can the user
perceive the environment through sounds? How can the system produce an informative
yet pleasant auditory experience? To answer these questions, we need to discuss
"everyday listening".
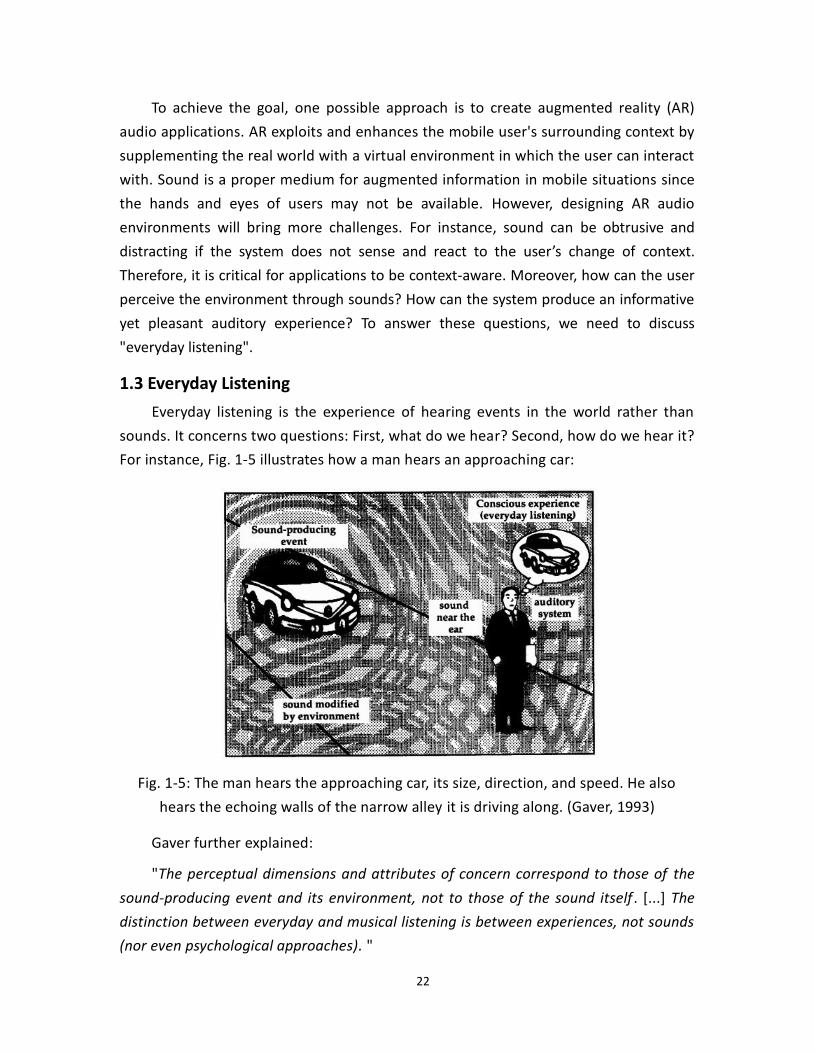
1.3 Everyday Listening
Everyday listening is the experience of hearing events in the world rather than
sounds. It concerns two questions: First, what do we hear? Second, how do we hear it?
For instance, Fig. 1-5 illustrates how a man hears an approaching car:
Fig. 1-5: The man hears the approaching car, its size, direction, and speed. He also
hears the echoing walls of the narrow alley it is driving along. (Gaver, 1993)
Gaver further explained:
"The perceptual dimensions and attributes of concern correspond to those of the
sound-producing event and its environment, not to those of the sound itself . [...] The
distinction between everyday and musical listening is between experiences, not sounds
(nor even psychological approaches). "
23
In other words, it is not about the perception of sound attributes like pitch,
loudness, duration, or timbre. Instead, everyday listening concerns (a) the source of
the sound, (b) the event that causes the sound, and (c) the environment in which the
event takes place. John Cage once used a excellent analogy to describe his perspective
of music, which is also appropriate to explain the difference between musical listening
and everyday listening:
"When I hear what we call music, it seems to me that someone is talking. And
talking about his feelings, or about his ideas of relationships. "
"But when I hear traffic, the sound of traffic —here on Sixth Avenue, for
instance—I don't have the feeling that anyone is talking. I have the feeling that sound
is acting. And I love the activity of sound. [...] I don't need sound to talk to me. "
(Cage, 1991)
AR audio is all about everyday listening. AR audio applications extend the local
environment with virtual auditory layers, and sounds are localized in order to connect
to real world objects. In this context, we can consider sound as a carrier signal that
delivers the localization cues. The listener perceives not only the sounds, but also the
location (direction and distance) of sound sources. By synthesizing the spatial cues in
sounds, the application is able to manipulate the perceived environment.
Therefore, it is essential to think from the perspective of everyday listening in
order to make AR audio more effective. Here is an example of designing using an
everyday listening framework. Assume that the goal of an AR audio system is to make
mobile users aware of the nearby places of interest. A localized sound stream is
attached to each place. Table 1-1 analyzes what the mobile user can perceive in
everyday listening:
Layer Description
Source
The layer concerns the spatial attributes of sounds. The listener
can hear the location of places. He can also sense the relative
motion when he is moving. For example, he may be approaching
or leaving the places.
Event The layer concerns the temporal properties of sounds. For
example, the beginning/ending of a stream can be used to
produce a event that indicates the opening/closing of a store.
24
However, on occasions, a good design is about how NOT to
produce temporal events. For instance, assume that there are
several nearby places. Playing these localized sounds in succession
can create confusions because the listener cannot interpret the
timing of sounds. To resolve the issue, these streams should be
played continuously and simultaneously.
Environment
During the process of decoding individual sounds, the listener also
accumulates higher-level information about the environment. For
example, since each sound stream represents a place-of-interest,
the listener knows that he has reached a downtown area when he
hears numerous sounds at the same time.
Table 1-1: An analysis of AR experience using an everyday listening framework
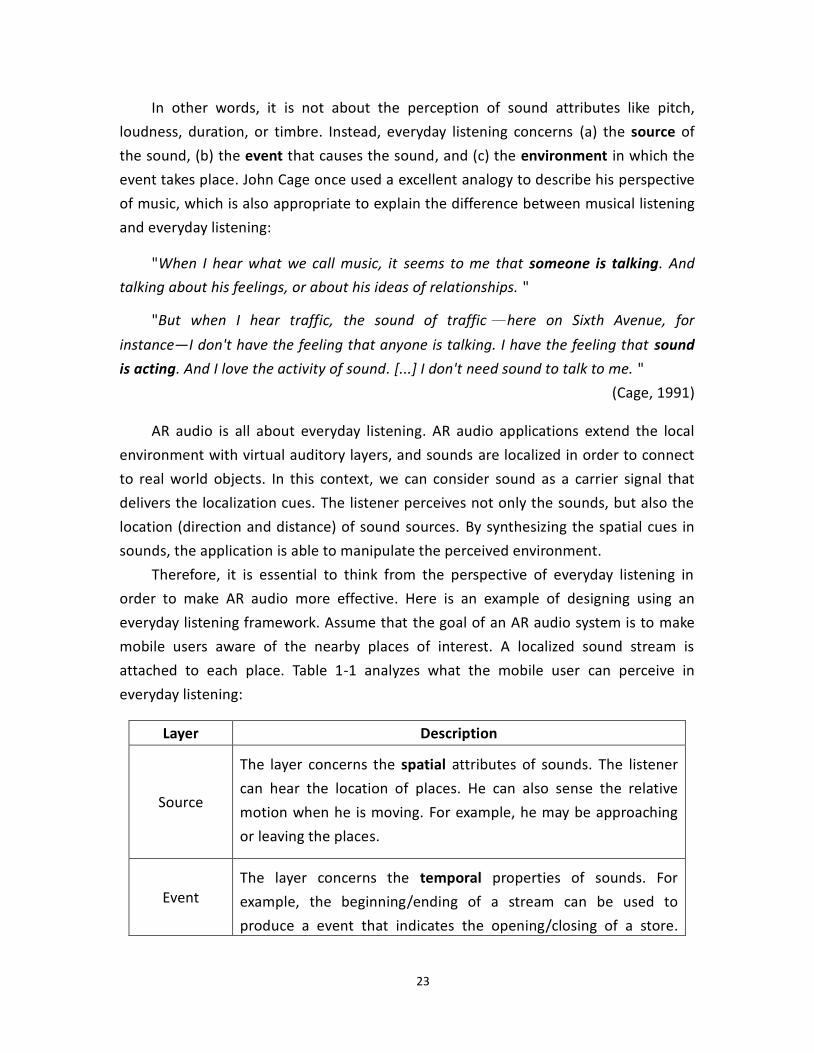
1.4 Scale and Scaling
Scale is the focus of the dissertation. AR audio environments synthesize and
superimpose virtual auditory layers on top of the real environment. To some extent, the
auditory space carries design constraints as it inherits the metaphor of real world space,
but it is still possible to alter the underlying physics. For instance, we can reduce the
sound attenuation to make sound propagate farther, or vice versa. In other words, we
can determine an arbitrary scale between space and sound, as seen in Fig. 1-6.
Fig. 1-6: The scale describes the virtual physics of sound in the AR environment.
-6db
-12db
-18db
?
25
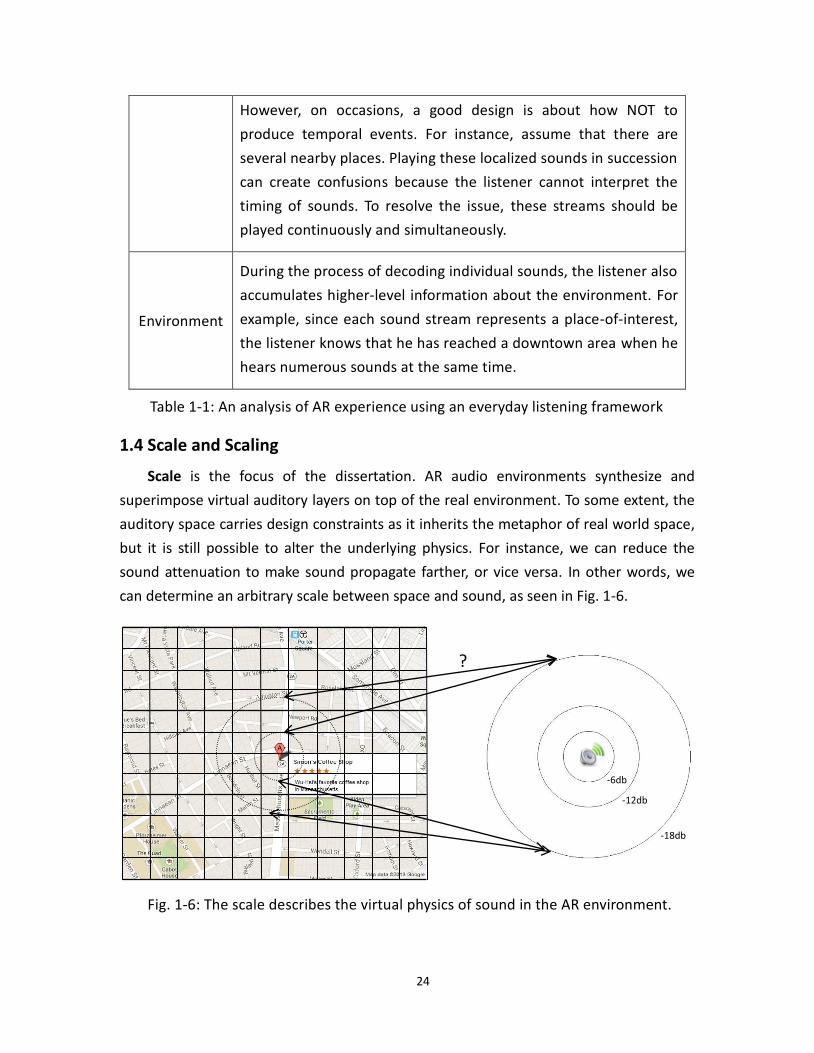
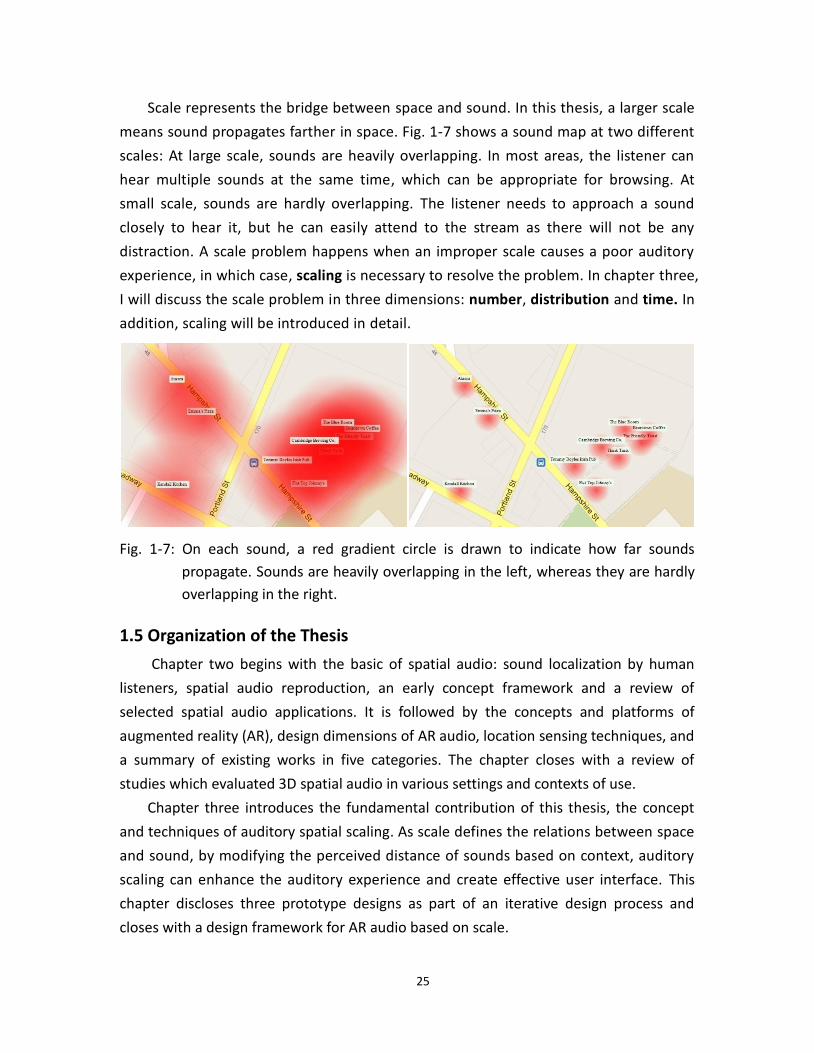
Scale represents the bridge between space and sound. In this thesis, a larger scale
means sound propagates farther in space. Fig. 1-7 shows a sound map at two different
scales: At large scale, sounds are heavily overlapping. In most areas, the listener can
hear multiple sounds at the same time, which can be appropriate for browsing. At
small scale, sounds are hardly overlapping. The listener needs to approach a sound
closely to hear it, but he can easily attend to the stream as there will not be any
distraction. A scale problem happens when an improper scale causes a poor auditory
experience, in which case, scaling is necessary to resolve the problem. In chapter three,
I will discuss the scale problem in three dimensions: number, distribution and time. In
addition, scaling will be introduced in detail.
Fig. 1-7: On each sound, a red gradient circle is drawn to indicate how far sounds
propagate. Sounds are heavily overlapping in the left, whereas they are hardly
overlapping in the right.
1.5 Organization of the Thesis
Chapter two begins with the basic of spatial audio: sound localization by human
listeners, spatial audio reproduction, an early concept framework and a review of
selected spatial audio applications. It is followed by the concepts and platforms of
augmented reality (AR), design dimensions of AR audio, location sensing techniques, and
a summary of existing works in five categories. The chapter closes with a review of
studies which evaluated 3D spatial audio in various settings and contexts of use.
Chapter three introduces the fundamental contribution of this thesis, the concept
and techniques of auditory spatial scaling. As scale defines the relations between space
and sound, by modifying the perceived distance of sounds based on context, auditory
scaling can enhance the auditory experience and create effective user interface. This
chapter discloses three prototype designs as part of an iterative design process and
closes with a design framework for AR audio based on scale.
26
Chapter four demonstrates how the scale-based framework guides the design of an
AR auditory environment - Loco-Radio Outdoor. The design adapts to users with
different mobile contexts and overcomes the geographic constraints of a compact audio
map. I first present the approach, use case, and audio map of Loco-Radio Outdoor. Then
it explains the scale design based on analyzing the number/distribution of audio streams,
and the speed/context of mobility, followed by the designs of system, audio , and UI. The
chapter closes with a summary of user evaluation.
Chapter five transfers the AR experience to indoors and applies the framework to
design an AR auditory environment at building scale, instead of street scale. I introduce
Compass Badge, a geomagnetic based location sensing module developed by Chung
(2012). Then I present the design of Loco-Radio Indoor, which realizes an AR auditory
tour of the MIT Media Lab. It is followed by the summary of user evaluation and
discussion. The thesis is concluded in chapter six.
27
Chapter 2
Background and Related Works
The dissertation research attempts to enhance the awareness of mobile users to
their surroundings, and the approach is to immerse the user in interactive auditory
environments in which nearby places are augmented by localized sound streams.
Therefore, the essential components of this research include spatial audio and
augmented reality (AR) audio. The former involves the concept and techniques of
generating the virtual placement of sound sources. The latter extends the local
environment with virtual auditory layers and creates new communication scenarios for
mobile users. In this chapter, I will introduce the background and related works of spatial
audio and AR audio. They are followed by a review of studies that evaluated 3D spatial
audio in various settings and contexts of use.
2.1 Spatial Audio
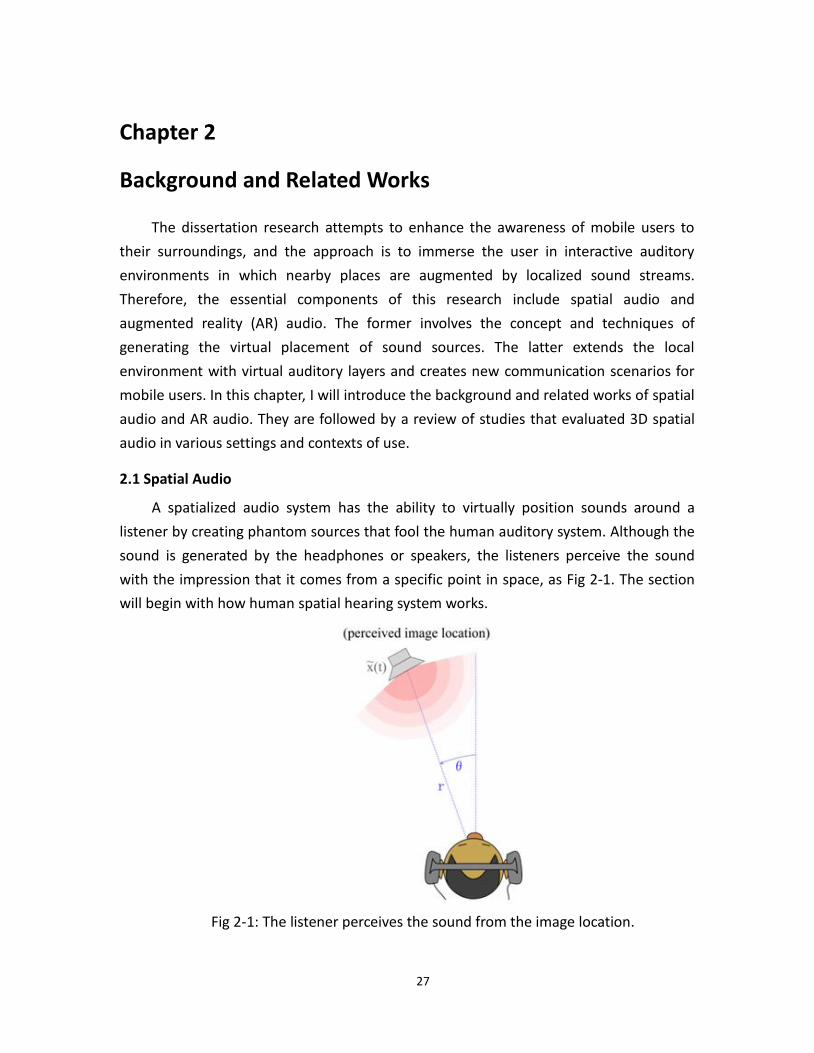
A spatialized audio system has the ability to virtually position sounds around a
listener by creating phantom sources that fool the human auditory system. Although the
sound is generated by the headphones or speakers, the listeners perceive the sound
with the impression that it comes from a specific point in space, as Fig 2-1. The section
will begin with how human spatial hearing system works.
Fig 2-1: The listener perceives the sound from the image location.
28
2.1.1 Sound localization by humans
Sound localization is the process of determining the location of a sound source. It
begins with the brain processing two signals – signals to the left and right ear. The
human auditory system utilizes subtle differences in intensity, spectral, and timing cues
to allow us to localize sound sources. The process is mainly based on the following cues:
(1) Interaural time difference (ITD) is the difference of arrival time of a sound
between two ears. It occurs whenever the distance from the source of sound to
two ears is different. For example, sounds to the right arrive first at the right ear
and later at the left ear. It is the main cue of sound localization, especially for
lower frequencies.
(2) Interaural level difference (ILD) or interaural intensity difference (IID) is the
difference of perceived intensity of a sound between two ears. The head
acoustically “shadows” the ear located on the further side from the sound
source, which results in different signal levels in each ear. In general, this cue
works at all frequencies, but natural head shadowing does not attenuate low
frequencies substantially unless the source is extremely close to the head.
(3) Spectral cues are the spectral changes when sounds reflect off the listener’s
torso and pinnae (external ears). They are the primary cues for elevation
estimation and also front-back discrimination. These cues are first studied as
monaural cues. But since human heads are not axially symmetric along the
interaural axis, there are also binaural spectral cues. The importance of binaural
versus monaural spectral cues is relatively less explored.
(4) Distance cues are the loss of amplitude, the loss of high frequencies, and the
ratio of the direct to reverberant sound. It is shown that the spectral change
over distance becomes a stronger cue when the sound is familiar to the listener
(McGregor 1985). In other words, knowing the nature of a sound and its
spectral variability at different intensities helps a listener in determining
distance.
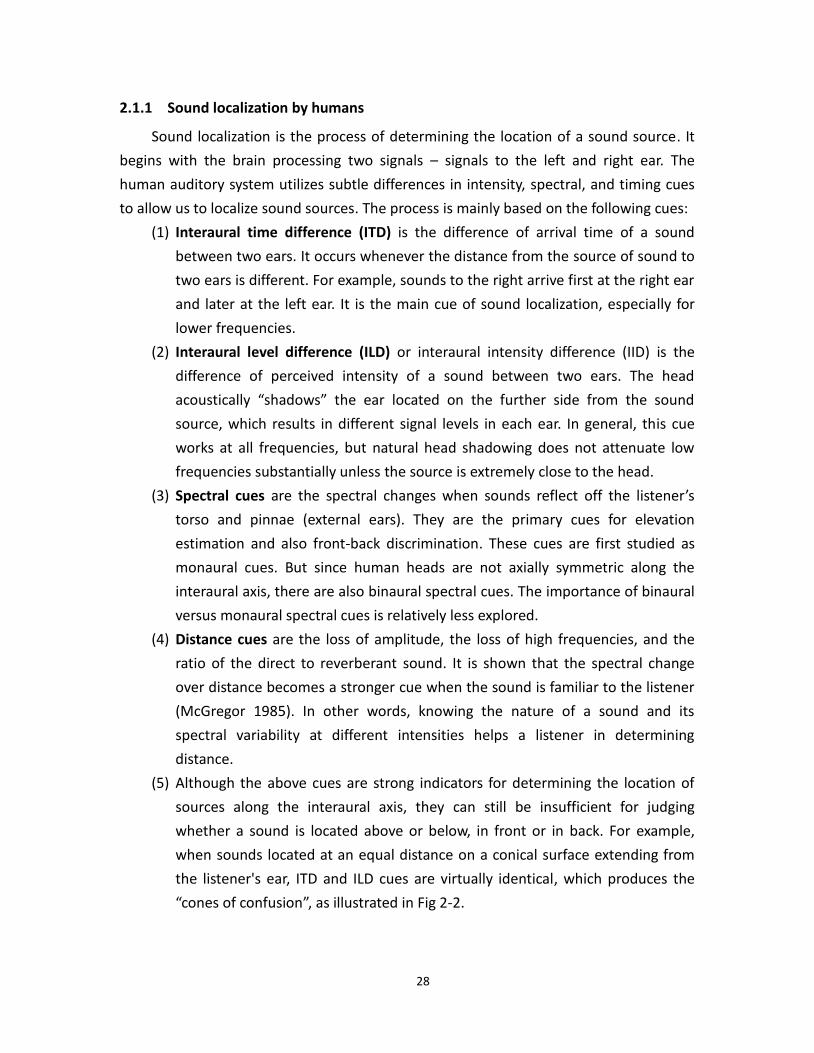
(5) Although the above cues are strong indicators for determining the location of
sources along the interaural axis, they can still be insufficient for judging
whether a sound is located above or below, in front or in back. For example,
when sounds located at an equal distance on a conical surface extending from
the listener's ear, ITD and ILD cues are virtually identical, which produces the
“cones of confusion”, as illustrated in Fig 2-2.
29
Fig 2-2: The cone of confusion: The ITD and ILD cues are equivalent in A and C, and
in B and D, resulting in an up-down and a front-back confusion
In order to resolve ambiguous situations, dynamics cues are collected by tilting
the head. Thurlow and Runge (1967) showed that head rotation was especially
effective in reducing horizontal localization error and somewhat effective at
reducing vertical localization error. Boerger et al. (1977) demonstrated that
adding dynamic head-tracking to a headphone display considerably decreases
front-back reversals.
(6) Perceptual disambiguation is also accomplished through integration of prior
knowledge and multiple sensory inputs, including and especially visual cues.
Since visual resolution is two orders of magnitude higher than auditory
resolution, when the auditory cues point to the source location within a certain
range, the visual cues can fine-tune and fix the perceived direction.
2.1.2 Head-related transfer functions (HRTFs)
The above directional cues for sound are embodied in the transformation of sound
pressure from the free field to the ears of a listener, and the measurements of this
transformation are called Head-Related Transfer Functions (HRTFs). Each HRTF measures
the transformation for a specific sound location relative to the head and describes the
diffraction of sound by the torso, head, and pinna.
HRTFs are individual since human bodies are individual with different sizes and
shapes of the head, upper torso and pinna. In common practice, dummy heads or
mannequins are often used for obtaining systematic measurements of HRTFs. After that,
a synthetic binaural signal can be created by convolving a sound with the appropriate
pair of HRTFs.
In 1994, Gardner, Martin, and KEMAR (the dummy head) published the first open
30
extensive set of HRTF measurements. The impulse responses were measured from a
total of 710 different positions in the MIT anechoic chamber and were made available
online. The HRTF library I adopted in this research was developed by Bryden (1997),
based on KEMAR HRTF measurements, which she released as open source under GNU
General Public License.
2.1.3 Spatial audio reproduction
There are two general approaches to building systems capable of reproducing
spatial audio. One is to surround the listener with a large number of transducers, which
precisely or approximately reproduce the acoustic sound-field of the target scene.
However, the need of multiple loudspeakers is not ideal for mobile applications.
The second method, called binaural audio, reproduces acoustic signals only at the
ears of the listener. It is applicable to both headphone and loudspeaker reproduction.
The former is often used for binaural audio because they have excellent channel
separation that can isolate the listener from external sounds and room reverberation.
However, when the synthesis of binaural directional cues is not tailored for the listener,
headphone reproduction often suffers from in-head localization: the sound source is
perceived to be inside the listener’s head. It also creates front-back reversals, especially
for frontal targets (Begault, 1990).
User isolation from the natural audio environment created by headphone
presentation can, however, be a disadvantage in some application areas like augmented
reality. To overcome this problem, alternative reproduction devices can be used. For
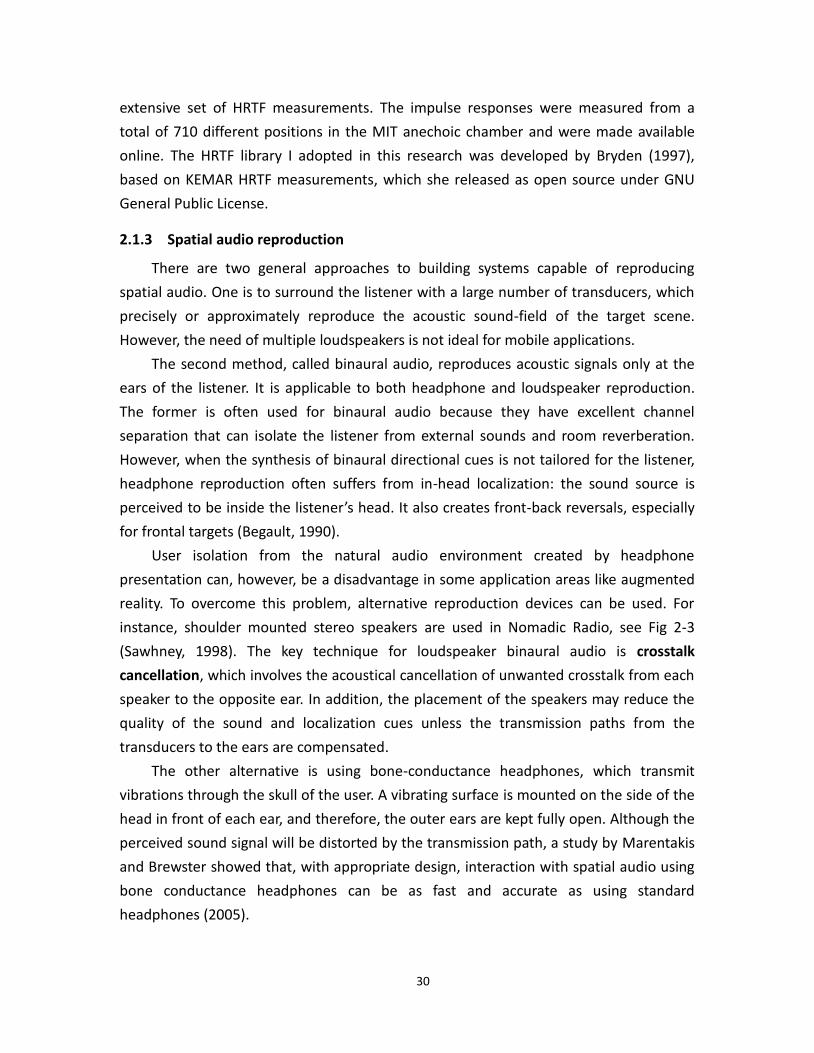
instance, shoulder mounted stereo speakers are used in Nomadic Radio, see Fig 2-3
(Sawhney, 1998). The key technique for loudspeaker binaural audio is crosstalk
cancellation, which involves the acoustical cancellation of unwanted crosstalk from each
speaker to the opposite ear. In addition, the placement of the speakers may reduce the
quality of the sound and localization cues unless the transmission paths from the
transducers to the ears are compensated.
The other alternative is using bone-conductance headphones, which transmit
vibrations through the skull of the user. A vibrating surface is mounted on the side of the
head in front of each ear, and therefore, the outer ears are kept fully open. Although the
perceived sound signal will be distorted by the transmission path, a study by Marentakis
and Brewster showed that, with appropriate design, interaction with spatial audio using
bone conductance headphones can be as fast and accurate as using standard
headphones (2005).
31
Fig 2-3: Nomadic Radio uses the Nortel SoundBeam Neckset. The directional
speakers are utilized for rendering spatialized audio to the listener.
2.1.4 Concept framework of spatial audio applications
The possibility of placing sounds in space leads to the idea of giving sound motion,
and it raises further questions: What gives sound motion? When does sound move?
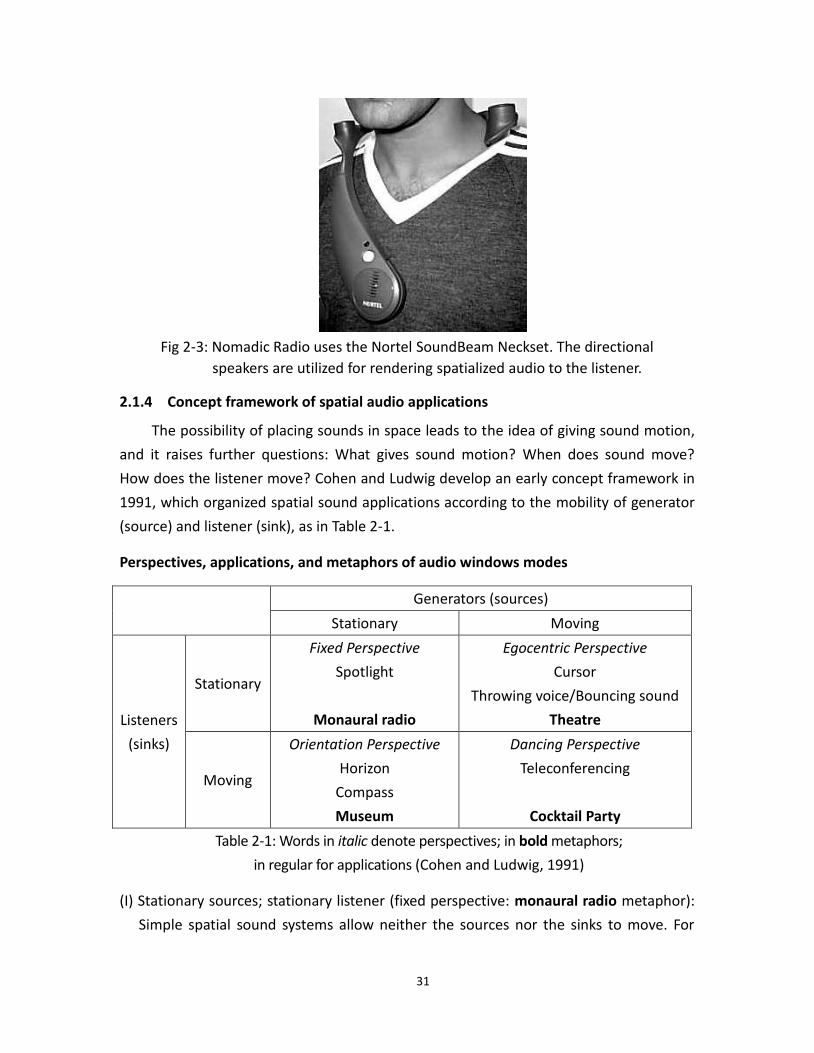
How does the listener move? Cohen and Ludwig develop an early concept framework in
1991, which organized spatial sound applications according to the mobility of generator
(source) and listener (sink), as in Table 2-1.
Perspectives, applications, and metaphors of audio windows modes
Generators (sources)
Stationary Moving
Listeners
(sinks)
Stationary
Fixed Perspective
Spotlight
Monaural radio
Egocentric Perspective
Cursor
Throwing voice/Bouncing sound
Theatre
Moving
Orientation Perspective
Horizon
Compass
Museum
Dancing Perspective
Teleconferencing
Cocktail Party
Table 2-1: Words in italic denote perspectives; in bold metaphors;
in regular for applications (Cohen and Ludwig, 1991)
(I) Stationary sources; stationary listener (fixed perspective: monaural radio metaphor):
Simple spatial sound systems allow neither the sources nor the sinks to move. For
32
example, a conference call application could separate channels to virtual locations to
enhance the quality of conversation.
(II) Moving Sources; stationary listener (egocentric perspective; theatre metaphor):
This egocentric perspective allows the sources to move around a static listener as if
the user were attending a theatre performance. The motion of sources can be
controlled by the user or the system.
(III) Stationary sources; moving listener (orientation perspective: museum metaphor):
Like visitors at a museum, the listeners are moving and the sources are stationary. It
would be useful for providing orientation, for instance, an audio compass which
always plays a source from North.
(IV) Moving sources; moving listener (dancing perspective; cocktail party metaphor):
The dancing perspective gives full mobility for both sources and sinks. Groupware
and other social applications can be imagined in this category.
Cohen's framework not only provides representative applications but also describes
the design metaphors behind the interactive forms. These metaphors were later
re-iterated by Rebelo et al. (2008), who introduced a typology for listening-in-place with
three distinct types of relationships: theatre, museum, and city of listening. In the
following sub-section, we will review a series of early spatial audio applications. Most of
them belong to the first two categories of stationary listeners. For spatial audio
applications of moving listeners, the focus is usually on "mobility" or "augmented
reality". Therefore, we will talk about these applications later in Section 2.2 "Mobile
Augmented Reality Audio".
2.1.5 Previous spatial audio applications
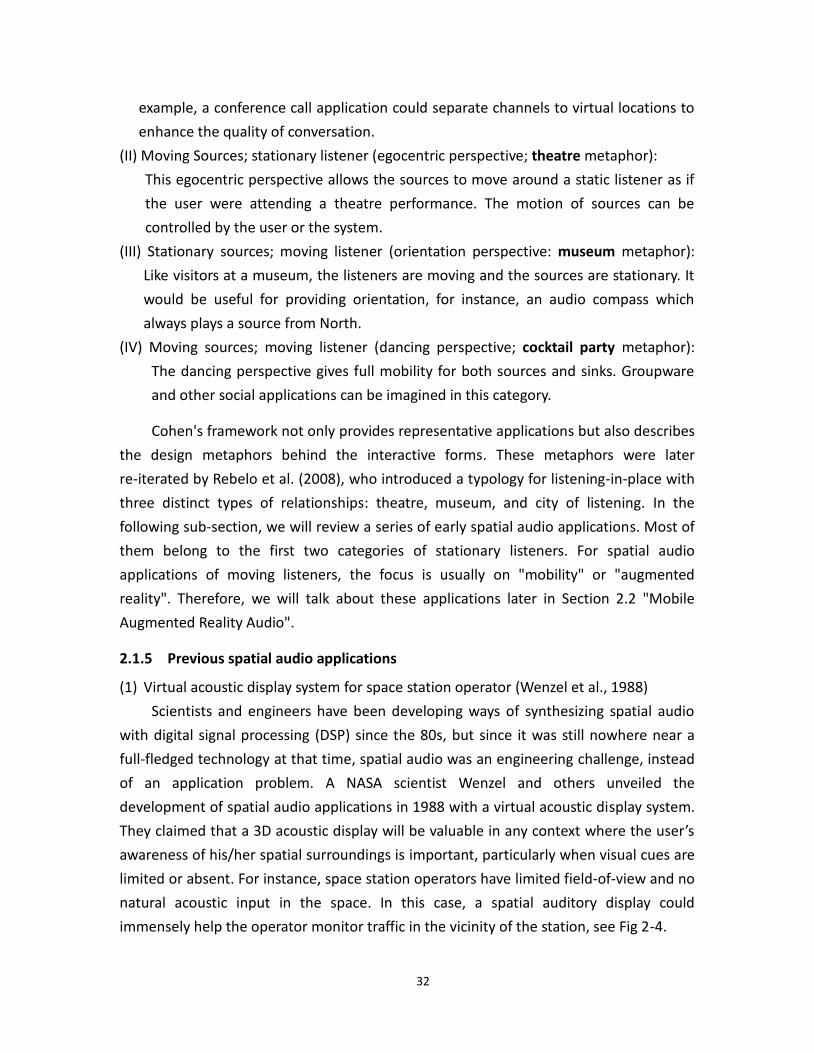
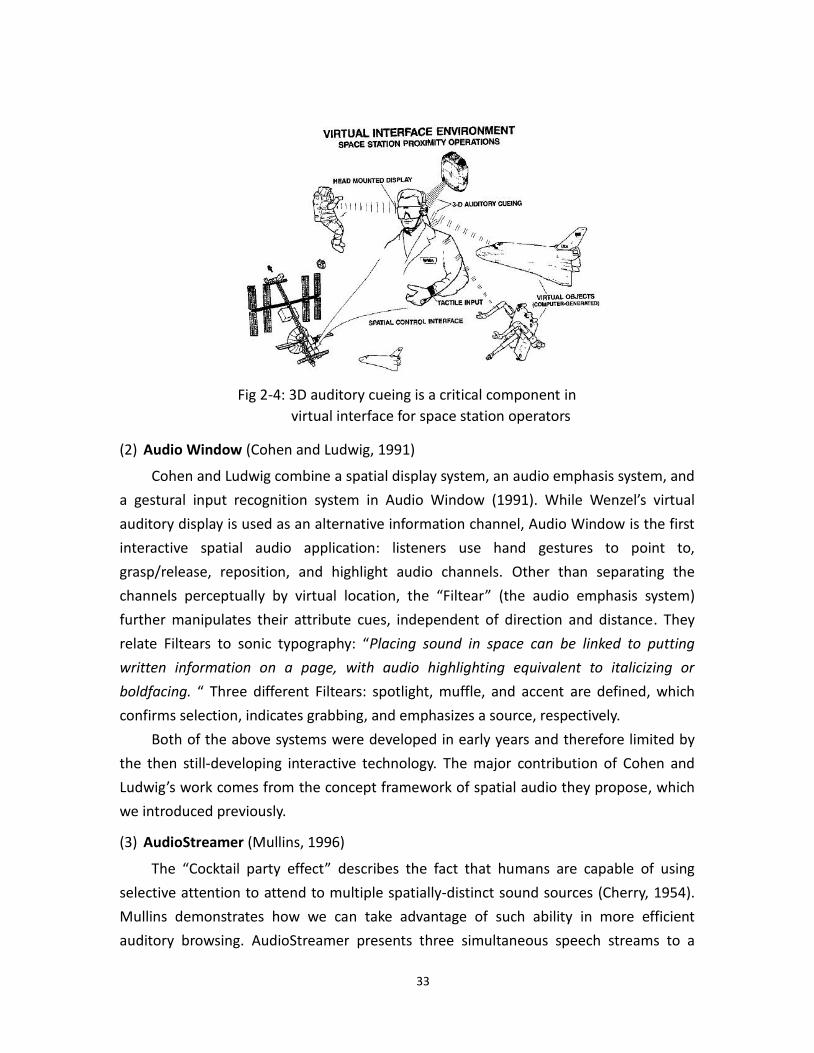
(1) Virtual acoustic display system for space station operator (Wenzel et al., 1988)
Scientists and engineers have been developing ways of synthesizing spatial audio
with digital signal processing (DSP) since the 80s, but since it was still nowhere near a
full-fledged technology at that time, spatial audio was an engineering challenge, instead
of an application problem. A NASA scientist Wenzel and others unveiled the
development of spatial audio applications in 1988 with a virtual acoustic display system.
They claimed that a 3D acoustic display will be valuable in any context where the user’s
awareness of his/her spatial surroundings is important, particularly when visual cues are
limited or absent. For instance, space station operators have limited field-of-view and no
natural acoustic input in the space. In this case, a spatial auditory display could
immensely help the operator monitor traffic in the vicinity of the station, see Fig 2-4.
33
Fig 2-4: 3D auditory cueing is a critical component in
virtual interface for space station operators
(2) Audio Window (Cohen and Ludwig, 1991)
Cohen and Ludwig combine a spatial display system, an audio emphasis system, and
a gestural input recognition system in Audio Window (1991). While Wenzel’s virtual
auditory display is used as an alternative information channel, Audio Window is the first
interactive spatial audio application: listeners use hand gestures to point to,
grasp/release, reposition, and highlight audio channels. Other than separating the
channels perceptually by virtual location, the “Filtear” (the audio emphasis system)
further manipulates their attribute cues, independent of direction and distance. They
relate Filtears to sonic typography: “Placing sound in space can be linked to putting
written information on a page, with audio highlighting equivalent to italicizing or
boldfacing. “ Three different Filtears: spotlight, muffle, and accent are defined, which
confirms selection, indicates grabbing, and emphasizes a source, respectively.
Both of the above systems were developed in early years and therefore limited by
the then still-developing interactive technology. The major contribution of Cohen and
Ludwig’s work comes from the concept framework of spatial audio they propose, which
we introduced previously.
(3) AudioStreamer (Mullins, 1996)
The “Cocktail party effect” describes the fact that humans are capable of using
selective attention to attend to multiple spatially-distinct sound sources (Cherry, 1954).
Mullins demonstrates how we can take advantage of such ability in more efficient
auditory browsing. AudioStreamer presents three simultaneous speech streams to a
34
listener over conventional stereo headphones. Items of potential interest are excluded in
order to keep all three streams neutral. The streams are virtually placed in left, front,
and right of the user, and he/she can attend to individual stream by head-pointing or
using hand gestures. A focused stream is 10-15 db louder than non-focused streams. At
potential interesting points of non-focused streams, the system elicits an attention shift
for the listener by playing a tone and temporarily increasing the gain of corresponding
stream.
Since the cognitive load of listening to simultaneous channels increases with the
number of channels, a key research question here is: How many streams can and should
be used at the same time? An experiment from Stifelman was cited in this research:
Multiple channels of audio are presented to listeners, who are asked to perform two
tasks simultaneously: listening comprehension on a primary channel and target
monitoring on the non-primary channels. The result shows a clear decline in
performance between the two and three channel condition.
AudioStreamer uses three channels of audio but successfully avoids the decline of
performance by using true spatial separation, cue tones, and a focusing mechanism in
order to enhance the selective attention of the listener. The study demonstrates the
potential of leveraging the listener’s ability of simultaneous listening toward more
efficient auditory browsing.
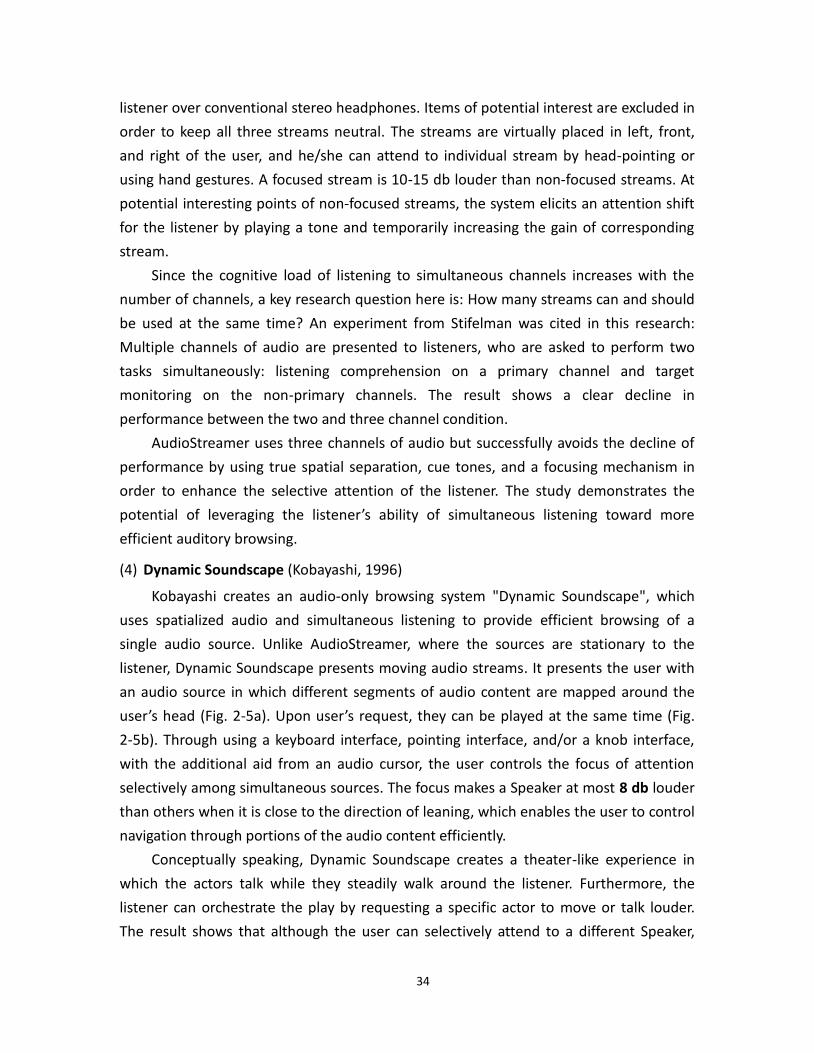
(4) Dynamic Soundscape (Kobayashi, 1996)
Kobayashi creates an audio-only browsing system "Dynamic Soundscape", which
uses spatialized audio and simultaneous listening to provide efficient browsing of a
single audio source. Unlike AudioStreamer, where the sources are stationary to the
listener, Dynamic Soundscape presents moving audio streams. It presents the user with
an audio source in which different segments of audio content are mapped around the
user’s head (Fig. 2-5a). Upon user’s request, they can be played at the same time (Fig.
2-5b). Through using a keyboard interface, pointing interface, and/or a knob interface,
with the additional aid from an audio cursor, the user controls the focus of attention
selectively among simultaneous sources. The focus makes a Speaker at most 8 db louder
than others when it is close to the direction of leaning, which enables the user to control
navigation through portions of the audio content efficiently.
Conceptually speaking, Dynamic Soundscape creates a theater-like experience in
which the actors talk while they steadily walk around the listener. Furthermore, the
listener can orchestrate the play by requesting a specific actor to move or talk louder.
The result shows that although the user can selectively attend to a different Speaker,
35
some users reported that it was difficult to notice salient topics spoken by a
non-attended Speaker. Another highlight of the work is the spatial/temporal mapping of
recording, which is reported to help the user associate audio content with spatial
position and aid recall of the story topic.
Figure 2-5a: The concept of the auditory space created by the system. A Speaker (a) in
the virtual acoustic space speaks audio data as it goes around the user (b).
Figure 2-5b: Upon user’s request, a new moving Speaker(c) is created where the user
points. The original Speaker (a) keeps going. The user hears multiple
portions of the audio stream simultaneously.
(5) Audio Hallway (Maher, 1998)
As AudioStreamer and Dynamic Soundscape both demonstrated how spatialized
audio and simultaneous listening can enhance the efficiency when browsing several
audio streams, Audio Hallway is a synthetic listening-only environment designed for
browsing large quantity of digital audio material. In the absence of visual cues, the most
important components of the environment are the inherent structure that stores and
organizes the audio files and the corresponding interaction. The audio files are first
clustered together into logically related groups. Audio Hallway then introduces two
levels of representation and interaction with the data. The top level is the virtual hallway
in which the listener travels up and down, with clustered sounds audible behind "doors".
36
An auditory collage of "braided audio" is emanating from each room, which acoustically
indicates the contents of the room. The bottom level has individual rooms. On entering a
room, the individual sounds of the cluster are arrayed spatially in front of the listener,
with auditory focus controllable with head rotation. Although the non-visual experience
proved to be too difficult to pick up for most users, here we will focus the discussion on
reviewing four key design features in this project.
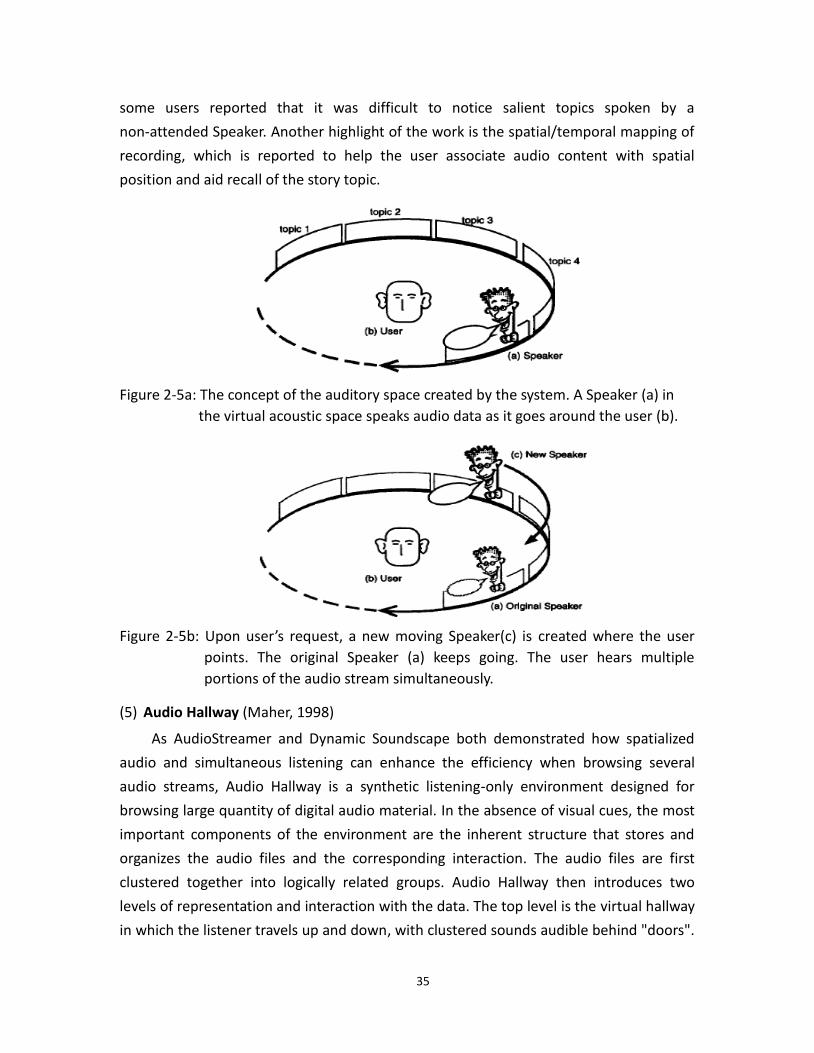
I. Braided audio
The goal here is to create the auditory "thumbnail" of multiple audio files from a
category without knowledge of the acoustic content, but incorporating the temporal
nature of sounds. Braided Audio mixes the entire set of sounds, but sequentially
amplifies each, so it momentarily dominates the mix and becomes intelligible, as in Fig.
2-6. The concept is similar to a visual collage, which intermingles visible segments from
multiple images.
Figure 2-6: The amplitude and durations of segments of the sounds mixed into the braid
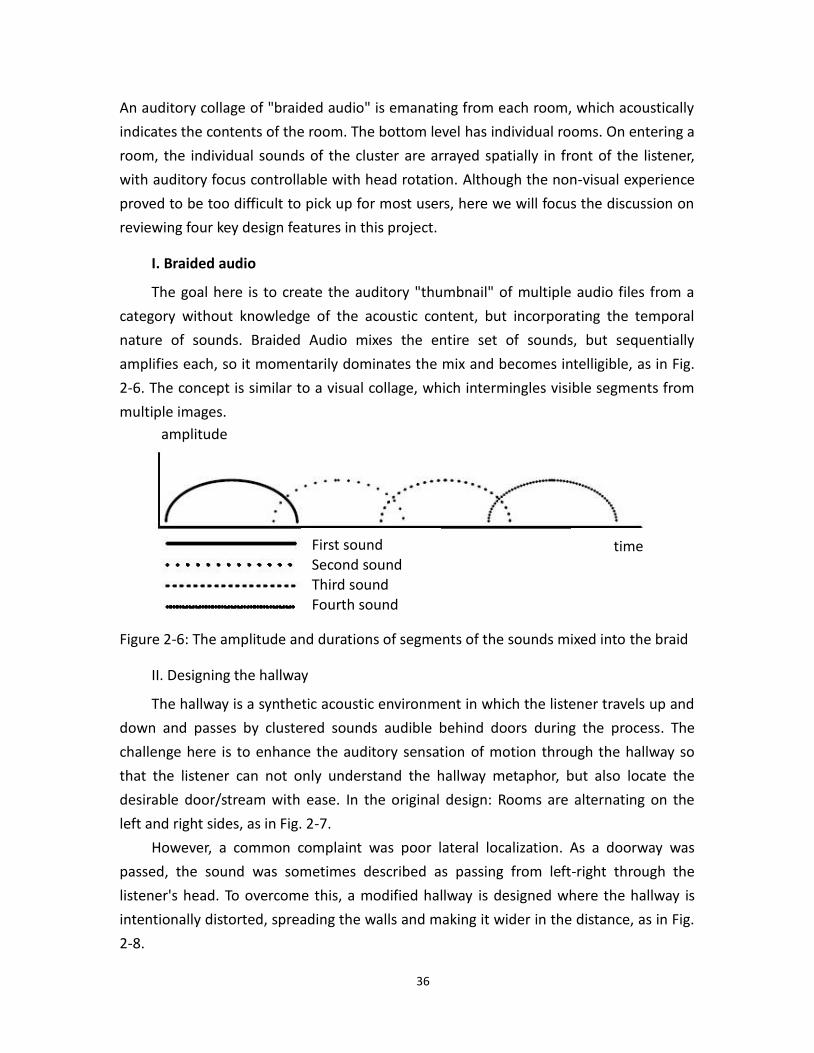
II. Designing the hallway
The hallway is a synthetic acoustic environment in which the listener travels up and
down and passes by clustered sounds audible behind doors during the process. The
challenge here is to enhance the auditory sensation of motion through the hallway so
that the listener can not only understand the hallway metaphor, but also locate the
desirable door/stream with ease. In the original design: Rooms are alternating on the
left and right sides, as in Fig. 2-7.
However, a common complaint was poor lateral localization. As a doorway was
passed, the sound was sometimes described as passing from left-right through the
listener's head. To overcome this, a modified hallway is designed where the hallway is
intentionally distorted, spreading the walls and making it wider in the distance, as in Fig.
2-8.
amplitude
time First sound Second sound Third sound Fourth sound
37
Figure 2-7: The original hallway. The listener travels down the center of the Hallway,
passing open doors from which sound emanates.
Figure 2-8: The modified hallway. To help maintain lateral acoustic discrimination, doors
are positioned further to the sides with increasing distance from the head.
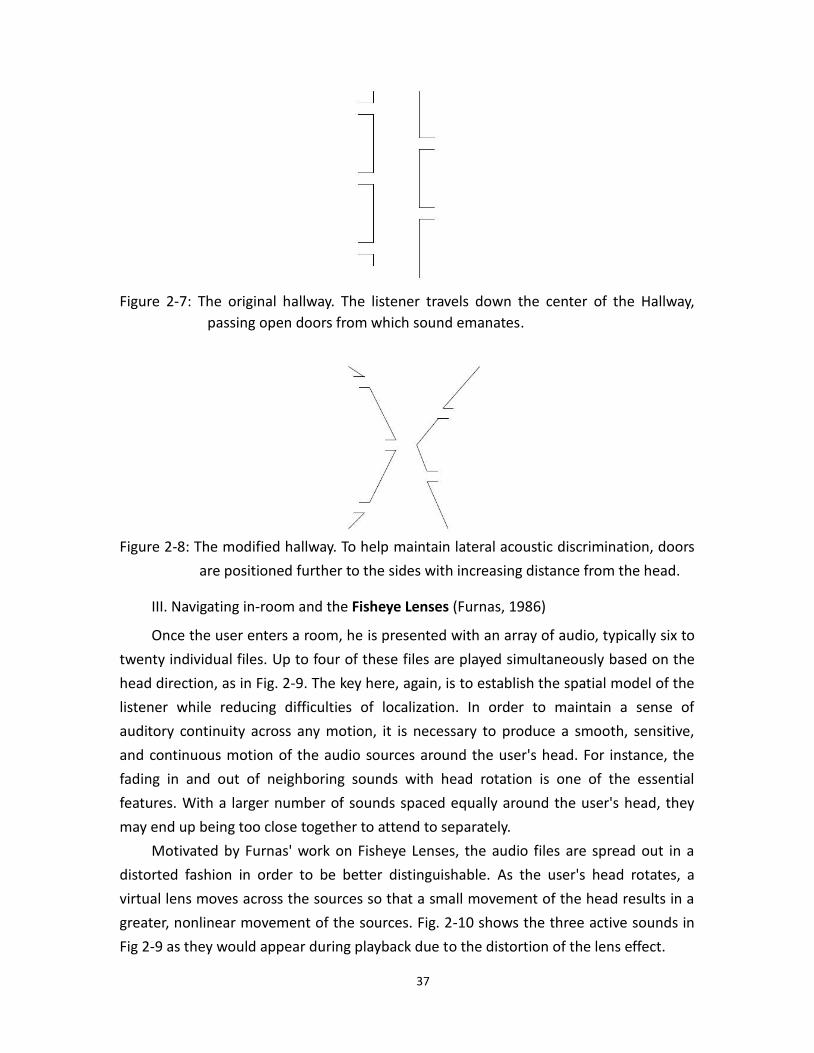
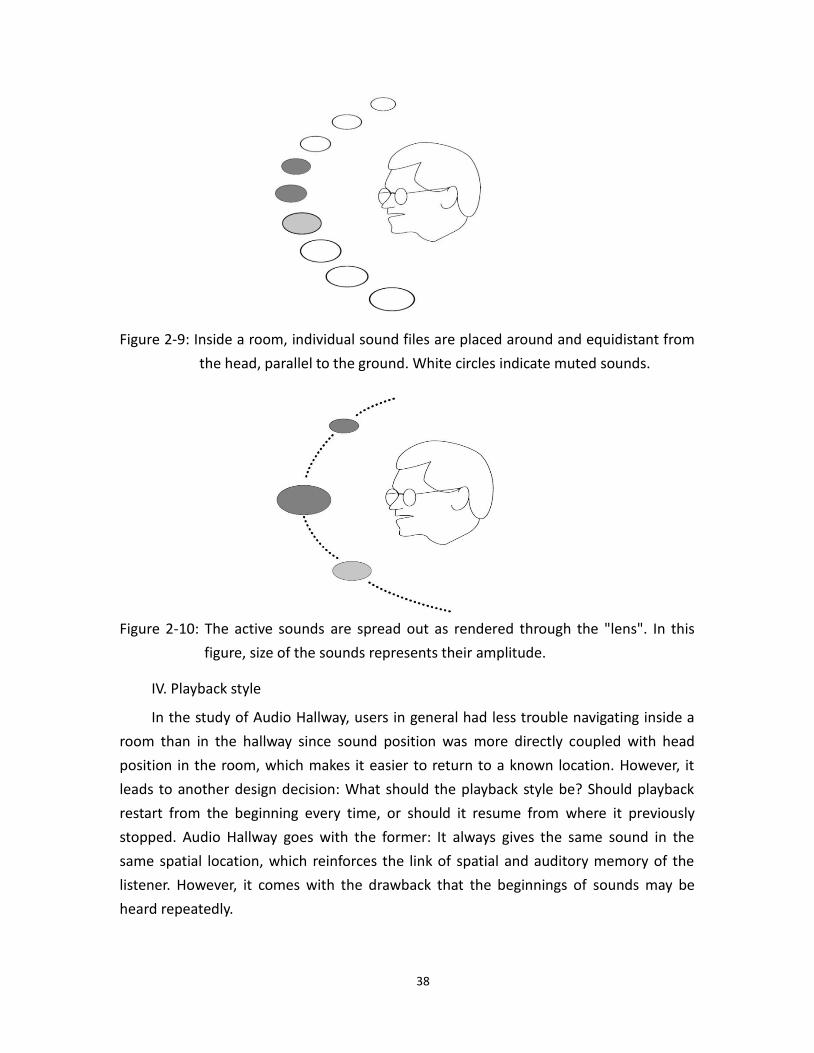
III. Navigating in-room and the Fisheye Lenses (Furnas, 1986)
Once the user enters a room, he is presented with an array of audio, typically six to
twenty individual files. Up to four of these files are played simultaneously based on the
head direction, as in Fig. 2-9. The key here, again, is to establish the spatial model of the
listener while reducing difficulties of localization. In order to maintain a sense of
auditory continuity across any motion, it is necessary to produce a smooth, sensitive,
and continuous motion of the audio sources around the user's head. For instance, the
fading in and out of neighboring sounds with head rotation is one of the essential
features. With a larger number of sounds spaced equally around the user's head, they
may end up being too close together to attend to separately.
Motivated by Furnas' work on Fisheye Lenses, the audio files are spread out in a
distorted fashion in order to be better distinguishable. As the user's head rotates, a
virtual lens moves across the sources so that a small movement of the head results in a
greater, nonlinear movement of the sources. Fig. 2-10 shows the three active sounds in
Fig 2-9 as they would appear during playback due to the distortion of the lens effect.
38
Figure 2-9: Inside a room, individual sound files are placed around and equidistant from
the head, parallel to the ground. White circles indicate muted sounds.
Figure 2-10: The active sounds are spread out as rendered through the "lens". In this
figure, size of the sounds represents their amplitude.
IV. Playback style
In the study of Audio Hallway, users in general had less trouble navigating inside a
room than in the hallway since sound position was more directly coupled with head
position in the room, which makes it easier to return to a known location. However, it
leads to another design decision: What should the playback style be? Should playback
restart from the beginning every time, or should it resume from where it previously
stopped. Audio Hallway goes with the former: It always gives the same sound in the
same spatial location, which reinforces the link of spatial and auditory memory of the
listener. However, it comes with the drawback that the beginnings of sounds may be
heard repeatedly.
39
(6) Direct Sonification (Fernstrom and McNamara, 1998)
Fernstrom and McNamara investigated how interactive sonification with
multiple-stream audio can enhance browsing tasks. As defined by Marchionini and
Shneidermann, browsing is "an exploratory, information seeking strategy that depends
upon serendipity ... especially appropriate for ill-defined problems and for exploring new
task domains (1998)." In order to achieve effective browsing, designing interactive
interfaces that enable direct manipulation of data sets is an essential approach. The
question is: what is the auditory equivalent of direct manipulation? To address that, the
audio aura is introduced as a user-controllable function that indicates the user's range of
interest in a domain. A thinking aloud study showed that users heard and remembered
more tunes browsing with multiple-stream audio and the aura.
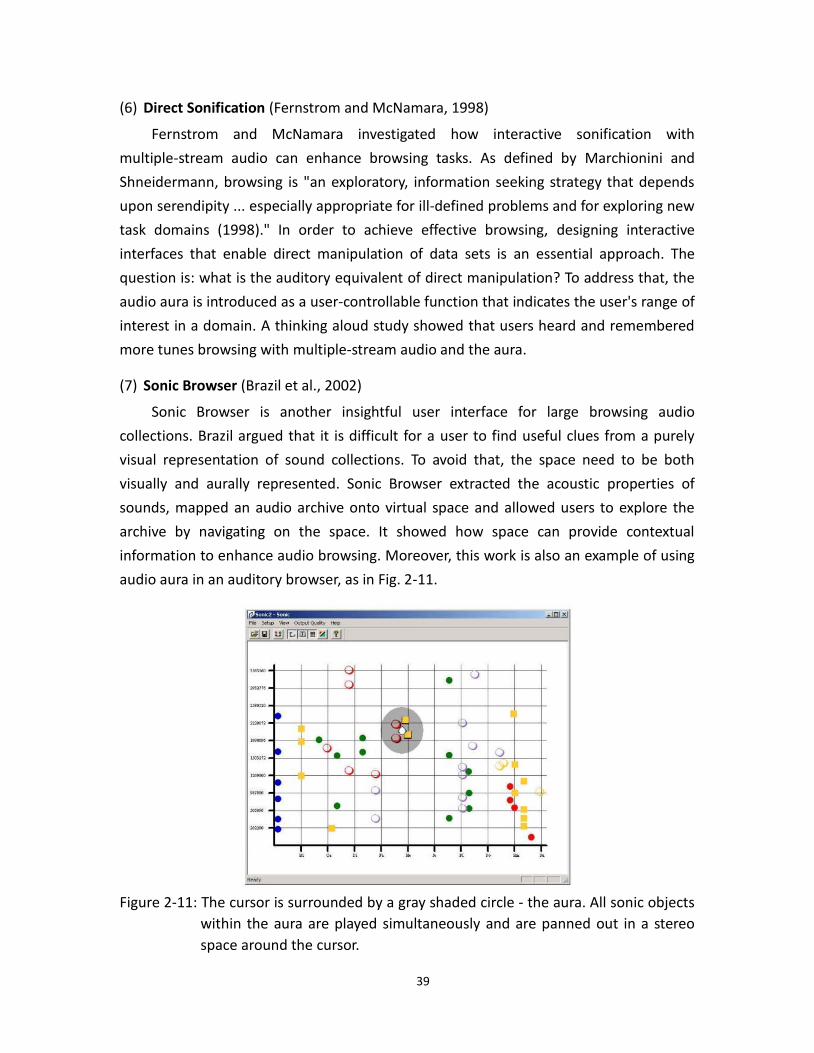
(7) Sonic Browser (Brazil et al., 2002)
Sonic Browser is another insightful user interface for large browsing audio
collections. Brazil argued that it is difficult for a user to find useful clues from a purely
visual representation of sound collections. To avoid that, the space need to be both
visually and aurally represented. Sonic Browser extracted the acoustic properties of
sounds, mapped an audio archive onto virtual space and allowed users to explore the
archive by navigating on the space. It showed how space can provide contextual
information to enhance audio browsing. Moreover, this work is also an example of using
audio aura in an auditory browser, as in Fig. 2-11.
Figure 2-11: The cursor is surrounded by a gray shaded circle - the aura. All sonic objects
within the aura are played simultaneously and are panned out in a stereo
space around the cursor.
40
2.2 Mobile Augmented Reality Audio
2.2.1 Augmented Reality
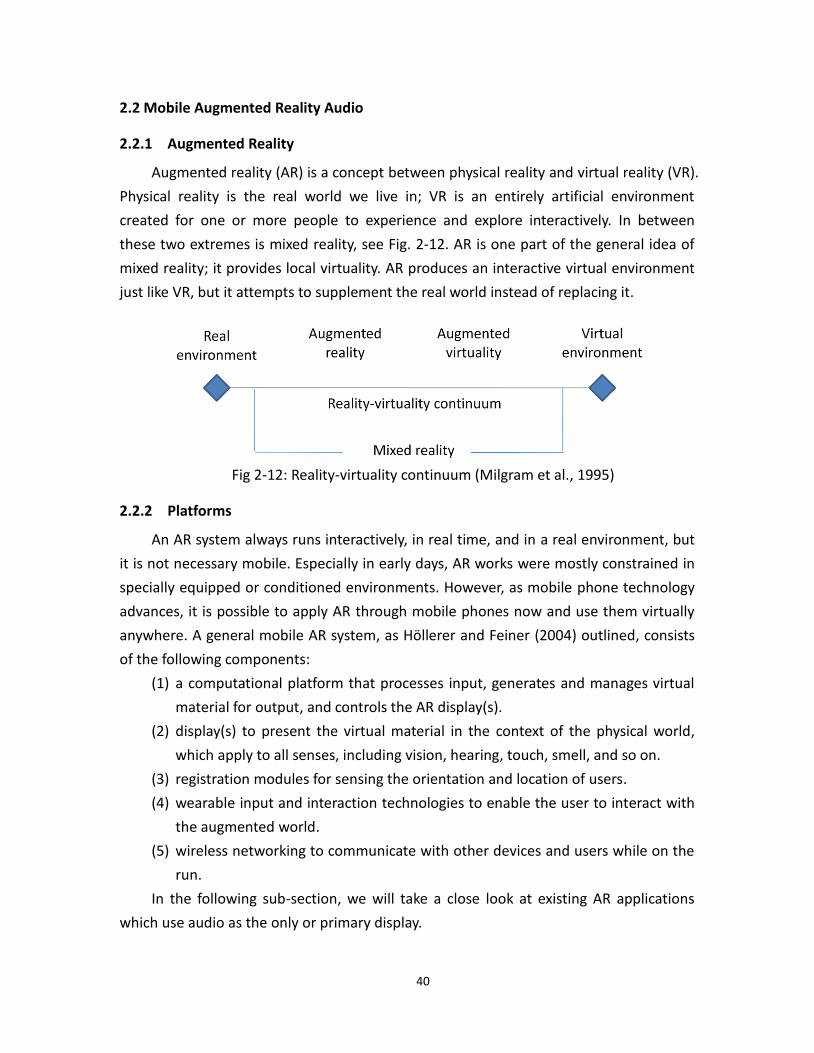
Augmented reality (AR) is a concept between physical reality and virtual reality (VR).
Physical reality is the real world we live in; VR is an entirely artificial environment
created for one or more people to experience and explore interactively. In between
these two extremes is mixed reality, see Fig. 2-12. AR is one part of the general idea of
mixed reality; it provides local virtuality. AR produces an interactive virtual environment
just like VR, but it attempts to supplement the real world instead of replacing it.
Fig 2-12: Reality-virtuality continuum (Milgram et al., 1995)
2.2.2 Platforms
An AR system always runs interactively, in real time, and in a real environment, but
it is not necessary mobile. Especially in early days, AR works were mostly constrained in
specially equipped or conditioned environments. However, as mobile phone technology
advances, it is possible to apply AR through mobile phones now and use them virtually
anywhere. A general mobile AR system, as Höllerer and Feiner (2004) outlined, consists
of the following components:
(1) a computational platform that processes input, generates and manages virtual
material for output, and controls the AR display(s).
(2) display(s) to present the virtual material in the context of the physical world,
which apply to all senses, including vision, hearing, touch, smell, and so on.
(3) registration modules for sensing the orientation and location of users.
(4) wearable input and interaction technologies to enable the user to interact with
the augmented world.
(5) wireless networking to communicate with other devices and users while on the
run.
In the following sub-section, we will take a close look at existing AR applications
which use audio as the only or primary display.
41
2.2.3 Augmented reality audio
AR audio systems are applications that use auditory display and interact with the
user through audio. They extend the local environment with virtual auditory layers and
communication scenarios. In order to produce a coherent perception, the mixing needs
to be considerately designed. Here we will categorize AR audio systems by reviewing the
use of virtual auditory layers in the following three dimensions:
(1) Spatial design: localized or freely-floating of acoustic events(Härmä et al, 2003)
Localized acoustic events are connected to real world objects. They are
synthesized and superimposed on top of the real environment. In other words, the
localization cues of an acoustic event tell the user where a real world object is.
Krueger described the concept in 1991, and an early application can be seen in
Bederson's automated audio tour guide (1995), which he developed a sound
playback system triggered by location sensors based on infrared beacons.
Freely-floating acoustic events, on the other hand, use localization cues to
convey other information. For example, Nomadic Radio localized messages around
the user’s head based on their time of arrival (Sawhney & Schmandt, 2000). They
also suggested an approach which maps messages to difference distances away
from the head according to the levels of urgency or interest.
(2) Semantic design: background or foreground uses of audio
Sound can be obtrusive and distracting if the system is not aware of and
reacting to the listener’s change of context. Therefore, it is critical to adapt to
different attention levels the listener can afford and place acoustic events into his
perception considering the semantic roles sounds play. Ferrington (1994) has
suggested a three-layer semantic design of acoustical information: foreground
sounds, contextual sounds which support the foreground sound, and background or
ambient sounds.
Foreground sounds attract and require the majority of attention, which
sometimes need to invade the listener's periphery to ensure being perceived. At
the same time, the listener is gathering auditory information in the background that
he may or may not need to comprehend. Without requiring his full attention or
disrupting his foreground activity, the background sounds and peripheral auditory
cues can provide an awareness of notifications and events, or provide contextual
information of the surrounding environment.
Guided by Voices (Lyons et al., 2000) and OnTheRun (Donahoe, 2011) are
examples of foreground auditory applications, which explicitly engage users in the
42
audio environment through game plays. Audio Aura (Mynatt et al., 1998), on the
other hand, focuses the use of audio on the edge of background awareness.
Moreover, there are also auditory context-aware applications that use audio in
foreground and background at the same time. For instance, Nomadic Radio
provides adaptive and context-sensitive use of audio by introducing a scalable
auditory presentation.
(3) Temporal design: push or pull, synchronous or asynchronous audio
This dimension concerns when an acoustic stream is played, which part of the
stream should be played, and the relationships across the playback of all streams to
one or multiple listeners. A pull-audio application allows direct playback control of
audio streams, for example: a typical mobile music player. A push-audio application
triggers the streams according to the external state of users. For instance, a song is
played after the user arrives at the park.
The application can also be synchronous or asynchronous. For synchronous
applications, the presence (or absence) of listeners does not affect the playback of
audio streams. The classic radio system is one example: the listeners receive
identical content at any given moment regardless of when they turn on their radios.
An example of asynchronous applications is one that pauses/resumes the playback
at the same position when the listener leaves/comes back.
2.2.4 Location Sensing Techniques
Positioning systems are core components in mobile AR system as they provide the
necessary registration for the systems to align the virtual elements with the physical
objects in a real environment. GPS is the most widely used positioning system, but is
useful only for outdoor environments since it requires line of sight between the receiver
and the satellites.
Few existing technologies have achieved indoor positioning. Active Badge is the first
indoor location sensing system, introduced by Want et al. in 1992. His solution is based
on deploying infrared LEDs that emit unique identifiers periodically. The signal is picked
up by nearby infrared sensors to identify the location of the badge. Another early indoor
position research is based on ultrasound (Ward and Hopper 1997). It realized extremely
high precision: within 9cm of its true position for 95 percent of the measurements.
Although these systems achieve excellent accuracy, they are expensive solution and each
requires a pre-deployment of signaling or sensing devices all over the test environment.
Computer vision based systems are also an important category among indoor
positioning research. While it can also provide centimeter level accuracy, its main
43
disadvantage is the computation power required. Depending on the complexity of the
task, it can be difficult to run in real-time on mobile phones. It also induces a higher
latency.
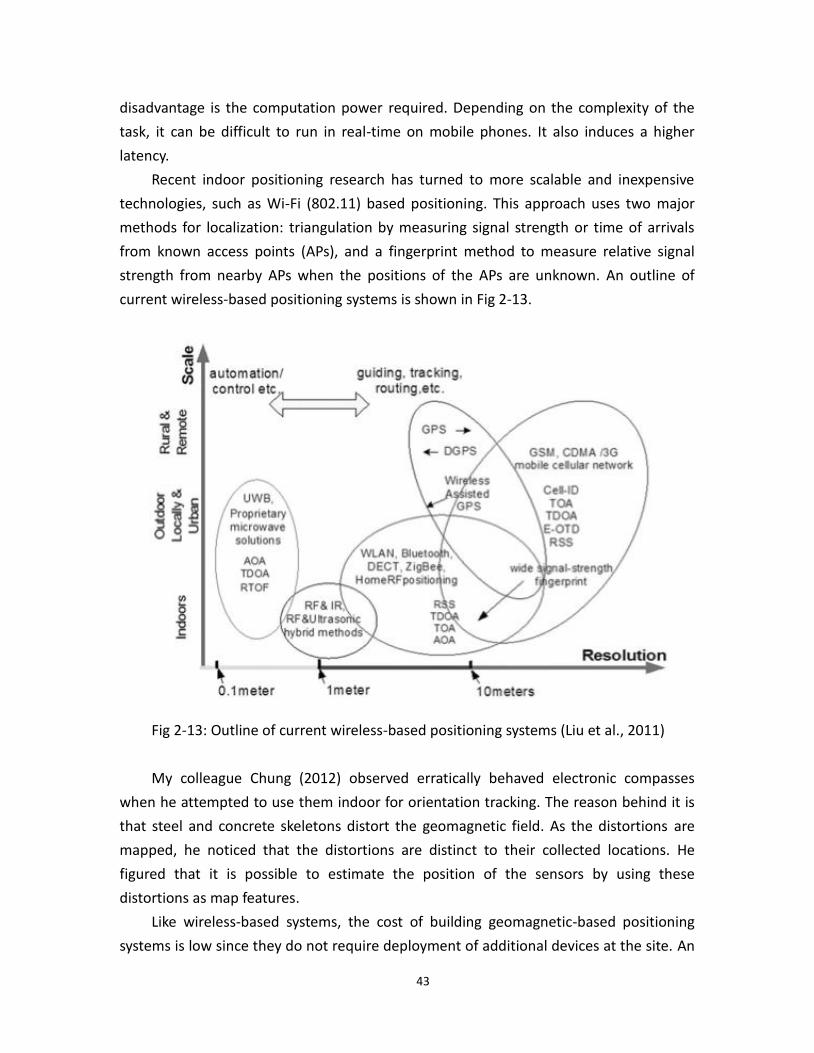
Recent indoor positioning research has turned to more scalable and inexpensive
technologies, such as Wi-Fi (802.11) based positioning. This approach uses two major
methods for localization: triangulation by measuring signal strength or time of arrivals
from known access points (APs), and a fingerprint method to measure relative signal
strength from nearby APs when the positions of the APs are unknown. An outline of
current wireless-based positioning systems is shown in Fig 2-13.
Fig 2-13: Outline of current wireless-based positioning systems (Liu et al., 2011)
My colleague Chung (2012) observed erratically behaved electronic compasses
when he attempted to use them indoor for orientation tracking. The reason behind it is
that steel and concrete skeletons distort the geomagnetic field. As the distortions are
mapped, he noticed that the distortions are distinct to their collected locations. He
figured that it is possible to estimate the position of the sensors by using these
distortions as map features.
Like wireless-based systems, the cost of building geomagnetic-based positioning
systems is low since they do not require deployment of additional devices at the site. An
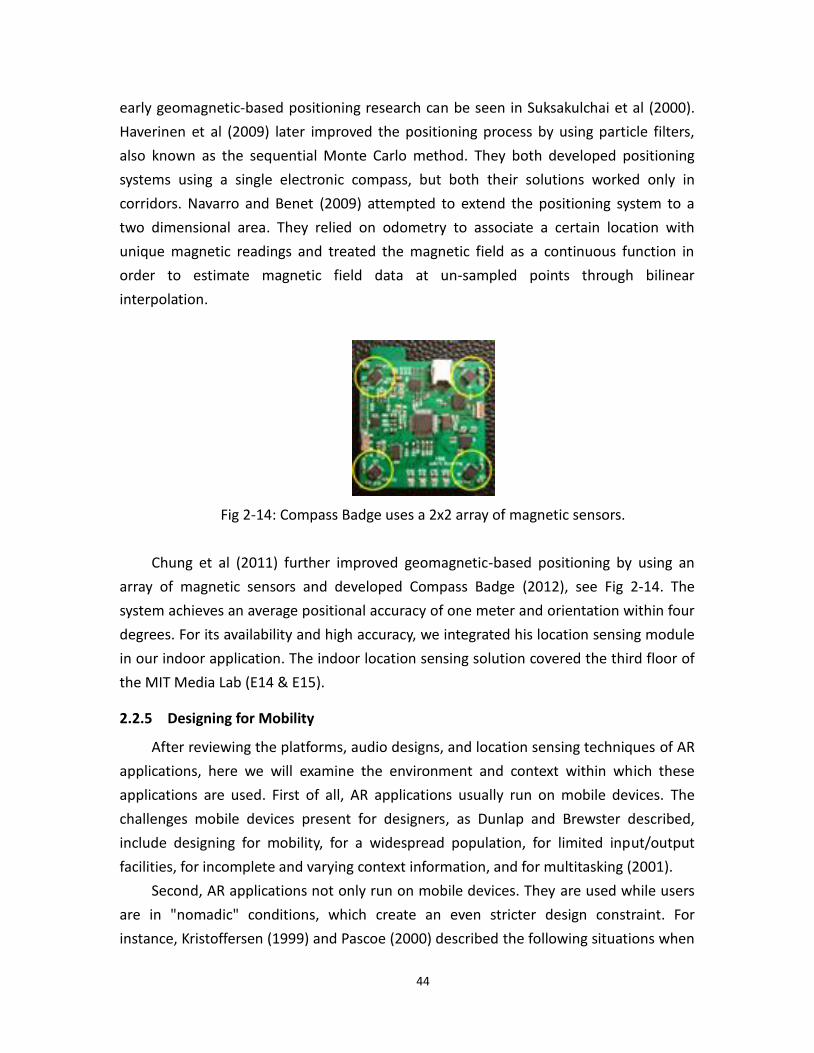
44
early geomagnetic-based positioning research can be seen in Suksakulchai et al (2000).
Haverinen et al (2009) later improved the positioning process by using particle filters,
also known as the sequential Monte Carlo method. They both developed positioning
systems using a single electronic compass, but both their solutions worked only in
corridors. Navarro and Benet (2009) attempted to extend the positioning system to a
two dimensional area. They relied on odometry to associate a certain location with
unique magnetic readings and treated the magnetic field as a continuous function in
order to estimate magnetic field data at un-sampled points through bilinear
interpolation.
Fig 2-14: Compass Badge uses a 2x2 array of magnetic sensors.
Chung et al (2011) further improved geomagnetic-based positioning by using an
array of magnetic sensors and developed Compass Badge (2012), see Fig 2-14. The
system achieves an average positional accuracy of one meter and orientation within four
degrees. For its availability and high accuracy, we integrated his location sensing module
in our indoor application. The indoor location sensing solution covered the third floor of
the MIT Media Lab (E14 & E15).
2.2.5 Designing for Mobility
After reviewing the platforms, audio designs, and location sensing techniques of AR
applications, here we will examine the environment and context within which these
applications are used. First of all, AR applications usually run on mobile devices. The
challenges mobile devices present for designers, as Dunlap and Brewster described,
include designing for mobility, for a widespread population, for limited input/output
facilities, for incomplete and varying context information, and for multitasking (2001).
Second, AR applications not only run on mobile devices. They are used while users
are in "nomadic" conditions, which create an even stricter design constraint. For
instance, Kristoffersen (1999) and Pascoe (2000) described the following situations when
45
the Graphical User Interface (GUI) based interaction style currently embodied in most
mobile devices would become inappropriate:
when interactions with the real world are more important than with the
computer, which strictly limits the user’s attention capacity to spare for the
computer interface
when the user’s hands are involved in physical tasks (such as driving)
when the user is occupied by activities that demand a high level of attention,
for example, driving or talking
when users are mobile and use a variety of positions and postures during tasks
when the user’s interactions with the environment are context-dependent
when interactions with the computer are rapid, and driven by the external
environment
A few design principles are suggested to overcome the constraint induced in the
above situations: context-aware design, reducing visual attention, and emphasis on the
use of audio feedback. However, there are limitations of using audio in mobile situations
too. As pointed out by Sawhney, speech interaction can be slow, tedious, and inaccurate
especially in noisy environments (1998). In addition, social conventions have yet to fully
evolve on the interaction style that it may be awkward and insecure for people to speak
to themselves. To conclude, the designs of auditory interaction in mobile environments
require attention to the affordances and constraints of speech and audio in the interface
accompanying the characteristics of the user's physical environment. We will see a few
examples of that in the next sub-section.
2.2.6 Applications
(1) Auditory Context Awareness
Audio Aura is an early audio-only augmented reality system which uses audio as an
ambient information channel as users travel through their workspace (Mynatt et al.,
1998). As opposed to the information which one relies on must invade his periphery to
ensure that it has been perceived, Audio Aura aims to provide serendipitous information,
via background auditory cues, that is tied to people’s physical actions in the workplace.
They proposed a number of strategies for creating peripheral sounds grouped in
cohesive ecologies: First, avoid the “alarm” paradigm. Second, create a structured audio
layout and consider the semantic roles of individual sounds. Third, embed information
cues into a running, low-level soundtrack. The combined design is an environment that
uses sound effects, music, and voice in a rich, multi-layered environment.
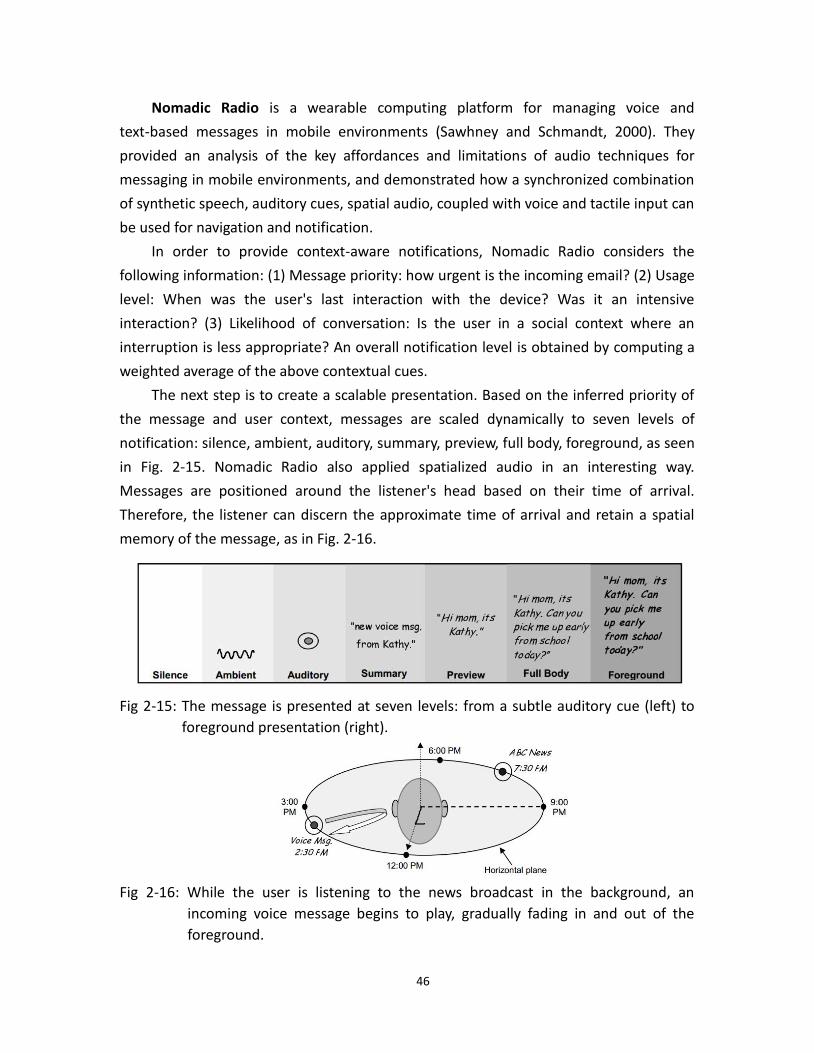
46
Nomadic Radio is a wearable computing platform for managing voice and
text-based messages in mobile environments (Sawhney and Schmandt, 2000). They
provided an analysis of the key affordances and limitations of audio techniques for
messaging in mobile environments, and demonstrated how a synchronized combination
of synthetic speech, auditory cues, spatial audio, coupled with voice and tactile input can
be used for navigation and notification.
In order to provide context-aware notifications, Nomadic Radio considers the
following information: (1) Message priority: how urgent is the incoming email? (2) Usage
level: When was the user's last interaction with the device? Was it an intensive
interaction? (3) Likelihood of conversation: Is the user in a social context where an
interruption is less appropriate? An overall notification level is obtained by computing a
weighted average of the above contextual cues.
The next step is to create a scalable presentation. Based on the inferred priority of
the message and user context, messages are scaled dynamically to seven levels of
notification: silence, ambient, auditory, summary, preview, full body, foreground, as seen
in Fig. 2-15. Nomadic Radio also applied spatialized audio in an interesting way.
Messages are positioned around the listener's head based on their time of arrival.
Therefore, the listener can discern the approximate time of arrival and retain a spatial
memory of the message, as in Fig. 2-16.
Fig 2-15: The message is presented at seven levels: from a subtle auditory cue (left) to
foreground presentation (right).
Fig 2-16: While the user is listening to the news broadcast in the background, an
incoming voice message begins to play, gradually fading in and out of the
foreground.
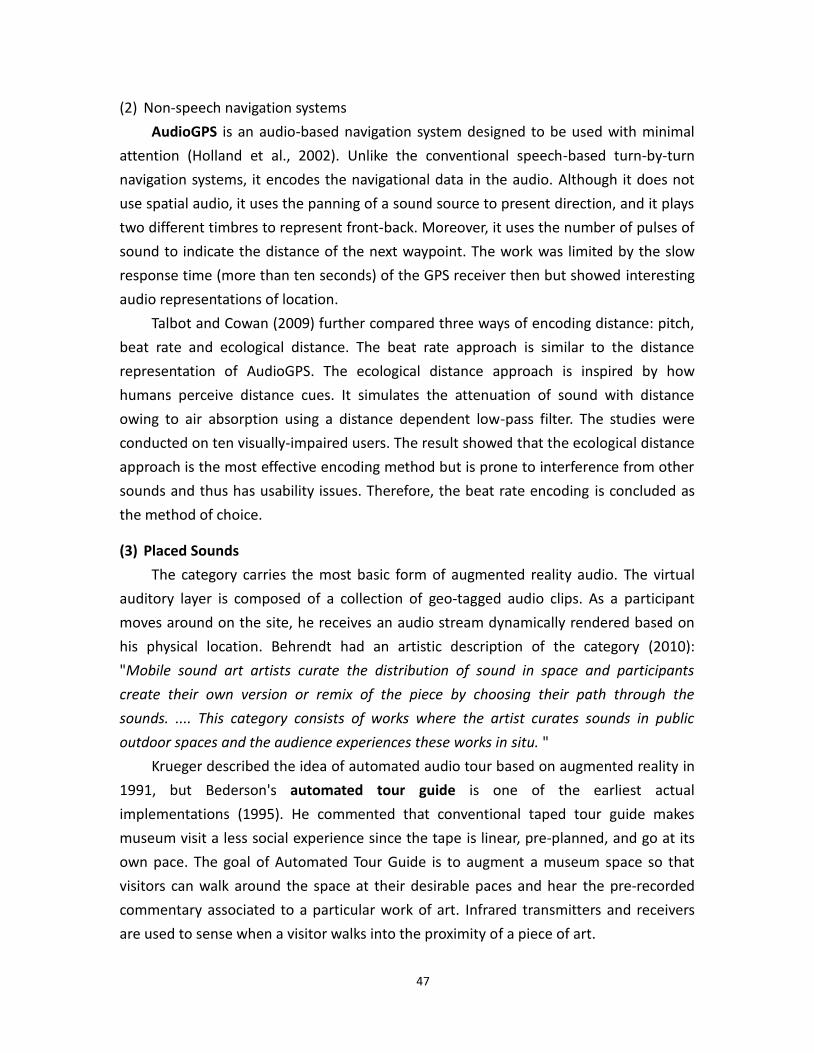
47
(2) Non-speech navigation systems
AudioGPS is an audio-based navigation system designed to be used with minimal
attention (Holland et al., 2002). Unlike the conventional speech-based turn-by-turn
navigation systems, it encodes the navigational data in the audio. Although it does not
use spatial audio, it uses the panning of a sound source to present direction, and it plays
two different timbres to represent front-back. Moreover, it uses the number of pulses of
sound to indicate the distance of the next waypoint. The work was limited by the slow
response time (more than ten seconds) of the GPS receiver then but showed interesting
audio representations of location.
Talbot and Cowan (2009) further compared three ways of encoding distance: pitch,
beat rate and ecological distance. The beat rate approach is similar to the distance
representation of AudioGPS. The ecological distance approach is inspired by how
humans perceive distance cues. It simulates the attenuation of sound with distance
owing to air absorption using a distance dependent low-pass filter. The studies were
conducted on ten visually-impaired users. The result showed that the ecological distance
approach is the most effective encoding method but is prone to interference from other
sounds and thus has usability issues. Therefore, the beat rate encoding is concluded as
the method of choice.
(3) Placed Sounds
The category carries the most basic form of augmented reality audio. The virtual
auditory layer is composed of a collection of geo-tagged audio clips. As a participant
moves around on the site, he receives an audio stream dynamically rendered based on
his physical location. Behrendt had an artistic description of the category (2010):
"Mobile sound art artists curate the distribution of sound in space and participants
create their own version or remix of the piece by choosing their path through the
sounds. .... This category consists of works where the artist curates sounds in public
outdoor spaces and the audience experiences these works in situ. "
Krueger described the idea of automated audio tour based on augmented reality in
1991, but Bederson's automated tour guide is one of the earliest actual
implementations (1995). He commented that conventional taped tour guide makes
museum visit a less social experience since the tape is linear, pre-planned, and go at its
own pace. The goal of Automated Tour Guide is to augment a museum space so that
visitors can walk around the space at their desirable paces and hear the pre-recorded
commentary associated to a particular work of art. Infrared transmitters and receivers
are used to sense when a visitor walks into the proximity of a piece of art.
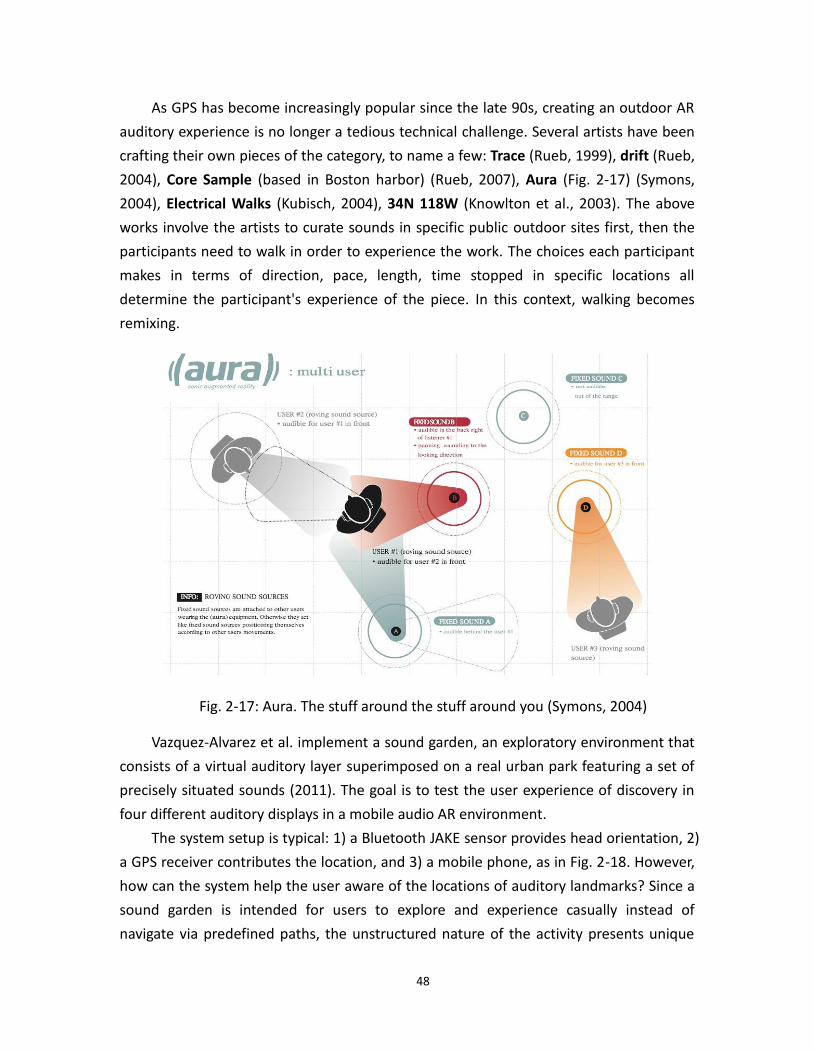
48
As GPS has become increasingly popular since the late 90s, creating an outdoor AR
auditory experience is no longer a tedious technical challenge. Several artists have been
crafting their own pieces of the category, to name a few: Trace (Rueb, 1999), drift (Rueb,
2004), Core Sample (based in Boston harbor) (Rueb, 2007), Aura (Fig. 2-17) (Symons,
2004), Electrical Walks (Kubisch, 2004), 34N 118W (Knowlton et al., 2003). The above
works involve the artists to curate sounds in specific public outdoor sites first, then the
participants need to walk in order to experience the work. The choices each participant
makes in terms of direction, pace, length, time stopped in specific locations all
determine the participant's experience of the piece. In this context, walking becomes
remixing.
Fig. 2-17: Aura. The stuff around the stuff around you (Symons, 2004)
Vazquez-Alvarez et al. implement a sound garden, an exploratory environment that
consists of a virtual auditory layer superimposed on a real urban park featuring a set of
precisely situated sounds (2011). The goal is to test the user experience of discovery in
four different auditory displays in a mobile audio AR environment.
The system setup is typical: 1) a Bluetooth JAKE sensor provides head orientation, 2)
a GPS receiver contributes the location, and 3) a mobile phone, as in Fig. 2-18. However,
how can the system help the user aware of the locations of auditory landmarks? Since a
sound garden is intended for users to explore and experience casually instead of
navigate via predefined paths, the unstructured nature of the activity presents unique
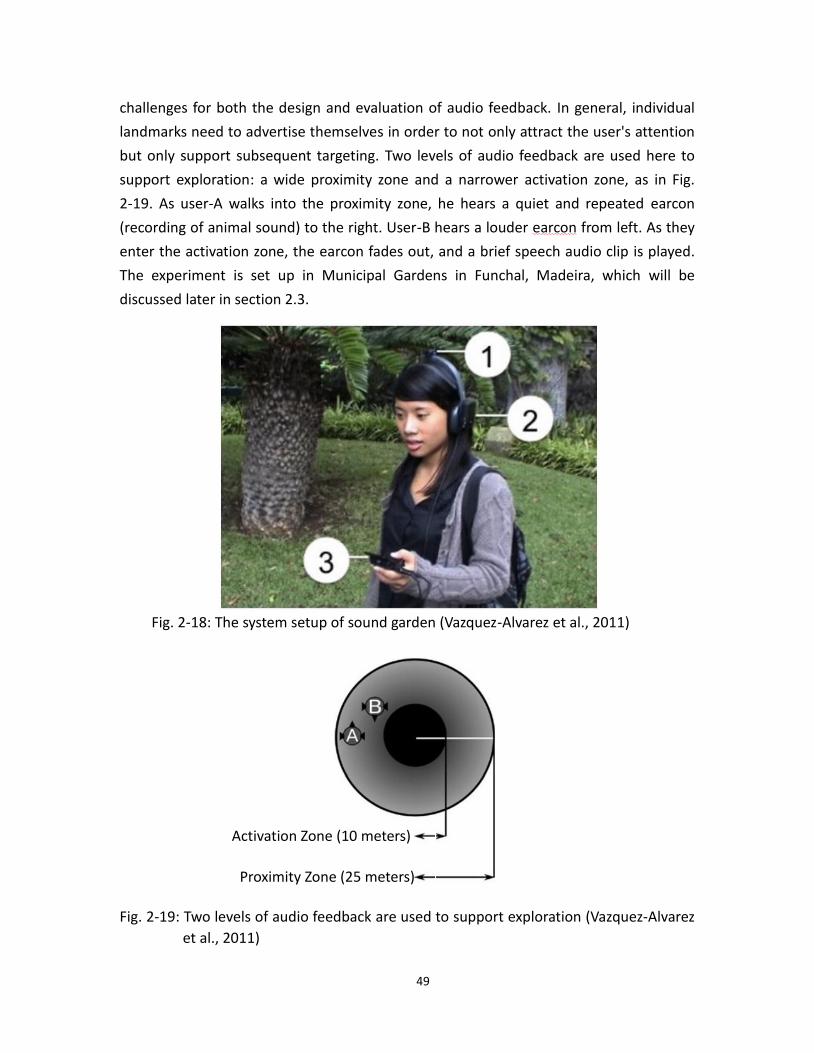
49
challenges for both the design and evaluation of audio feedback. In general, individual
landmarks need to advertise themselves in order to not only attract the user's attention
but only support subsequent targeting. Two levels of audio feedback are used here to
support exploration: a wide proximity zone and a narrower activation zone, as in Fig.
2-19. As user-A walks into the proximity zone, he hears a quiet and repeated earcon
(recording of animal sound) to the right. User-B hears a louder earcon from left. As they
enter the activation zone, the earcon fades out, and a brief speech audio clip is played.
The experiment is set up in Municipal Gardens in Funchal, Madeira, which will be
discussed later in section 2.3.
Fig. 2-18: The system setup of sound garden (Vazquez-Alvarez et al., 2011)
Fig. 2-19: Two levels of audio feedback are used to support exploration (Vazquez-Alvarez
et al., 2011)
Activation Zone (10 meters)
Proximity Zone (25 meters)
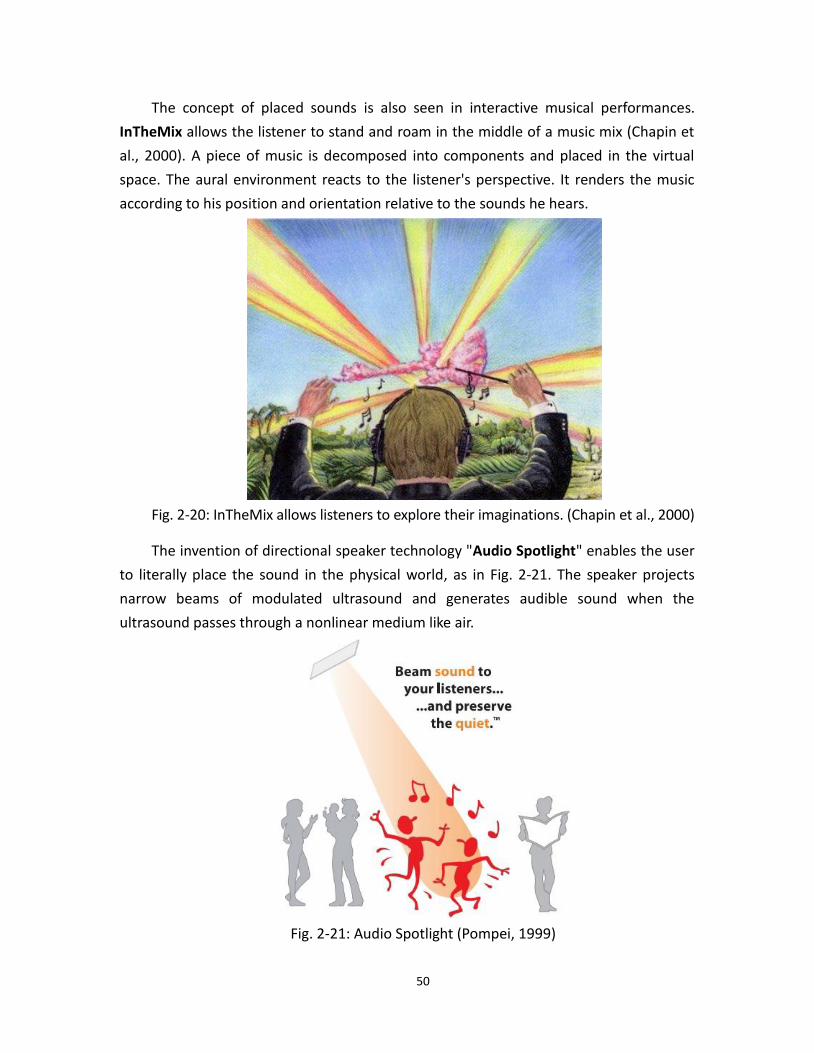
50
The concept of placed sounds is also seen in interactive musical performances.
InTheMix allows the listener to stand and roam in the middle of a music mix (Chapin et
al., 2000). A piece of music is decomposed into components and placed in the virtual
space. The aural environment reacts to the listener's perspective. It renders the music
according to his position and orientation relative to the sounds he hears.
Fig. 2-20: InTheMix allows listeners to explore their imaginations. (Chapin et al., 2000)
The invention of directional speaker technology "Audio Spotlight" enables the user
to literally place the sound in the physical world, as in Fig. 2-21. The speaker projects
narrow beams of modulated ultrasound and generates audible sound when the
ultrasound passes through a nonlinear medium like air.
Fig. 2-21: Audio Spotlight (Pompei, 1999)
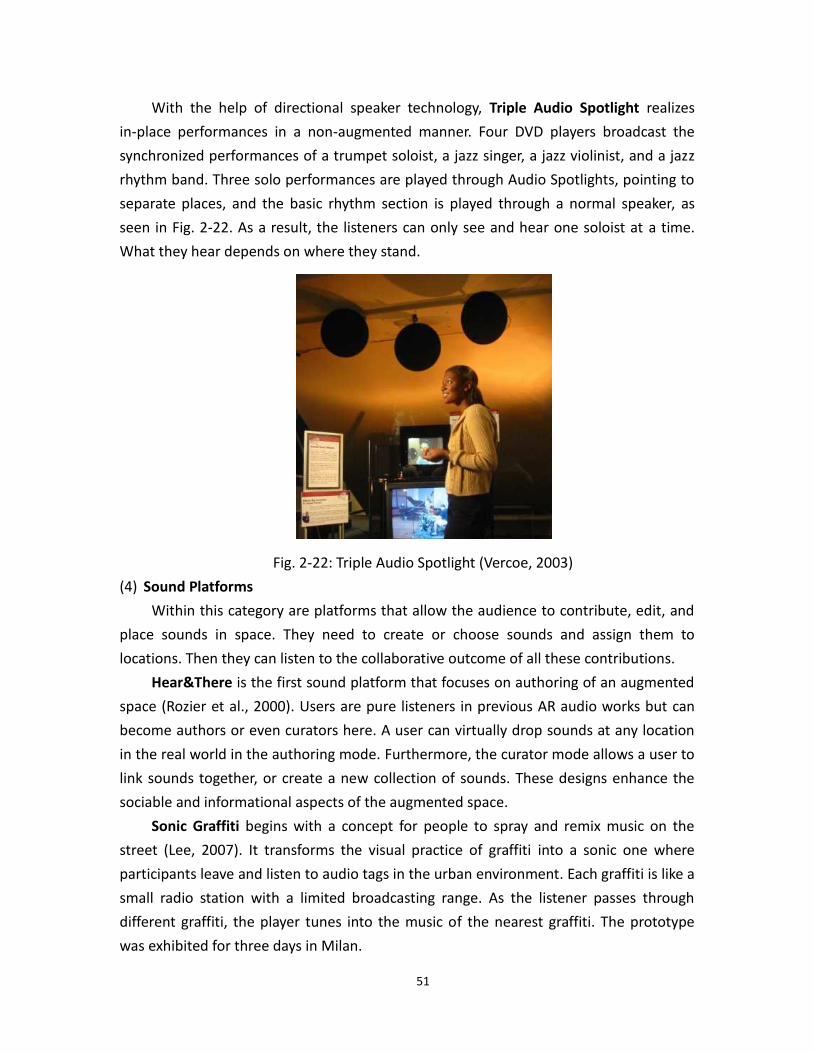
51
With the help of directional speaker technology, Triple Audio Spotlight realizes
in-place performances in a non-augmented manner. Four DVD players broadcast the
synchronized performances of a trumpet soloist, a jazz singer, a jazz violinist, and a jazz
rhythm band. Three solo performances are played through Audio Spotlights, pointing to
separate places, and the basic rhythm section is played through a normal speaker, as
seen in Fig. 2-22. As a result, the listeners can only see and hear one soloist at a time.
What they hear depends on where they stand.
Fig. 2-22: Triple Audio Spotlight (Vercoe, 2003)
(4) Sound Platforms
Within this category are platforms that allow the audience to contribute, edit, and
place sounds in space. They need to create or choose sounds and assign them to
locations. Then they can listen to the collaborative outcome of all these contributions.
Hear&There is the first sound platform that focuses on authoring of an augmented
space (Rozier et al., 2000). Users are pure listeners in previous AR audio works but can
become authors or even curators here. A user can virtually drop sounds at any location
in the real world in the authoring mode. Furthermore, the curator mode allows a user to
link sounds together, or create a new collection of sounds. These designs enhance the
sociable and informational aspects of the augmented space.
Sonic Graffiti begins with a concept for people to spray and remix music on the
street (Lee, 2007). It transforms the visual practice of graffiti into a sonic one where
participants leave and listen to audio tags in the urban environment. Each graffiti is like a
small radio station with a limited broadcasting range. As the listener passes through
different graffiti, the player tunes into the music of the nearest graffiti. The prototype
was exhibited for three days in Milan.
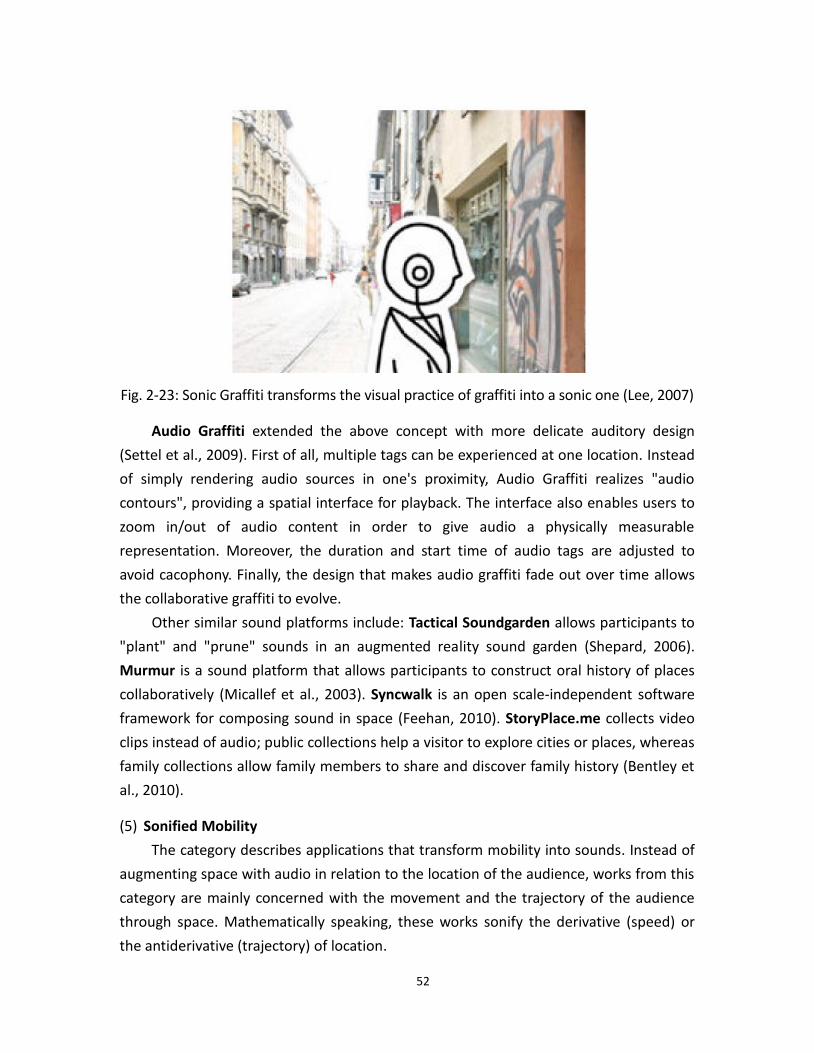
52
Fig. 2-23: Sonic Graffiti transforms the visual practice of graffiti into a sonic one (Lee, 2007)
Audio Graffiti extended the above concept with more delicate auditory design
(Settel et al., 2009). First of all, multiple tags can be experienced at one location. Instead
of simply rendering audio sources in one's proximity, Audio Graffiti realizes "audio
contours", providing a spatial interface for playback. The interface also enables users to
zoom in/out of audio content in order to give audio a physically measurable
representation. Moreover, the duration and start time of audio tags are adjusted to
avoid cacophony. Finally, the design that makes audio graffiti fade out over time allows
the collaborative graffiti to evolve.
Other similar sound platforms include: Tactical Soundgarden allows participants to
"plant" and "prune" sounds in an augmented reality sound garden (Shepard, 2006).
Murmur is a sound platform that allows participants to construct oral history of places
collaboratively (Micallef et al., 2003). Syncwalk is an open scale-independent software
framework for composing sound in space (Feehan, 2010). StoryPlace.me collects video
clips instead of audio; public collections help a visitor to explore cities or places, whereas
family collections allow family members to share and discover family history (Bentley et
al., 2010).
(5) Sonified Mobility
The category describes applications that transform mobility into sounds. Instead of
augmenting space with audio in relation to the location of the audience, works from this
category are mainly concerned with the movement and the trajectory of the audience
through space. Mathematically speaking, these works sonify the derivative (speed) or
the antiderivative (trajectory) of location.
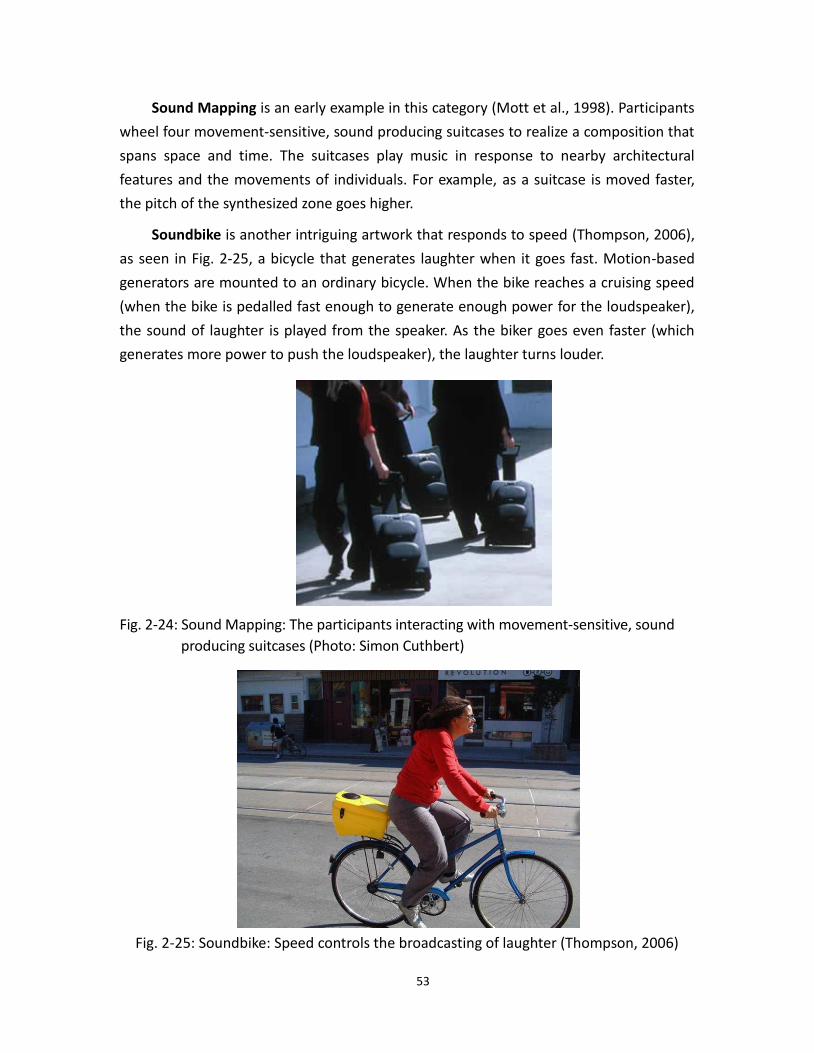
53
Sound Mapping is an early example in this category (Mott et al., 1998). Participants
wheel four movement-sensitive, sound producing suitcases to realize a composition that
spans space and time. The suitcases play music in response to nearby architectural
features and the movements of individuals. For example, as a suitcase is moved faster,
the pitch of the synthesized zone goes higher.
Soundbike is another intriguing artwork that responds to speed (Thompson, 2006),
as seen in Fig. 2-25, a bicycle that generates laughter when it goes fast. Motion-based
generators are mounted to an ordinary bicycle. When the bike reaches a cruising speed
(when the bike is pedalled fast enough to generate enough power for the loudspeaker),
the sound of laughter is played from the speaker. As the biker goes even faster (which
generates more power to push the loudspeaker), the laughter turns louder.
Fig. 2-24: Sound Mapping: The participants interacting with movement-sensitive, sound
producing suitcases (Photo: Simon Cuthbert)
Fig. 2-25: Soundbike: Speed controls the broadcasting of laughter (Thompson, 2006)
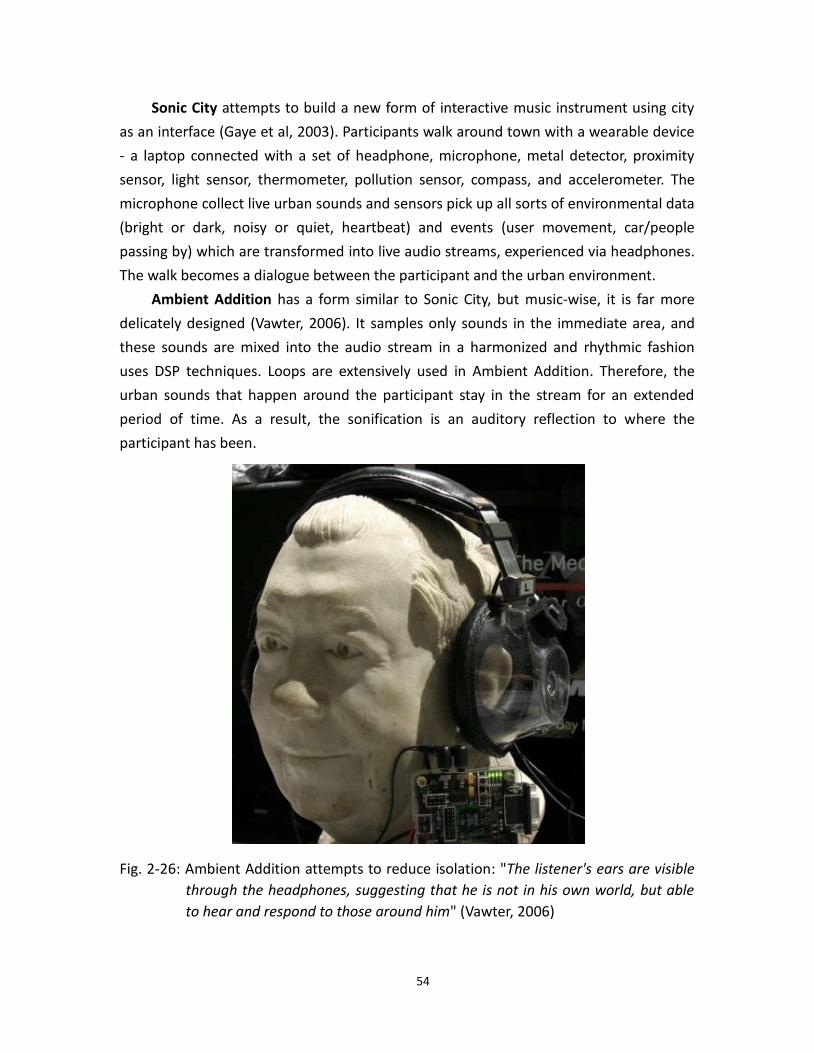
54
Sonic City attempts to build a new form of interactive music instrument using city
as an interface (Gaye et al, 2003). Participants walk around town with a wearable device
- a laptop connected with a set of headphone, microphone, metal detector, proximity
sensor, light sensor, thermometer, pollution sensor, compass, and accelerometer. The
microphone collect live urban sounds and sensors pick up all sorts of environmental data
(bright or dark, noisy or quiet, heartbeat) and events (user movement, car/people
passing by) which are transformed into live audio streams, experienced via headphones.
The walk becomes a dialogue between the participant and the urban environment.
Ambient Addition has a form similar to Sonic City, but music-wise, it is far more
delicately designed (Vawter, 2006). It samples only sounds in the immediate area, and
these sounds are mixed into the audio stream in a harmonized and rhythmic fashion
uses DSP techniques. Loops are extensively used in Ambient Addition. Therefore, the
urban sounds that happen around the participant stay in the stream for an extended
period of time. As a result, the sonification is an auditory reflection to where the
participant has been.
Fig. 2-26: Ambient Addition attempts to reduce isolation: "The listener's ears are visible
through the headphones, suggesting that he is not in his own world, but able
to hear and respond to those around him" (Vawter, 2006)
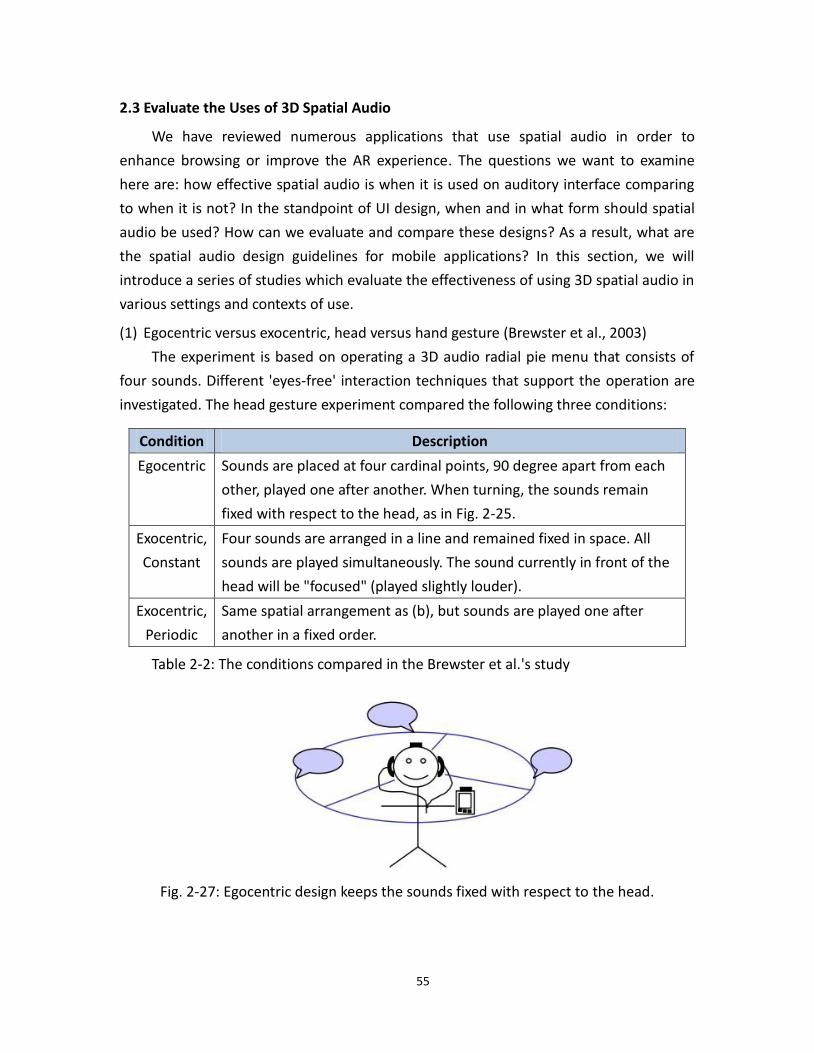
55
2.3 Evaluate the Uses of 3D Spatial Audio
We have reviewed numerous applications that use spatial audio in order to
enhance browsing or improve the AR experience. The questions we want to examine
here are: how effective spatial audio is when it is used on auditory interface comparing
to when it is not? In the standpoint of UI design, when and in what form should spatial
audio be used? How can we evaluate and compare these designs? As a result, what are
the spatial audio design guidelines for mobile applications? In this section, we will
introduce a series of studies which evaluate the effectiveness of using 3D spatial audio in
various settings and contexts of use.
(1) Egocentric versus exocentric, head versus hand gesture (Brewster et al., 2003)
The experiment is based on operating a 3D audio radial pie menu that consists of
four sounds. Different 'eyes-free' interaction techniques that support the operation are
investigated. The head gesture experiment compared the following three conditions:
Condition Description
Egocentric Sounds are placed at four cardinal points, 90 degree apart from each
other, played one after another. When turning, the sounds remain
fixed with respect to the head, as in Fig. 2-25.
Exocentric,
Constant
Four sounds are arranged in a line and remained fixed in space. All
sounds are played simultaneously. The sound currently in front of the
head will be "focused" (played slightly louder).
Exocentric,
Periodic
Same spatial arrangement as (b), but sounds are played one after
another in a fixed order.
Table 2-2: The conditions compared in the Brewster et al.'s study
Fig. 2-27: Egocentric design keeps the sounds fixed with respect to the head.
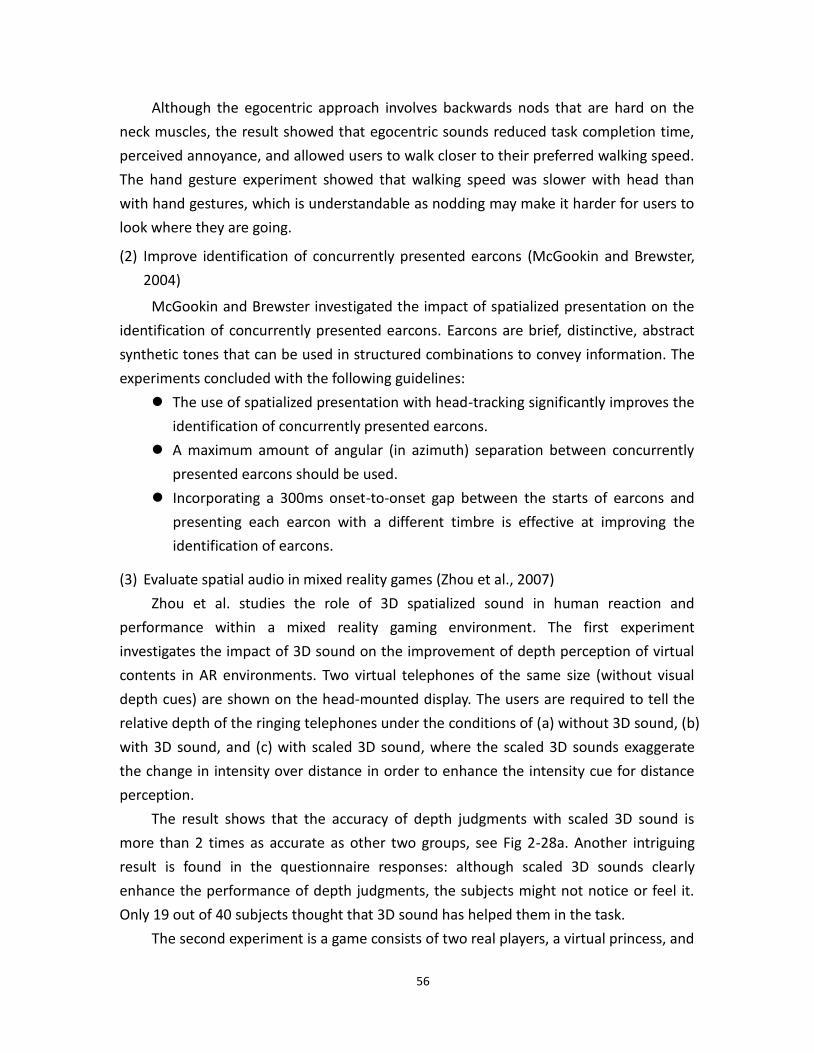
56
Although the egocentric approach involves backwards nods that are hard on the
neck muscles, the result showed that egocentric sounds reduced task completion time,
perceived annoyance, and allowed users to walk closer to their preferred walking speed.
The hand gesture experiment showed that walking speed was slower with head than
with hand gestures, which is understandable as nodding may make it harder for users to
look where they are going.
(2) Improve identification of concurrently presented earcons (McGookin and Brewster,
2004)
McGookin and Brewster investigated the impact of spatialized presentation on the
identification of concurrently presented earcons. Earcons are brief, distinctive, abstract
synthetic tones that can be used in structured combinations to convey information. The
experiments concluded with the following guidelines:
The use of spatialized presentation with head-tracking significantly improves the
identification of concurrently presented earcons.
A maximum amount of angular (in azimuth) separation between concurrently
presented earcons should be used.
Incorporating a 300ms onset-to-onset gap between the starts of earcons and
presenting each earcon with a different timbre is effective at improving the
identification of earcons.
(3) Evaluate spatial audio in mixed reality games (Zhou et al., 2007)
Zhou et al. studies the role of 3D spatialized sound in human reaction and
performance within a mixed reality gaming environment. The first experiment
investigates the impact of 3D sound on the improvement of depth perception of virtual
contents in AR environments. Two virtual telephones of the same size (without visual
depth cues) are shown on the head-mounted display. The users are required to tell the
relative depth of the ringing telephones under the conditions of (a) without 3D sound, (b)
with 3D sound, and (c) with scaled 3D sound, where the scaled 3D sounds exaggerate
the change in intensity over distance in order to enhance the intensity cue for distance
perception.
The result shows that the accuracy of depth judgments with scaled 3D sound is
more than 2 times as accurate as other two groups, see Fig 2-28a. Another intriguing
result is found in the questionnaire responses: although scaled 3D sounds clearly
enhance the performance of depth judgments, the subjects might not notice or feel it.
Only 19 out of 40 subjects thought that 3D sound has helped them in the task.
The second experiment is a game consists of two real players, a virtual princess, and
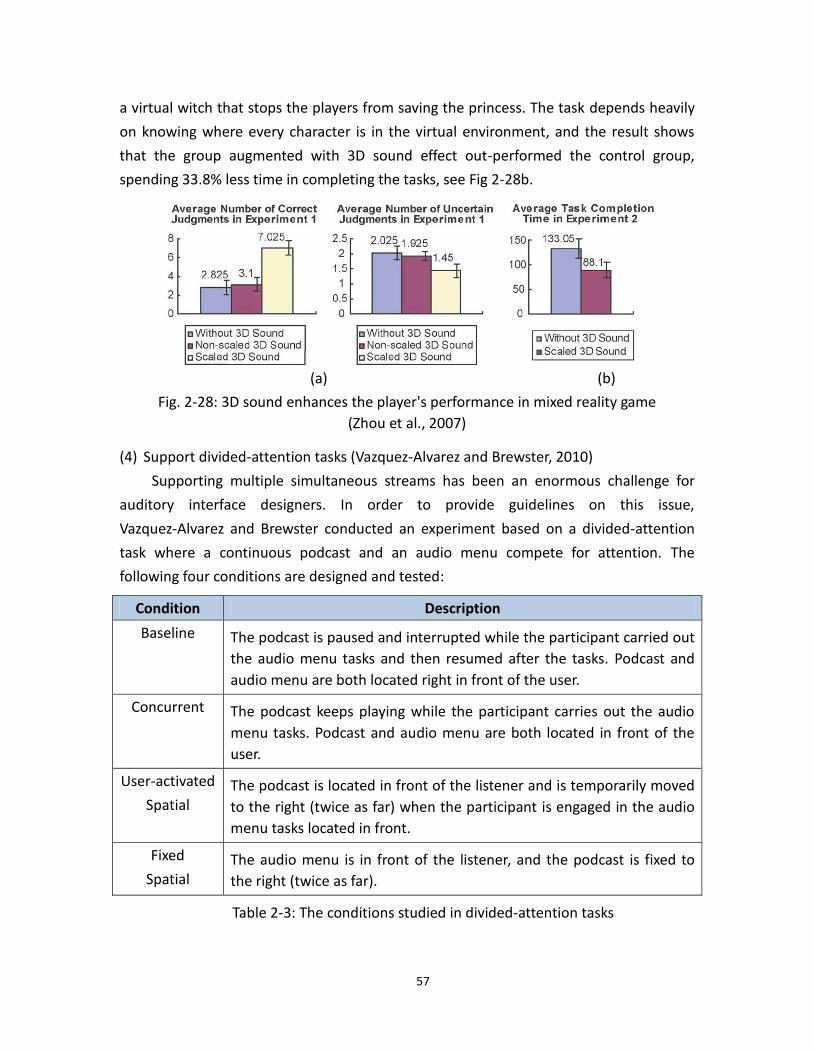
57
a virtual witch that stops the players from saving the princess. The task depends heavily
on knowing where every character is in the virtual environment, and the result shows
that the group augmented with 3D sound effect out-performed the control group,
spending 33.8% less time in completing the tasks, see Fig 2-28b.
(a) (b)
Fig. 2-28: 3D sound enhances the player's performance in mixed reality game
(Zhou et al., 2007)
(4) Support divided-attention tasks (Vazquez-Alvarez and Brewster, 2010)
Supporting multiple simultaneous streams has been an enormous challenge for
auditory interface designers. In order to provide guidelines on this issue,
Vazquez-Alvarez and Brewster conducted an experiment based on a divided-attention
task where a continuous podcast and an audio menu compete for attention. The
following four conditions are designed and tested:
Condition Description
Baseline The podcast is paused and interrupted while the participant carried out
the audio menu tasks and then resumed after the tasks. Podcast and
audio menu are both located right in front of the user.
Concurrent The podcast keeps playing while the participant carries out the audio
menu tasks. Podcast and audio menu are both located in front of the
user.
User-activated
Spatial The podcast is located in front of the listener and is temporarily moved
to the right (twice as far) when the participant is engaged in the audio
menu tasks located in front.
Fixed
Spatial The audio menu is in front of the listener, and the podcast is fixed to
the right (twice as far).
Table 2-3: The conditions studied in divided-attention tasks
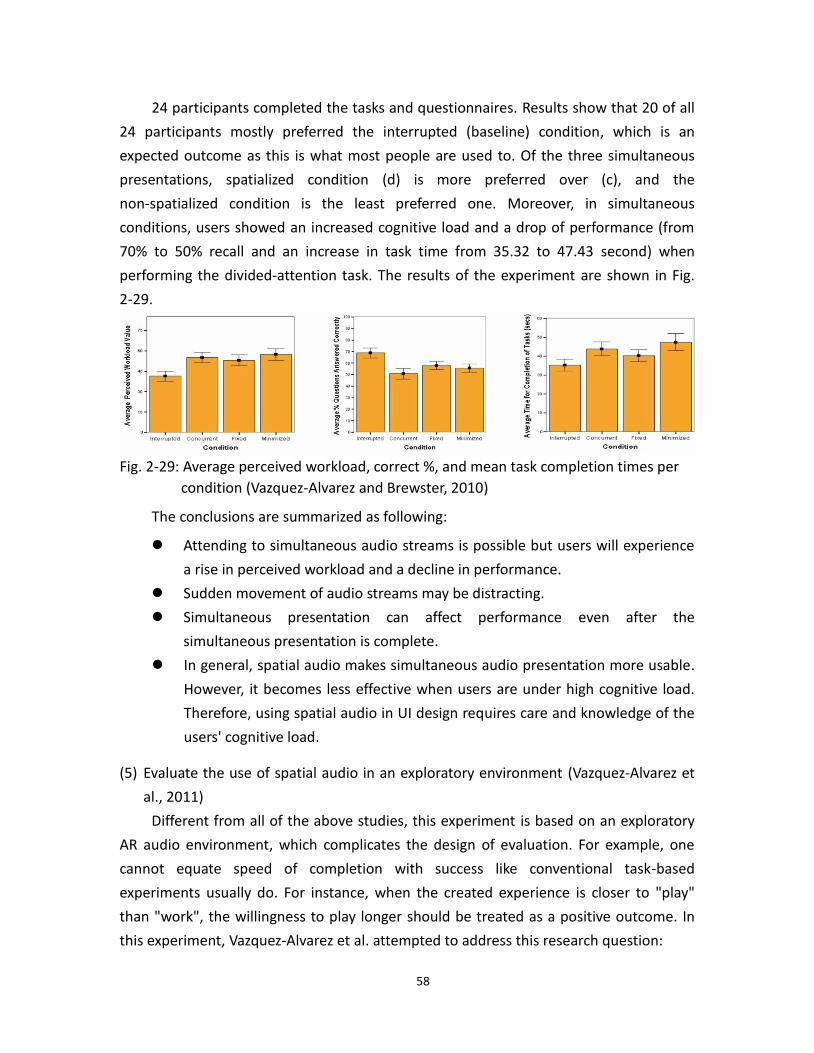
58
24 participants completed the tasks and questionnaires. Results show that 20 of all
24 participants mostly preferred the interrupted (baseline) condition, which is an
expected outcome as this is what most people are used to. Of the three simultaneous
presentations, spatialized condition (d) is more preferred over (c), and the
non-spatialized condition is the least preferred one. Moreover, in simultaneous
conditions, users showed an increased cognitive load and a drop of performance (from
70% to 50% recall and an increase in task time from 35.32 to 47.43 second) when
performing the divided-attention task. The results of the experiment are shown in Fig.
2-29.
Fig. 2-29: Average perceived workload, correct %, and mean task completion times per
condition (Vazquez-Alvarez and Brewster, 2010)
The conclusions are summarized as following:
Attending to simultaneous audio streams is possible but users will experience
a rise in perceived workload and a decline in performance.
Sudden movement of audio streams may be distracting.
Simultaneous presentation can affect performance even after the
simultaneous presentation is complete.
In general, spatial audio makes simultaneous audio presentation more usable.
However, it becomes less effective when users are under high cognitive load.
Therefore, using spatial audio in UI design requires care and knowledge of the
users' cognitive load.
(5) Evaluate the use of spatial audio in an exploratory environment (Vazquez-Alvarez et
al., 2011)
Different from all of the above studies, this experiment is based on an exploratory
AR audio environment, which complicates the design of evaluation. For example, one
cannot equate speed of completion with success like conventional task-based
experiments usually do. For instance, when the created experience is closer to "play"
than "work", the willingness to play longer should be treated as a positive outcome. In
this experiment, Vazquez-Alvarez et al. attempted to address this research question:
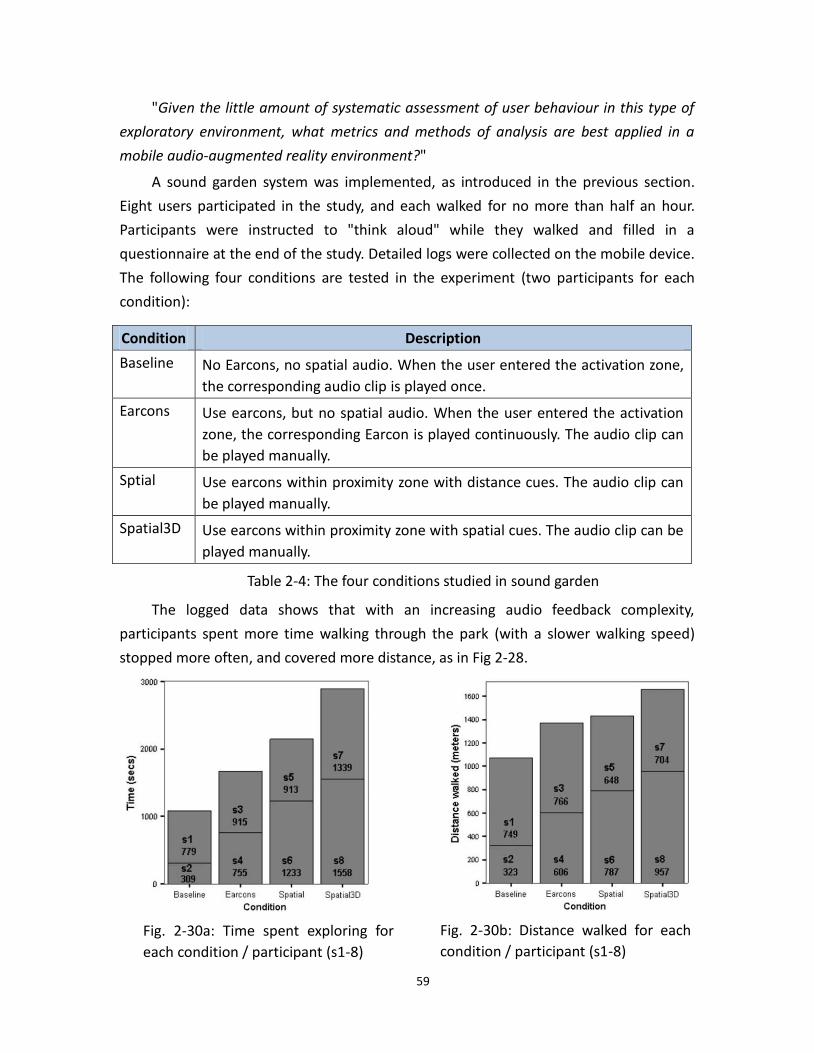
59
"Given the little amount of systematic assessment of user behaviour in this type of
exploratory environment, what metrics and methods of analysis are best applied in a
mobile audio-augmented reality environment?"
A sound garden system was implemented, as introduced in the previous section.
Eight users participated in the study, and each walked for no more than half an hour.
Participants were instructed to "think aloud" while they walked and filled in a
questionnaire at the end of the study. Detailed logs were collected on the mobile device.
The following four conditions are tested in the experiment (two participants for each
condition):
Condition Description
Baseline No Earcons, no spatial audio. When the user entered the activation zone,
the corresponding audio clip is played once.
Earcons Use earcons, but no spatial audio. When the user entered the activation
zone, the corresponding Earcon is played continuously. The audio clip can
be played manually.
Sptial Use earcons within proximity zone with distance cues. The audio clip can
be played manually.
Spatial3D Use earcons within proximity zone with spatial cues. The audio clip can be
played manually.
Table 2-4: The four conditions studied in sound garden
The logged data shows that with an increasing audio feedback complexity,
participants spent more time walking through the park (with a slower walking speed)
stopped more often, and covered more distance, as in Fig 2-28.
Fig. 2-30a: Time spent exploring for
each condition / participant (s1-8)
Fig. 2-30b: Distance walked for each
condition / participant (s1-8)
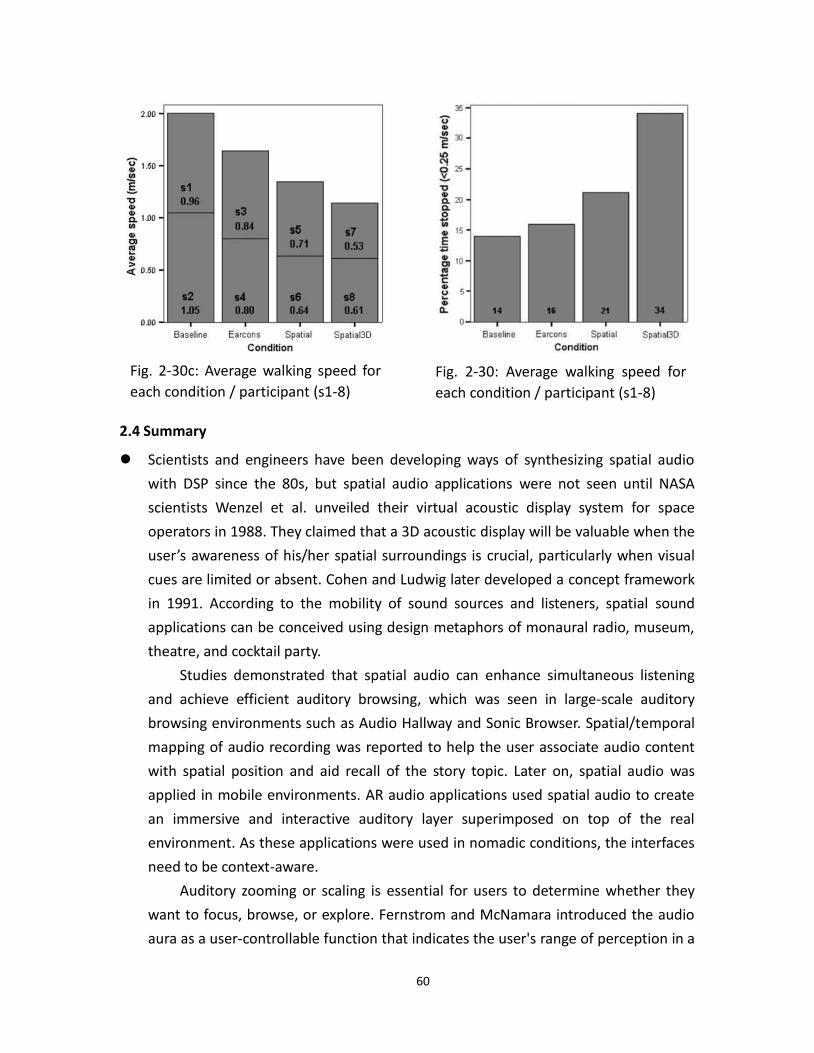
60
2.4 Summary
Scientists and engineers have been developing ways of synthesizing spatial audio
with DSP since the 80s, but spatial audio applications were not seen until NASA
scientists Wenzel et al. unveiled their virtual acoustic display system for space
operators in 1988. They claimed that a 3D acoustic display will be valuable when the
user’s awareness of his/her spatial surroundings is crucial, particularly when visual
cues are limited or absent. Cohen and Ludwig later developed a concept framework
in 1991. According to the mobility of sound sources and listeners, spatial sound
applications can be conceived using design metaphors of monaural radio, museum,
theatre, and cocktail party.
Studies demonstrated that spatial audio can enhance simultaneous listening
and achieve efficient auditory browsing, which was seen in large-scale auditory
browsing environments such as Audio Hallway and Sonic Browser. Spatial/temporal
mapping of audio recording was reported to help the user associate audio content
with spatial position and aid recall of the story topic. Later on, spatial audio was
applied in mobile environments. AR audio applications used spatial audio to create
an immersive and interactive auditory layer superimposed on top of the real
environment. As these applications were used in nomadic conditions, the interfaces
need to be context-aware.
Auditory zooming or scaling is essential for users to determine whether they
want to focus, browse, or explore. Fernstrom and McNamara introduced the audio
aura as a user-controllable function that indicates the user's range of perception in a
Fig. 2-30c: Average walking speed for
each condition / participant (s1-8)
Fig. 2-30: Average walking speed for
each condition / participant (s1-8)
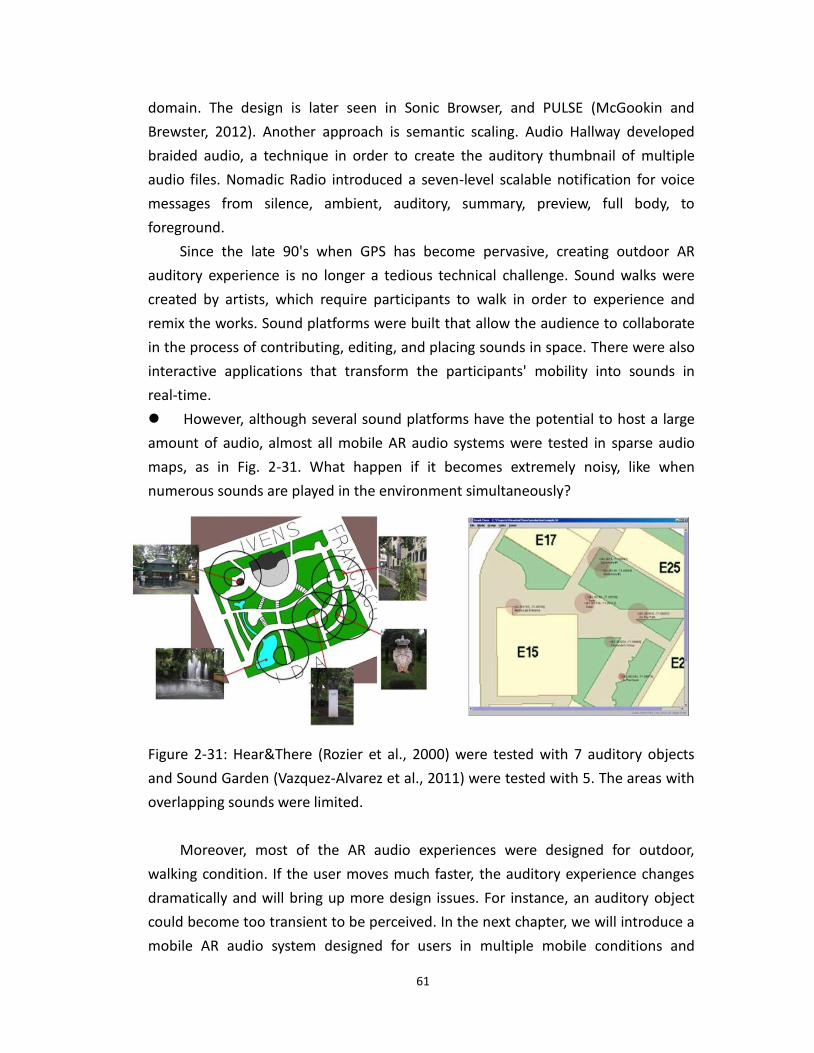
61
domain. The design is later seen in Sonic Browser, and PULSE (McGookin and
Brewster, 2012). Another approach is semantic scaling. Audio Hallway developed
braided audio, a technique in order to create the auditory thumbnail of multiple
audio files. Nomadic Radio introduced a seven-level scalable notification for voice
messages from silence, ambient, auditory, summary, preview, full body, to
foreground.
Since the late 90's when GPS has become pervasive, creating outdoor AR
auditory experience is no longer a tedious technical challenge. Sound walks were
created by artists, which require participants to walk in order to experience and
remix the works. Sound platforms were built that allow the audience to collaborate
in the process of contributing, editing, and placing sounds in space. There were also
interactive applications that transform the participants' mobility into sounds in
real-time.
However, although several sound platforms have the potential to host a large
amount of audio, almost all mobile AR audio systems were tested in sparse audio
maps, as in Fig. 2-31. What happen if it becomes extremely noisy, like when
numerous sounds are played in the environment simultaneously?
Figure 2-31: Hear&There (Rozier et al., 2000) were tested with 7 auditory objects
and Sound Garden (Vazquez-Alvarez et al., 2011) were tested with 5. The areas with
overlapping sounds were limited.
Moreover, most of the AR audio experiences were designed for outdoor,
walking condition. If the user moves much faster, the auditory experience changes
dramatically and will bring up more design issues. For instance, an auditory object
could become too transient to be perceived. In the next chapter, we will introduce a
mobile AR audio system designed for users in multiple mobile conditions and
62
various scales. We will also demonstrate an indoor AR audio application based on a
geomagnetic-based positioning system.
A series of studies which evaluate the effectiveness of using 3D spatial audio in
various settings and contexts of use was introduced. The results suggested that
spatial audio does make simultaneous audio presentation more usable. However, it
becomes less effective when users are under high cognitive load and can affect
performance event after the simultaneous presentation is complete. In addition,
sudden, unexpected movement of audio streams may be distracting and should be
avoided.
We reviewed Vazquez-Alvarez's sound garden experiment in detail as we also
attempt to develop an exploratory AR audio environment. The study combined user
feedback obtained in think aloud protocol and detailed logs collected on the mobile
device and provided insightful analysis.
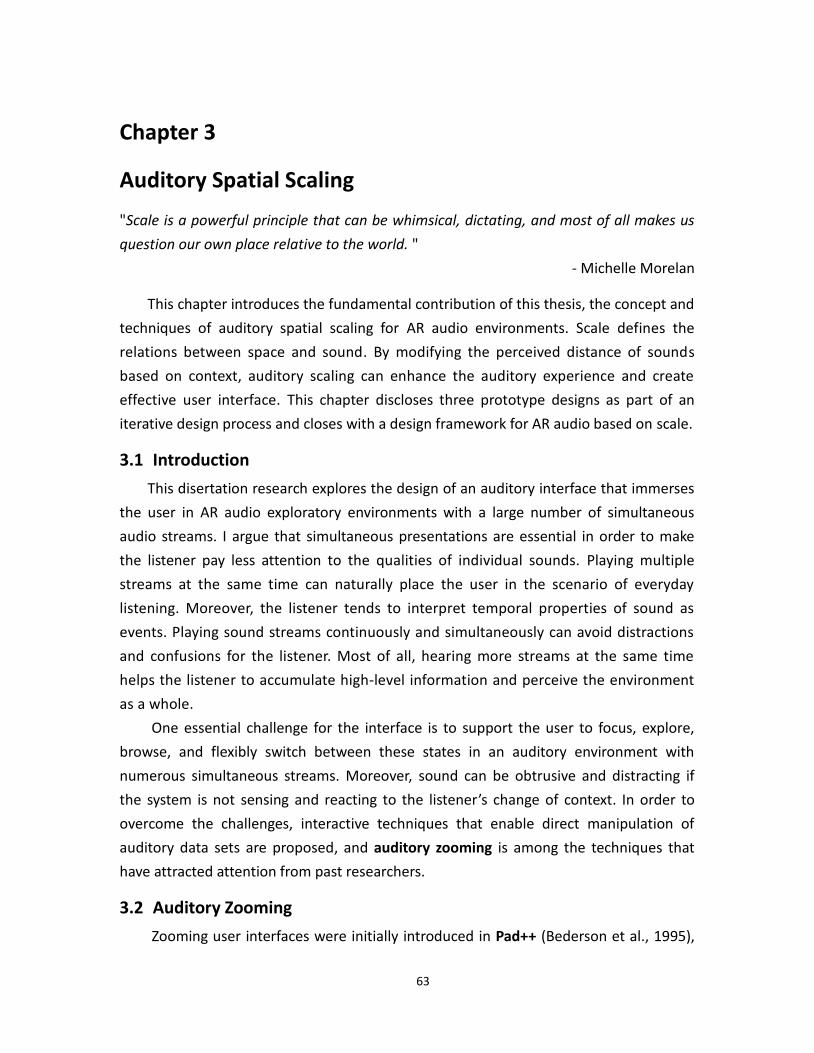
63
Chapter 3
Auditory Spatial Scaling
"Scale is a powerful principle that can be whimsical, dictating, and most of all makes us
question our own place relative to the world. "
- Michelle Morelan
This chapter introduces the fundamental contribution of this thesis, the concept and
techniques of auditory spatial scaling for AR audio environments. Scale defines the
relations between space and sound. By modifying the perceived distance of sounds
based on context, auditory scaling can enhance the auditory experience and create
effective user interface. This chapter discloses three prototype designs as part of an
iterative design process and closes with a design framework for AR audio based on scale.
3.1 Introduction
This disertation research explores the design of an auditory interface that immerses
the user in AR audio exploratory environments with a large number of simultaneous
audio streams. I argue that simultaneous presentations are essential in order to make
the listener pay less attention to the qualities of individual sounds. Playing multiple
streams at the same time can naturally place the user in the scenario of everyday
listening. Moreover, the listener tends to interpret temporal properties of sound as
events. Playing sound streams continuously and simultaneously can avoid distractions
and confusions for the listener. Most of all, hearing more streams at the same time
helps the listener to accumulate high-level information and perceive the environment
as a whole.
One essential challenge for the interface is to support the user to focus, explore,
browse, and flexibly switch between these states in an auditory environment with
numerous simultaneous streams. Moreover, sound can be obtrusive and distracting if
the system is not sensing and reacting to the listener’s change of context. In order to
overcome the challenges, interactive techniques that enable direct manipulation of
auditory data sets are proposed, and auditory zooming is among the techniques that
have attracted attention from past researchers.
3.2 Auditory Zooming
Zooming user interfaces were initially introduced in Pad++ (Bederson et al., 1995),
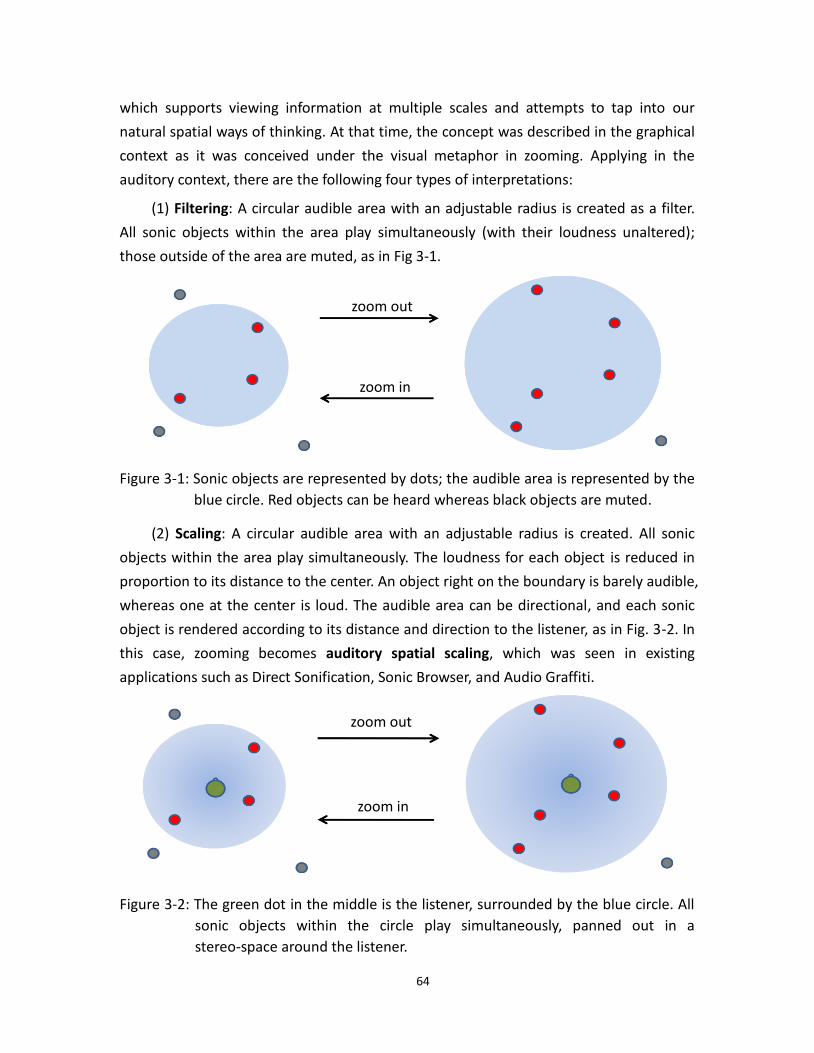
64
which supports viewing information at multiple scales and attempts to tap into our
natural spatial ways of thinking. At that time, the concept was described in the graphical
context as it was conceived under the visual metaphor in zooming. Applying in the
auditory context, there are the following four types of interpretations:
(1) Filtering: A circular audible area with an adjustable radius is created as a filter.
All sonic objects within the area play simultaneously (with their loudness unaltered);
those outside of the area are muted, as in Fig 3-1.
Figure 3-1: Sonic objects are represented by dots; the audible area is represented by the
blue circle. Red objects can be heard whereas black objects are muted.
(2) Scaling: A circular audible area with an adjustable radius is created. All sonic
objects within the area play simultaneously. The loudness for each object is reduced in
proportion to its distance to the center. An object right on the boundary is barely audible,
whereas one at the center is loud. The audible area can be directional, and each sonic
object is rendered according to its distance and direction to the listener, as in Fig. 3-2. In
this case, zooming becomes auditory spatial scaling, which was seen in existing
applications such as Direct Sonification, Sonic Browser, and Audio Graffiti.
Figure 3-2: The green dot in the middle is the listener, surrounded by the blue circle. All
sonic objects within the circle play simultaneously, panned out in a
stereo-space around the listener.
zoom out
zoom in
zoom out
zoom in
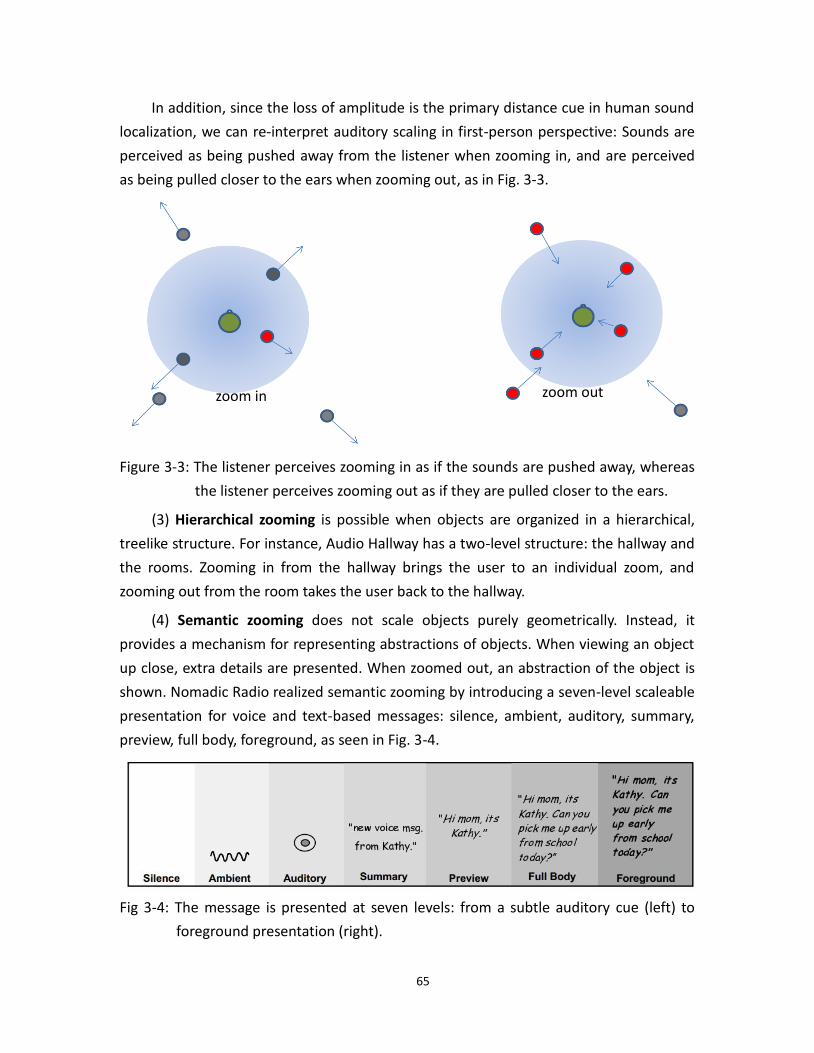
65
In addition, since the loss of amplitude is the primary distance cue in human sound
localization, we can re-interpret auditory scaling in first-person perspective: Sounds are
perceived as being pushed away from the listener when zooming in, and are perceived
as being pulled closer to the ears when zooming out, as in Fig. 3-3.
Figure 3-3: The listener perceives zooming in as if the sounds are pushed away, whereas
the listener perceives zooming out as if they are pulled closer to the ears.
(3) Hierarchical zooming is possible when objects are organized in a hierarchical,
treelike structure. For instance, Audio Hallway has a two-level structure: the hallway and
the rooms. Zooming in from the hallway brings the user to an individual zoom, and
zooming out from the room takes the user back to the hallway.
(4) Semantic zooming does not scale objects purely geometrically. Instead, it
provides a mechanism for representing abstractions of objects. When viewing an object
up close, extra details are presented. When zoomed out, an abstraction of the object is
shown. Nomadic Radio realized semantic zooming by introducing a seven-level scaleable
presentation for voice and text-based messages: silence, ambient, auditory, summary,
preview, full body, foreground, as seen in Fig. 3-4.
Fig 3-4: The message is presented at seven levels: from a subtle auditory cue (left) to
foreground presentation (right).
zoom out zoom in

66
Although various auditory zooming techniques have been explored in the past,
these interfaces were tested in sparse audio maps. How can these techniques adapt to
environments with a large number of sounds? In this dissertation research, I will focus
on auditory spatial scaling. It can be designed to stretch the scale linearly or nonlinearly,
and the technique enables the user or system to adjust the spatial density of perceived
sounds according to the context. I applied the scaling technique in three preliminary
projects in order to refine the design. After three iterations, I will summarize auditory
spatial scaling in a design framework. Lastly, in the rest of the document, auditory
spatial scaling will be sometimes abbreviated as zooming or scaling.
3.3 Design Principles
Immersive
The system creates an immersive AR audio environment filled with numerous
simultaneous audio streams. The environment uses spatial audio but not the Doppler
effect because it is inappropriate to change the pitch of music.
Nonstop
There is no activation zone. All audio streams will be (virtually) playing at all time.
There is no wall in the auditory environment, and hence there is no reverberation.
Just Zoom
Other than typical AR user interactions such as moving or head-turning, zooming
(scaling) is the only user interaction in the application.
3.4 The First Iteration - Musicscape
3.4.1 Project Overview
Modern portable music players enable us to listen to music anywhere we go. Being
able to listen to our chosen music allow us to carry the auditory identities in our hands
as we move from one place to another. It transforms the mundane daily experience into
one of personal meaning (Bull, 2006). However, it also creates many isolated auditory
bubbles which hinder normal social interactions.
What happens if we can hear all the music that is playing around us? When
someone passes by, we can feel that a piece of music comes into and then fades out
from our ears. When we walk into a big crowd, we hear a loud cacophony. To be able to
find treasure within a huge mixture of music, we want to zoom in so that we can
concentrate and not be overwhelmed by the traffic of music. We can also zoom out if we
just want to feel the flow of music.
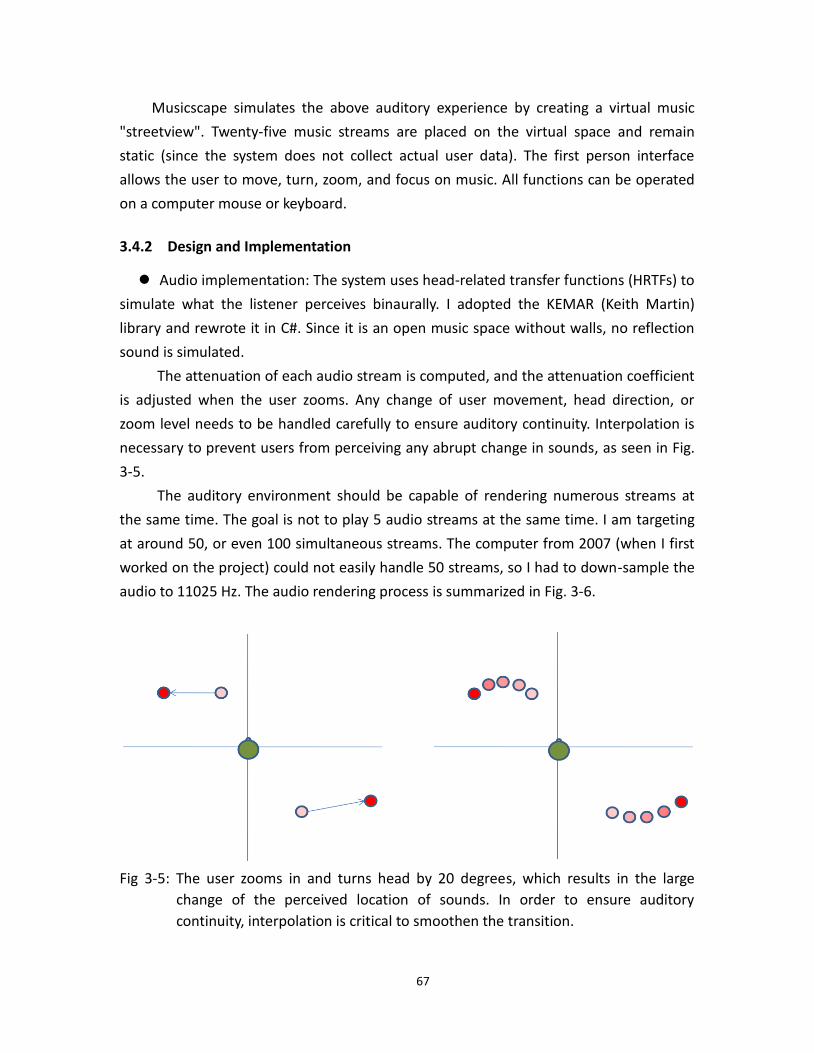
67
Musicscape simulates the above auditory experience by creating a virtual music
"streetview". Twenty-five music streams are placed on the virtual space and remain
static (since the system does not collect actual user data). The first person interface
allows the user to move, turn, zoom, and focus on music. All functions can be operated
on a computer mouse or keyboard.
3.4.2 Design and Implementation
Audio implementation: The system uses head-related transfer functions (HRTFs) to
simulate what the listener perceives binaurally. I adopted the KEMAR (Keith Martin)
library and rewrote it in C#. Since it is an open music space without walls, no reflection
sound is simulated.
The attenuation of each audio stream is computed, and the attenuation coefficient
is adjusted when the user zooms. Any change of user movement, head direction, or
zoom level needs to be handled carefully to ensure auditory continuity. Interpolation is
necessary to prevent users from perceiving any abrupt change in sounds, as seen in Fig.
3-5.
The auditory environment should be capable of rendering numerous streams at
the same time. The goal is not to play 5 audio streams at the same time. I am targeting
at around 50, or even 100 simultaneous streams. The computer from 2007 (when I first
worked on the project) could not easily handle 50 streams, so I had to down-sample the
audio to 11025 Hz. The audio rendering process is summarized in Fig. 3-6.
Fig 3-5: The user zooms in and turns head by 20 degrees, which results in the large
change of the perceived location of sounds. In order to ensure auditory
continuity, interpolation is critical to smoothen the transition.
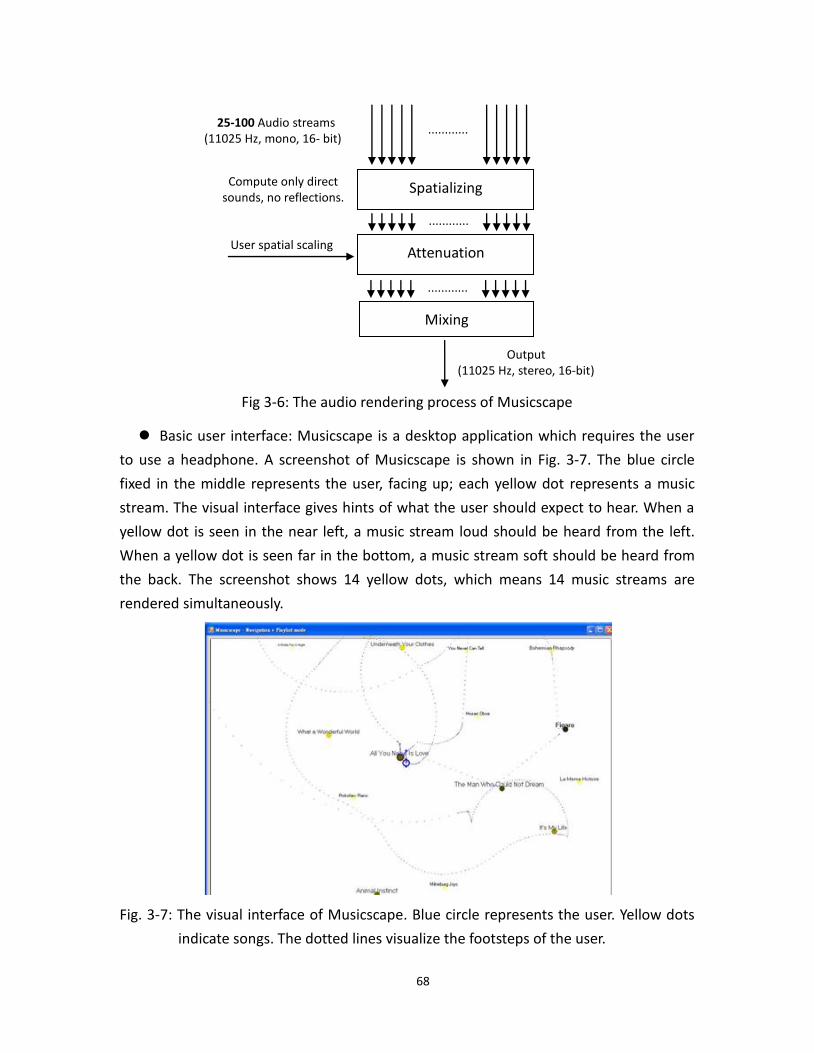
68
Fig 3-6: The audio rendering process of Musicscape
Basic user interface: Musicscape is a desktop application which requires the user
to use a headphone. A screenshot of Musicscape is shown in Fig. 3-7. The blue circle
fixed in the middle represents the user, facing up; each yellow dot represents a music
stream. The visual interface gives hints of what the user should expect to hear. When a
yellow dot is seen in the near left, a music stream loud should be heard from the left.
When a yellow dot is seen far in the bottom, a music stream soft should be heard from
the back. The screenshot shows 14 yellow dots, which means 14 music streams are
rendered simultaneously.
Fig. 3-7: The visual interface of Musicscape. Blue circle represents the user. Yellow dots
indicate songs. The dotted lines visualize the footsteps of the user.
Mixing
Attenuation
25-100 Audio streams (11025 Hz, mono, 16- bit)
Compute only direct sounds, no reflections.
Spatializing
User spatial scaling
Output (11025 Hz, stereo, 16-bit)
............
............
............
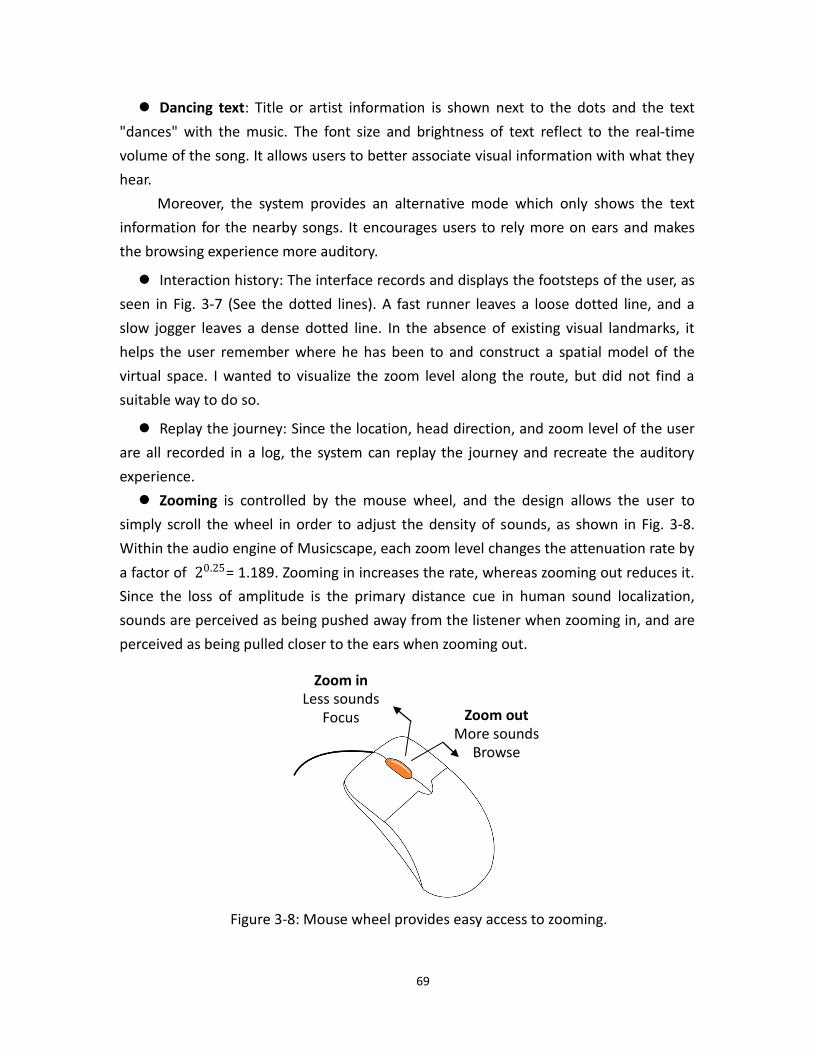
69
Dancing text: Title or artist information is shown next to the dots and the text
"dances" with the music. The font size and brightness of text reflect to the real-time
volume of the song. It allows users to better associate visual information with what they
hear.
Moreover, the system provides an alternative mode which only shows the text
information for the nearby songs. It encourages users to rely more on ears and makes
the browsing experience more auditory.
Interaction history: The interface records and displays the footsteps of the user, as
seen in Fig. 3-7 (See the dotted lines). A fast runner leaves a loose dotted line, and a
slow jogger leaves a dense dotted line. In the absence of existing visual landmarks, it
helps the user remember where he has been to and construct a spatial model of the
virtual space. I wanted to visualize the zoom level along the route, but did not find a
suitable way to do so.
Replay the journey: Since the location, head direction, and zoom level of the user
are all recorded in a log, the system can replay the journey and recreate the auditory
experience.
Zooming is controlled by the mouse wheel, and the design allows the user to
simply scroll the wheel in order to adjust the density of sounds, as shown in Fig. 3-8.
Within the audio engine of Musicscape, each zoom level changes the attenuation rate by
a factor of 20.25= 1.189. Zooming in increases the rate, whereas zooming out reduces it.
Since the loss of amplitude is the primary distance cue in human sound localization,
sounds are perceived as being pushed away from the listener when zooming in, and are
perceived as being pulled closer to the ears when zooming out.
Figure 3-8: Mouse wheel provides easy access to zooming.
Zoom in Less sounds
Focus Zoom out More sounds
Browse
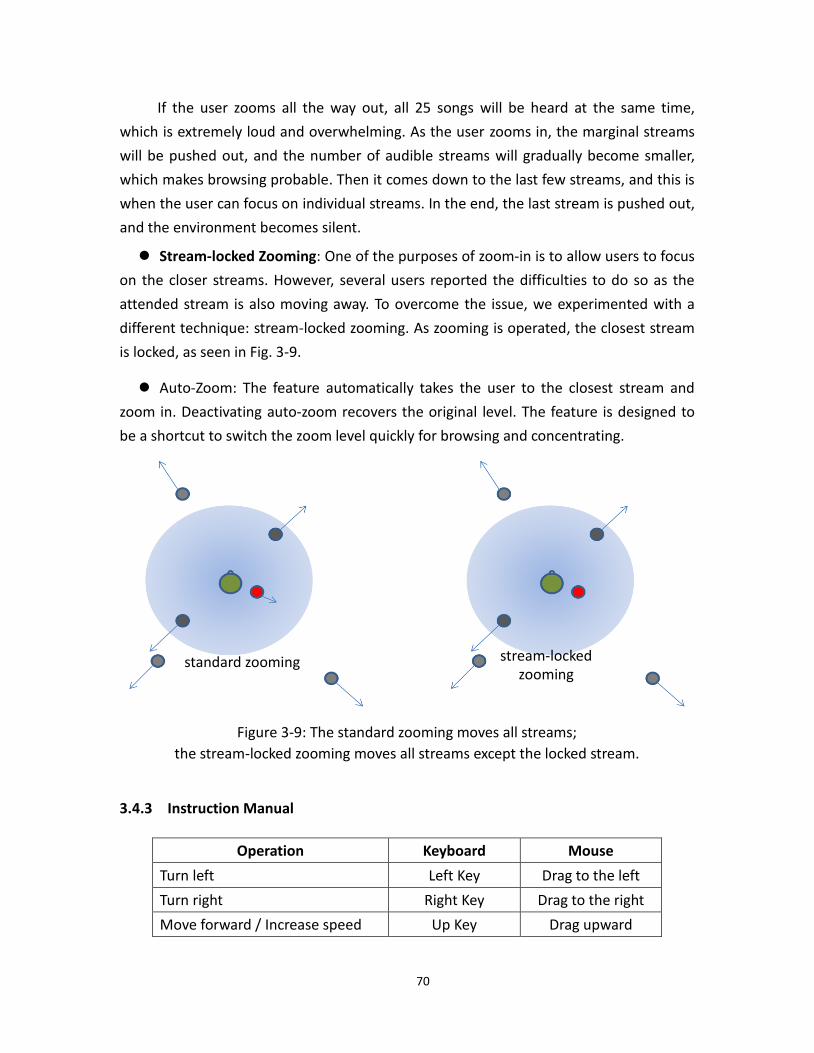
70
If the user zooms all the way out, all 25 songs will be heard at the same time,
which is extremely loud and overwhelming. As the user zooms in, the marginal streams
will be pushed out, and the number of audible streams will gradually become smaller,
which makes browsing probable. Then it comes down to the last few streams, and this is
when the user can focus on individual streams. In the end, the last stream is pushed out,
and the environment becomes silent.
Stream-locked Zooming: One of the purposes of zoom-in is to allow users to focus
on the closer streams. However, several users reported the difficulties to do so as the
attended stream is also moving away. To overcome the issue, we experimented with a
different technique: stream-locked zooming. As zooming is operated, the closest stream
is locked, as seen in Fig. 3-9.
Auto-Zoom: The feature automatically takes the user to the closest stream and
zoom in. Deactivating auto-zoom recovers the original level. The feature is designed to
be a shortcut to switch the zoom level quickly for browsing and concentrating.
Figure 3-9: The standard zooming moves all streams;
the stream-locked zooming moves all streams except the locked stream.
3.4.3 Instruction Manual
Operation Keyboard Mouse
Turn left Left Key Drag to the left
Turn right Right Key Drag to the right
Move forward / Increase speed Up Key Drag upward
standard zooming stream-locked zooming
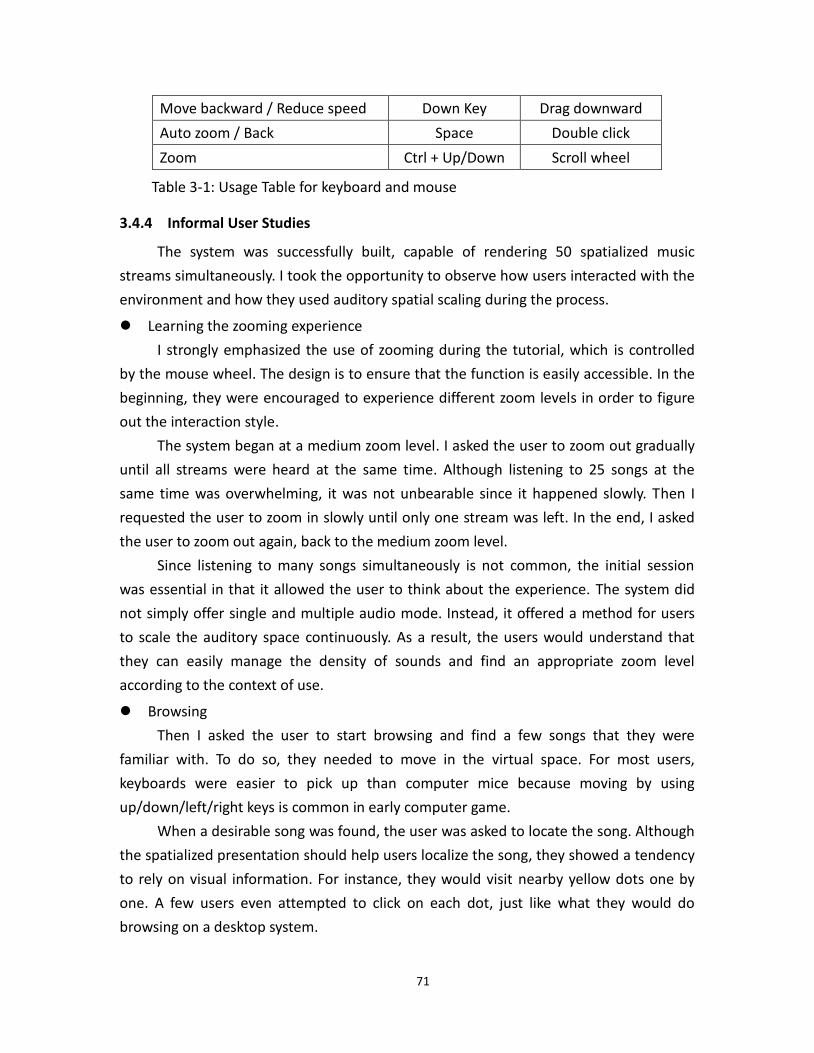
71
Table 3-1: Usage Table for keyboard and mouse
3.4.4 Informal User Studies
The system was successfully built, capable of rendering 50 spatialized music
streams simultaneously. I took the opportunity to observe how users interacted with the
environment and how they used auditory spatial scaling during the process.
Learning the zooming experience
I strongly emphasized the use of zooming during the tutorial, which is controlled
by the mouse wheel. The design is to ensure that the function is easily accessible. In the
beginning, they were encouraged to experience different zoom levels in order to figure
out the interaction style.
The system began at a medium zoom level. I asked the user to zoom out gradually
until all streams were heard at the same time. Although listening to 25 songs at the
same time was overwhelming, it was not unbearable since it happened slowly. Then I
requested the user to zoom in slowly until only one stream was left. In the end, I asked
the user to zoom out again, back to the medium zoom level.
Since listening to many songs simultaneously is not common, the initial session
was essential in that it allowed the user to think about the experience. The system did
not simply offer single and multiple audio mode. Instead, it offered a method for users
to scale the auditory space continuously. As a result, the users would understand that
they can easily manage the density of sounds and find an appropriate zoom level
according to the context of use.
Browsing
Then I asked the user to start browsing and find a few songs that they were
familiar with. To do so, they needed to move in the virtual space. For most users,
keyboards were easier to pick up than computer mice because moving by using
up/down/left/right keys is common in early computer game.
When a desirable song was found, the user was asked to locate the song. Although
the spatialized presentation should help users localize the song, they showed a tendency
to rely on visual information. For instance, they would visit nearby yellow dots one by
one. A few users even attempted to click on each dot, just like what they would do
browsing on a desktop system.
Move backward / Reduce speed Down Key Drag downward
Auto zoom / Back Space Double click
Zoom Ctrl + Up/Down Scroll wheel
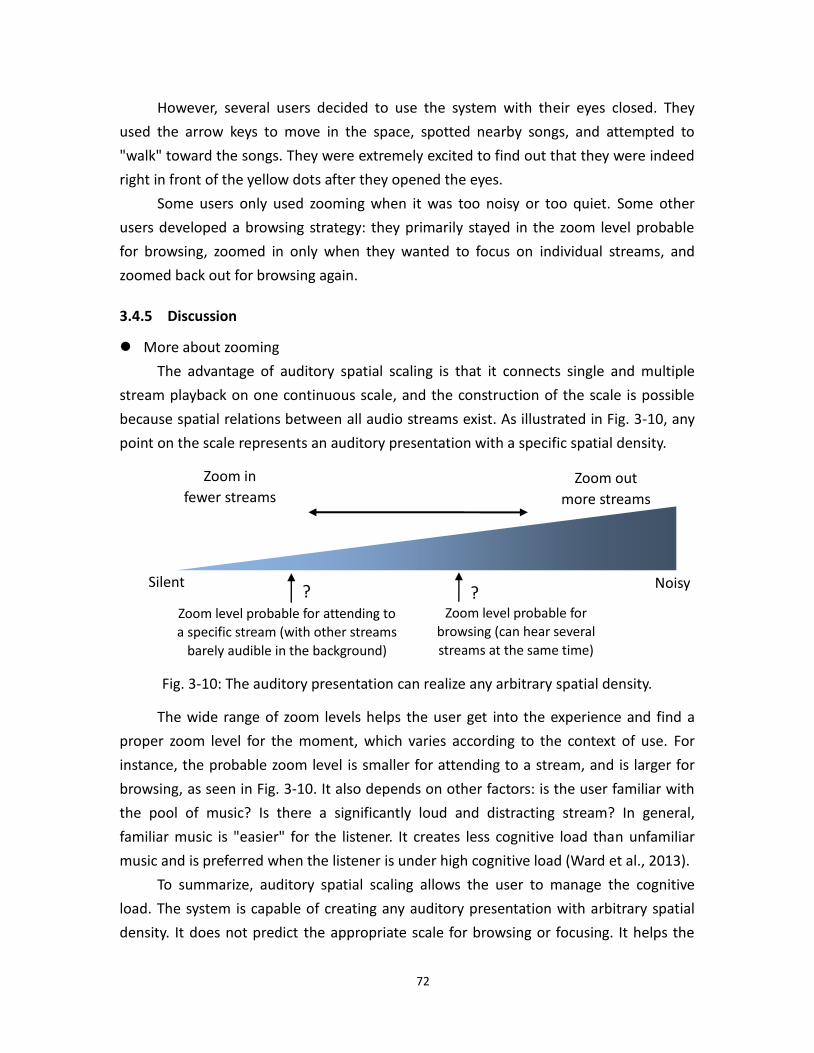
72
However, several users decided to use the system with their eyes closed. They
used the arrow keys to move in the space, spotted nearby songs, and attempted to
"walk" toward the songs. They were extremely excited to find out that they were indeed
right in front of the yellow dots after they opened the eyes.
Some users only used zooming when it was too noisy or too quiet. Some other
users developed a browsing strategy: they primarily stayed in the zoom level probable
for browsing, zoomed in only when they wanted to focus on individual streams, and
zoomed back out for browsing again.
3.4.5 Discussion
More about zooming
The advantage of auditory spatial scaling is that it connects single and multiple
stream playback on one continuous scale, and the construction of the scale is possible
because spatial relations between all audio streams exist. As illustrated in Fig. 3-10, any
point on the scale represents an auditory presentation with a specific spatial density.
Fig. 3-10: The auditory presentation can realize any arbitrary spatial density.
The wide range of zoom levels helps the user get into the experience and find a
proper zoom level for the moment, which varies according to the context of use. For
instance, the probable zoom level is smaller for attending to a stream, and is larger for
browsing, as seen in Fig. 3-10. It also depends on other factors: is the user familiar with
the pool of music? Is there a significantly loud and distracting stream? In general,
familiar music is "easier" for the listener. It creates less cognitive load than unfamiliar
music and is preferred when the listener is under high cognitive load (Ward et al., 2013).
To summarize, auditory spatial scaling allows the user to manage the cognitive
load. The system is capable of creating any auditory presentation with arbitrary spatial
density. It does not predict the appropriate scale for browsing or focusing. It helps the
Silent Noisy
Zoom in
fewer streams Zoom out
more streams
Zoom level probable for attending to
a specific stream (with other streams
barely audible in the background)
Zoom level probable for
browsing (can hear several
streams at the same time)
? ?
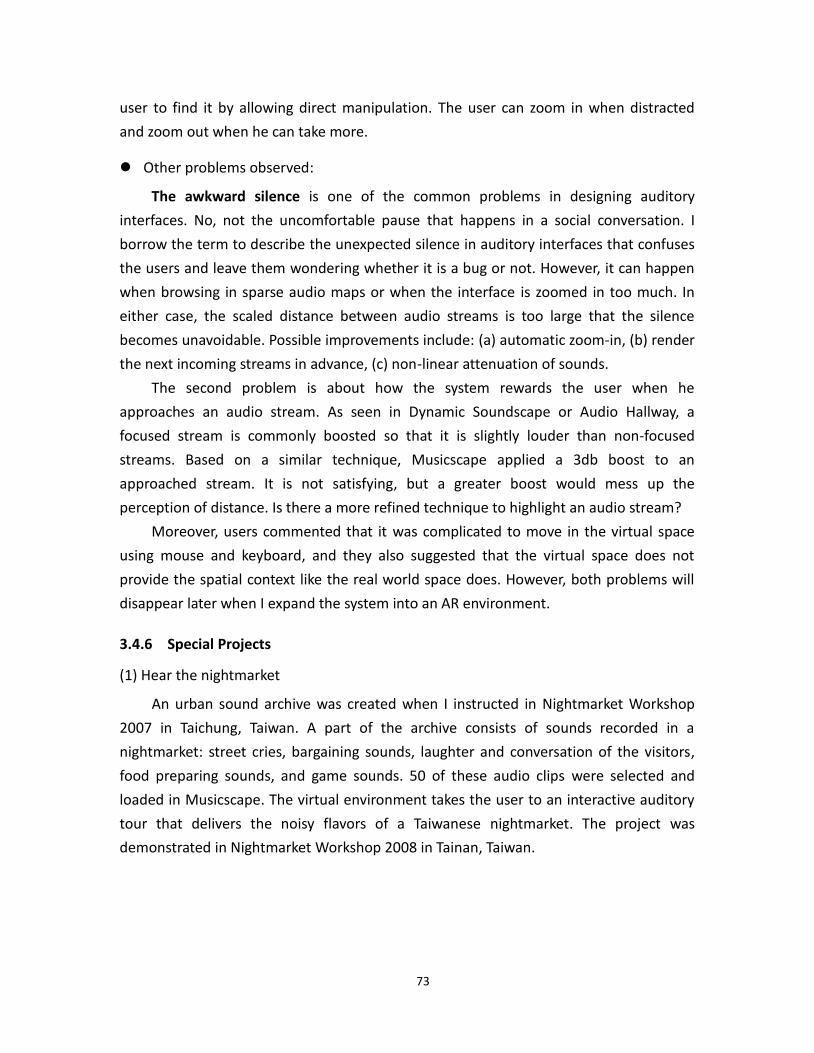
73
user to find it by allowing direct manipulation. The user can zoom in when distracted
and zoom out when he can take more.
Other problems observed:
The awkward silence is one of the common problems in designing auditory
interfaces. No, not the uncomfortable pause that happens in a social conversation. I
borrow the term to describe the unexpected silence in auditory interfaces that confuses
the users and leave them wondering whether it is a bug or not. However, it can happen
when browsing in sparse audio maps or when the interface is zoomed in too much. In
either case, the scaled distance between audio streams is too large that the silence
becomes unavoidable. Possible improvements include: (a) automatic zoom-in, (b) render
the next incoming streams in advance, (c) non-linear attenuation of sounds.
The second problem is about how the system rewards the user when he
approaches an audio stream. As seen in Dynamic Soundscape or Audio Hallway, a
focused stream is commonly boosted so that it is slightly louder than non-focused
streams. Based on a similar technique, Musicscape applied a 3db boost to an
approached stream. It is not satisfying, but a greater boost would mess up the
perception of distance. Is there a more refined technique to highlight an audio stream?
Moreover, users commented that it was complicated to move in the virtual space
using mouse and keyboard, and they also suggested that the virtual space does not
provide the spatial context like the real world space does. However, both problems will
disappear later when I expand the system into an AR environment.
3.4.6 Special Projects
(1) Hear the nightmarket
An urban sound archive was created when I instructed in Nightmarket Workshop
2007 in Taichung, Taiwan. A part of the archive consists of sounds recorded in a
nightmarket: street cries, bargaining sounds, laughter and conversation of the visitors,
food preparing sounds, and game sounds. 50 of these audio clips were selected and
loaded in Musicscape. The virtual environment takes the user to an interactive auditory
tour that delivers the noisy flavors of a Taiwanese nightmarket. The project was
demonstrated in Nightmarket Workshop 2008 in Tainan, Taiwan.
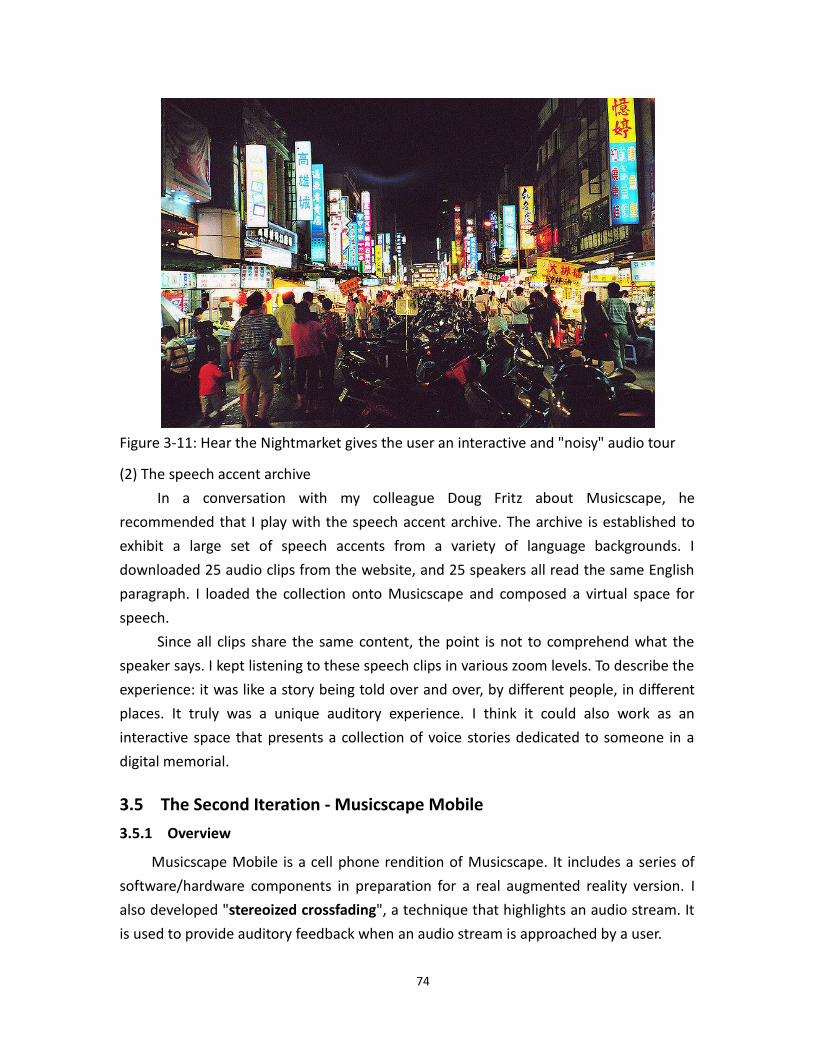
74
Figure 3-11: Hear the Nightmarket gives the user an interactive and "noisy" audio tour
(2) The speech accent archive
In a conversation with my colleague Doug Fritz about Musicscape, he
recommended that I play with the speech accent archive. The archive is established to
exhibit a large set of speech accents from a variety of language backgrounds. I
downloaded 25 audio clips from the website, and 25 speakers all read the same English
paragraph. I loaded the collection onto Musicscape and composed a virtual space for
speech.
Since all clips share the same content, the point is not to comprehend what the
speaker says. I kept listening to these speech clips in various zoom levels. To describe the
experience: it was like a story being told over and over, by different people, in different
places. It truly was a unique auditory experience. I think it could also work as an
interactive space that presents a collection of voice stories dedicated to someone in a
digital memorial.
3.5 The Second Iteration - Musicscape Mobile
3.5.1 Overview
Musicscape Mobile is a cell phone rendition of Musicscape. It includes a series of
software/hardware components in preparation for a real augmented reality version. I
also developed "stereoized crossfading", a technique that highlights an audio stream. It
is used to provide auditory feedback when an audio stream is approached by a user.
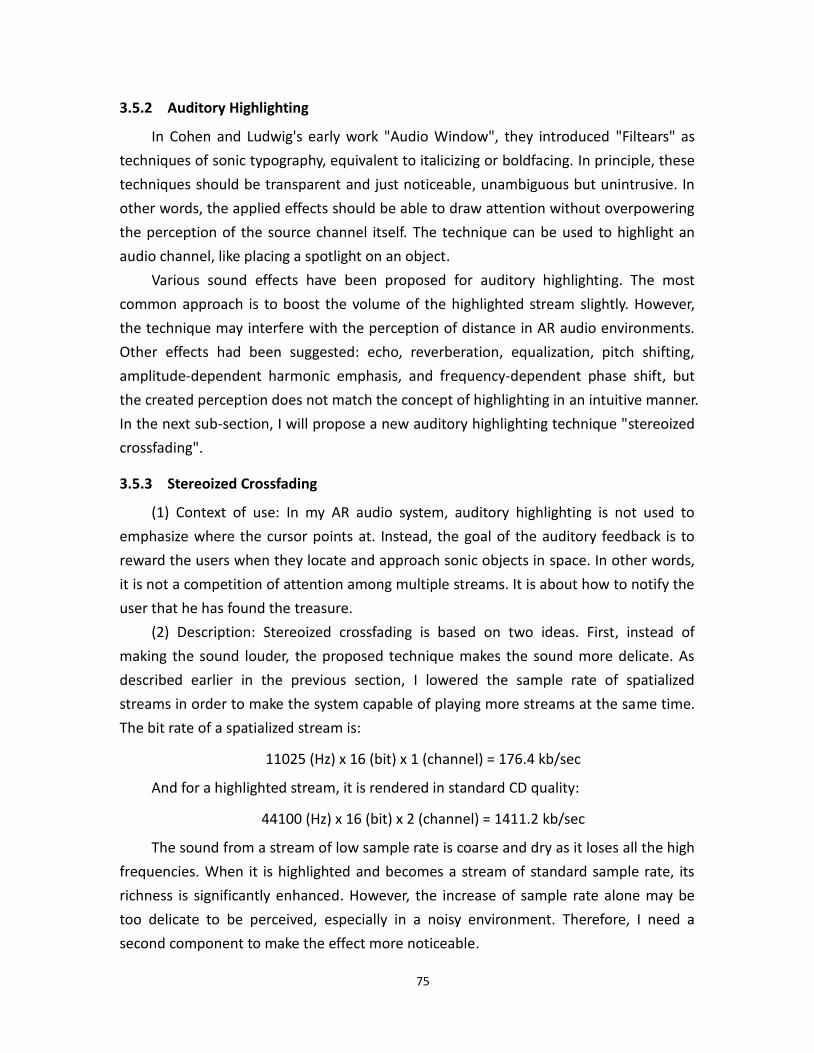
75
3.5.2 Auditory Highlighting
In Cohen and Ludwig's early work "Audio Window", they introduced "Filtears" as
techniques of sonic typography, equivalent to italicizing or boldfacing. In principle, these
techniques should be transparent and just noticeable, unambiguous but unintrusive. In
other words, the applied effects should be able to draw attention without overpowering
the perception of the source channel itself. The technique can be used to highlight an
audio channel, like placing a spotlight on an object.
Various sound effects have been proposed for auditory highlighting. The most
common approach is to boost the volume of the highlighted stream slightly. However,
the technique may interfere with the perception of distance in AR audio environments.
Other effects had been suggested: echo, reverberation, equalization, pitch shifting,
amplitude-dependent harmonic emphasis, and frequency-dependent phase shift, but
the created perception does not match the concept of highlighting in an intuitive manner.
In the next sub-section, I will propose a new auditory highlighting technique "stereoized
crossfading".
3.5.3 Stereoized Crossfading
(1) Context of use: In my AR audio system, auditory highlighting is not used to
emphasize where the cursor points at. Instead, the goal of the auditory feedback is to
reward the users when they locate and approach sonic objects in space. In other words,
it is not a competition of attention among multiple streams. It is about how to notify the
user that he has found the treasure.
(2) Description: Stereoized crossfading is based on two ideas. First, instead of
making the sound louder, the proposed technique makes the sound more delicate. As
described earlier in the previous section, I lowered the sample rate of spatialized
streams in order to make the system capable of playing more streams at the same time.
The bit rate of a spatialized stream is:
11025 (Hz) x 16 (bit) x 1 (channel) = 176.4 kb/sec
And for a highlighted stream, it is rendered in standard CD quality:
44100 (Hz) x 16 (bit) x 2 (channel) = 1411.2 kb/sec
The sound from a stream of low sample rate is coarse and dry as it loses all the high
frequencies. When it is highlighted and becomes a stream of standard sample rate, its
richness is significantly enhanced. However, the increase of sample rate alone may be
too delicate to be perceived, especially in a noisy environment. Therefore, I need a
second component to make the effect more noticeable.
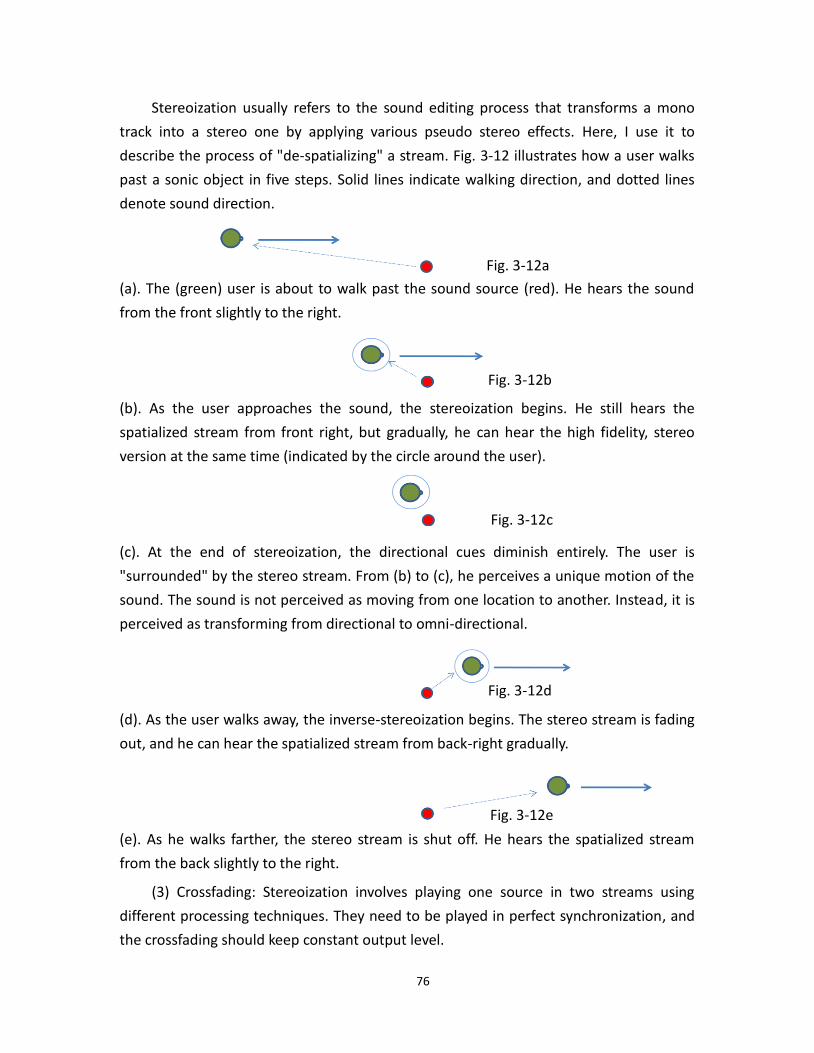
76
Stereoization usually refers to the sound editing process that transforms a mono
track into a stereo one by applying various pseudo stereo effects. Here, I use it to
describe the process of "de-spatializing" a stream. Fig. 3-12 illustrates how a user walks
past a sonic object in five steps. Solid lines indicate walking direction, and dotted lines
denote sound direction.
(a). The (green) user is about to walk past the sound source (red). He hears the sound
from the front slightly to the right.
(b). As the user approaches the sound, the stereoization begins. He still hears the
spatialized stream from front right, but gradually, he can hear the high fidelity, stereo
version at the same time (indicated by the circle around the user).
(c). At the end of stereoization, the directional cues diminish entirely. The user is
"surrounded" by the stereo stream. From (b) to (c), he perceives a unique motion of the
sound. The sound is not perceived as moving from one location to another. Instead, it is
perceived as transforming from directional to omni-directional.
(d). As the user walks away, the inverse-stereoization begins. The stereo stream is fading
out, and he can hear the spatialized stream from back-right gradually.
(e). As he walks farther, the stereo stream is shut off. He hears the spatialized stream
from the back slightly to the right.
(3) Crossfading: Stereoization involves playing one source in two streams using
different processing techniques. They need to be played in perfect synchronization, and
the crossfading should keep constant output level.
Fig. 3-12a
Fig. 3-12b
Fig. 3-12c
Fig. 3-12d
Fig. 3-12e
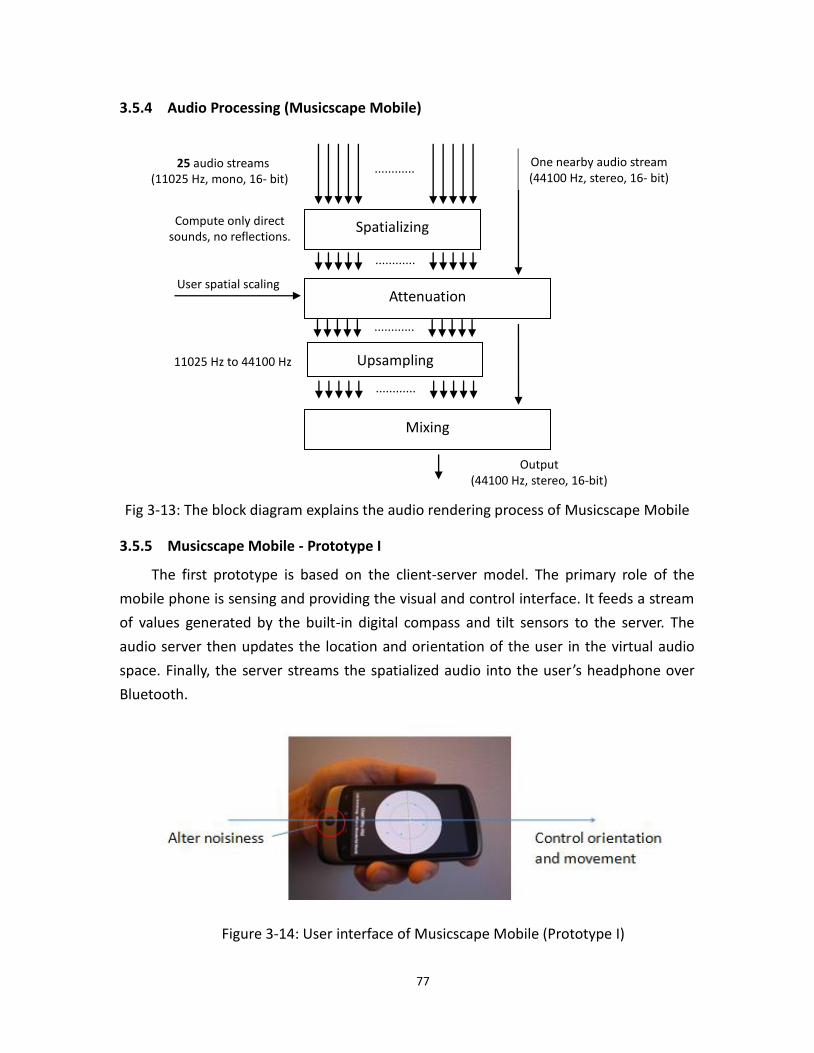
77
3.5.4 Audio Processing (Musicscape Mobile)
Fig 3-13: The block diagram explains the audio rendering process of Musicscape Mobile
3.5.5 Musicscape Mobile - Prototype I
The first prototype is based on the client-server model. The primary role of the
mobile phone is sensing and providing the visual and control interface. It feeds a stream
of values generated by the built-in digital compass and tilt sensors to the server. The
audio server then updates the location and orientation of the user in the virtual audio
space. Finally, the server streams the spatialized audio into the user’s headphone over
Bluetooth.
Figure 3-14: User interface of Musicscape Mobile (Prototype I)
Upsampling
Attenuation
25 audio streams (11025 Hz, mono, 16- bit)
Compute only direct sounds, no reflections.
Spatializing
User spatial scaling
Output (44100 Hz, stereo, 16-bit)
............
............
............
One nearby audio stream (44100 Hz, stereo, 16- bit)
Mixing
11025 Hz to 44100 Hz
............
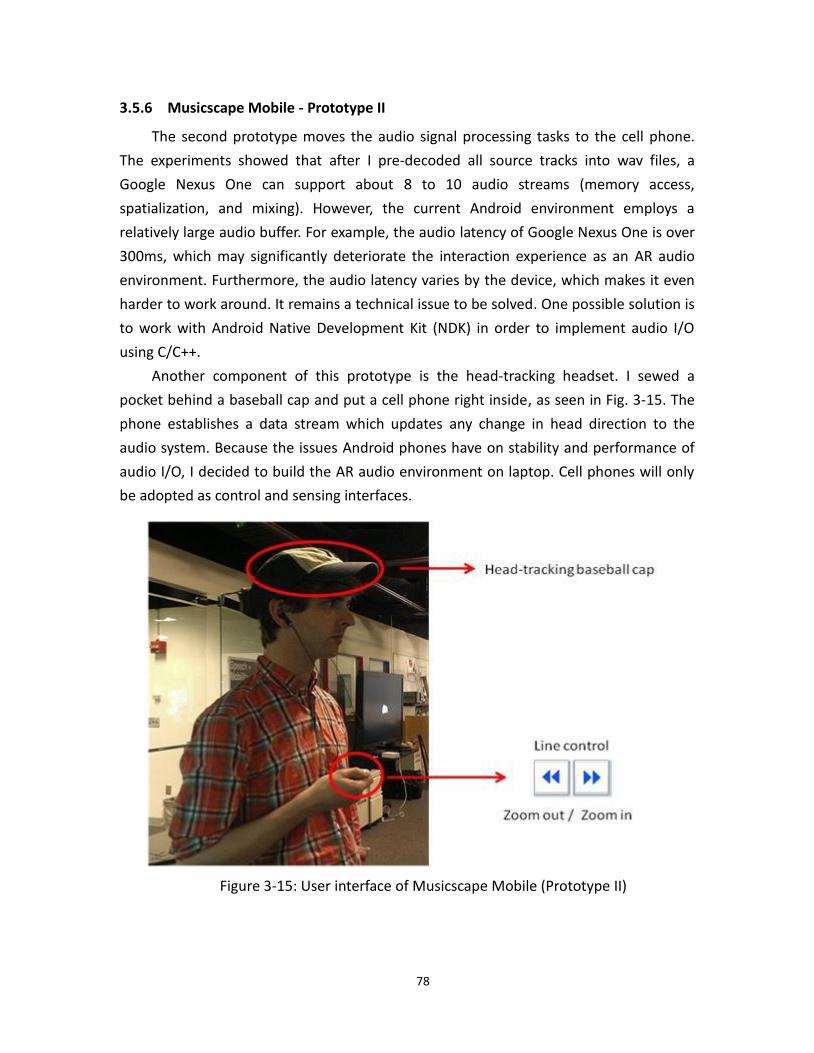
78
3.5.6 Musicscape Mobile - Prototype II
The second prototype moves the audio signal processing tasks to the cell phone.
The experiments showed that after I pre-decoded all source tracks into wav files, a
Google Nexus One can support about 8 to 10 audio streams (memory access,
spatialization, and mixing). However, the current Android environment employs a
relatively large audio buffer. For example, the audio latency of Google Nexus One is over
300ms, which may significantly deteriorate the interaction experience as an AR audio
environment. Furthermore, the audio latency varies by the device, which makes it even
harder to work around. It remains a technical issue to be solved. One possible solution is
to work with Android Native Development Kit (NDK) in order to implement audio I/O
using C/C++.
Another component of this prototype is the head-tracking headset. I sewed a
pocket behind a baseball cap and put a cell phone right inside, as seen in Fig. 3-15. The
phone establishes a data stream which updates any change in head direction to the
audio system. Because the issues Android phones have on stability and performance of
audio I/O, I decided to build the AR audio environment on laptop. Cell phones will only
be adopted as control and sensing interfaces.
Figure 3-15: User interface of Musicscape Mobile (Prototype II)
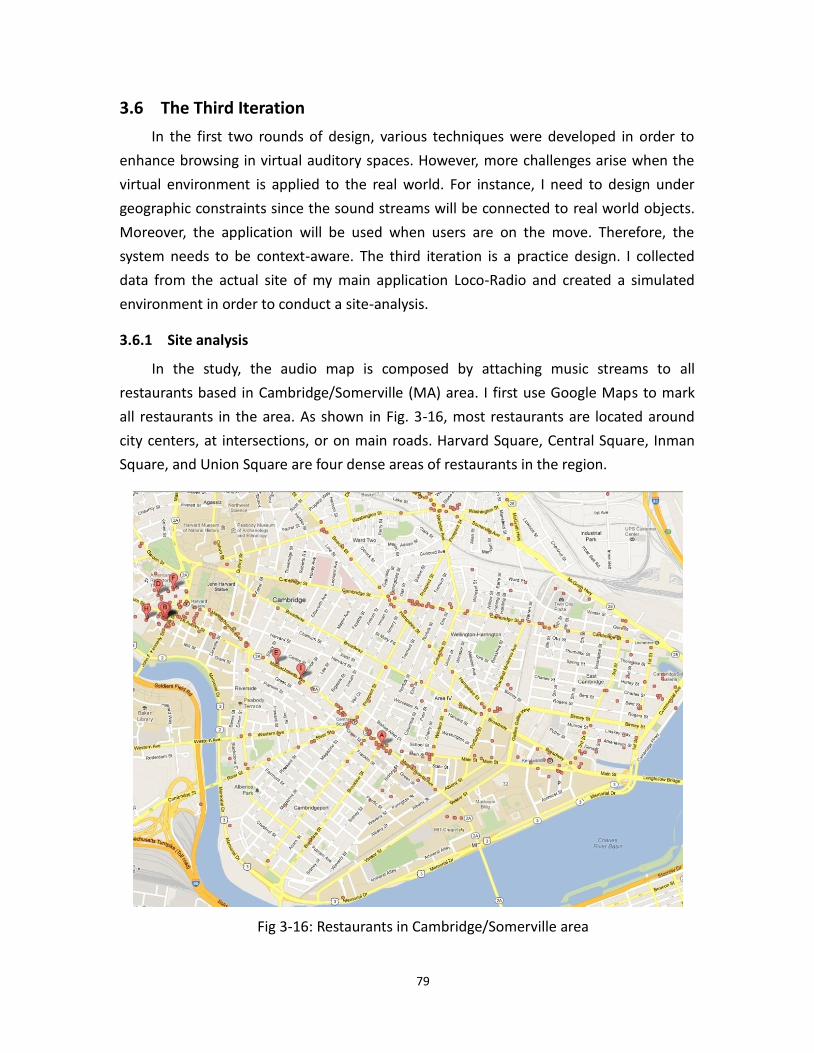
79
3.6 The Third Iteration
In the first two rounds of design, various techniques were developed in order to
enhance browsing in virtual auditory spaces. However, more challenges arise when the
virtual environment is applied to the real world. For instance, I need to design under
geographic constraints since the sound streams will be connected to real world objects.
Moreover, the application will be used when users are on the move. Therefore, the
system needs to be context-aware. The third iteration is a practice design. I collected
data from the actual site of my main application Loco-Radio and created a simulated
environment in order to conduct a site-analysis.
3.6.1 Site analysis
In the study, the audio map is composed by attaching music streams to all
restaurants based in Cambridge/Somerville (MA) area. I first use Google Maps to mark
all restaurants in the area. As shown in Fig. 3-16, most restaurants are located around
city centers, at intersections, or on main roads. Harvard Square, Central Square, Inman
Square, and Union Square are four dense areas of restaurants in the region.
Fig 3-16: Restaurants in Cambridge/Somerville area
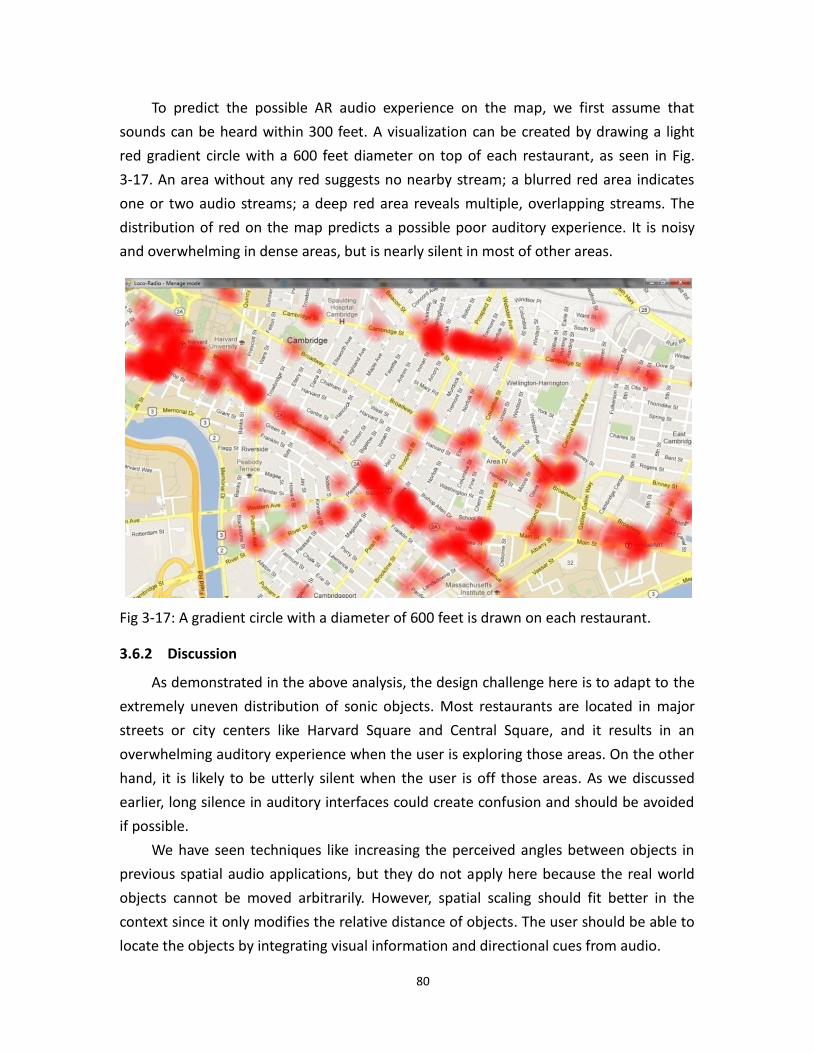
80
To predict the possible AR audio experience on the map, we first assume that
sounds can be heard within 300 feet. A visualization can be created by drawing a light
red gradient circle with a 600 feet diameter on top of each restaurant, as seen in Fig.
3-17. An area without any red suggests no nearby stream; a blurred red area indicates
one or two audio streams; a deep red area reveals multiple, overlapping streams. The
distribution of red on the map predicts a possible poor auditory experience. It is noisy
and overwhelming in dense areas, but is nearly silent in most of other areas.
Fig 3-17: A gradient circle with a diameter of 600 feet is drawn on each restaurant.
3.6.2 Discussion
As demonstrated in the above analysis, the design challenge here is to adapt to the
extremely uneven distribution of sonic objects. Most restaurants are located in major
streets or city centers like Harvard Square and Central Square, and it results in an
overwhelming auditory experience when the user is exploring those areas. On the other
hand, it is likely to be utterly silent when the user is off those areas. As we discussed
earlier, long silence in auditory interfaces could create confusion and should be avoided
if possible.
We have seen techniques like increasing the perceived angles between objects in
previous spatial audio applications, but they do not apply here because the real world
objects cannot be moved arbitrarily. However, spatial scaling should fit better in the
context since it only modifies the relative distance of objects. The user should be able to
locate the objects by integrating visual information and directional cues from audio.
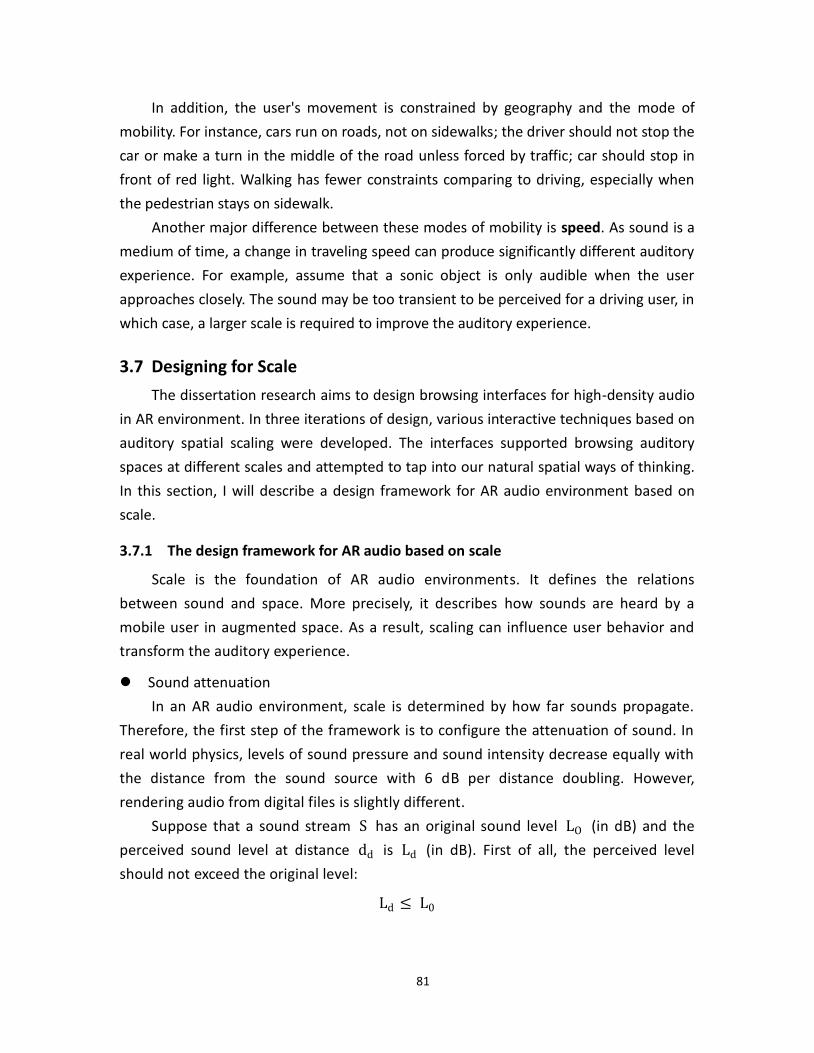
81
In addition, the user's movement is constrained by geography and the mode of
mobility. For instance, cars run on roads, not on sidewalks; the driver should not stop the
car or make a turn in the middle of the road unless forced by traffic; car should stop in
front of red light. Walking has fewer constraints comparing to driving, especially when
the pedestrian stays on sidewalk.
Another major difference between these modes of mobility is speed. As sound is a
medium of time, a change in traveling speed can produce significantly different auditory
experience. For example, assume that a sonic object is only audible when the user
approaches closely. The sound may be too transient to be perceived for a driving user, in
which case, a larger scale is required to improve the auditory experience.
3.7 Designing for Scale
The dissertation research aims to design browsing interfaces for high-density audio
in AR environment. In three iterations of design, various interactive techniques based on
auditory spatial scaling were developed. The interfaces supported browsing auditory
spaces at different scales and attempted to tap into our natural spatial ways of thinking.
In this section, I will describe a design framework for AR audio environment based on
scale.
3.7.1 The design framework for AR audio based on scale
Scale is the foundation of AR audio environments. It defines the relations
between sound and space. More precisely, it describes how sounds are heard by a
mobile user in augmented space. As a result, scaling can influence user behavior and
transform the auditory experience.
Sound attenuation
In an AR audio environment, scale is determined by how far sounds propagate.
Therefore, the first step of the framework is to configure the attenuation of sound. In
real world physics, levels of sound pressure and sound intensity decrease equally with
the distance from the sound source with 6 dB per distance doubling. However,
rendering audio from digital files is slightly different.
Suppose that a sound stream S has an original sound level LO (in dB) and the
perceived sound level at distance dd is Ld (in dB). First of all, the perceived level
should not exceed the original level:
Ld ≤ L0
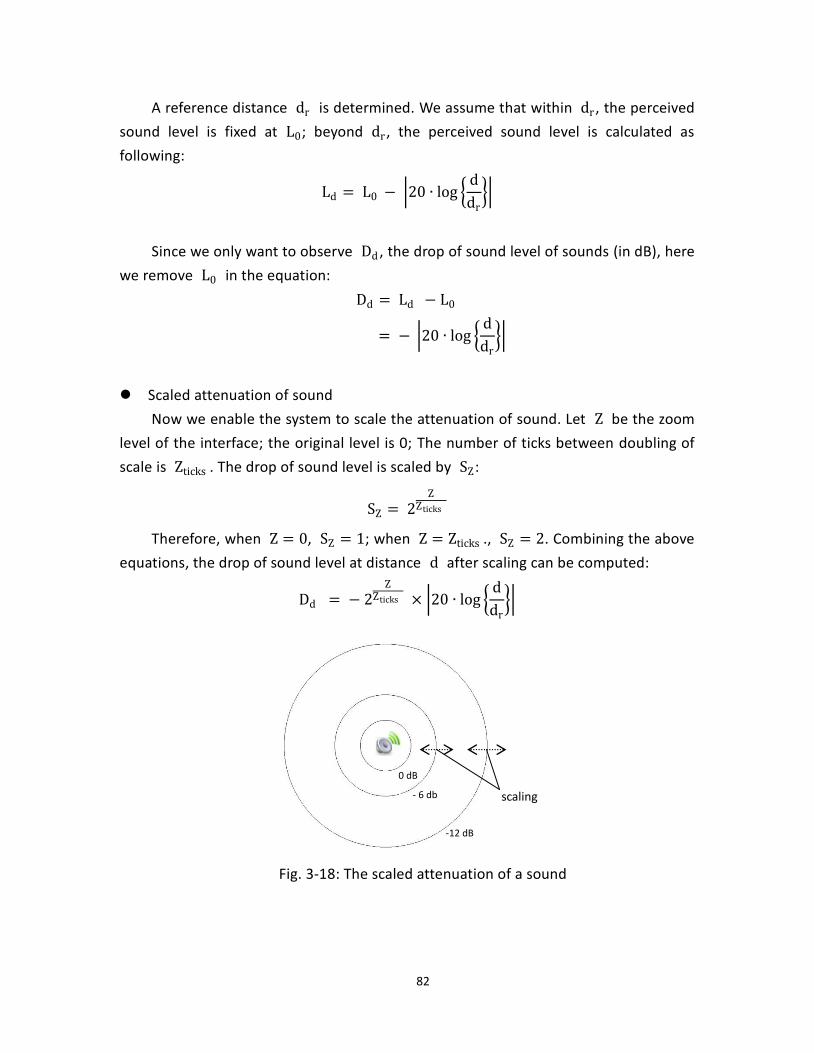
82
A reference distance dr is determined. We assume that within dr , the perceived
sound level is fixed at L0; beyond dr , the perceived sound level is calculated as
following:
Ld = L0 − 20 ∙ log d
dr
Since we only want to observe Dd , the drop of sound level of sounds (in dB), here
we remove L0 in the equation:
Dd = Ld − L0
= − 20 ∙ log d
dr
Scaled attenuation of sound
Now we enable the system to scale the attenuation of sound. Let Z be the zoom
level of the interface; the original level is 0; The number of ticks between doubling of
scale is Zticks . The drop of sound level is scaled by SZ:
SZ = 2Z
Zticks
Therefore, when Z = 0, SZ = 1; when Z = Zticks ., SZ = 2. Combining the above
equations, the drop of sound level at distance d after scaling can be computed:
Dd = − 2Z
Zticks × 20 ∙ log d
dr
Fig. 3-18: The scaled attenuation of a sound
0 dB
- 6 db
-12 dB
scaling
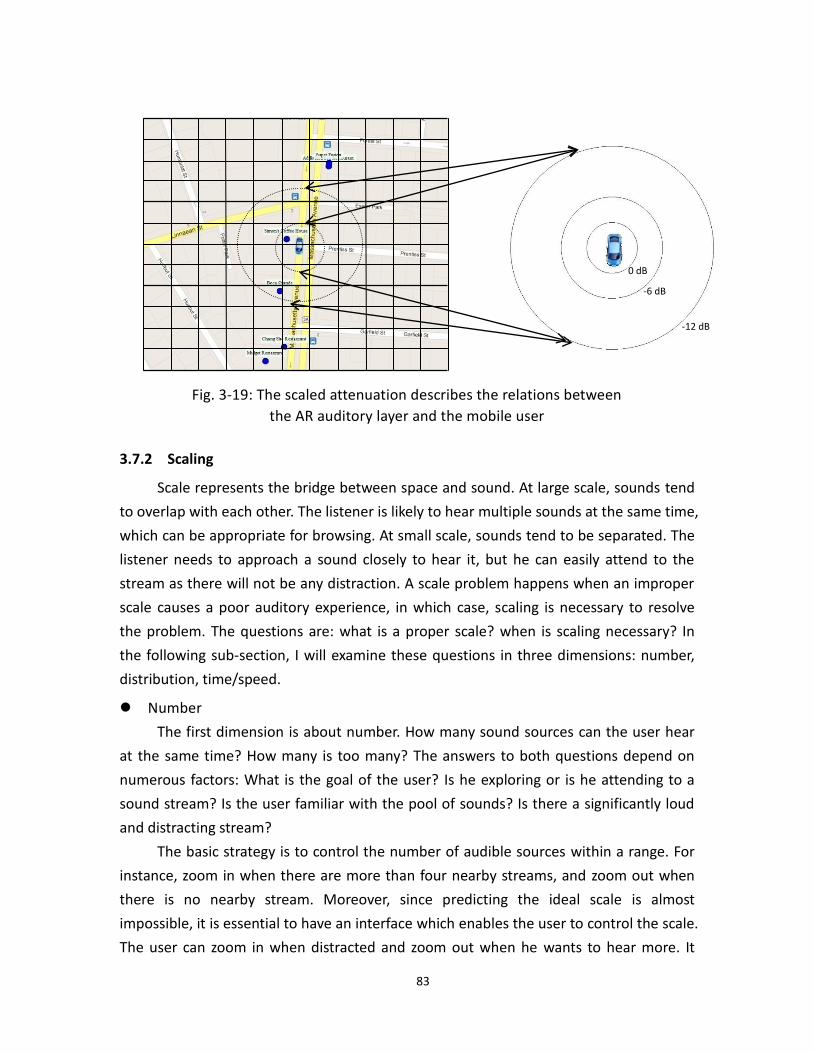
83
Fig. 3-19: The scaled attenuation describes the relations between
the AR auditory layer and the mobile user
3.7.2 Scaling
Scale represents the bridge between space and sound. At large scale, sounds tend
to overlap with each other. The listener is likely to hear multiple sounds at the same time,
which can be appropriate for browsing. At small scale, sounds tend to be separated. The
listener needs to approach a sound closely to hear it, but he can easily attend to the
stream as there will not be any distraction. A scale problem happens when an improper
scale causes a poor auditory experience, in which case, scaling is necessary to resolve
the problem. The questions are: what is a proper scale? when is scaling necessary? In
the following sub-section, I will examine these questions in three dimensions: number,
distribution, time/speed.
Number
The first dimension is about number. How many sound sources can the user hear
at the same time? How many is too many? The answers to both questions depend on
numerous factors: What is the goal of the user? Is he exploring or is he attending to a
sound stream? Is the user familiar with the pool of sounds? Is there a significantly loud
and distracting stream?
The basic strategy is to control the number of audible sources within a range. For
instance, zoom in when there are more than four nearby streams, and zoom out when
there is no nearby stream. Moreover, since predicting the ideal scale is almost
impossible, it is essential to have an interface which enables the user to control the scale.
The user can zoom in when distracted and zoom out when he wants to hear more. It
0 dB
-6 dB
-12 dB
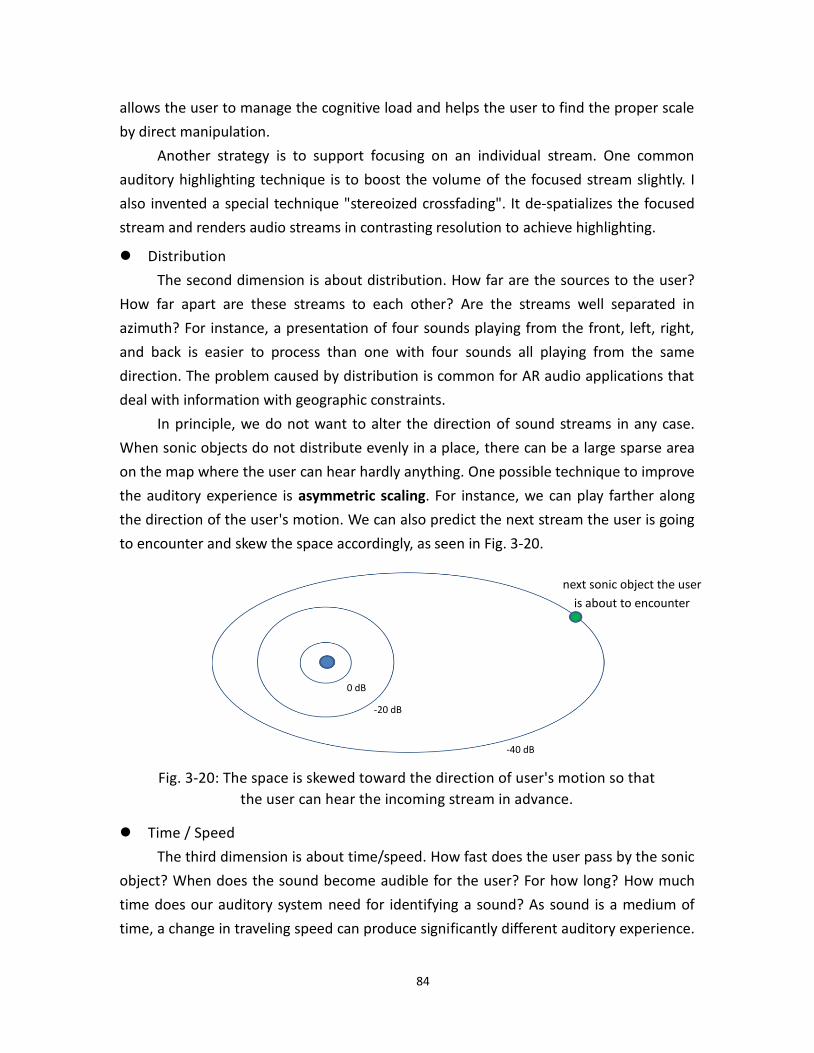
84
allows the user to manage the cognitive load and helps the user to find the proper scale
by direct manipulation.
Another strategy is to support focusing on an individual stream. One common
auditory highlighting technique is to boost the volume of the focused stream slightly. I
also invented a special technique "stereoized crossfading". It de-spatializes the focused
stream and renders audio streams in contrasting resolution to achieve highlighting.
Distribution
The second dimension is about distribution. How far are the sources to the user?
How far apart are these streams to each other? Are the streams well separated in
azimuth? For instance, a presentation of four sounds playing from the front, left, right,
and back is easier to process than one with four sounds all playing from the same
direction. The problem caused by distribution is common for AR audio applications that
deal with information with geographic constraints.
In principle, we do not want to alter the direction of sound streams in any case.
When sonic objects do not distribute evenly in a place, there can be a large sparse area
on the map where the user can hear hardly anything. One possible technique to improve
the auditory experience is asymmetric scaling. For instance, we can play farther along
the direction of the user's motion. We can also predict the next stream the user is going
to encounter and skew the space accordingly, as seen in Fig. 3-20.
Fig. 3-20: The space is skewed toward the direction of user's motion so that
the user can hear the incoming stream in advance.
Time / Speed
The third dimension is about time/speed. How fast does the user pass by the sonic
object? When does the sound become audible for the user? For how long? How much
time does our auditory system need for identifying a sound? As sound is a medium of
time, a change in traveling speed can produce significantly different auditory experience.
0 dB
-20 dB
-40 dB
next sonic object the user
is about to encounter
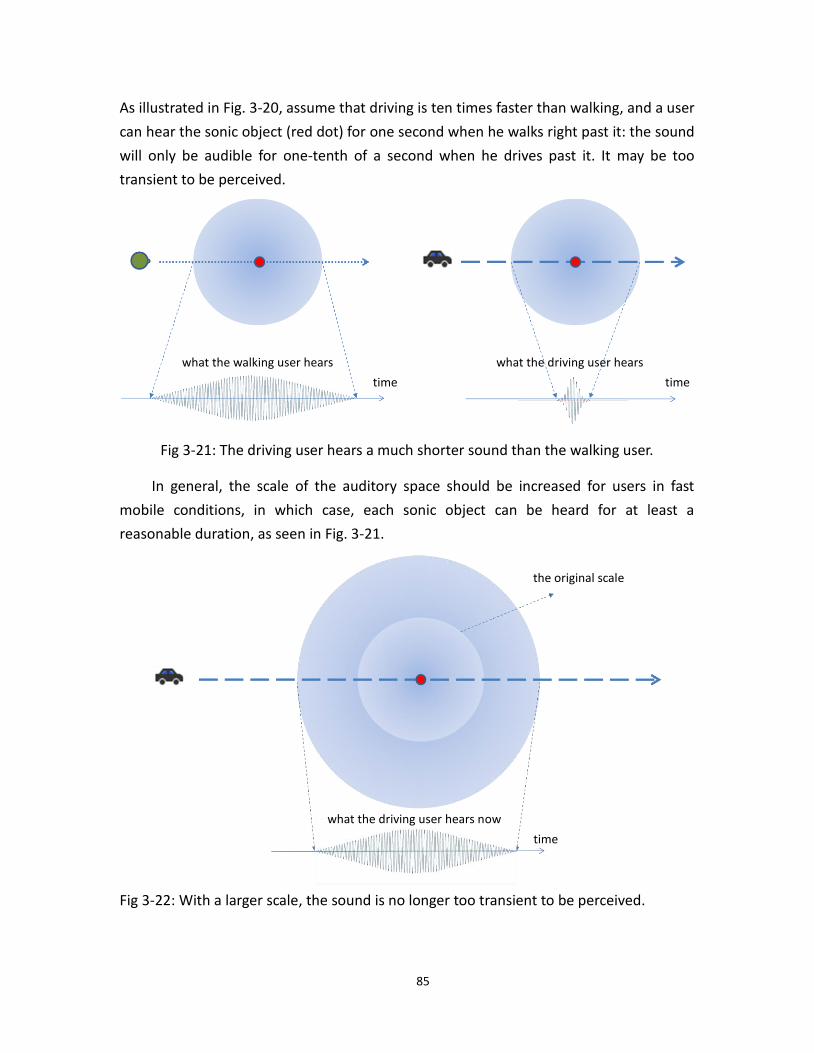
85
As illustrated in Fig. 3-20, assume that driving is ten times faster than walking, and a user
can hear the sonic object (red dot) for one second when he walks right past it: the sound
will only be audible for one-tenth of a second when he drives past it. It may be too
transient to be perceived.
Fig 3-21: The driving user hears a much shorter sound than the walking user.
In general, the scale of the auditory space should be increased for users in fast
mobile conditions, in which case, each sonic object can be heard for at least a
reasonable duration, as seen in Fig. 3-21.
Fig 3-22: With a larger scale, the sound is no longer too transient to be perceived.
time time
what the walking user hears what the driving user hears
time
what the driving user hears now
the original scale
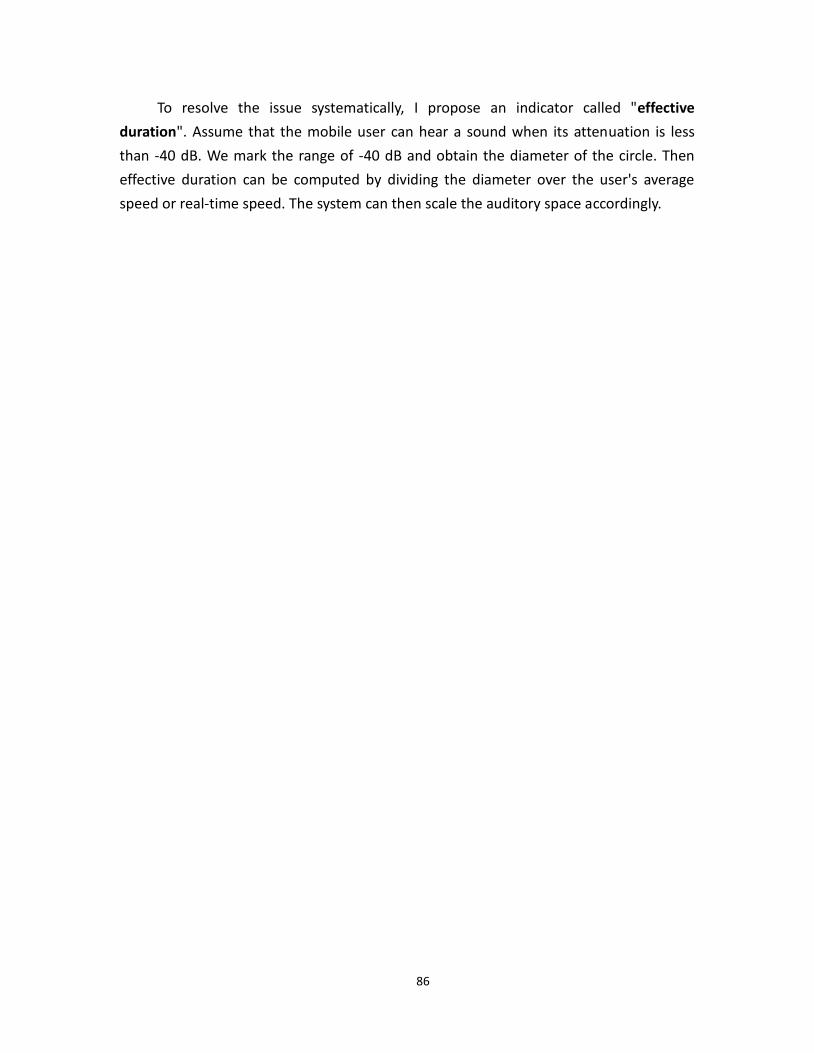
86
To resolve the issue systematically, I propose an indicator called "effective
duration". Assume that the mobile user can hear a sound when its attenuation is less
than -40 dB. We mark the range of -40 dB and obtain the diameter of the circle. Then
effective duration can be computed by dividing the diameter over the user's average
speed or real-time speed. The system can then scale the auditory space accordingly.
87
Chapter 4
Loco-Radio Outdoor
4.1 Introduction
A design framework for AR audio based on scale was introduced in the previous
chapter. It helps us design an immersive auditory environment with a large number of
simultaneous audio streams. Scale not only defines the relations between sound and
space, but also describes how a mobile user hears the sounds in the augmented space.
Therefore, scaling is an essential tool that can influence user behavior and transform the
auditory experience. In this chapter, I will demonstrate how to design an AR audio
environment for a geographically constrained audio map based on the framework.
Loco-Radio Outdoor is a mobile AR auditory environment for car drivers, bikers, and
pedestrians. The system uses spatial audio and head-tracking headsets to support
high-precision interaction. Its goal is to enhance the user's awareness of the
surroundings: For instance, how many restaurants are nearby? What are these
restaurants? In order to create an AR auditory experience that connects the user to the
nearby restaurants, the audio map is constructed by attaching genre-matching music to
restaurants around Cambridge and Somerville.
However, the uneven distribution of sound streams may result in poor auditory
experience. The framework guides me to overcome the geographic constraints. I analyze
and design the scale of auditory environment in three dimensions: number, distribution,
and time/speed. A manual zoom control enables the user to adjust the spatial density of
perceived sounds continuously. By zooming out, he can virtually move all sound sources
relatively closer in order to achieve more efficient browsing. By zooming in, he can
concentrate only on the closer sounds. To further enhance the browsing experience,
other techniques are used: (1) automatic zoom control that adapts to the number of
audible sources and the mobile user's speed, (2) stereoized crossfading for auditory
highlighting, and (3) asymmetric scaling to resolve uneven distribution of sonic objects.
I recruited users in different mobility modes: driving, biking, and walking. A think
aloud study is conducted. The system log, interaction log, and post-study interview are
analyzed to evaluate the design.
4.1.1 Use Case
I am a driving commuter. Each day I drive by many places that I know little about.
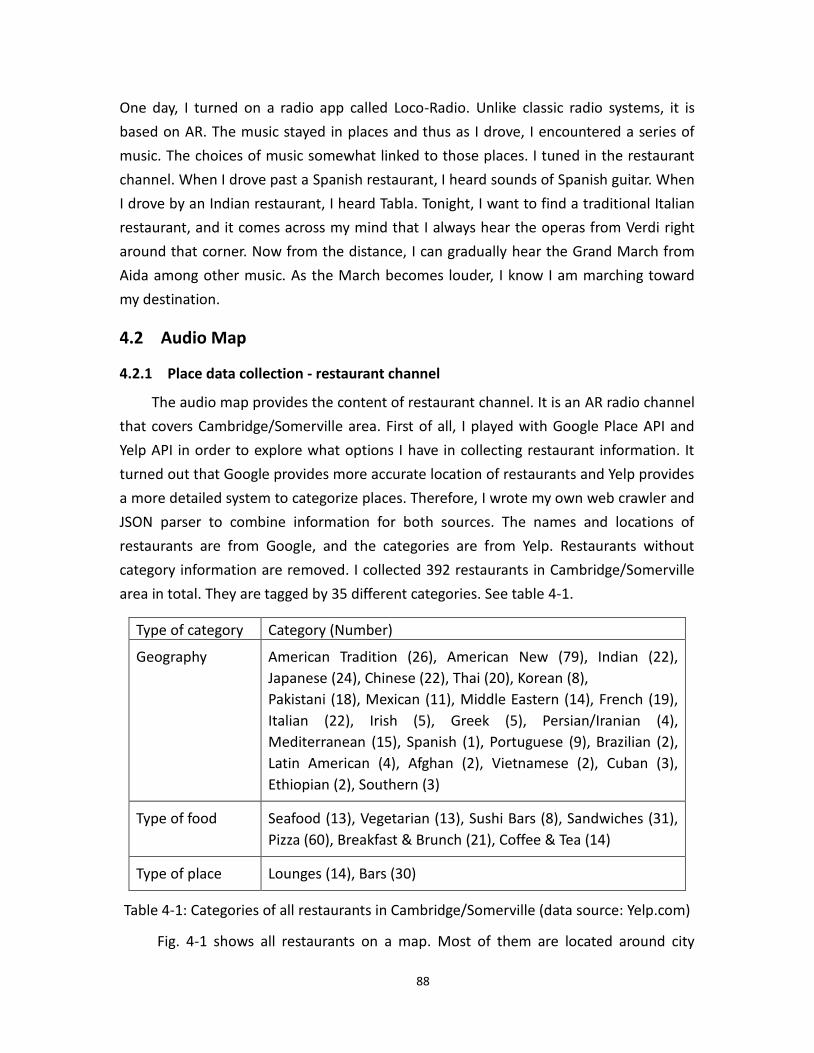
88
One day, I turned on a radio app called Loco-Radio. Unlike classic radio systems, it is
based on AR. The music stayed in places and thus as I drove, I encountered a series of
music. The choices of music somewhat linked to those places. I tuned in the restaurant
channel. When I drove past a Spanish restaurant, I heard sounds of Spanish guitar. When
I drove by an Indian restaurant, I heard Tabla. Tonight, I want to find a traditional Italian
restaurant, and it comes across my mind that I always hear the operas from Verdi right
around that corner. Now from the distance, I can gradually hear the Grand March from
Aida among other music. As the March becomes louder, I know I am marching toward
my destination.
4.2 Audio Map
4.2.1 Place data collection - restaurant channel
The audio map provides the content of restaurant channel. It is an AR radio channel
that covers Cambridge/Somerville area. First of all, I played with Google Place API and
Yelp API in order to explore what options I have in collecting restaurant information. It
turned out that Google provides more accurate location of restaurants and Yelp provides
a more detailed system to categorize places. Therefore, I wrote my own web crawler and
JSON parser to combine information for both sources. The names and locations of
restaurants are from Google, and the categories are from Yelp. Restaurants without
category information are removed. I collected 392 restaurants in Cambridge/Somerville
area in total. They are tagged by 35 different categories. See table 4-1.
Type of category Category (Number)
Geography American Tradition (26), American New (79), Indian (22),
Japanese (24), Chinese (22), Thai (20), Korean (8),
Pakistani (18), Mexican (11), Middle Eastern (14), French (19),
Italian (22), Irish (5), Greek (5), Persian/Iranian (4),
Mediterranean (15), Spanish (1), Portuguese (9), Brazilian (2),
Latin American (4), Afghan (2), Vietnamese (2), Cuban (3),
Ethiopian (2), Southern (3)
Type of food Seafood (13), Vegetarian (13), Sushi Bars (8), Sandwiches (31),
Pizza (60), Breakfast & Brunch (21), Coffee & Tea (14)
Type of place Lounges (14), Bars (30)
Table 4-1: Categories of all restaurants in Cambridge/Somerville (data source: Yelp.com)
Fig. 4-1 shows all restaurants on a map. Most of them are located around city

89
centers, at intersections, or on main roads. Harvard Square, Central Square, Inman
Square, and Union Square are four dense areas of restaurants in the region. Since a song
is played at the location of each restaurant, the uneven distribution of restaurants would
results in a poor auditory experience. It is noisy and overwhelming in dense areas but is
nearly silent in most of other areas.
Fig 4-1: Restaurants in Cambridge/Somerville area marked on the map
4.2.2 Assigning music
The second task is to assign music to each restaurant. The strategies are: First,
music should be genre-matching. Second, music should be distinguishable from one
another. For restaurants of geographical categories, I started digging Youtube for iconic
song or traditional music of different countries or cultures, for example, the Hat Dance
music from Mexico, or O Sole Mio from Italy. Another option is to use songs featured in
"foreign" movies. Music can also be associated to food type. For example, Frank Sinatra
had a “Coffee Song”, or the theme from Teenage Mutant Ninja Turtles is linked to pizza
stores since those characters all love pizzas.
My intention here is to create a default music map. It is not meant to be universal.
In order to provide a more personal user experience, the music map can be
re-configured on the user's request.
4.3 Designing Scale for Mobility
As I introduced in the previous chapter, scale design of an AR audio environment
requires a careful consideration of number, distribution, time/speed, and context of
mobility. The design will begin with an analysis of the number and distribution of sound
streams on the map.
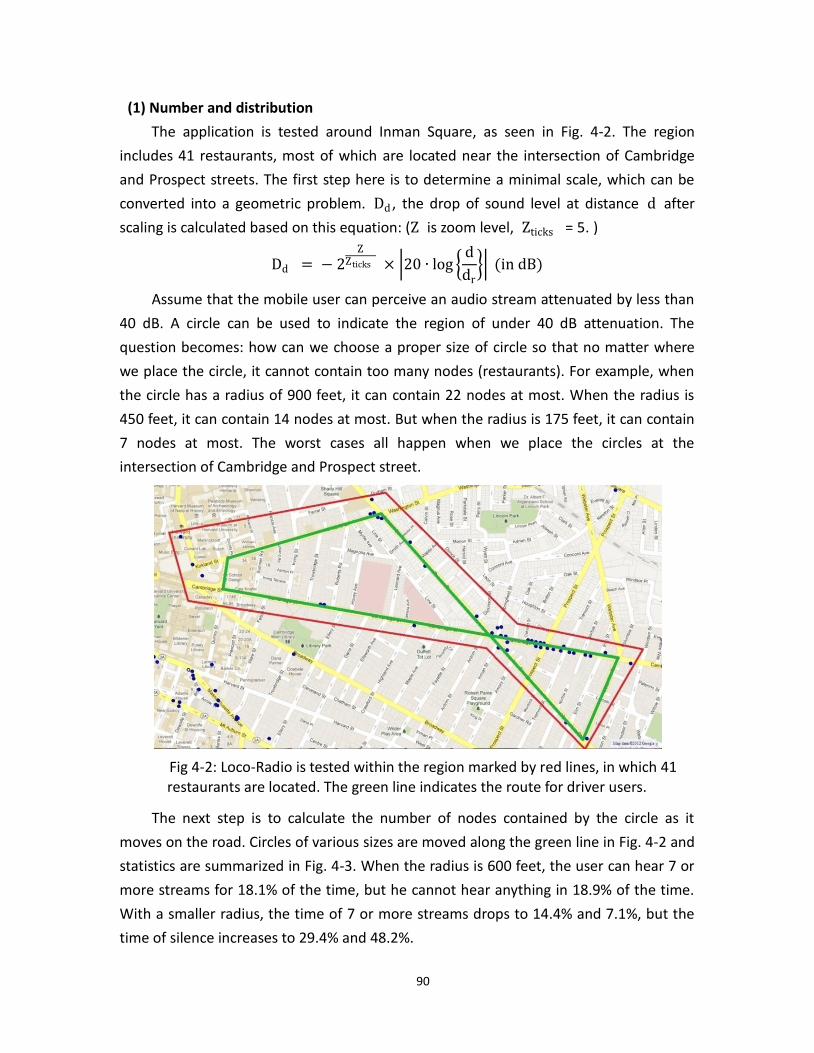
90
(1) Number and distribution
The application is tested around Inman Square, as seen in Fig. 4-2. The region
includes 41 restaurants, most of which are located near the intersection of Cambridge
and Prospect streets. The first step here is to determine a minimal scale, which can be
converted into a geometric problem. Dd , the drop of sound level at distance d after
scaling is calculated based on this equation: (Z is zoom level, Zticks = 5. )
Dd = − 2Z
Zticks × 20 ∙ log d
dr (in dB)
Assume that the mobile user can perceive an audio stream attenuated by less than
40 dB. A circle can be used to indicate the region of under 40 dB attenuation. The
question becomes: how can we choose a proper size of circle so that no matter where
we place the circle, it cannot contain too many nodes (restaurants). For example, when
the circle has a radius of 900 feet, it can contain 22 nodes at most. When the radius is
450 feet, it can contain 14 nodes at most. But when the radius is 175 feet, it can contain
7 nodes at most. The worst cases all happen when we place the circles at the
intersection of Cambridge and Prospect street.
Fig 4-2: Loco-Radio is tested within the region marked by red lines, in which 41 restaurants are located. The green line indicates the route for driver users.
The next step is to calculate the number of nodes contained by the circle as it
moves on the road. Circles of various sizes are moved along the green line in Fig. 4-2 and
statistics are summarized in Fig. 4-3. When the radius is 600 feet, the user can hear 7 or
more streams for 18.1% of the time, but he cannot hear anything in 18.9% of the time.
With a smaller radius, the time of 7 or more streams drops to 14.4% and 7.1%, but the
time of silence increases to 29.4% and 48.2%.
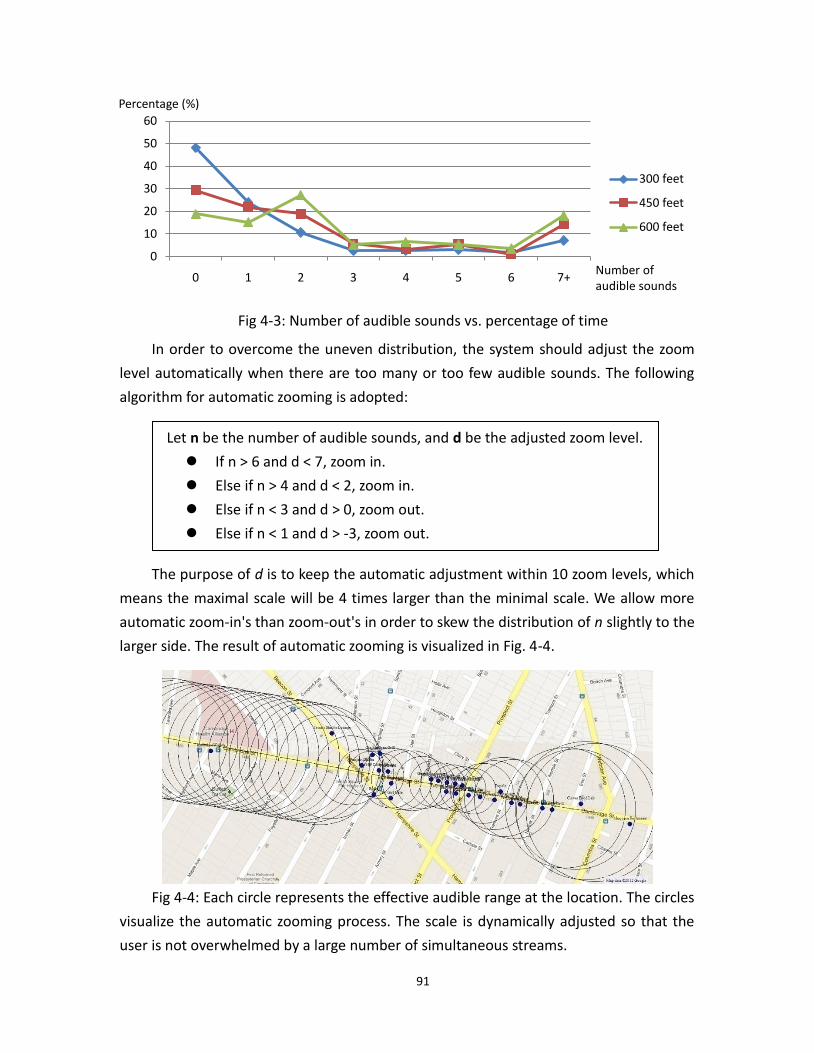
91
Fig 4-3: Number of audible sounds vs. percentage of time
In order to overcome the uneven distribution, the system should adjust the zoom
level automatically when there are too many or too few audible sounds. The following
algorithm for automatic zooming is adopted:
Let n be the number of audible sounds, and d be the adjusted zoom level.
If n > 6 and d < 7, zoom in.
Else if n > 4 and d < 2, zoom in.
Else if n < 3 and d > 0, zoom out.
Else if n < 1 and d > -3, zoom out.
The purpose of d is to keep the automatic adjustment within 10 zoom levels, which
means the maximal scale will be 4 times larger than the minimal scale. We allow more
automatic zoom-in's than zoom-out's in order to skew the distribution of n slightly to the
larger side. The result of automatic zooming is visualized in Fig. 4-4.
Fig 4-4: Each circle represents the effective audible range at the location. The circles
visualize the automatic zooming process. The scale is dynamically adjusted so that the
user is not overwhelmed by a large number of simultaneous streams.
0
10
20
30
40
50
60
0 1 2 3 4 5 6 7+
300 feet
450 feet
600 feet
Number of audible sounds
Percentage (%)
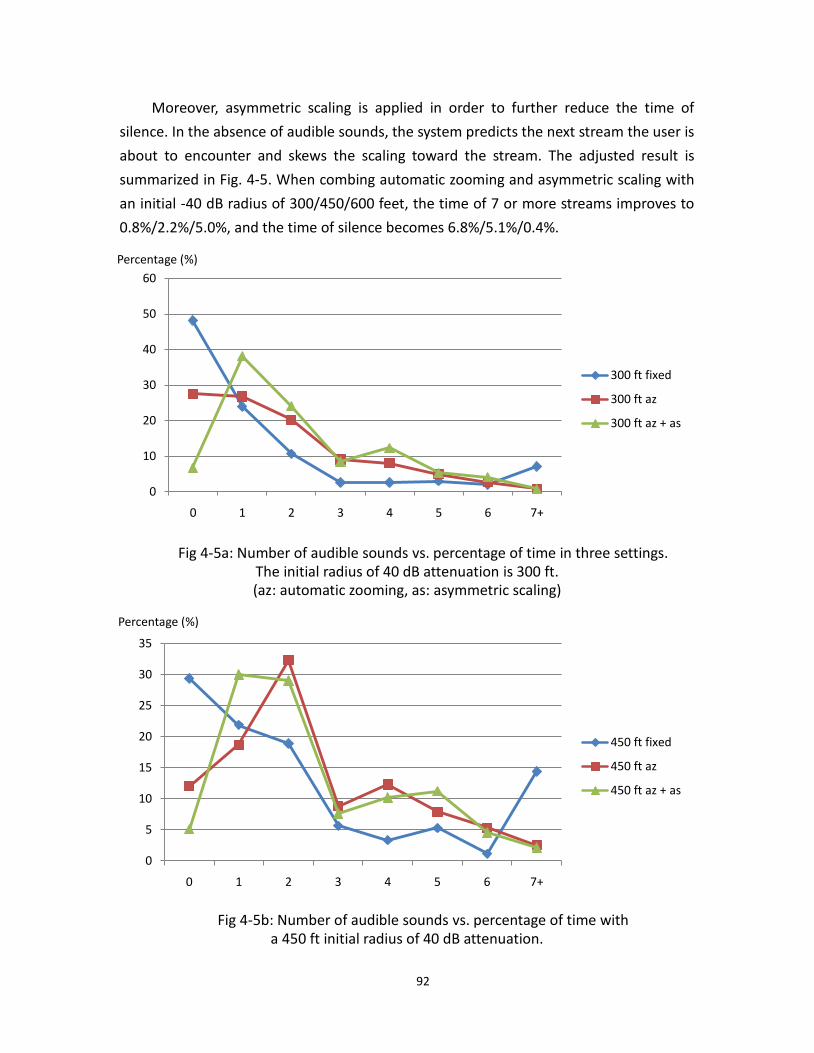
92
Moreover, asymmetric scaling is applied in order to further reduce the time of
silence. In the absence of audible sounds, the system predicts the next stream the user is
about to encounter and skews the scaling toward the stream. The adjusted result is
summarized in Fig. 4-5. When combing automatic zooming and asymmetric scaling with
an initial -40 dB radius of 300/450/600 feet, the time of 7 or more streams improves to
0.8%/2.2%/5.0%, and the time of silence becomes 6.8%/5.1%/0.4%.
Fig 4-5a: Number of audible sounds vs. percentage of time in three settings. The initial radius of 40 dB attenuation is 300 ft. (az: automatic zooming, as: asymmetric scaling)
Fig 4-5b: Number of audible sounds vs. percentage of time with a 450 ft initial radius of 40 dB attenuation.
0
10
20
30
40
50
60
0 1 2 3 4 5 6 7+
300 ft fixed
300 ft az
300 ft az + as
0
5
10
15
20
25
30
35
0 1 2 3 4 5 6 7+
450 ft fixed
450 ft az
450 ft az + as
Percentage (%)
Percentage (%)
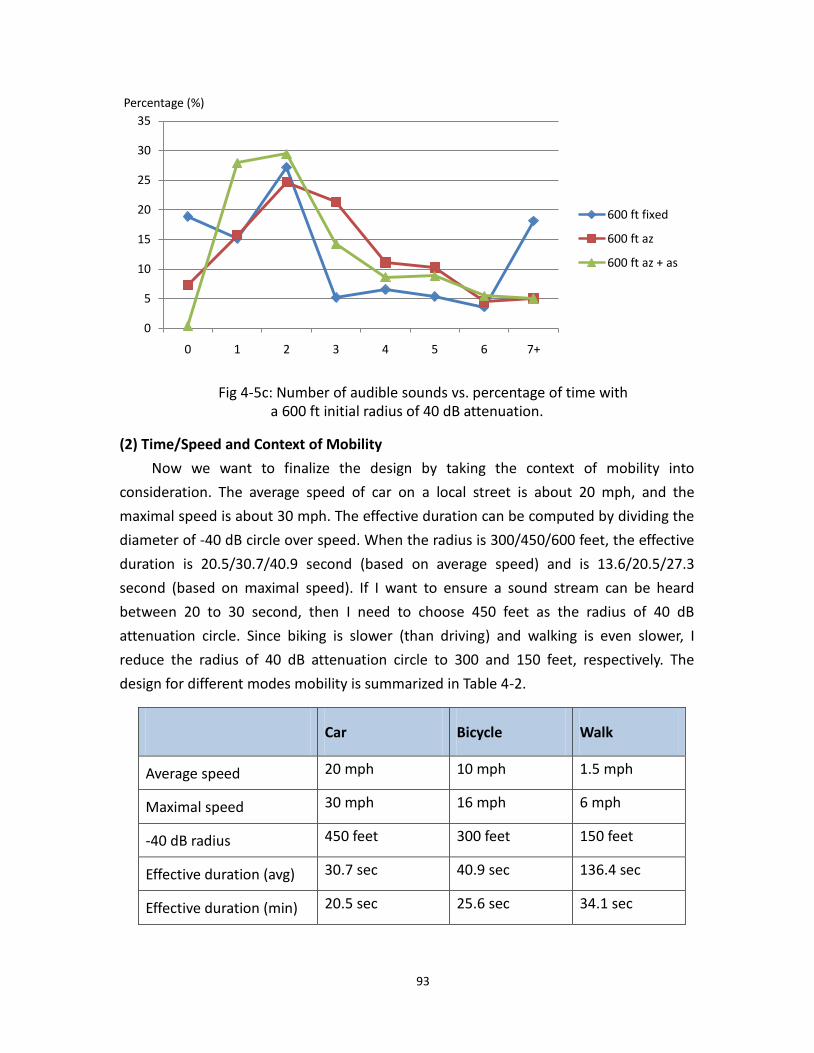
93
Fig 4-5c: Number of audible sounds vs. percentage of time with a 600 ft initial radius of 40 dB attenuation.
(2) Time/Speed and Context of Mobility
Now we want to finalize the design by taking the context of mobility into
consideration. The average speed of car on a local street is about 20 mph, and the
maximal speed is about 30 mph. The effective duration can be computed by dividing the
diameter of -40 dB circle over speed. When the radius is 300/450/600 feet, the effective
duration is 20.5/30.7/40.9 second (based on average speed) and is 13.6/20.5/27.3
second (based on maximal speed). If I want to ensure a sound stream can be heard
between 20 to 30 second, then I need to choose 450 feet as the radius of 40 dB
attenuation circle. Since biking is slower (than driving) and walking is even slower, I
reduce the radius of 40 dB attenuation circle to 300 and 150 feet, respectively. The
design for different modes mobility is summarized in Table 4-2.
Car Bicycle Walk
Average speed 20 mph 10 mph 1.5 mph
Maximal speed 30 mph 16 mph 6 mph
-40 dB radius 450 feet 300 feet 150 feet
Effective duration (avg) 30.7 sec 40.9 sec 136.4 sec
Effective duration (min) 20.5 sec 25.6 sec 34.1 sec
0
5
10
15
20
25
30
35
0 1 2 3 4 5 6 7+
600 ft fixed
600 ft az
600 ft az + as
Percentage (%)
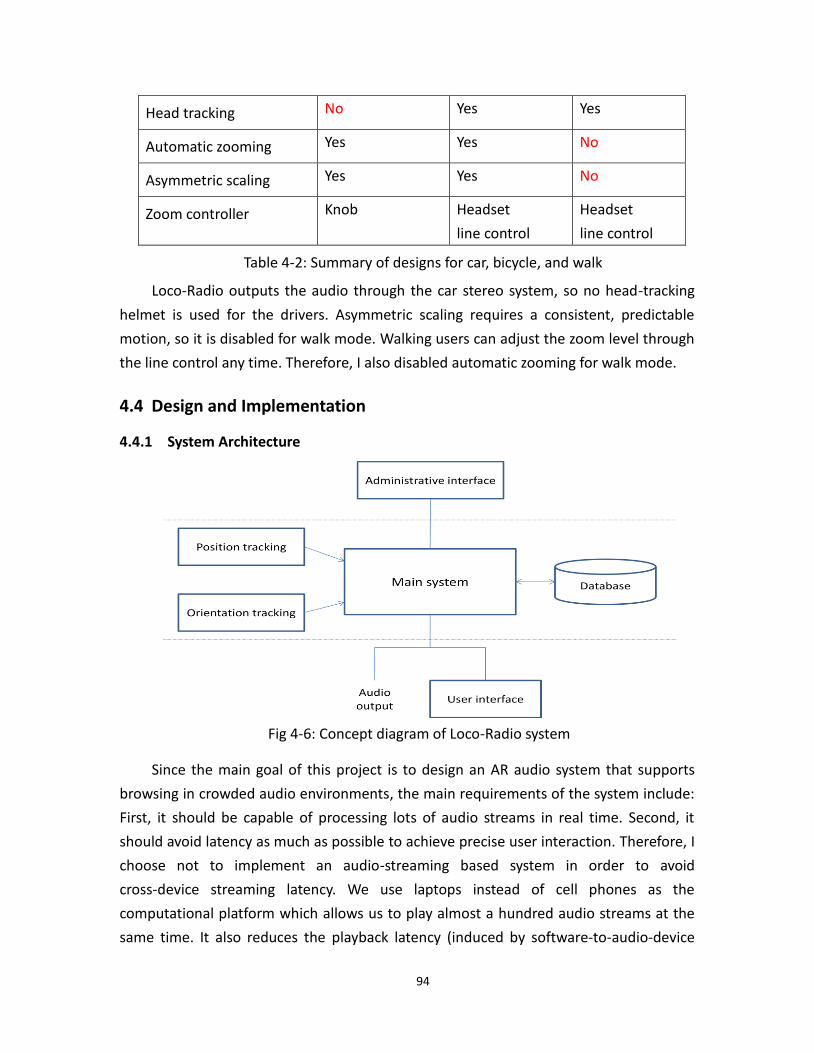
94
Head tracking No Yes Yes
Automatic zooming Yes Yes No
Asymmetric scaling Yes Yes No
Zoom controller Knob Headset
line control
Headset
line control
Table 4-2: Summary of designs for car, bicycle, and walk
Loco-Radio outputs the audio through the car stereo system, so no head-tracking
helmet is used for the drivers. Asymmetric scaling requires a consistent, predictable
motion, so it is disabled for walk mode. Walking users can adjust the zoom level through
the line control any time. Therefore, I also disabled automatic zooming for walk mode.
4.4 Design and Implementation
4.4.1 System Architecture
Fig 4-6: Concept diagram of Loco-Radio system
Since the main goal of this project is to design an AR audio system that supports
browsing in crowded audio environments, the main requirements of the system include:
First, it should be capable of processing lots of audio streams in real time. Second, it
should avoid latency as much as possible to achieve precise user interaction. Therefore, I
choose not to implement an audio-streaming based system in order to avoid
cross-device streaming latency. We use laptops instead of cell phones as the
computational platform which allows us to play almost a hundred audio streams at the
same time. It also reduces the playback latency (induced by software-to-audio-device
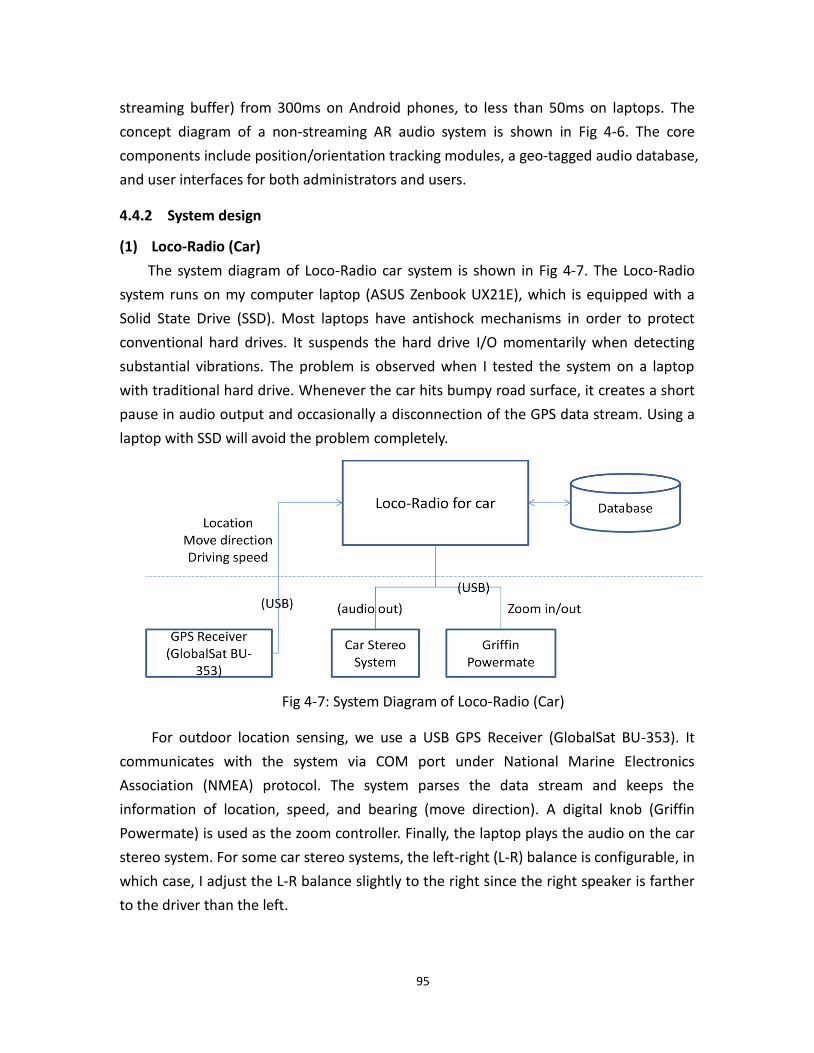
95
streaming buffer) from 300ms on Android phones, to less than 50ms on laptops. The
concept diagram of a non-streaming AR audio system is shown in Fig 4-6. The core
components include position/orientation tracking modules, a geo-tagged audio database,
and user interfaces for both administrators and users.
4.4.2 System design
(1) Loco-Radio (Car)
The system diagram of Loco-Radio car system is shown in Fig 4-7. The Loco-Radio
system runs on my computer laptop (ASUS Zenbook UX21E), which is equipped with a
Solid State Drive (SSD). Most laptops have antishock mechanisms in order to protect
conventional hard drives. It suspends the hard drive I/O momentarily when detecting
substantial vibrations. The problem is observed when I tested the system on a laptop
with traditional hard drive. Whenever the car hits bumpy road surface, it creates a short
pause in audio output and occasionally a disconnection of the GPS data stream. Using a
laptop with SSD will avoid the problem completely.
Fig 4-7: System Diagram of Loco-Radio (Car)
For outdoor location sensing, we use a USB GPS Receiver (GlobalSat BU-353). It
communicates with the system via COM port under National Marine Electronics
Association (NMEA) protocol. The system parses the data stream and keeps the
information of location, speed, and bearing (move direction). A digital knob (Griffin
Powermate) is used as the zoom controller. Finally, the laptop plays the audio on the car
stereo system. For some car stereo systems, the left-right (L-R) balance is configurable, in
which case, I adjust the L-R balance slightly to the right since the right speaker is farther
to the driver than the left.
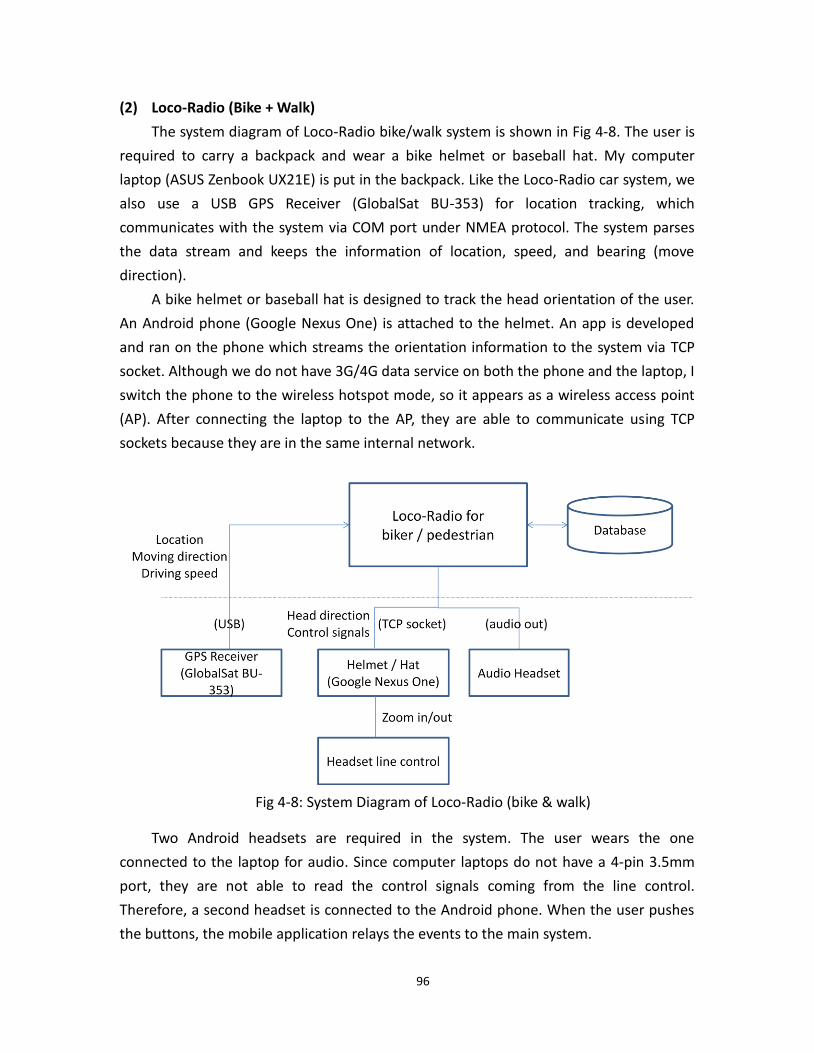
96
(2) Loco-Radio (Bike + Walk)
The system diagram of Loco-Radio bike/walk system is shown in Fig 4-8. The user is
required to carry a backpack and wear a bike helmet or baseball hat. My computer
laptop (ASUS Zenbook UX21E) is put in the backpack. Like the Loco-Radio car system, we
also use a USB GPS Receiver (GlobalSat BU-353) for location tracking, which
communicates with the system via COM port under NMEA protocol. The system parses
the data stream and keeps the information of location, speed, and bearing (move
direction).
A bike helmet or baseball hat is designed to track the head orientation of the user.
An Android phone (Google Nexus One) is attached to the helmet. An app is developed
and ran on the phone which streams the orientation information to the system via TCP
socket. Although we do not have 3G/4G data service on both the phone and the laptop, I
switch the phone to the wireless hotspot mode, so it appears as a wireless access point
(AP). After connecting the laptop to the AP, they are able to communicate using TCP
sockets because they are in the same internal network.
Fig 4-8: System Diagram of Loco-Radio (bike & walk)
Two Android headsets are required in the system. The user wears the one
connected to the laptop for audio. Since computer laptops do not have a 4-pin 3.5mm
port, they are not able to read the control signals coming from the line control.
Therefore, a second headset is connected to the Android phone. When the user pushes
the buttons, the mobile application relays the events to the main system.
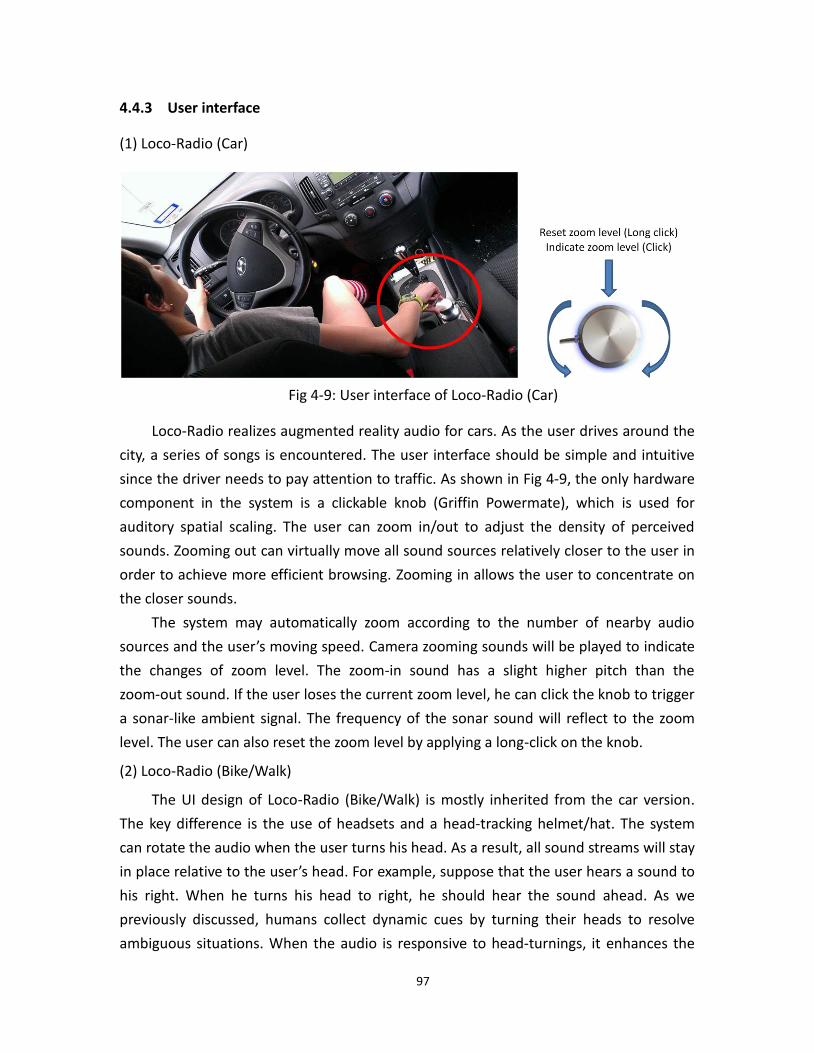
97
4.4.3 User interface
(1) Loco-Radio (Car)
Fig 4-9: User interface of Loco-Radio (Car)
Loco-Radio realizes augmented reality audio for cars. As the user drives around the
city, a series of songs is encountered. The user interface should be simple and intuitive
since the driver needs to pay attention to traffic. As shown in Fig 4-9, the only hardware
component in the system is a clickable knob (Griffin Powermate), which is used for
auditory spatial scaling. The user can zoom in/out to adjust the density of perceived
sounds. Zooming out can virtually move all sound sources relatively closer to the user in
order to achieve more efficient browsing. Zooming in allows the user to concentrate on
the closer sounds.
The system may automatically zoom according to the number of nearby audio
sources and the user’s moving speed. Camera zooming sounds will be played to indicate
the changes of zoom level. The zoom-in sound has a slight higher pitch than the
zoom-out sound. If the user loses the current zoom level, he can click the knob to trigger
a sonar-like ambient signal. The frequency of the sonar sound will reflect to the zoom
level. The user can also reset the zoom level by applying a long-click on the knob.
(2) Loco-Radio (Bike/Walk)
The UI design of Loco-Radio (Bike/Walk) is mostly inherited from the car version.
The key difference is the use of headsets and a head-tracking helmet/hat. The system
can rotate the audio when the user turns his head. As a result, all sound streams will stay
in place relative to the user’s head. For example, suppose that the user hears a sound to
his right. When he turns his head to right, he should hear the sound ahead. As we
previously discussed, humans collect dynamic cues by turning their heads to resolve
ambiguous situations. When the audio is responsive to head-turnings, it enhances the
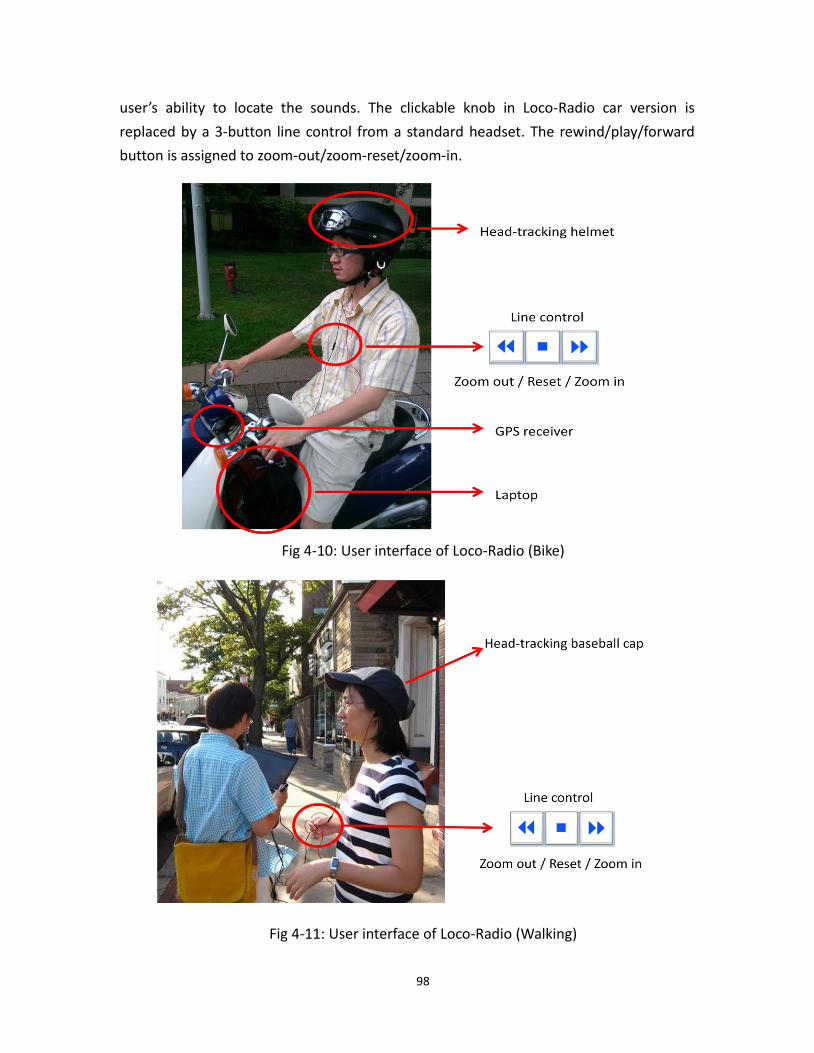
98
user’s ability to locate the sounds. The clickable knob in Loco-Radio car version is
replaced by a 3-button line control from a standard headset. The rewind/play/forward
button is assigned to zoom-out/zoom-reset/zoom-in.
Fig 4-10: User interface of Loco-Radio (Bike)
Fig 4-11: User interface of Loco-Radio (Walking)
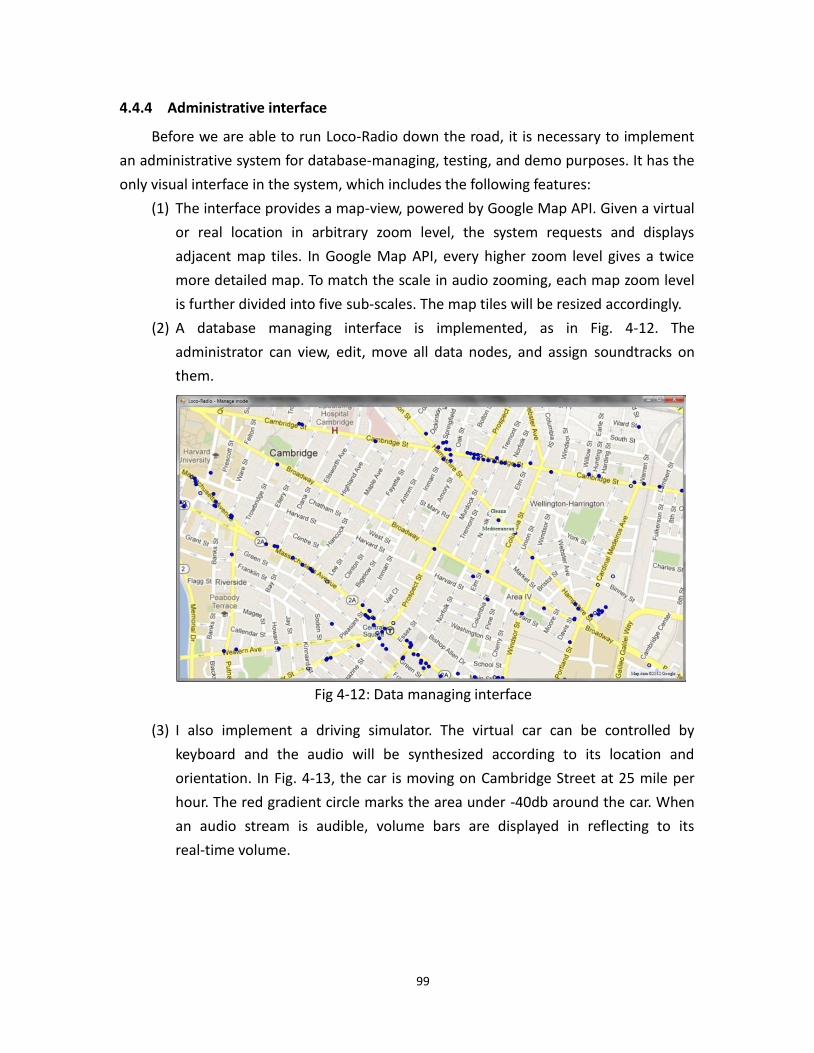
99
4.4.4 Administrative interface
Before we are able to run Loco-Radio down the road, it is necessary to implement
an administrative system for database-managing, testing, and demo purposes. It has the
only visual interface in the system, which includes the following features:
(1) The interface provides a map-view, powered by Google Map API. Given a virtual
or real location in arbitrary zoom level, the system requests and displays
adjacent map tiles. In Google Map API, every higher zoom level gives a twice
more detailed map. To match the scale in audio zooming, each map zoom level
is further divided into five sub-scales. The map tiles will be resized accordingly.
(2) A database managing interface is implemented, as in Fig. 4-12. The
administrator can view, edit, move all data nodes, and assign soundtracks on
them.
Fig 4-12: Data managing interface
(3) I also implement a driving simulator. The virtual car can be controlled by
keyboard and the audio will be synthesized according to its location and
orientation. In Fig. 4-13, the car is moving on Cambridge Street at 25 mile per
hour. The red gradient circle marks the area under -40db around the car. When
an audio stream is audible, volume bars are displayed in reflecting to its
real-time volume.
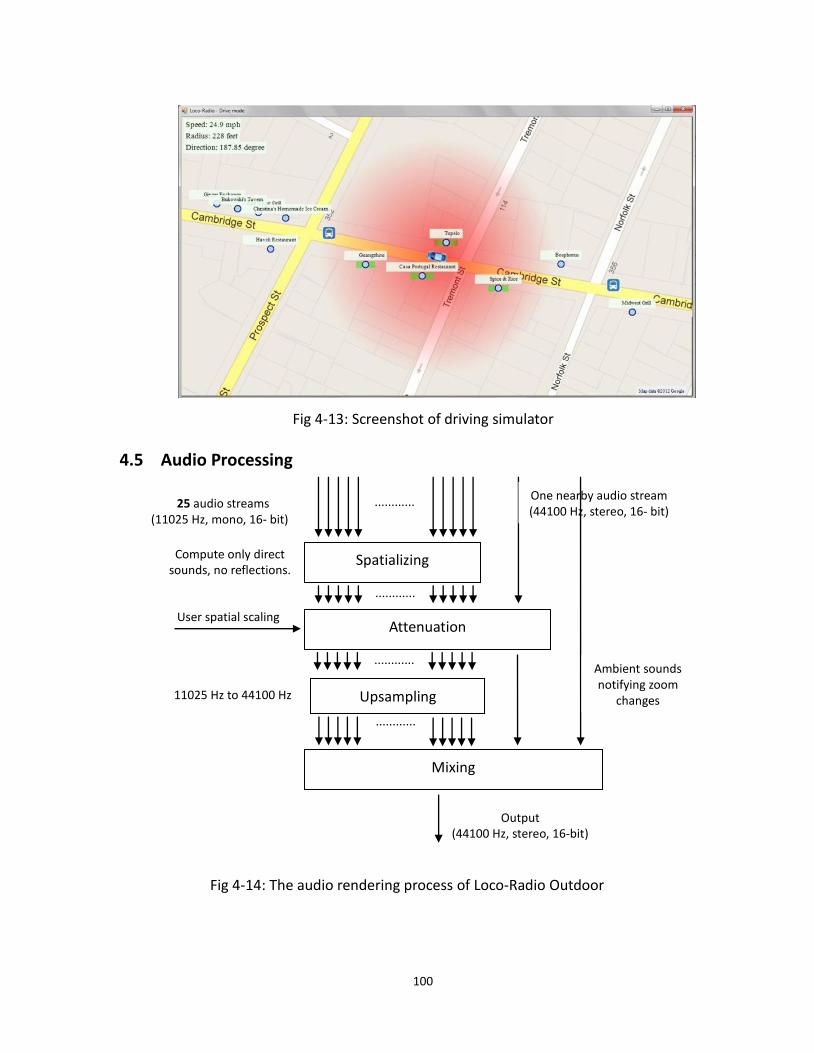
100
Fig 4-13: Screenshot of driving simulator
4.5 Audio Processing
Fig 4-14: The audio rendering process of Loco-Radio Outdoor
Upsampling
Attenuation
25 audio streams (11025 Hz, mono, 16- bit)
Compute only direct sounds, no reflections.
Spatializing
User spatial scaling
Output (44100 Hz, stereo, 16-bit)
............
............
............
One nearby audio stream (44100 Hz, stereo, 16- bit)
Mixing
11025 Hz to 44100 Hz
............
Ambient sounds notifying zoom
changes
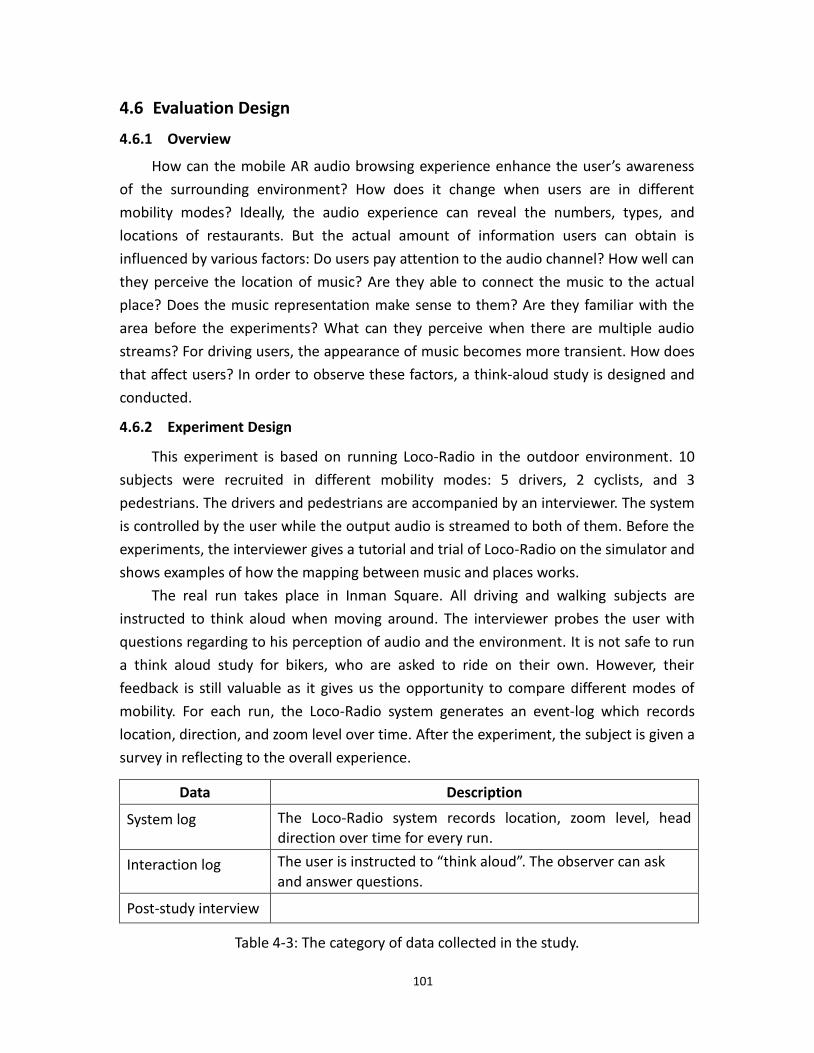
101
4.6 Evaluation Design
4.6.1 Overview
How can the mobile AR audio browsing experience enhance the user’s awareness
of the surrounding environment? How does it change when users are in different
mobility modes? Ideally, the audio experience can reveal the numbers, types, and
locations of restaurants. But the actual amount of information users can obtain is
influenced by various factors: Do users pay attention to the audio channel? How well can
they perceive the location of music? Are they able to connect the music to the actual
place? Does the music representation make sense to them? Are they familiar with the
area before the experiments? What can they perceive when there are multiple audio
streams? For driving users, the appearance of music becomes more transient. How does
that affect users? In order to observe these factors, a think-aloud study is designed and
conducted.
4.6.2 Experiment Design
This experiment is based on running Loco-Radio in the outdoor environment. 10
subjects were recruited in different mobility modes: 5 drivers, 2 cyclists, and 3
pedestrians. The drivers and pedestrians are accompanied by an interviewer. The system
is controlled by the user while the output audio is streamed to both of them. Before the
experiments, the interviewer gives a tutorial and trial of Loco-Radio on the simulator and
shows examples of how the mapping between music and places works.
The real run takes place in Inman Square. All driving and walking subjects are
instructed to think aloud when moving around. The interviewer probes the user with
questions regarding to his perception of audio and the environment. It is not safe to run
a think aloud study for bikers, who are asked to ride on their own. However, their
feedback is still valuable as it gives us the opportunity to compare different modes of
mobility. For each run, the Loco-Radio system generates an event-log which records
location, direction, and zoom level over time. After the experiment, the subject is given a
survey in reflecting to the overall experience.
Data Description
System log The Loco-Radio system records location, zoom level, head direction over time for every run.
Interaction log The user is instructed to “think aloud”. The observer can ask
and answer questions.
Post-study interview
Table 4-3: The category of data collected in the study.
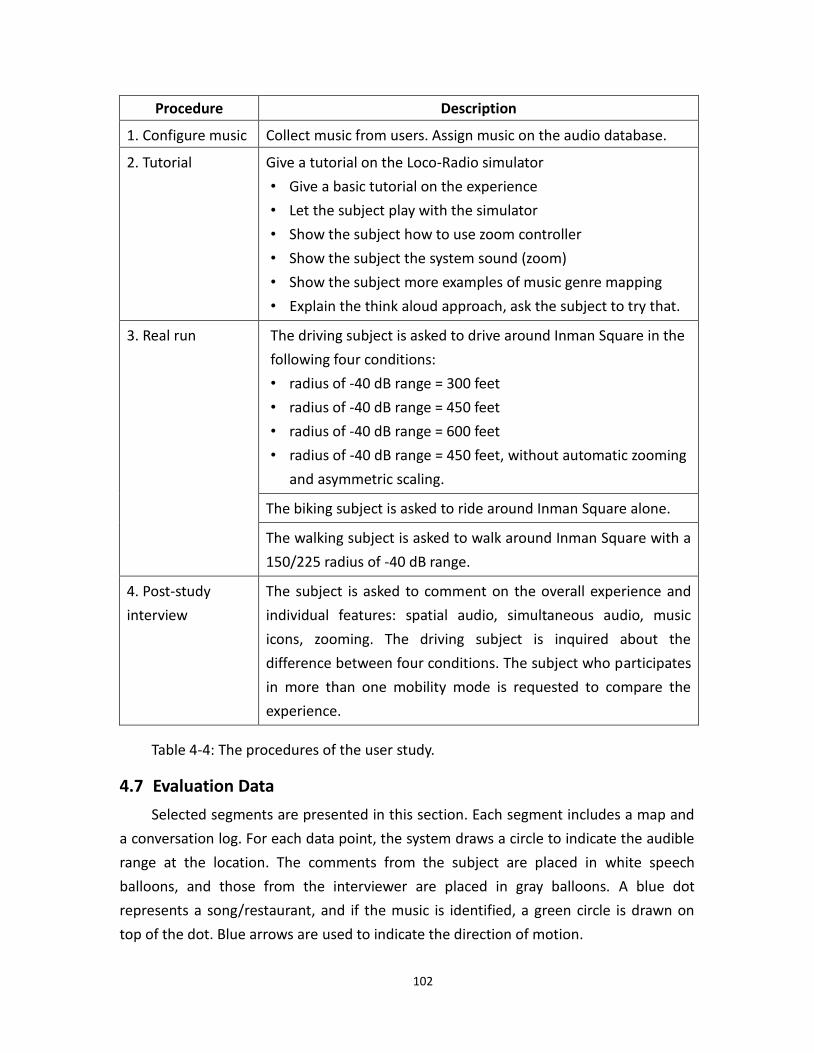
102
Procedure Description
1. Configure music Collect music from users. Assign music on the audio database.
2. Tutorial Give a tutorial on the Loco-Radio simulator
• Give a basic tutorial on the experience
• Let the subject play with the simulator
• Show the subject how to use zoom controller
• Show the subject the system sound (zoom)
• Show the subject more examples of music genre mapping
• Explain the think aloud approach, ask the subject to try that.
3. Real run The driving subject is asked to drive around Inman Square in the
following four conditions:
• radius of -40 dB range = 300 feet
• radius of -40 dB range = 450 feet
• radius of -40 dB range = 600 feet
• radius of -40 dB range = 450 feet, without automatic zooming
and asymmetric scaling.
The biking subject is asked to ride around Inman Square alone.
The walking subject is asked to walk around Inman Square with a
150/225 radius of -40 dB range.
4. Post-study
interview
The subject is asked to comment on the overall experience and
individual features: spatial audio, simultaneous audio, music
icons, zooming. The driving subject is inquired about the
difference between four conditions. The subject who participates
in more than one mobility mode is requested to compare the
experience.
Table 4-4: The procedures of the user study.
4.7 Evaluation Data
Selected segments are presented in this section. Each segment includes a map and
a conversation log. For each data point, the system draws a circle to indicate the audible
range at the location. The comments from the subject are placed in white speech
balloons, and those from the interviewer are placed in gray balloons. A blue dot
represents a song/restaurant, and if the music is identified, a green circle is drawn on
top of the dot. Blue arrows are used to indicate the direction of motion.
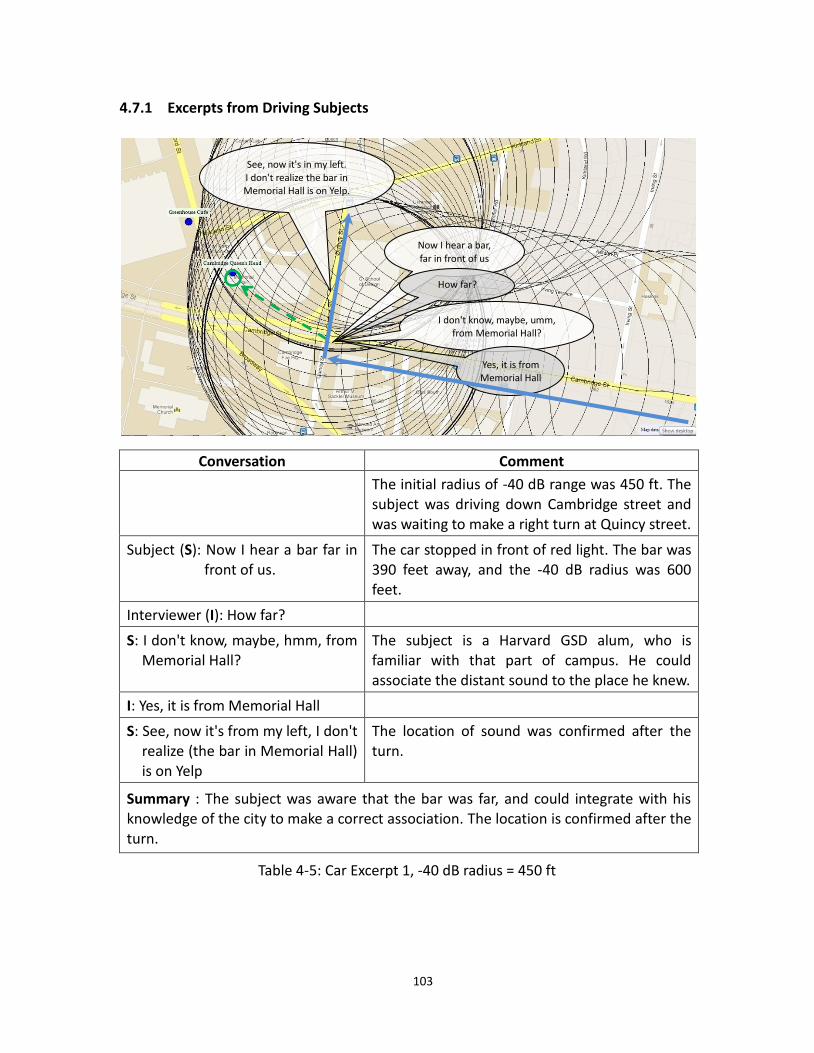
103
4.7.1 Excerpts from Driving Subjects
Conversation Comment
The initial radius of -40 dB range was 450 ft. The subject was driving down Cambridge street and was waiting to make a right turn at Quincy street.
Subject (S): Now I hear a bar far in front of us.
The car stopped in front of red light. The bar was 390 feet away, and the -40 dB radius was 600 feet.
Interviewer (I): How far? S: I don't know, maybe, hmm, from
Memorial Hall? The subject is a Harvard GSD alum, who is familiar with that part of campus. He could associate the distant sound to the place he knew.
I: Yes, it is from Memorial Hall S: See, now it's from my left, I don't
realize (the bar in Memorial Hall)
is on Yelp
The location of sound was confirmed after the turn.
Summary : The subject was aware that the bar was far, and could integrate with his knowledge of the city to make a correct association. The location is confirmed after the turn.
Table 4-5: Car Excerpt 1, -40 dB radius = 450 ft
Now I hear a bar,
far in front of us
How far?
I don't know, maybe, umm, from Memorial Hall?
Yes, it is from Memorial Hall
See, now it's in my left. I don't realize the bar in Memorial Hall is on Yelp.
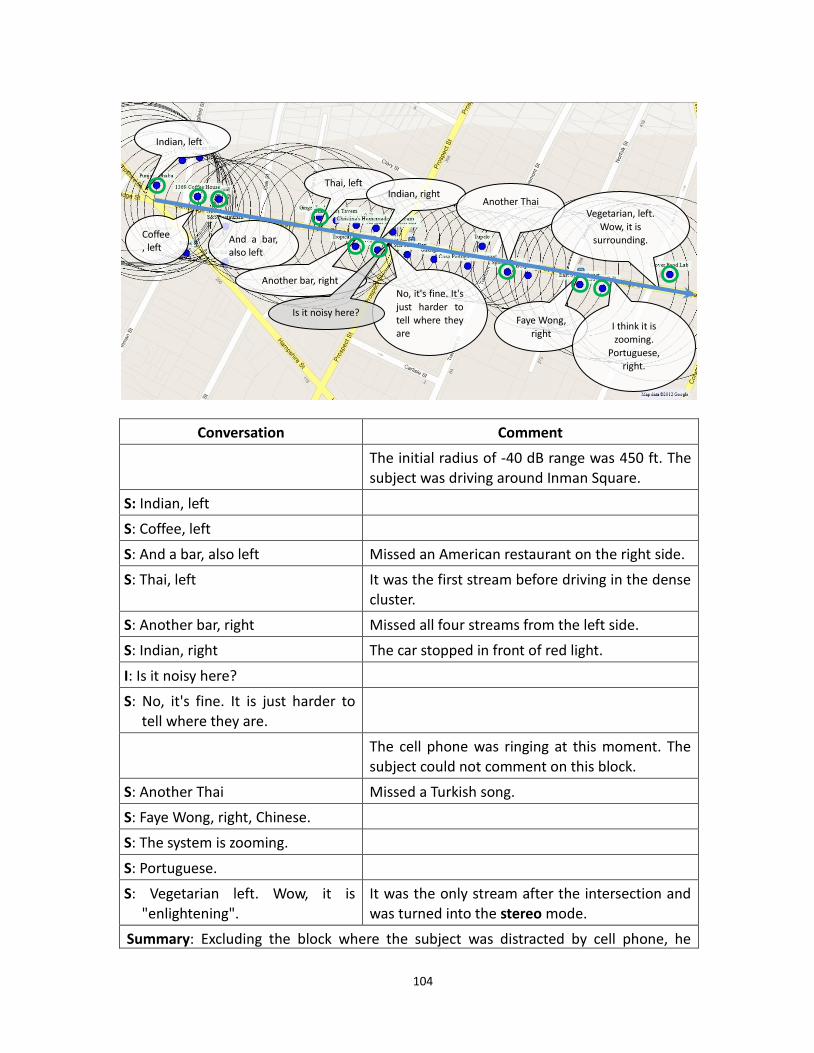
104
Conversation Comment
The initial radius of -40 dB range was 450 ft. The subject was driving around Inman Square.
S: Indian, left S: Coffee, left S: And a bar, also left Missed an American restaurant on the right side.
S: Thai, left It was the first stream before driving in the dense cluster.
S: Another bar, right Missed all four streams from the left side.
S: Indian, right The car stopped in front of red light.
I: Is it noisy here? S: No, it's fine. It is just harder to
tell where they are.
The cell phone was ringing at this moment. The
subject could not comment on this block.
S: Another Thai Missed a Turkish song.
S: Faye Wong, right, Chinese. S: The system is zooming. S: Portuguese. S: Vegetarian left. Wow, it is
"enlightening". It was the only stream after the intersection and was turned into the stereo mode.
Summary: Excluding the block where the subject was distracted by cell phone, he
Indian, left
Coffee, left
And a bar, also left
Thai, left
Another bar, right
Indian, right
No, it's fine. It's
just harder to tell where they are
Is it noisy here?
Another Thai
Faye Wong,
right
Vegetarian, left.
Wow, it is surrounding.
I think it is zooming.
Portuguese, right.
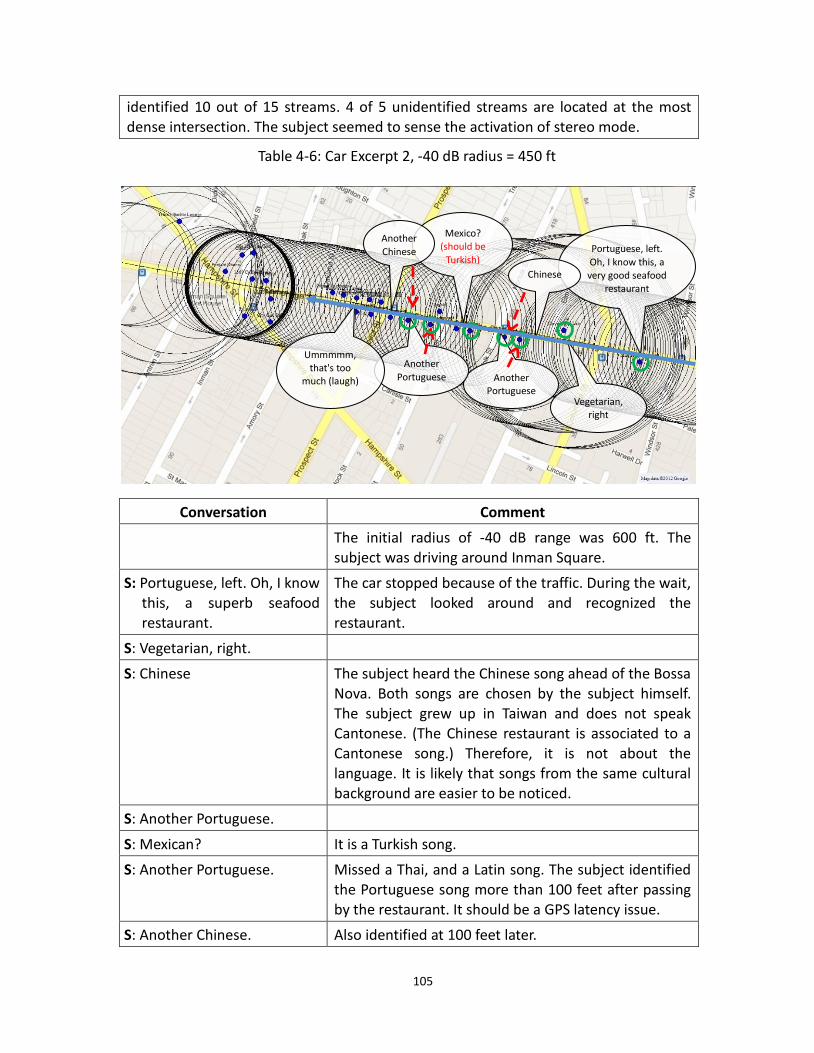
105
identified 10 out of 15 streams. 4 of 5 unidentified streams are located at the most dense intersection. The subject seemed to sense the activation of stereo mode.
Table 4-6: Car Excerpt 2, -40 dB radius = 450 ft
Conversation Comment
The initial radius of -40 dB range was 600 ft. The subject was driving around Inman Square.
S: Portuguese, left. Oh, I know this, a superb seafood restaurant.
The car stopped because of the traffic. During the wait, the subject looked around and recognized the restaurant.
S: Vegetarian, right. S: Chinese The subject heard the Chinese song ahead of the Bossa
Nova. Both songs are chosen by the subject himself. The subject grew up in Taiwan and does not speak Cantonese. (The Chinese restaurant is associated to a Cantonese song.) Therefore, it is not about the
language. It is likely that songs from the same cultural background are easier to be noticed.
S: Another Portuguese. S: Mexican? It is a Turkish song.
S: Another Portuguese. Missed a Thai, and a Latin song. The subject identified the Portuguese song more than 100 feet after passing by the restaurant. It should be a GPS latency issue.
S: Another Chinese. Also identified at 100 feet later.
Portuguese, left.
Oh, I know this, a very good seafood
restaurant
Vegetarian, right
Chinese
Another Portuguese
Mexico? (should be
Turkish)
Another
Portuguese
Another
Chinese
Ummmmm, that's too
much (laugh)
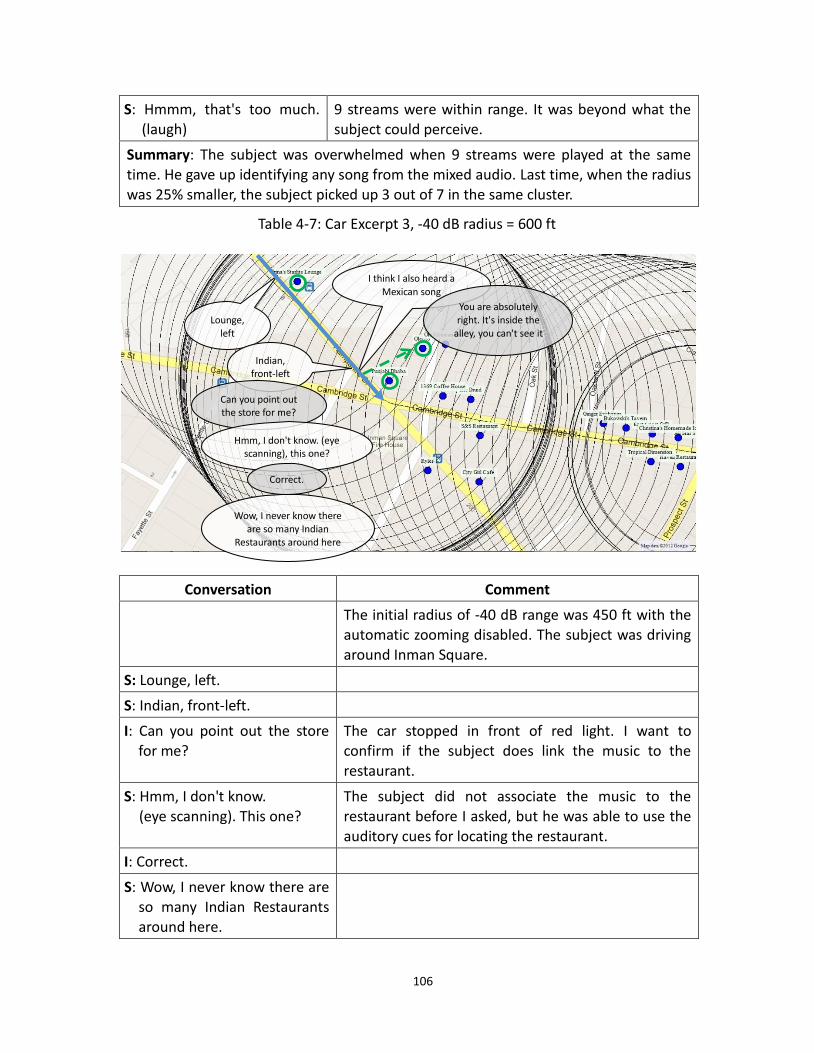
106
S: Hmmm, that's too much. (laugh)
9 streams were within range. It was beyond what the subject could perceive.
Summary: The subject was overwhelmed when 9 streams were played at the same time. He gave up identifying any song from the mixed audio. Last time, when the radius was 25% smaller, the subject picked up 3 out of 7 in the same cluster.
Table 4-7: Car Excerpt 3, -40 dB radius = 600 ft
Conversation Comment
The initial radius of -40 dB range was 450 ft with the automatic zooming disabled. The subject was driving around Inman Square.
S: Lounge, left. S: Indian, front-left. I: Can you point out the store
for me? The car stopped in front of red light. I want to confirm if the subject does link the music to the
restaurant.
S: Hmm, I don't know. (eye scanning). This one?
The subject did not associate the music to the restaurant before I asked, but he was able to use the auditory cues for locating the restaurant.
I: Correct. S: Wow, I never know there are
so many Indian Restaurants around here.
Lounge, left
Indian, front-left
Can you point out the store for me?
Hmm, I don't know. (eye scanning), this one?
Correct.
Wow, I never know there are so many Indian
Restaurants around here
I think I also heard a
Mexican song
You are absolutely right. It's inside the
alley, you can't see it
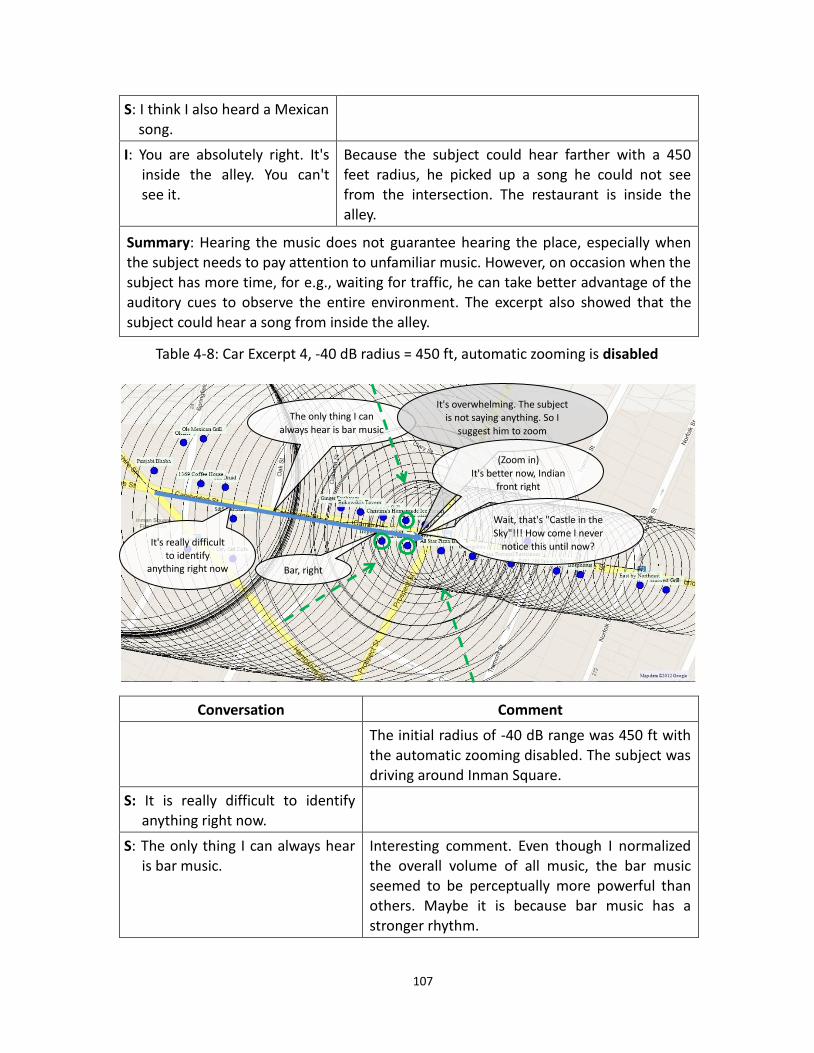
107
S: I think I also heard a Mexican song.
I: You are absolutely right. It's inside the alley. You can't see it.
Because the subject could hear farther with a 450 feet radius, he picked up a song he could not see from the intersection. The restaurant is inside the alley.
Summary: Hearing the music does not guarantee hearing the place, especially when the subject needs to pay attention to unfamiliar music. However, on occasion when the subject has more time, for e.g., waiting for traffic, he can take better advantage of the auditory cues to observe the entire environment. The excerpt also showed that the
subject could hear a song from inside the alley.
Table 4-8: Car Excerpt 4, -40 dB radius = 450 ft, automatic zooming is disabled
Conversation Comment
The initial radius of -40 dB range was 450 ft with
the automatic zooming disabled. The subject was driving around Inman Square.
S: It is really difficult to identify anything right now.
S: The only thing I can always hear is bar music.
Interesting comment. Even though I normalized the overall volume of all music, the bar music seemed to be perceptually more powerful than others. Maybe it is because bar music has a stronger rhythm.
It's really difficult to identify
anything right now
The only thing I can
always hear is bar music
Bar, right
It's overwhelming. The subject is not saying anything. So I
suggest him to zoom
(Zoom in)
It's better now, Indian front right
Wait, that's "Castle in the
Sky"!!! How come I never notice this until now?
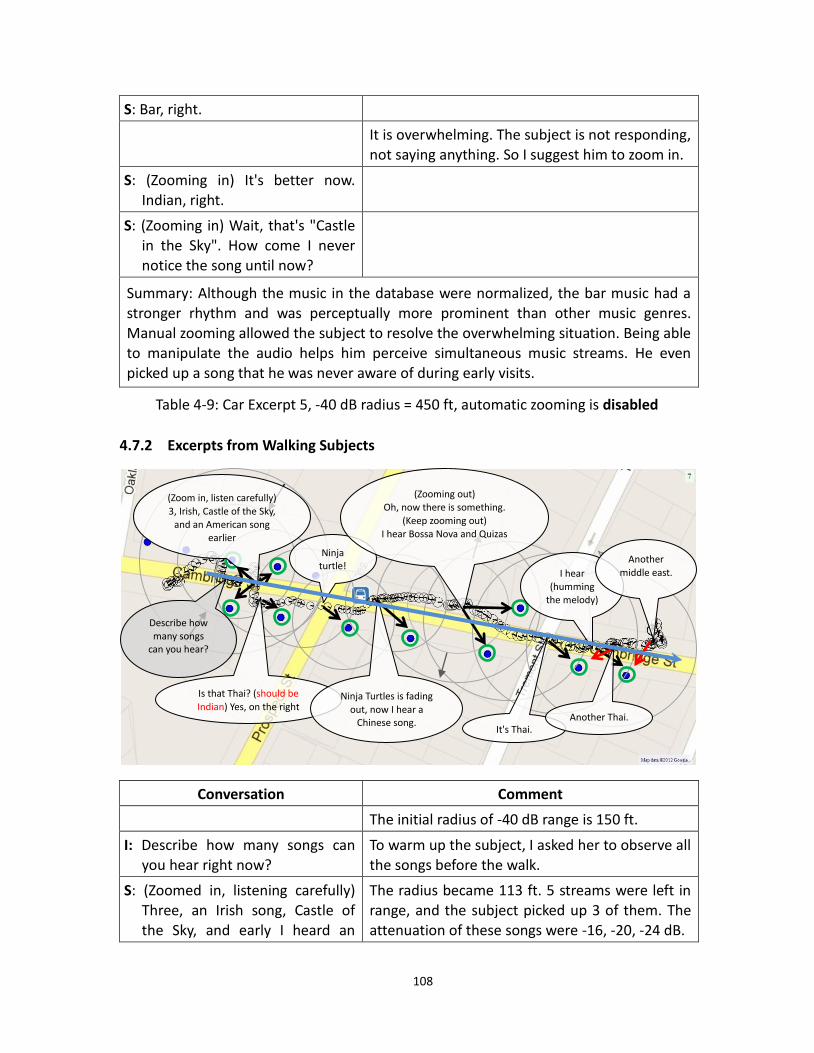
108
S: Bar, right. It is overwhelming. The subject is not responding,
not saying anything. So I suggest him to zoom in.
S: (Zooming in) It's better now. Indian, right.
S: (Zooming in) Wait, that's "Castle in the Sky". How come I never notice the song until now?
Summary: Although the music in the database were normalized, the bar music had a stronger rhythm and was perceptually more prominent than other music genres.
Manual zooming allowed the subject to resolve the overwhelming situation. Being able to manipulate the audio helps him perceive simultaneous music streams. He even picked up a song that he was never aware of during early visits.
Table 4-9: Car Excerpt 5, -40 dB radius = 450 ft, automatic zooming is disabled
4.7.2 Excerpts from Walking Subjects
Conversation Comment
The initial radius of -40 dB range is 150 ft.
I: Describe how many songs can you hear right now?
To warm up the subject, I asked her to observe all the songs before the walk.
S: (Zoomed in, listening carefully) Three, an Irish song, Castle of the Sky, and early I heard an
The radius became 113 ft. 5 streams were left in range, and the subject picked up 3 of them. The attenuation of these songs were -16, -20, -24 dB.
Describe how many songs
can you hear?
(Zoom in, listen carefully)
3, Irish, Castle of the Sky, and an American song
earlier
Is that Thai? (should be
Indian) Yes, on the right
Ninja turtle!
Ninja Turtles is fading
out, now I hear a Chinese song.
(Zooming out) Oh, now there is something.
(Keep zooming out) I hear Bossa Nova and Quizas
It's Thai. again
I hear (humming
the melody)
Another
middle east.
Another Thai.
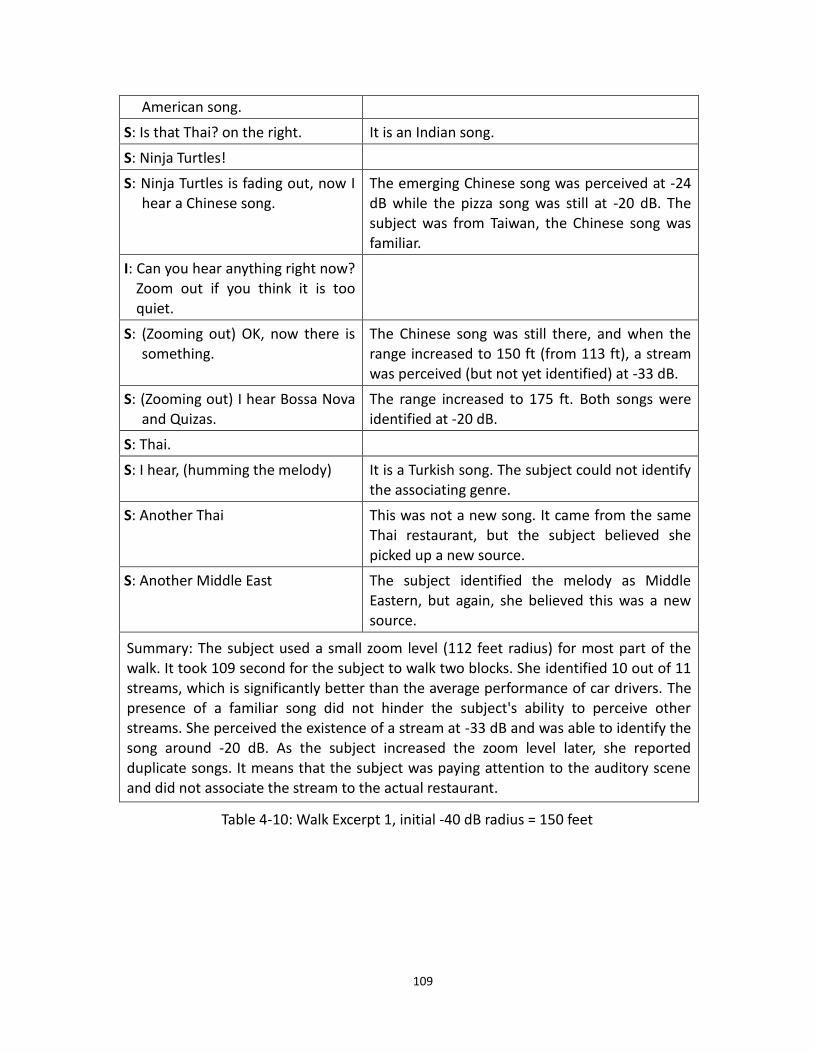
109
American song.
S: Is that Thai? on the right. It is an Indian song.
S: Ninja Turtles! S: Ninja Turtles is fading out, now I
hear a Chinese song. The emerging Chinese song was perceived at -24 dB while the pizza song was still at -20 dB. The subject was from Taiwan, the Chinese song was familiar.
I: Can you hear anything right now? Zoom out if you think it is too quiet.
S: (Zooming out) OK, now there is something.
The Chinese song was still there, and when the range increased to 150 ft (from 113 ft), a stream was perceived (but not yet identified) at -33 dB.
S: (Zooming out) I hear Bossa Nova and Quizas.
The range increased to 175 ft. Both songs were identified at -20 dB.
S: Thai. S: I hear, (humming the melody) It is a Turkish song. The subject could not identify
the associating genre.
S: Another Thai This was not a new song. It came from the same Thai restaurant, but the subject believed she
picked up a new source.
S: Another Middle East The subject identified the melody as Middle Eastern, but again, she believed this was a new source.
Summary: The subject used a small zoom level (112 feet radius) for most part of the walk. It took 109 second for the subject to walk two blocks. She identified 10 out of 11 streams, which is significantly better than the average performance of car drivers. The presence of a familiar song did not hinder the subject's ability to perceive other streams. She perceived the existence of a stream at -33 dB and was able to identify the song around -20 dB. As the subject increased the zoom level later, she reported
duplicate songs. It means that the subject was paying attention to the auditory scene and did not associate the stream to the actual restaurant.
Table 4-10: Walk Excerpt 1, initial -40 dB radius = 150 feet
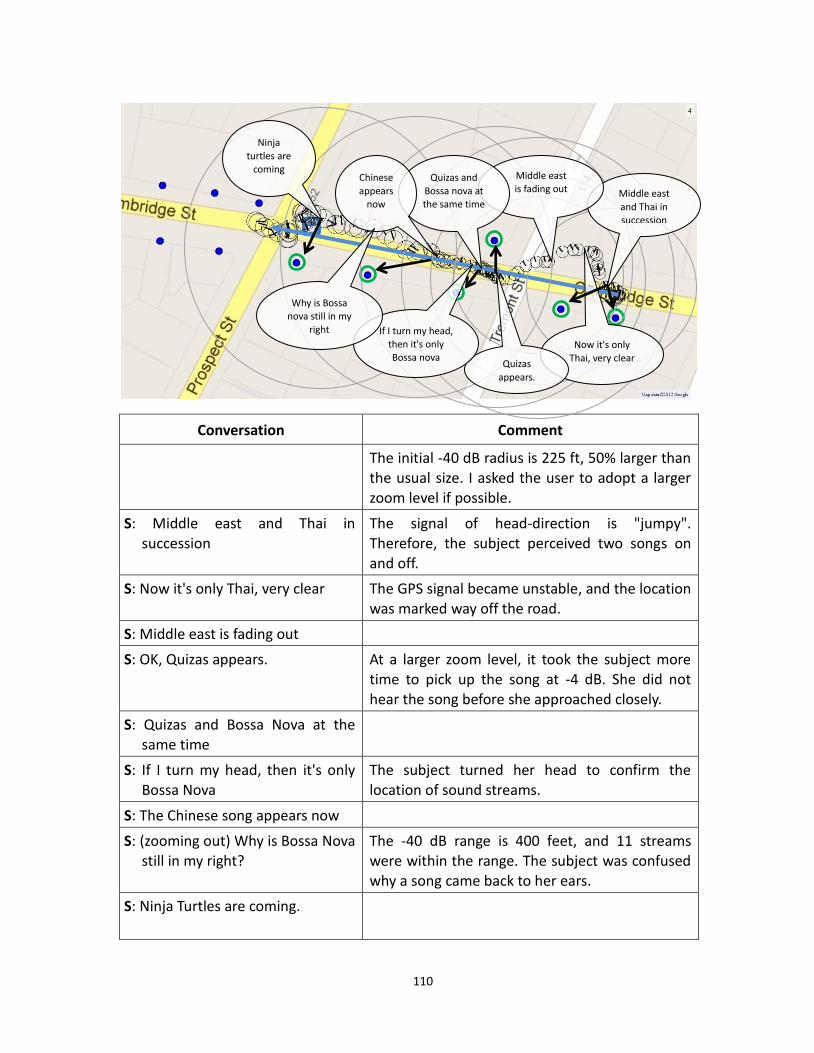
110
Conversation Comment
The initial -40 dB radius is 225 ft, 50% larger than the usual size. I asked the user to adopt a larger zoom level if possible.
S: Middle east and Thai in
succession
The signal of head-direction is "jumpy".
Therefore, the subject perceived two songs on and off.
S: Now it's only Thai, very clear The GPS signal became unstable, and the location was marked way off the road.
S: Middle east is fading out S: OK, Quizas appears. At a larger zoom level, it took the subject more
time to pick up the song at -4 dB. She did not hear the song before she approached closely.
S: Quizas and Bossa Nova at the same time
S: If I turn my head, then it's only Bossa Nova
The subject turned her head to confirm the location of sound streams.
S: The Chinese song appears now S: (zooming out) Why is Bossa Nova
still in my right? The -40 dB range is 400 feet, and 11 streams were within the range. The subject was confused why a song came back to her ears.
S: Ninja Turtles are coming.
Middle east
and Thai in succession
Now it's only
Thai, very clear
Middle east is fading out
Quizas
appears.
Quizas and
Bossa nova at the same time
If I turn my head, then it's only Bossa nova
Chinese
appears now
Why is Bossa nova still in my
right
Ninja
turtles are coming
111
Summary: The subject used a large zoom level (radius = 225 feet initial, then 300 feet, then 396 feet finally). The subject still picked all songs east of Prospect street but she spent 140 second to walk past two blocks, a 28% increase from last time. In the auditory environment of an average of 5 simultaneous streams, the subject talked loud and walked less casually.
Table 4-11: Walk Excerpt 2, initial -40 dB radius = 225 ft
Conversation Comment
The initial -40 dB radius is 225 ft. Standing at the intersection of Cambridge and Prospect, the subject missed Coldplay for the second consecutive time. It is the only song she missed on the street.
S: There is a melody. (humming). What is that?
The subject asked about the genre and association of this song for the second time.
I: It is Indian, this song is from
the movie.
S: I heard Irish. S: Sky in the castle is floating
somewhere.
S: Was that Beatles? hmm, anyway, an English song
It is an American song with a soft voice.
S: That... (singing the song) The subject could not associate the song to a lounge, nor could she recall the title, but she heard the song before and could sing along.
That.... (repeating the song)
There is a melody (humming) what is
that?
Irish
It's Indian
Sky in the castle
Was that Beatles? a English song
It's Thai on the right
Something from distant
OK, it's Irish
OK, sweet Caroline is here as well
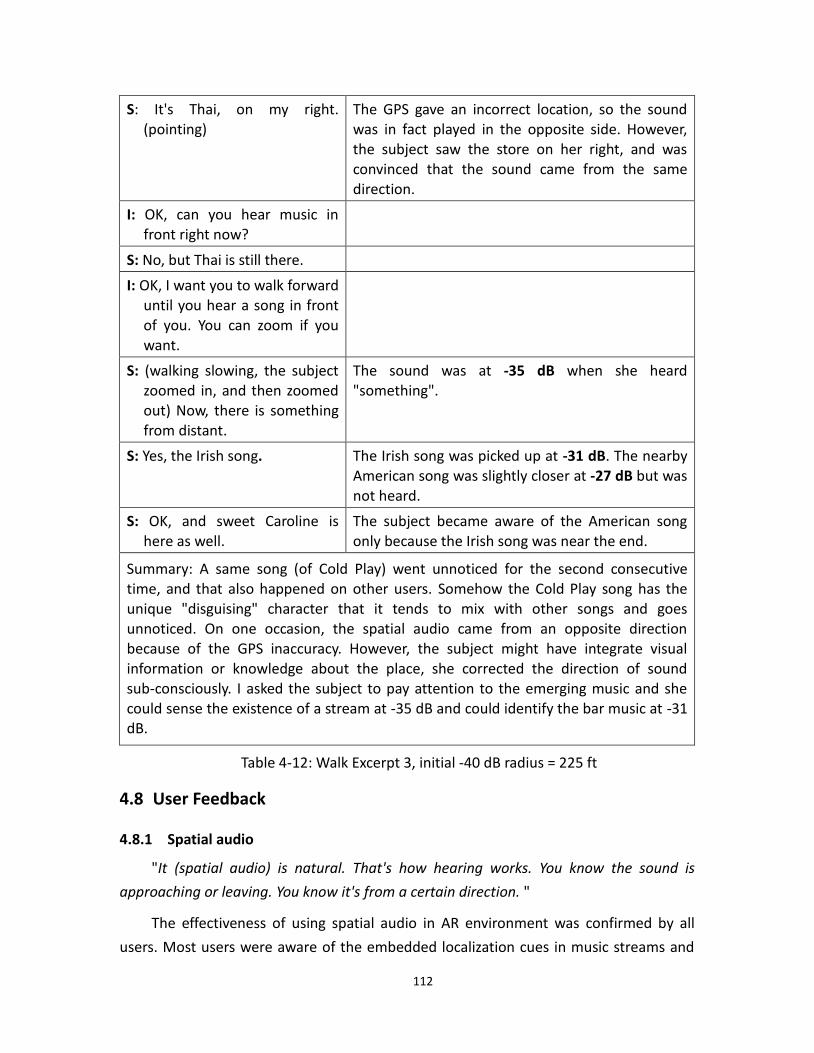
112
S: It's Thai, on my right. (pointing)
The GPS gave an incorrect location, so the sound was in fact played in the opposite side. However, the subject saw the store on her right, and was convinced that the sound came from the same direction.
I: OK, can you hear music in front right now?
S: No, but Thai is still there. I: OK, I want you to walk forward
until you hear a song in front
of you. You can zoom if you want.
S: (walking slowing, the subject zoomed in, and then zoomed out) Now, there is something from distant.
The sound was at -35 dB when she heard "something".
S: Yes, the Irish song. The Irish song was picked up at -31 dB. The nearby American song was slightly closer at -27 dB but was not heard.
S: OK, and sweet Caroline is
here as well.
The subject became aware of the American song
only because the Irish song was near the end.
Summary: A same song (of Cold Play) went unnoticed for the second consecutive time, and that also happened on other users. Somehow the Cold Play song has the unique "disguising" character that it tends to mix with other songs and goes unnoticed. On one occasion, the spatial audio came from an opposite direction because of the GPS inaccuracy. However, the subject might have integrate visual information or knowledge about the place, she corrected the direction of sound sub-consciously. I asked the subject to pay attention to the emerging music and she
could sense the existence of a stream at -35 dB and could identify the bar music at -31 dB.
Table 4-12: Walk Excerpt 3, initial -40 dB radius = 225 ft
4.8 User Feedback
4.8.1 Spatial audio
"It (spatial audio) is natural. That's how hearing works. You know the sound is
approaching or leaving. You know it's from a certain direction. "
The effectiveness of using spatial audio in AR environment was confirmed by all
users. Most users were aware of the embedded localization cues in music streams and
113
could localize the songs they heard, especially with the help of visual information. Users
reported that it was easier for them to identify the location of sounds when they were
mobile than stationary. In addition, it was easier to identify the direction of sound than
the distance. Two of the subjects commented specifically about the perception of
distance: It is difficult because the loudness of music varies between genres and the
sound level of music varies from within the song.
4.8.2 Simultaneous audio, audio highlighting, and zooming
"Personally, I prefer a small scale. The sound should be simple and pure. I want to
walk by these songs slowly, one by one, like tuning a radio. "
To most subjects, listening to simultaneous music streams was not a familiar user
experience. It was chaotic and distracting when the subject first approached the
intersection of Cambridge and Prospect streets. As an inspector, I could see that several
subjects were under high cognitive load. They talked louder and moved slower than
usual. Two subjects commented that, they could not appreciate music in the presence of
simultaneous music streams. Instead, the experience became information seeking. But it
was difficult to retrieve information among numerous sounds, especially for people
without training. However, one subject pointed out that listening to many songs at once
was not the problem. Instead, it would become a problem only if these songs are not
distinct.
Several features are designed to help users manage the simultaneous audio
streams: automatic and manual zooming, and a head-tracking headset. All driving and
biking subjects commented that they were too busy to operate the zooming interface.
The only exception was when they were stopped in front of traffic light. Several subjects
still commented that zooming was a great idea, but it should be done automatically. One
subject said that being able to adjust the audible range was useful, but not when the
user is already confused. In other words, he thought that zooming can help users avoid
confusion, not resolve confusion. In addition, one subject mentioned that it was hard to
find out what the current zoom level was.
One subject thought the head-tracking headset was essential to the experience.
Since looking at where the sound comes from is a natural reaction, the responsive
headset helped him confirm the localization in two ways: he not only saw the restaurant,
but also heard the highlighted sound in front of him.
114
4.8.3 Music icons
"A familiar song is easy to catch, but it is also easy to forget afterwards. "
The experiment protocol includes collecting music from the subject. But before the
study, most subjects did not want to spend time in configuring the mapping. However,
after the study, all users had a lot to say about the choices of music. One subject
participated in the driving study twice. The first run used the default music set, and
during the second run, 9 songs from the music set were replaced by songs on the
subject's request. He commented on how the experience was enhanced after the study:
"These are all my songs, so I felt great about the whole experience. That
(knowing the songs) also helped me identify these restaurants, I mean, I could
notice the song from farther. I could better localize the song. It even helped me
pick up simultaneous songs. "
The other subject worked with the default music set for the user study, and she
addressed the importance of using personal music during the interview:
"I think it is critical to use songs that are more personal. Although these songs
represent the corresponding genres well, but they are not what I really want to
hear. I mean, I can perceive the attached symbols, but they are not a part of me.
They cannot touch my heart. "
Other than familiarity, some songs are just perceptually more prominent than
others. They tend to stand out from a crowd. Although all songs in the database were
normalized, several subjects mentioned that they could always pick up songs with strong
rhythm first. "I'm Shipping Up to Boston" by Dropkick Murphys is one of the examples.
Some other songs (for example, Coldplay) are harder to be identified. For instance, the
theme music from animation "Castle of the Sky" is one of the icons. One subject
commented that this song was somehow more difficult to be localized. He felt that the
chorus song was omnidirectional. Therefore, spatializing the song created a conflict
spatiality.
4.8.4 Safety issues
"Not at all, driving is all about multi-tasking. Lots of drivers listen to the radio
anyway. ", a driving subject was asked whether the experience is distracting.
Most subjects did not think that the experience was distracting. One driving subject
said only the beginning was distracting because he was still adapting to the experience,
and that included thinking aloud and answering my questions. One subject was aware
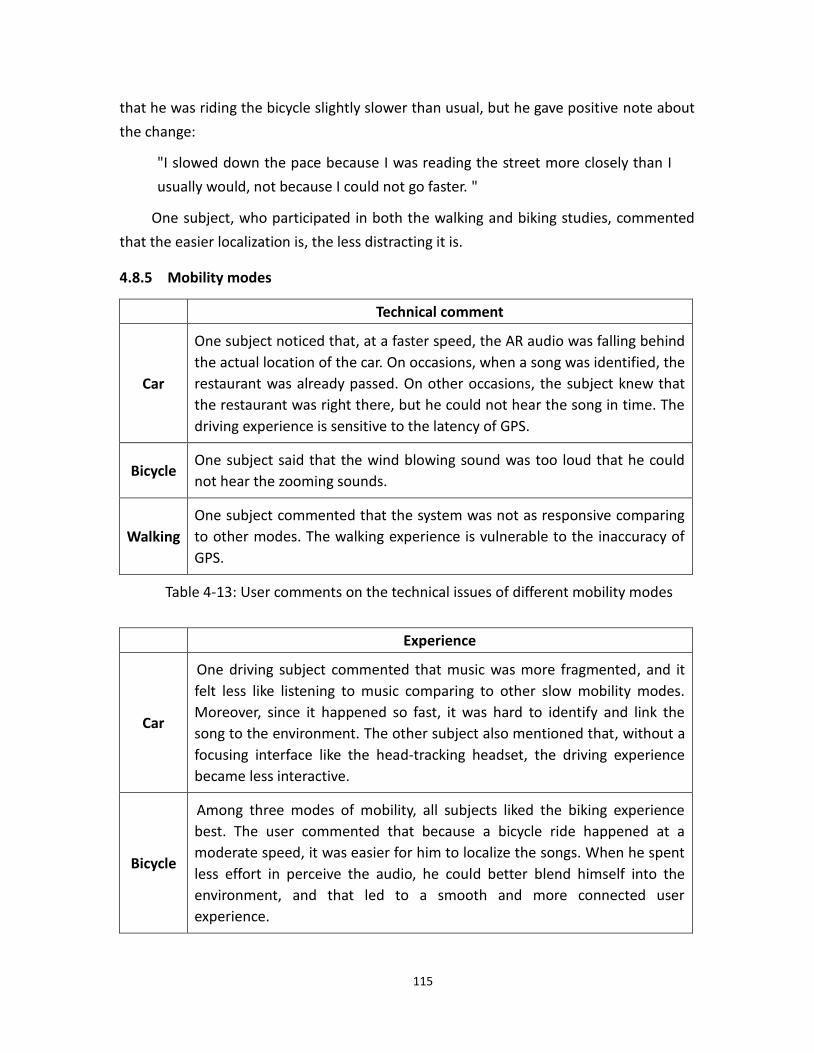
115
that he was riding the bicycle slightly slower than usual, but he gave positive note about
the change:
"I slowed down the pace because I was reading the street more closely than I
usually would, not because I could not go faster. "
One subject, who participated in both the walking and biking studies, commented
that the easier localization is, the less distracting it is.
4.8.5 Mobility modes
Technical comment
Car
One subject noticed that, at a faster speed, the AR audio was falling behind
the actual location of the car. On occasions, when a song was identified, the
restaurant was already passed. On other occasions, the subject knew that
the restaurant was right there, but he could not hear the song in time. The
driving experience is sensitive to the latency of GPS.
Bicycle One subject said that the wind blowing sound was too loud that he could
not hear the zooming sounds.
Walking
One subject commented that the system was not as responsive comparing
to other modes. The walking experience is vulnerable to the inaccuracy of
GPS.
Table 4-13: User comments on the technical issues of different mobility modes
Experience
Car
One driving subject commented that music was more fragmented, and it
felt less like listening to music comparing to other slow mobility modes.
Moreover, since it happened so fast, it was hard to identify and link the
song to the environment. The other subject also mentioned that, without a
focusing interface like the head-tracking headset, the driving experience
became less interactive.
Bicycle
Among three modes of mobility, all subjects liked the biking experience
best. The user commented that because a bicycle ride happened at a
moderate speed, it was easier for him to localize the songs. When he spent
less effort in perceive the audio, he could better blend himself into the
environment, and that led to a smooth and more connected user
experience.
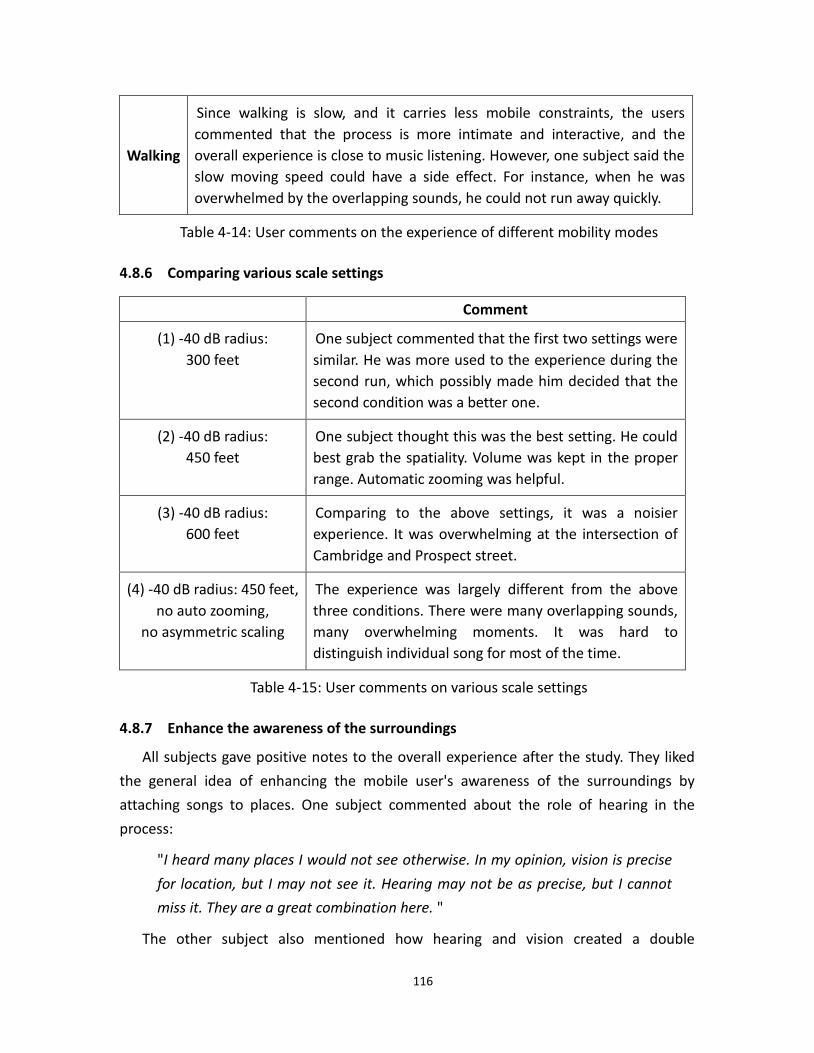
116
Walking
Since walking is slow, and it carries less mobile constraints, the users
commented that the process is more intimate and interactive, and the
overall experience is close to music listening. However, one subject said the
slow moving speed could have a side effect. For instance, when he was
overwhelmed by the overlapping sounds, he could not run away quickly.
Table 4-14: User comments on the experience of different mobility modes
4.8.6 Comparing various scale settings
Comment
(1) -40 dB radius:
300 feet
One subject commented that the first two settings were
similar. He was more used to the experience during the
second run, which possibly made him decided that the
second condition was a better one.
(2) -40 dB radius:
450 feet
One subject thought this was the best setting. He could
best grab the spatiality. Volume was kept in the proper
range. Automatic zooming was helpful.
(3) -40 dB radius:
600 feet
Comparing to the above settings, it was a noisier
experience. It was overwhelming at the intersection of
Cambridge and Prospect street.
(4) -40 dB radius: 450 feet,
no auto zooming,
no asymmetric scaling
The experience was largely different from the above
three conditions. There were many overlapping sounds,
many overwhelming moments. It was hard to
distinguish individual song for most of the time.
Table 4-15: User comments on various scale settings
4.8.7 Enhance the awareness of the surroundings
All subjects gave positive notes to the overall experience after the study. They liked
the general idea of enhancing the mobile user's awareness of the surroundings by
attaching songs to places. One subject commented about the role of hearing in the
process:
"I heard many places I would not see otherwise. In my opinion, vision is precise
for location, but I may not see it. Hearing may not be as precise, but I cannot
miss it. They are a great combination here. "
The other subject also mentioned how hearing and vision created a double
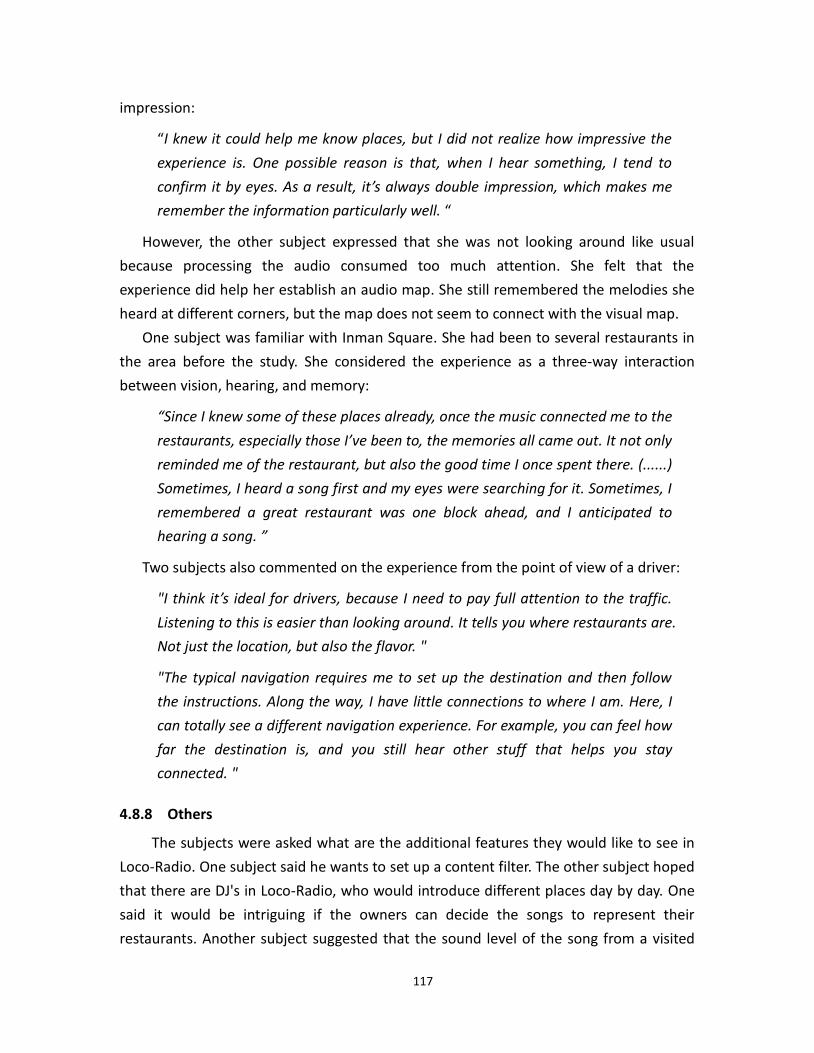
117
impression:
“I knew it could help me know places, but I did not realize how impressive the
experience is. One possible reason is that, when I hear something, I tend to
confirm it by eyes. As a result, it’s always double impression, which makes me
remember the information particularly well. “
However, the other subject expressed that she was not looking around like usual
because processing the audio consumed too much attention. She felt that the
experience did help her establish an audio map. She still remembered the melodies she
heard at different corners, but the map does not seem to connect with the visual map.
One subject was familiar with Inman Square. She had been to several restaurants in
the area before the study. She considered the experience as a three-way interaction
between vision, hearing, and memory:
“Since I knew some of these places already, once the music connected me to the
restaurants, especially those I’ve been to, the memories all came out. It not only
reminded me of the restaurant, but also the good time I once spent there. (......)
Sometimes, I heard a song first and my eyes were searching for it. Sometimes, I
remembered a great restaurant was one block ahead, and I anticipated to
hearing a song. ”
Two subjects also commented on the experience from the point of view of a driver:
"I think it’s ideal for drivers, because I need to pay full attention to the traffic.
Listening to this is easier than looking around. It tells you where restaurants are.
Not just the location, but also the flavor. "
"The typical navigation requires me to set up the destination and then follow
the instructions. Along the way, I have little connections to where I am. Here, I
can totally see a different navigation experience. For example, you can feel how
far the destination is, and you still hear other stuff that helps you stay
connected. "
4.8.8 Others
The subjects were asked what are the additional features they would like to see in
Loco-Radio. One subject said he wants to set up a content filter. The other subject hoped
that there are DJ's in Loco-Radio, who would introduce different places day by day. One
said it would be intriguing if the owners can decide the songs to represent their
restaurants. Another subject suggested that the sound level of the song from a visited
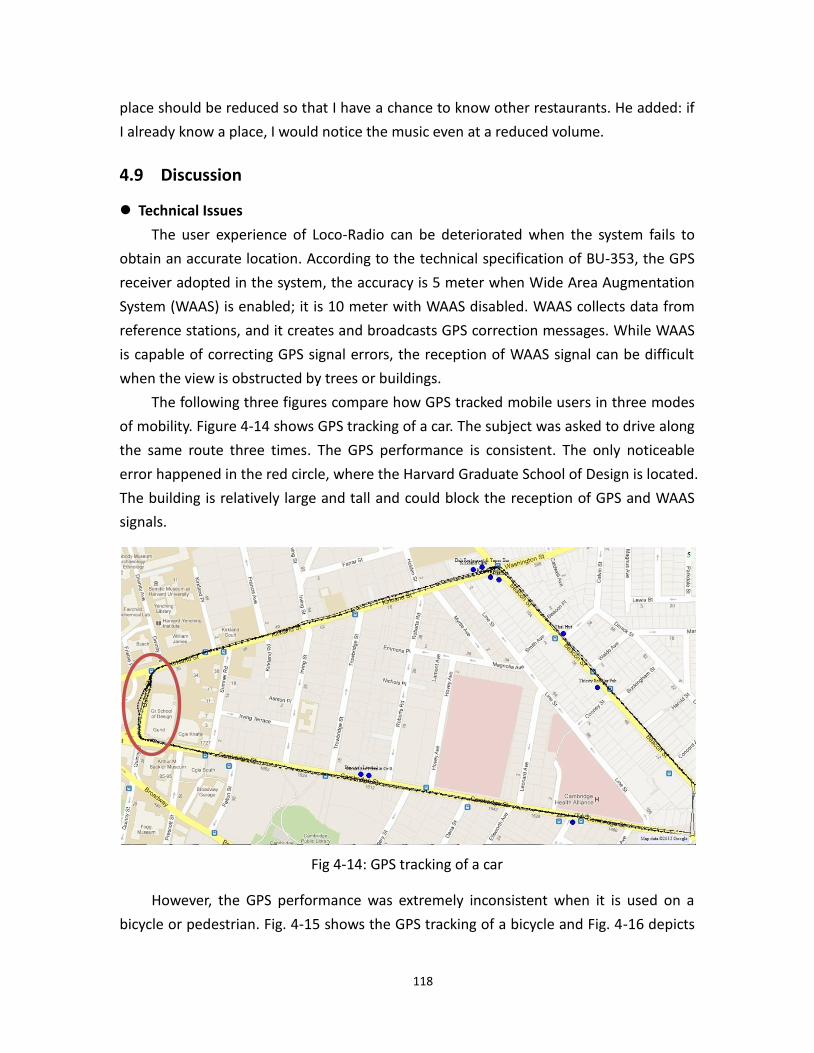
118
place should be reduced so that I have a chance to know other restaurants. He added: if
I already know a place, I would notice the music even at a reduced volume.
4.9 Discussion
Technical Issues
The user experience of Loco-Radio can be deteriorated when the system fails to
obtain an accurate location. According to the technical specification of BU-353, the GPS
receiver adopted in the system, the accuracy is 5 meter when Wide Area Augmentation
System (WAAS) is enabled; it is 10 meter with WAAS disabled. WAAS collects data from
reference stations, and it creates and broadcasts GPS correction messages. While WAAS
is capable of correcting GPS signal errors, the reception of WAAS signal can be difficult
when the view is obstructed by trees or buildings.
The following three figures compare how GPS tracked mobile users in three modes
of mobility. Figure 4-14 shows GPS tracking of a car. The subject was asked to drive along
the same route three times. The GPS performance is consistent. The only noticeable
error happened in the red circle, where the Harvard Graduate School of Design is located.
The building is relatively large and tall and could block the reception of GPS and WAAS
signals.
Fig 4-14: GPS tracking of a car
However, the GPS performance was extremely inconsistent when it is used on a
bicycle or pedestrian. Fig. 4-15 shows the GPS tracking of a bicycle and Fig. 4-16 depicts
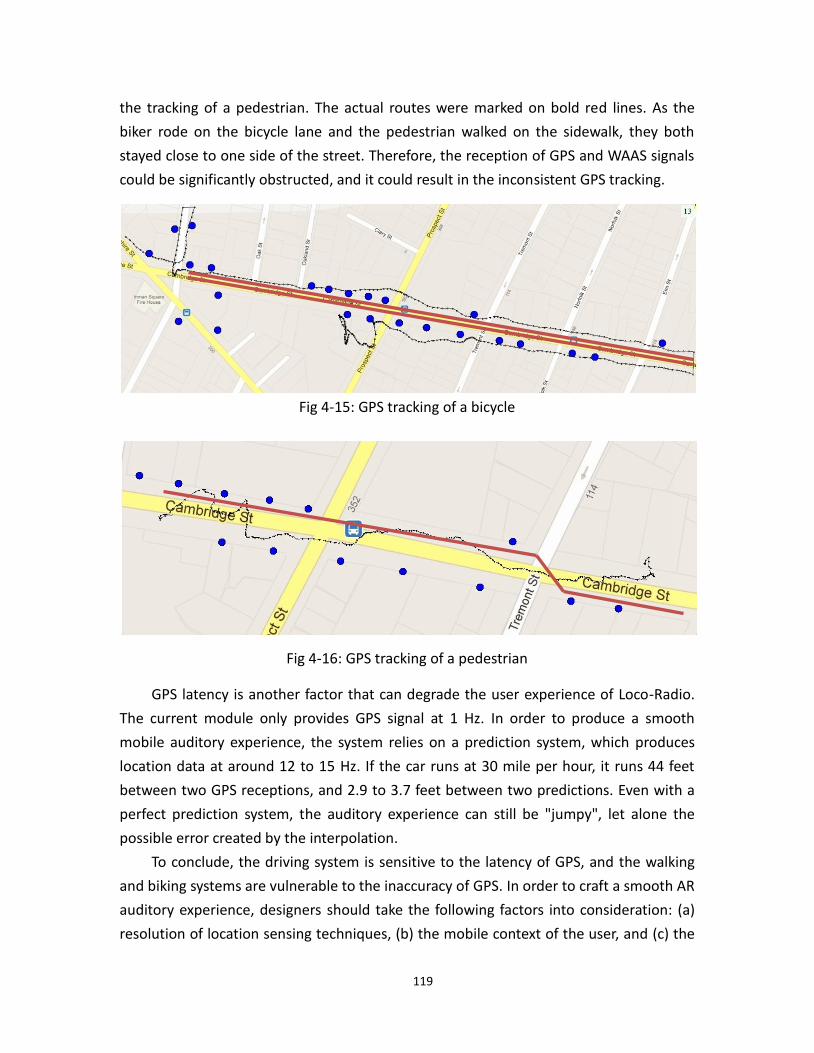
119
the tracking of a pedestrian. The actual routes were marked on bold red lines. As the
biker rode on the bicycle lane and the pedestrian walked on the sidewalk, they both
stayed close to one side of the street. Therefore, the reception of GPS and WAAS signals
could be significantly obstructed, and it could result in the inconsistent GPS tracking.
Fig 4-15: GPS tracking of a bicycle
Fig 4-16: GPS tracking of a pedestrian
GPS latency is another factor that can degrade the user experience of Loco-Radio.
The current module only provides GPS signal at 1 Hz. In order to produce a smooth
mobile auditory experience, the system relies on a prediction system, which produces
location data at around 12 to 15 Hz. If the car runs at 30 mile per hour, it runs 44 feet
between two GPS receptions, and 2.9 to 3.7 feet between two predictions. Even with a
perfect prediction system, the auditory experience can still be "jumpy", let alone the
possible error created by the interpolation.
To conclude, the driving system is sensitive to the latency of GPS, and the walking
and biking systems are vulnerable to the inaccuracy of GPS. In order to craft a smooth AR
auditory experience, designers should take the following factors into consideration: (a)
resolution of location sensing techniques, (b) the mobile context of the user, and (c) the
120
density of audio map. In addition, advance GPS receivers are available on the market,
which can reduce the latency and provide more accurate data. These expensive GPS
modules are not pervasive yet, but they are alternative options for future AR audio
developers.
Scale
Listening to simultaneous music streams is something that most users have not
experienced before. It can be difficult for the user without training to identify songs
among numerous streams, especially when the songs are not distinct. When the process
occupies too much attention of the mobile user, it may prevent the user from integrating
information received from other senses.
Since simultaneous streams are unavoidable in a geographically constrained audio
map, automatic and manual zooming are designed to help users manage the
simultaneous audio streams. During the study, most users did not find manual zooming
useful because they could not find time to operate the interface on the move. However,
automatic zooming was effective in keeping the number of audible streams within a
proper range. Four different settings of scale were tested. The effectiveness of automatic
zooming was confirmed. In addition, the settings with a 300 and 450 feet initial -40 dB
radius were well received, while other settings created overwhelming moments for the
users.
Mobility
The AR audio is more fragmented when moving at a faster speed. It has been
observed that although the subject was able to identify the song, he could not associate
it to the place. When given more time, for example, being stopped by the traffic, the
subject was more likely to link the sound to the environment.
Biking was rated the best experience among three modes of mobility. A bicycle ride
happened at a moderate speed, so it was less affected by the latency and inaccuracy of
GPS. When the user spent less effort in perceiving the audio, he could better blend
himself into the environment, and that led to a smooth and more connected user
experience.
The auditory experience in walking mode is close to music listening. Although the
process is slow and interactive, the experience is deteriorated by the poor performance
of GPS module. When users walked on the sidewalk, the reception of GPS and WAAS
signals was obstructed by the immediate nearby buildings.
121
Experience
The AR auditory experience did enhance the mobile user's awareness of the
surroundings. One subject mentioned that vision is precise for location, but he may not
see it, whereas hearing is less precise but he cannot miss it. When a sound is heard in
the environment, the user tends to confirm it by eyes. One walking subject commented
that the double impression allowed him to remember the place well. When the user has
prior knowledge of the place, the experience becomes a three-way interaction between
vision, hearing, and memory. However, it is crucial to manage the cognitive load of the
user. It would be difficult for the user to link the sound to the environment when he is
too concentrated on perceiving the audio. Moreover, music means remarkably different
things to different people. It is almost impossible to create a universal set of music icons.
Therefore, allowing the user to personalize the audio map is essential.

122
123
Chapter 5
Loco-Radio Indoor
5.1 Introduction
Loco-Radio Outdoor demonstrated how AR audio could connect mobile users to a
large, open urban environment. The framework for AR audio based on scale enabled the
design to adapt to users with different mobile contexts and overcome the geographic
constraints of a compact audio map. However, can we transfer the AR auditory
experience to an indoor environment? Does the framework apply to designing AR
auditory environments at building scale, instead of street scale? GPS does not work
indoors as it requires line-of-sight to satellites. How can we track the user with
alternative location sensing technology?
In this chapter, I will introduce Loco-Radio Indoor. The system retrieves indoor
location data from Compass Badge, a geomagnetic based location sensing module
developed by Chung (2012). It is more accurate and responsive than GPS. Therefore, it
can support the design of AR auditory environment at a finer scale. Audio clips are
tagged around the MIT Media Lab building, and each contains a talk or demo of the lab.
As a result, Loco-Radio Indoor allows the user to experience an AR auditory lab tour.
5.1.1 Use case
A little girl, Rain, ran into Media Lab building on Sunday. She had heard everyone
talk about how awesome this place is. But it was a Sunday. No one was there to show
her around all the exciting projects that had been done here. She took out her cell
phone and turned on the Loco-Radio app. She tuned in the demo channel, and wow, the
building became so noisy all of a sudden. She zoomed in a bit so that she can hear
clearly what is going on nearby. Rain heard the sound of music when she entered the
third floor. Where did that come from? She turned her head around, searching for the
demo. And there it was. She pressed the button to lock on this demo. From the radio,
someone was talking about a project called Musicpainter. It allows children to create
music by painting on the virtual canvas. When the story was finished, she found an XO
laptop sitting nearby. Now she is going to have some fun drawing music.
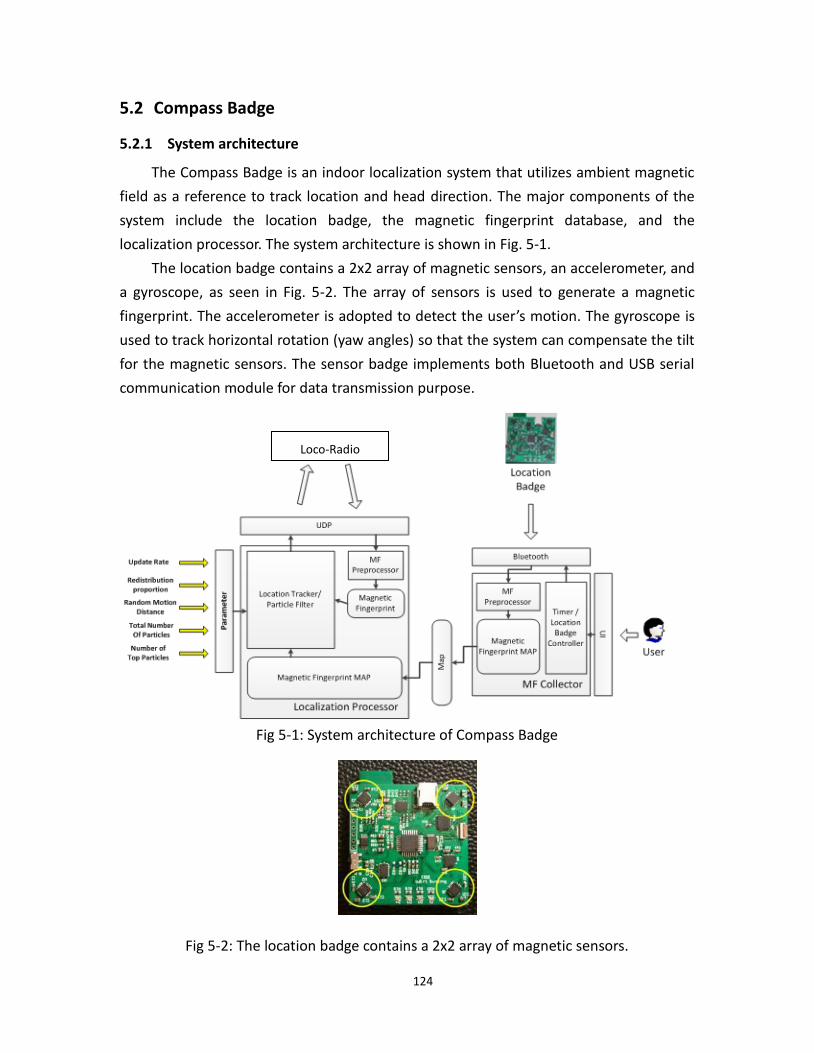
124
5.2 Compass Badge
5.2.1 System architecture
The Compass Badge is an indoor localization system that utilizes ambient magnetic
field as a reference to track location and head direction. The major components of the
system include the location badge, the magnetic fingerprint database, and the
localization processor. The system architecture is shown in Fig. 5-1.
The location badge contains a 2x2 array of magnetic sensors, an accelerometer, and
a gyroscope, as seen in Fig. 5-2. The array of sensors is used to generate a magnetic
fingerprint. The accelerometer is adopted to detect the user’s motion. The gyroscope is
used to track horizontal rotation (yaw angles) so that the system can compensate the tilt
for the magnetic sensors. The sensor badge implements both Bluetooth and USB serial
communication module for data transmission purpose.
Fig 5-1: System architecture of Compass Badge
Fig 5-2: The location badge contains a 2x2 array of magnetic sensors.
Loco-Radio
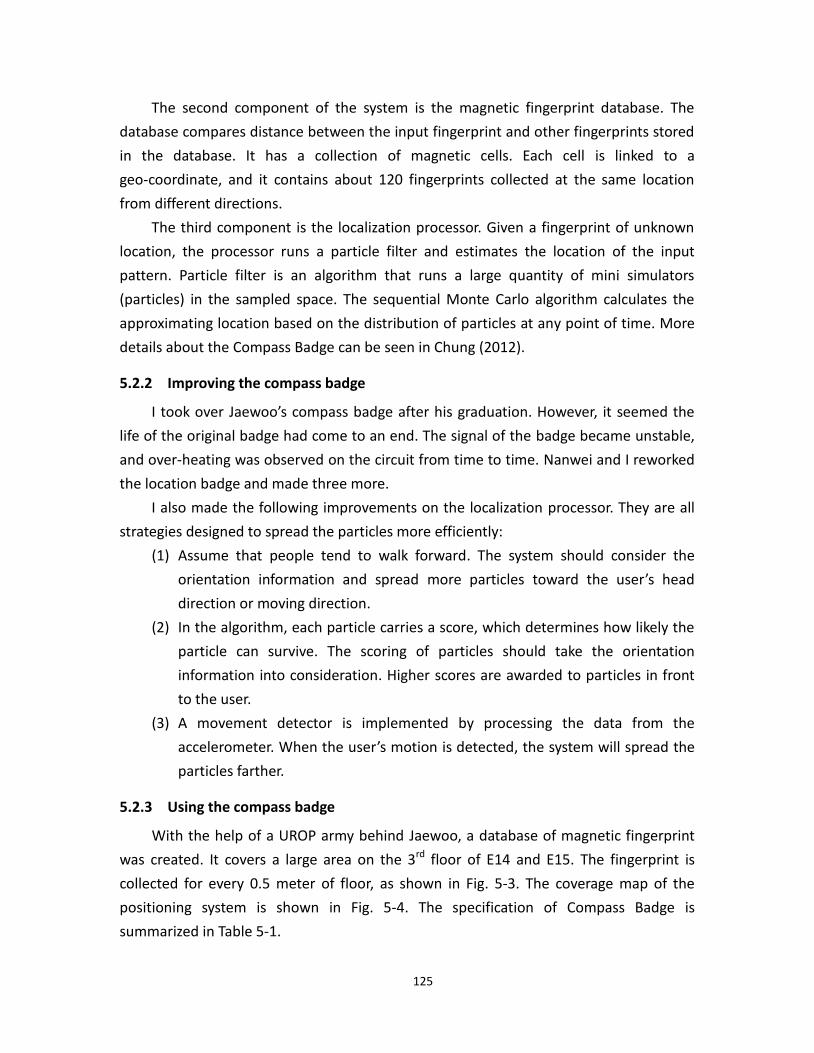
125
The second component of the system is the magnetic fingerprint database. The
database compares distance between the input fingerprint and other fingerprints stored
in the database. It has a collection of magnetic cells. Each cell is linked to a
geo-coordinate, and it contains about 120 fingerprints collected at the same location
from different directions.
The third component is the localization processor. Given a fingerprint of unknown
location, the processor runs a particle filter and estimates the location of the input
pattern. Particle filter is an algorithm that runs a large quantity of mini simulators
(particles) in the sampled space. The sequential Monte Carlo algorithm calculates the
approximating location based on the distribution of particles at any point of time. More
details about the Compass Badge can be seen in Chung (2012).
5.2.2 Improving the compass badge
I took over Jaewoo’s compass badge after his graduation. However, it seemed the
life of the original badge had come to an end. The signal of the badge became unstable,
and over-heating was observed on the circuit from time to time. Nanwei and I reworked
the location badge and made three more.
I also made the following improvements on the localization processor. They are all
strategies designed to spread the particles more efficiently:
(1) Assume that people tend to walk forward. The system should consider the
orientation information and spread more particles toward the user’s head
direction or moving direction.
(2) In the algorithm, each particle carries a score, which determines how likely the
particle can survive. The scoring of particles should take the orientation
information into consideration. Higher scores are awarded to particles in front
to the user.
(3) A movement detector is implemented by processing the data from the
accelerometer. When the user’s motion is detected, the system will spread the
particles farther.
5.2.3 Using the compass badge
With the help of a UROP army behind Jaewoo, a database of magnetic fingerprint
was created. It covers a large area on the 3rd floor of E14 and E15. The fingerprint is
collected for every 0.5 meter of floor, as shown in Fig. 5-3. The coverage map of the
positioning system is shown in Fig. 5-4. The specification of Compass Badge is
summarized in Table 5-1.
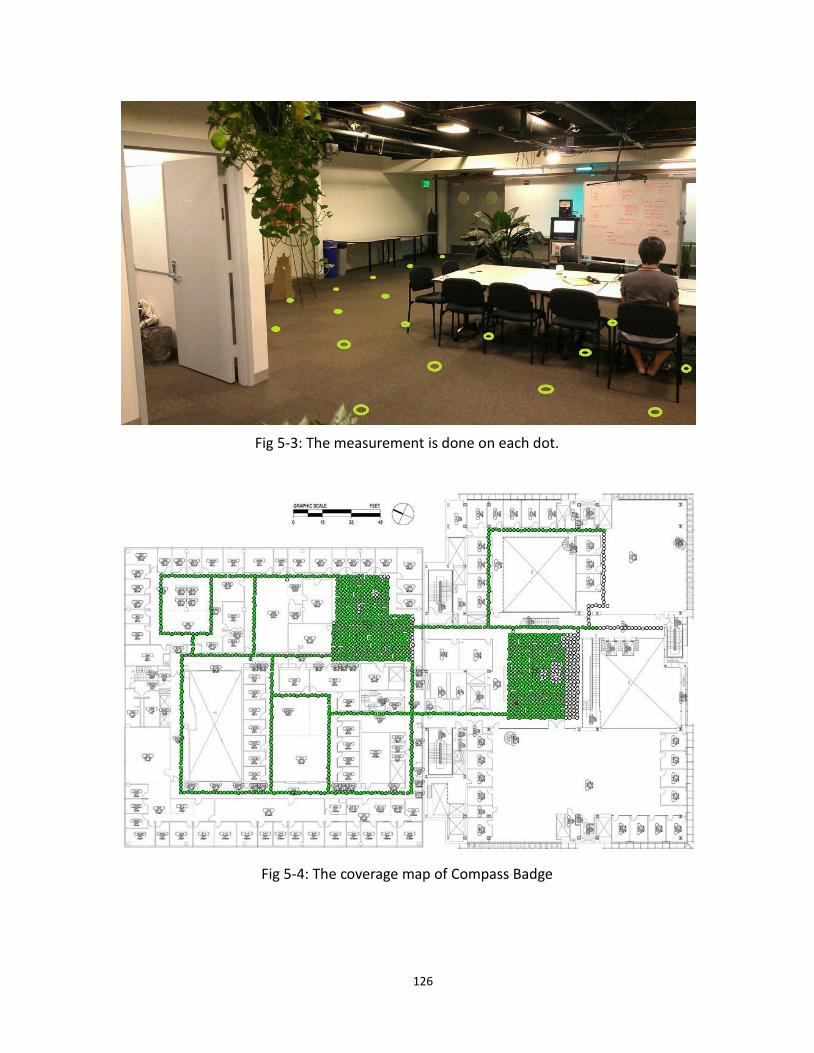
126
Fig 5-3: The measurement is done on each dot.
Fig 5-4: The coverage map of Compass Badge
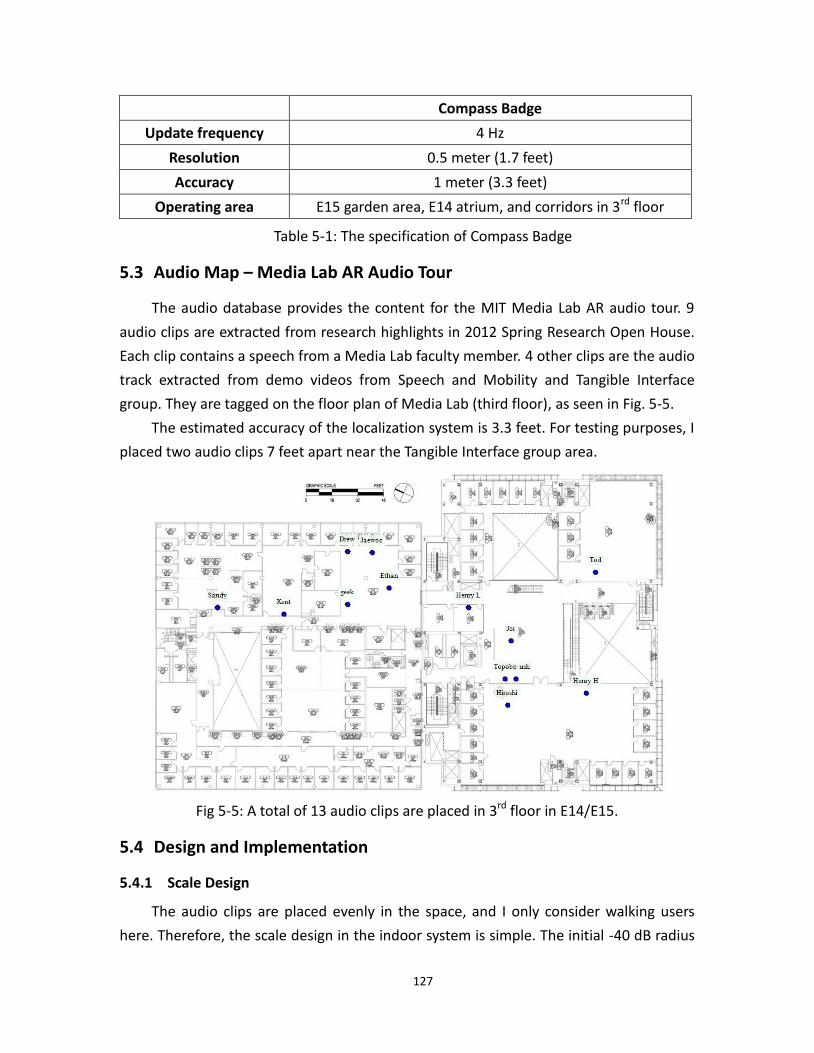
127
Compass Badge
Update frequency 4 Hz
Resolution 0.5 meter (1.7 feet)
Accuracy 1 meter (3.3 feet)
Operating area E15 garden area, E14 atrium, and corridors in 3rd floor
Table 5-1: The specification of Compass Badge
5.3 Audio Map – Media Lab AR Audio Tour
The audio database provides the content for the MIT Media Lab AR audio tour. 9
audio clips are extracted from research highlights in 2012 Spring Research Open House.
Each clip contains a speech from a Media Lab faculty member. 4 other clips are the audio
track extracted from demo videos from Speech and Mobility and Tangible Interface
group. They are tagged on the floor plan of Media Lab (third floor), as seen in Fig. 5-5.
The estimated accuracy of the localization system is 3.3 feet. For testing purposes, I
placed two audio clips 7 feet apart near the Tangible Interface group area.
Fig 5-5: A total of 13 audio clips are placed in 3rd floor in E14/E15.
5.4 Design and Implementation
5.4.1 Scale Design
The audio clips are placed evenly in the space, and I only consider walking users
here. Therefore, the scale design in the indoor system is simple. The initial -40 dB radius
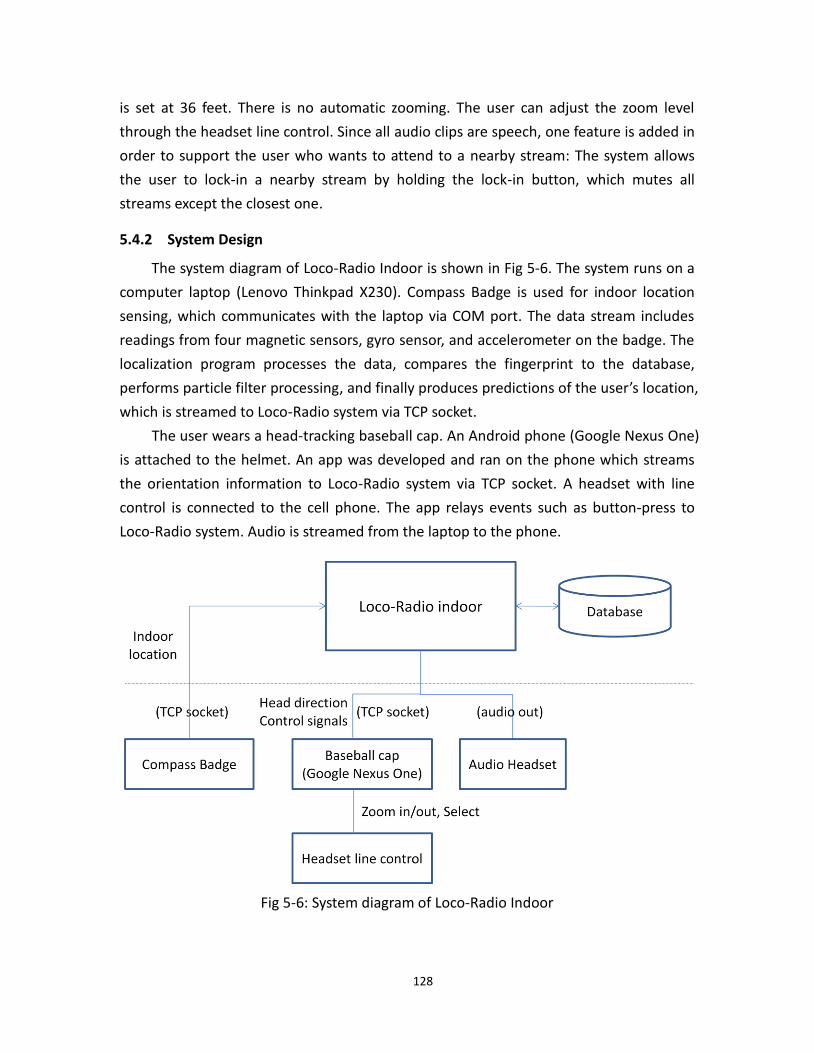
128
is set at 36 feet. There is no automatic zooming. The user can adjust the zoom level
through the headset line control. Since all audio clips are speech, one feature is added in
order to support the user who wants to attend to a nearby stream: The system allows
the user to lock-in a nearby stream by holding the lock-in button, which mutes all
streams except the closest one.
5.4.2 System Design
The system diagram of Loco-Radio Indoor is shown in Fig 5-6. The system runs on a
computer laptop (Lenovo Thinkpad X230). Compass Badge is used for indoor location
sensing, which communicates with the laptop via COM port. The data stream includes
readings from four magnetic sensors, gyro sensor, and accelerometer on the badge. The
localization program processes the data, compares the fingerprint to the database,
performs particle filter processing, and finally produces predictions of the user’s location,
which is streamed to Loco-Radio system via TCP socket.
The user wears a head-tracking baseball cap. An Android phone (Google Nexus One)
is attached to the helmet. An app was developed and ran on the phone which streams
the orientation information to Loco-Radio system via TCP socket. A headset with line
control is connected to the cell phone. The app relays events such as button-press to
Loco-Radio system. Audio is streamed from the laptop to the phone.
Fig 5-6: System diagram of Loco-Radio Indoor
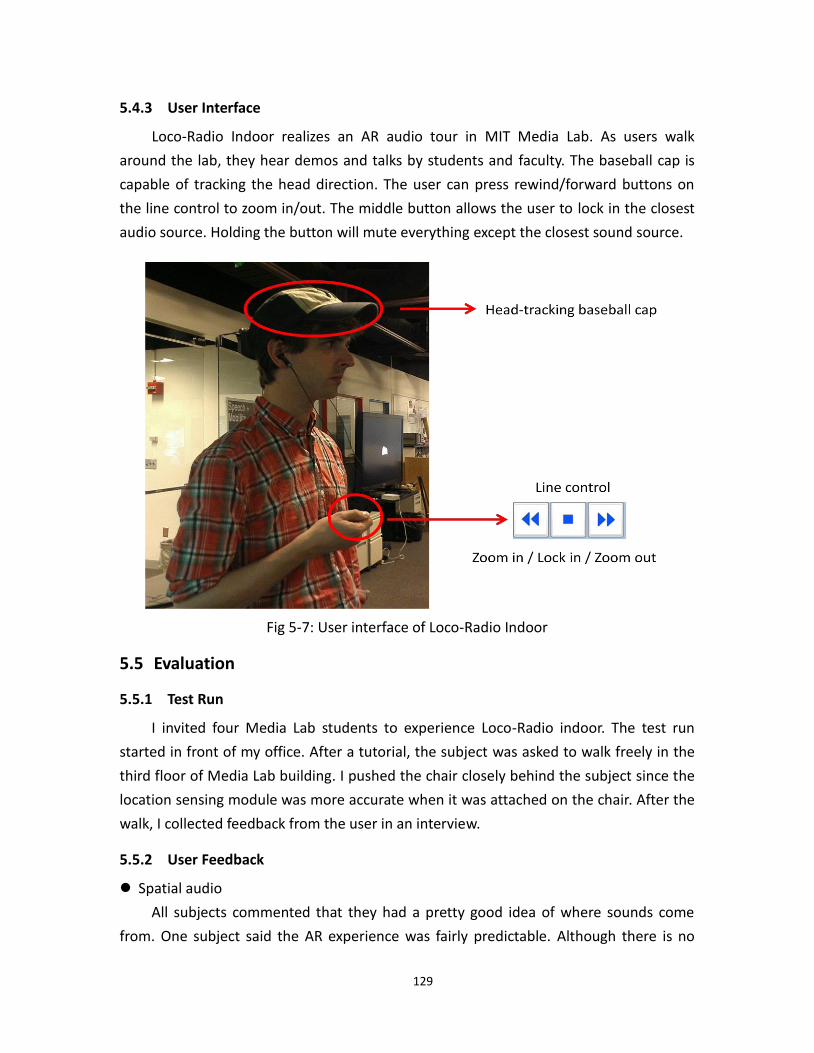
129
5.4.3 User Interface
Loco-Radio Indoor realizes an AR audio tour in MIT Media Lab. As users walk
around the lab, they hear demos and talks by students and faculty. The baseball cap is
capable of tracking the head direction. The user can press rewind/forward buttons on
the line control to zoom in/out. The middle button allows the user to lock in the closest
audio source. Holding the button will mute everything except the closest sound source.
Fig 5-7: User interface of Loco-Radio Indoor
5.5 Evaluation
5.5.1 Test Run
I invited four Media Lab students to experience Loco-Radio indoor. The test run
started in front of my office. After a tutorial, the subject was asked to walk freely in the
third floor of Media Lab building. I pushed the chair closely behind the subject since the
location sensing module was more accurate when it was attached on the chair. After the
walk, I collected feedback from the user in an interview.
5.5.2 User Feedback
Spatial audio
All subjects commented that they had a pretty good idea of where sounds come
from. One subject said the AR experience was fairly predictable. Although there is no
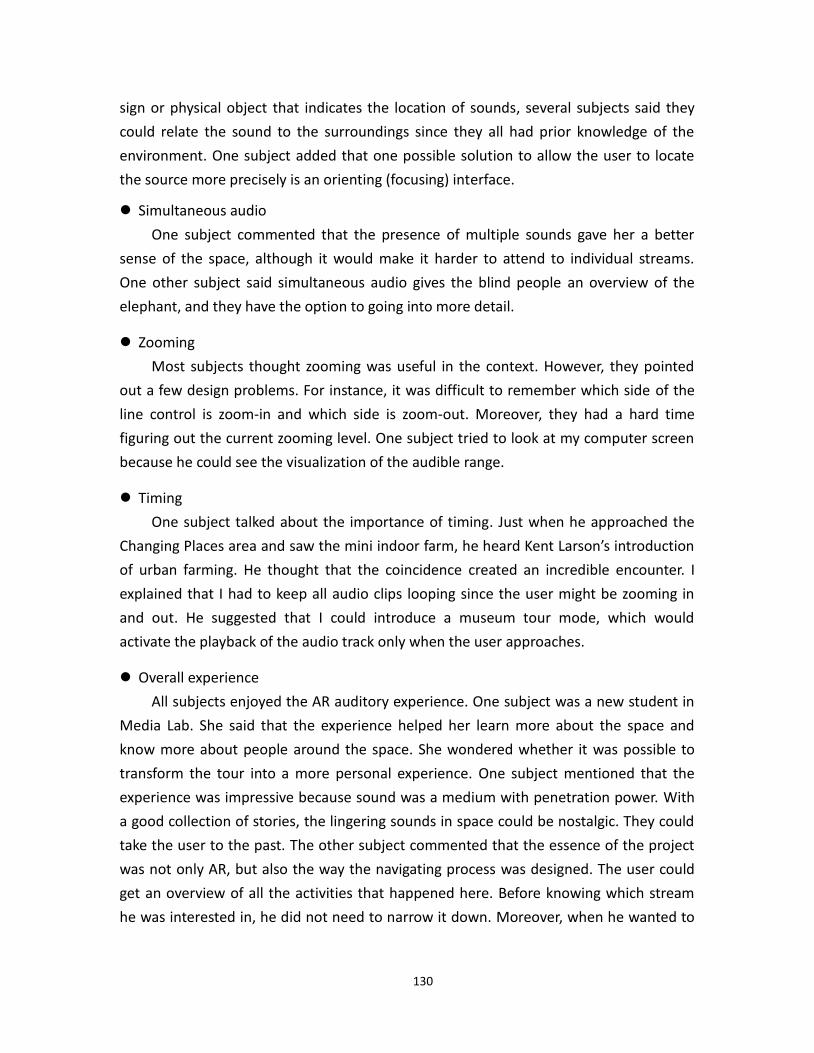
130
sign or physical object that indicates the location of sounds, several subjects said they
could relate the sound to the surroundings since they all had prior knowledge of the
environment. One subject added that one possible solution to allow the user to locate
the source more precisely is an orienting (focusing) interface.
Simultaneous audio
One subject commented that the presence of multiple sounds gave her a better
sense of the space, although it would make it harder to attend to individual streams.
One other subject said simultaneous audio gives the blind people an overview of the
elephant, and they have the option to going into more detail.
Zooming
Most subjects thought zooming was useful in the context. However, they pointed
out a few design problems. For instance, it was difficult to remember which side of the
line control is zoom-in and which side is zoom-out. Moreover, they had a hard time
figuring out the current zooming level. One subject tried to look at my computer screen
because he could see the visualization of the audible range.
Timing
One subject talked about the importance of timing. Just when he approached the
Changing Places area and saw the mini indoor farm, he heard Kent Larson’s introduction
of urban farming. He thought that the coincidence created an incredible encounter. I
explained that I had to keep all audio clips looping since the user might be zooming in
and out. He suggested that I could introduce a museum tour mode, which would
activate the playback of the audio track only when the user approaches.
Overall experience
All subjects enjoyed the AR auditory experience. One subject was a new student in
Media Lab. She said that the experience helped her learn more about the space and
know more about people around the space. She wondered whether it was possible to
transform the tour into a more personal experience. One subject mentioned that the
experience was impressive because sound was a medium with penetration power. With
a good collection of stories, the lingering sounds in space could be nostalgic. They could
take the user to the past. The other subject commented that the essence of the project
was not only AR, but also the way the navigating process was designed. The user could
get an overview of all the activities that happened here. Before knowing which stream
he was interested in, he did not need to narrow it down. Moreover, when he wanted to
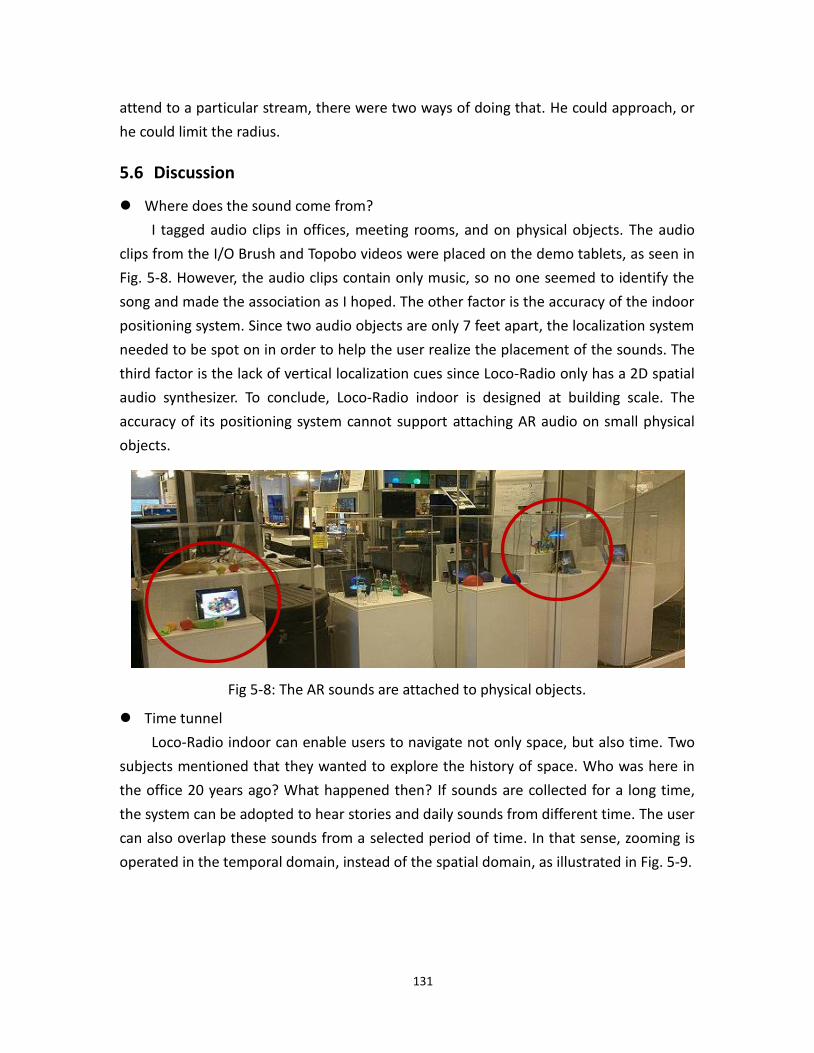
131
attend to a particular stream, there were two ways of doing that. He could approach, or
he could limit the radius.
5.6 Discussion
Where does the sound come from?
I tagged audio clips in offices, meeting rooms, and on physical objects. The audio
clips from the I/O Brush and Topobo videos were placed on the demo tablets, as seen in
Fig. 5-8. However, the audio clips contain only music, so no one seemed to identify the
song and made the association as I hoped. The other factor is the accuracy of the indoor
positioning system. Since two audio objects are only 7 feet apart, the localization system
needed to be spot on in order to help the user realize the placement of the sounds. The
third factor is the lack of vertical localization cues since Loco-Radio only has a 2D spatial
audio synthesizer. To conclude, Loco-Radio indoor is designed at building scale. The
accuracy of its positioning system cannot support attaching AR audio on small physical
objects.
Fig 5-8: The AR sounds are attached to physical objects.
Time tunnel
Loco-Radio indoor can enable users to navigate not only space, but also time. Two
subjects mentioned that they wanted to explore the history of space. Who was here in
the office 20 years ago? What happened then? If sounds are collected for a long time,
the system can be adopted to hear stories and daily sounds from different time. The user
can also overlap these sounds from a selected period of time. In that sense, zooming is
operated in the temporal domain, instead of the spatial domain, as illustrated in Fig. 5-9.
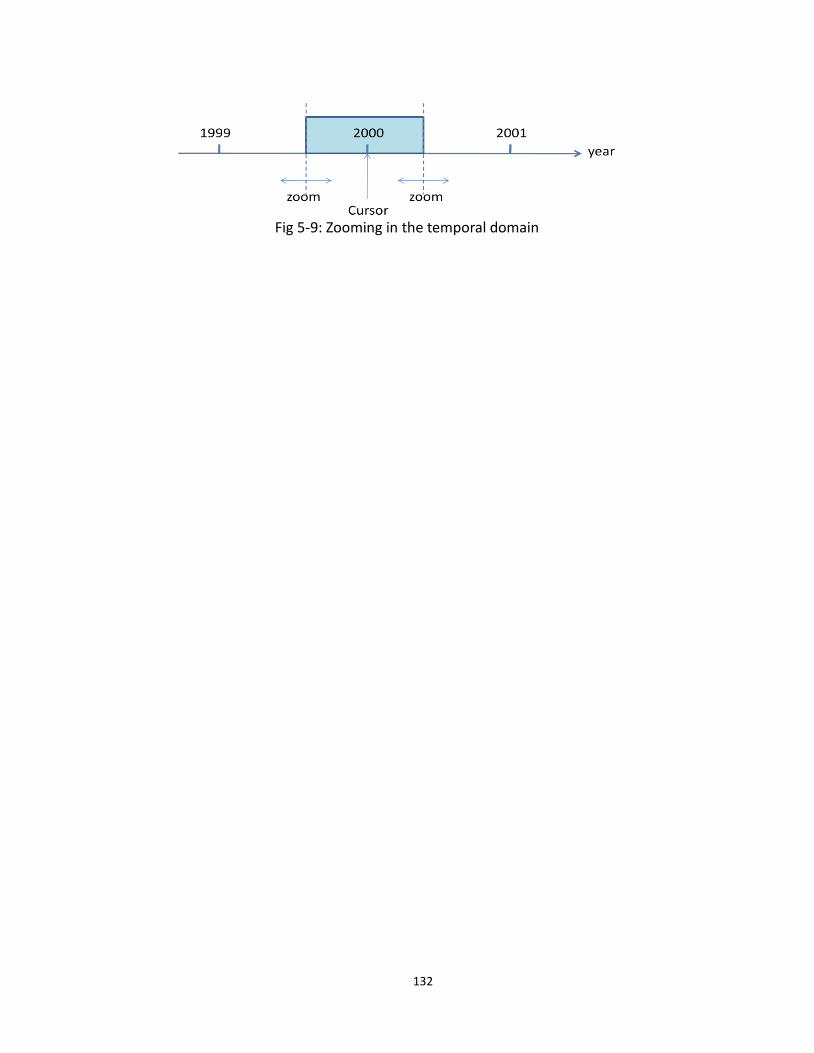
132
Fig 5-9: Zooming in the temporal domain
133
Chapter 6
Conclusion
The problem
The journeys in everyday mobility are considered mundane, repetitive, yet
inevitable. Therefore, many mobile users listen to music in order to free their minds in
the constrained space and time. However, the isolated auditory bubbles make them
become further disconnected from the world. In this dissertation research, I attempted
to use sound as the medium in connecting mobile users to the environments and play
music in order to enhance their awareness of the surroundings.
Since the goal was to enable users to perceive the environment, it was essential
to design the system from the perspective of everyday listening, which emphasizes the
experience of hearing events in the world rather than sounds. In order to embed
localization cues in sound, the system used spatial audio. In order to create an
immersive environment, the system was capable of rendering numerous simultaneous
audio streams.
However, simultaneous sounds can be obtrusive and distracting if the system is not
sensing and adapting to the context of the user. The lack of effective UI for simultaneous
audio is the primary reason why the environment has not become pervasive. Most
existing AR audio applications were tested in sparse audio maps. To overcome the
problems and enhance the user experience, I described the concept and techniques of
auditory spatial scaling.
Auditory spatial scaling
I introduced the concept of auditory scale, the foundation of AR audio
environments. It defines the relations between sound and space; it describes how
sounds are heard by mobile users in augmented space. Scaling alters the relations and
can be used to transform the auditory experience. Various techniques were introduced:
automatic and manual zooming, asymmetric scaling, and stereoized crossfading. They
allow designers to create effective UI for AR audio environments with a large amount of
simultaneous streams.
Furthermore, I described a design framework based on scale. By analyzing the
number and distribution of audio streams and considering the speed and context of
mobile users, the framework could overcome different constraints of audio maps and
lead to a smooth auditory experience.
134
Loco-Radio Outdoor
I designed and implemented Loco-Radio Outdoor, an AR auditory environment for
drivers, bikers, and pedestrians. A compact audio map was created by associating
genre-matching songs to restaurants in Cambridge/Somerville (MA). The study showed
that the AR auditory experience created a three-way interaction between vision, hearing,
and memory. Since the user tended to confirm the location of sound visually, it created
double impression and allowed the user to remember the place well. The study also
showed that it was crucial to manage the cognitive load of users. When they were
preoccupied with processing the audio, they might hear the sound but fail to link it to
the environment.
The user experience of Loco-Radio Outdoor relied on a stable GPS. However, since
the users walked on the sidewalk, the reception of GPS signals was obstructed by the
immediate nearby buildings. It was observed that the experience of a fast-moving user
was sensitive to the latency of GPS; the experience of a slow-moving user was
vulnerable to the inaccuracy of GPS.
Automatic zooming and asymmetric scaling enhanced the simultaneous listening
experience by keeping the number of audible streams within a proper range. However,
most users did not find manual zooming useful because they could not find time to
operate the interface on the move. I compared four different scale settings: the settings
with the 300 and 450 feet initial -40 dB radius were well received while other settings
created overwhelming moments for the users.
Biking was rated the best experience among three modes of mobility. A bicycle ride
happened at a moderate speed, so it was less affected by the latency and inaccuracy of
GPS. When the user spent less effort in perceiving the audio, he could better blend
himself into the environment, and that led to a smooth and more connected user
experience.
Loco-Radio Indoor
I built Loco-Radio Indoor, an AR auditory environment designed at building scale. It
obtained indoor location data from Compass Badge, a geomagnetic-based positioning
system. It was more accurate and responsive than GPS and could support the interaction
of AR auditory environments at a finer scale. Loco-Radio Indoor allowed the user to
experience an AR auditory tour of the MIT Media Lab.
All subjects confirmed that they could localize the sounds, especially with the help
of prior knowledge of the environment. The presence of multiple sounds offered an
overview of the space and created a great vibe of the Media Lab. Since the audio clips
135
were speech instead of music, the timing of playback could determine how the AR audio
experience was received.
6.1 Contribution
This thesis offers the following contributions:
Auditory spatial scaling: I gave a description of auditory scale and introduced
the techniques of auditory scaling, which include automatic and manual
zooming, asymmetric scaling, and stereoized crossfading. Auditory scaling
allows designers to create effective UI for auditory environments with
simultaneous streams.
A design framework based on scale: The framework analyzes (1) the number
and distribution of audio streams and (2) the speed and context of mobile
users and offers strategies that can overcome different constraints of audio
maps. I presented two examples of how the framework guided the design of
AR audio environments at street and building scale.
Loco-Radio Outdoor: I designed and implemented Loco-Radio Outdoor, an AR
auditory environment that connects drivers, bikers, and pedestrians to their
surroundings. I constructed an audio map by associating songs to restaurants
in Cambridge/Somerville (MA). The created experience was evaluated by 10
subjects in different modes of mobility in a think aloud study. I presented the
analysis of evaluation data and summarized the post-study interview.
Loco-Radio is the first AR audio environment designed and tested in an
extremely dense audio map.
Loco-Radio Indoor: I reproduced a new location badge and improved the
localization program of Compass Badge. It offered more accurate and
responsive location sensing than GPS and supported the interaction in AR
audio environments at a finer scale. I built Loco-Radio Indoor, which realized
an AR auditory tour of the MIT Media Lab. It was evaluated by a group of
colleagues.
6.2 Future Work
The think aloud study of Loco-Radio Outdoor allowed me to take a close look at the
experience within a short period of time. However, without a long-term study, it was
impossible to truly evaluate whether the experience enhanced their awareness of
the environment or not. Therefore, a valuable future direction is to engage more
136
users over an extended period of time. One apparent way for finding more users is
to release the project as a mobile phone app. However, since GPS drains the battery
quickly, the app is more feasible when an external power source is available.
Having more users opens up a new dimension of AR auditory experience.
Loco-Radio can become a platform for urban games in which users interact with
each other through sound. It can also serve as an audio-based story-telling platform.
Loco-Radio provides an excellent platform for workshops on art and design. In
chapter three, I described "Hear the Nightmarket", the project I demonstrated in
Nightmarket Workshop 2007 in which I composed an audio map based on urban
recordings collected from a nightmarket in Taiwan. It would be interesting to see
how users curate their audio maps and recontextualize the navigating experience for
different cultures and cities.
Another intriguing direction is to enable users to navigate space and time at the
same time. If sounds are collected for a long time, the system can be used to hear
stories and daily sounds from different times. The user can also overlap these
sounds dynamically. In that sense, zooming is operated in the temporal domain,
instead of the spatial domain.
137
Bibliography
André, P., & others. (2009). Discovery is never by chance: designing for (un) serendipity.
Proceeding of the seventh ACM conference on Creativity and cognition.pp.
305–314.
Bederson, B.B., 1995. Audio augmented reality: a prototype automated tour guide,
Conference Companion on Human Factors in Computing Systems. pp. 210–211.
Bederson, B.B. et al. (1996). Pad++: A zoomable graphical sketchpad for exploring
alternate interface physics. Journal of Visual Languages and Computing, 7(1),
3–32.
Begault, D.R., 1991. Challenges to the successful implementation of 3-D sound.Journal
of the audio engineering society 39, pp. 864–870.
Behrendt, F., 2010. Mobile sound: media art in hybrid spaces. PhD Thesis.University of
Sussex.
Bentley, F.R., Basapur, S., Chowdhury, S.K., 2011.Promoting intergenerational
communication through location-based asynchronous video communication,
Proceedings of the 13th International Conference on Ubiquitous Computing.pp.
31–40.
Blauert, J., 1996. Spatial Hearing - Revised Edition: The Psychophysics of Human Sound
Localization, The MIT Press.
Boerger, G., Laws, P., Blauert, J., 1977. Stereophonic Reproduction by Earphones with
Control of Special Transfer Functions through Head Movements.ActaAcustica
united with Acustica 39, pp. 22–26.
Brazil, E., Fernström, M., Tzanetakis, G., & Cook, P. (2002).Enhancing sonic browsing
using audio information retrieval.International Conference on Auditory Display
ICAD-02, Kyoto, Japan.
Brewster, S., Lumsden, J., Bell, M., Hall, M., Tasker, S., 2003.
Multimodal’eyes-free’interaction techniques for wearable devices, Proceedings of
the SIGCHI Conference on Human Factors in Computing Systems.pp. 473–480.
Bryden, K., Two Dimensional Spatialization of Sound. URL:
http://web.ncf.ca/aa508/Software/spatial/
138
Chapin, W. L., 2000. InTheMix, interactive audio environment.Emergent Technologies in
SIGGRAPH 2000
Cherry, E.C., 1953. Some experiments on the recognition of speech, with one and with
two ears. The Journal of the acoustical society of America 25, 975.
Chung, J., 2012. Mindful navigation with guiding light: design considerations for
projector based indoor navigation assistance system. PhD Thesis, MIT
Chung, J., Donahoe, M., Schmandt, C., Kim, I.-J., Razavai, P., Wiseman, M., 2011. Indoor
location sensing using geo-magnetism, in: Proceedings of the 9th International
Conference on Mobile Systems, Applications, and Services. pp. 141–154.
Clarkson, B., Sawhney, N., Pentland, A., 1998. Auditory context awareness via wearable
computing.Energy 400, 600.
Cohen, M., Ludwig, L.F., 1991.Multidimensional audio window management.
International Journal of Man-Machine Studies 34, pp. 319–336.
Donahoe, M. 2011. OnTheRun: A Location-based Exercise Game. Master’s Thesis, MIT.
Dourish, P. 2006. Re-Space-ing Place: “Place” and “Space” Ten Years On. In Proceedings
of the 2006 20th anniversary conference on Computer supported cooperative work.
p. 238.
Dublon, G., Pardue, L. S., Mayton, B.,Joliat, N., Hurst, P.,&Paradiso, J. A. “DoppelLab:
Tools for Exploring and Harnessing Multimodal Sensor Network Data,”.Proceedings
of the international IEEE Sensors Conference, 2011.
Dunlop, M., Brewster, S., 2002. The challenge of mobile devices for human computer
interaction.Personal and ubiquitous computing 6, pp. 235–236.
Feehan, N.N.L., 2010. Syncwalk: a framework for locative audio composition.Master's
Thesis, MIT
Fernström, M., McNamara, C., 2005. After direct manipulation - direct sonification. ACM
Transactions on Applied Perception (TAP) 2, pp. 495–499.
Ferrington, G., 1994. Keep your ear-lids open. Journal of Visual Literacy 14, pp. 51–61.
Furnas, G.W., 1986. Generalized fisheye views. ACM, Vol. 17, No. 4, pp. 16-23.
Gardner, W.G., 1997. 3-D audio using loudspeakers. PhD Thesis, MIT.
Gardner, W.G., Martin, K., HRTF Measurements of a KEMAR Dummy-Head Microphone.
URL: http://sound.media.mit.edu/resources/KEMAR.html
139
Gaver, W.W. (1993). What in the world do we hear? An ecological approach to auditory
event perception.Ecological Psychology, 5(1), pp. 1–30.
Gaver, W.W., 1997. Auditory interfaces. Handbook of human-computer interaction 1, pp.
1003–1041.
Gaye, L., Mazé, R., Holmquist, L.E., 2003a. Sonic city: the urban environment as a
musical interface. Proceedings of the 2003 Conference on New Interfaces for
Musical Expression.pp. 109–115.
Gaye, L., Maze, R., Skoglund, D., Jacobs, M., 2003b.Sonic City.
Goldenson, J.D., 2007. Beat Browse. Master’s Thesis, MIT.
Harma, A., Jakka, J., Tikander, M., Karjalainen, M., Lokki, T., Nironen, H., 2003.
Techniques and applications of wearable augmented reality audio, in: Audio
Engineering Society Convention 114.
Harrison, S. &Dourish, P. (1996). Re-Place-ing Space: The Roles of Place and Space in
Collaborative Systems. In Proceedings of the 1996 ACM conference on Computer
supported cooperative work.
Haverinen, J., Kemppainen, A., 2009. A global self-localization technique utilizing local
anomalies of the ambient magnetic field, in: Robotics and Automation, 2009.
ICRA’09.IEEE International Conference On.pp. 3142–3147.
Holland, S., Morse, D.R., Gedenryd, H., 2001. Audio GPS: spatial audio in a minimal
attention interface. environment 1, 3.
Höllerer, T., Feiner, S., 2004. Mobile augmented reality. Telegeoinformatics:
Location-Based Computing and Services. Taylor and Francis Books Ltd., London,
UK.
Kinayoglu, G. (2009). Using Audio-Augmented Reality to Assess the Role of Soundscape
in Environmental Perception: An Experimental Case Study on the UC Berkeley
Campus.Proceedings: eCAADe 2009 International Conference on Education and
Research in Computer Aided Architectural Design in Europe, September 2009. pp.
639-648.
Knowlton, J., Spellman, N., Hight, J., 2003. 34N 118W.
Kobayashi, M., Schmandt, C., 1997. Dynamic Soundscape: mapping time to space for
audio browsing, in: Proceedings of the SIGCHI Conference on Human Factors in
Computing Systems. pp. 194–201.
140
Kristoffersen, S., Ljungberg, F., 1999. “Making place” to make IT work: empirical
explorations of HCI for mobile CSCW, in: Proceedings of the International ACM
SIGGROUP Conference on Supporting Group Work. pp. 276–285.
Krueger, M.W., 1991. Artificial reality II. Addison-Wesley Reading (Ma).
Kubisch, C., 2004. Electrical Walks.
Lee, C.-Y., 2007. Sonic graffiti: Spraying and remixing music on the street, in:
International Mobile Music Workshop.
Liu, H., Darabi, H., Banerjee, P., Liu, J., 2007. Survey of wireless indoor positioning
techniques and systems. Systems, Man, and Cybernetics, Part C: Applications and
Reviews, IEEE Transactions on 37, 1067–1080.
Lyons, K., Gandy, M., Starner, T., 2000.Guided by voices: An audio augmented reality
system, International Conference on Auditory Display.
Macaulay, C., Benyon, D., Crerar, A., 1998. Voices in the Forest: Sounds, Soundscapes
and Interface Design. Exploring Navigation: Towards a Framework for Design and
Evaluation in Electronic Spaces, SICS Technical Report T 98.
Marchionini, G., Shneiderman, B., 1988. Finding facts vs. browsing knowledge in
hypertext systems. Computer 21, pp. 70–80.
Marentakis, G., Brewster, S.A., 2005. A comparison of feedback cues for enhancing
pointing efficiency in interaction with spatial audio displays, Proceedings of the
7th International Conference on Human Computer Interaction with Mobile
Devices & Services. pp. 55–62.
Marentakis, G.N., Brewster, S.A., 2005. Effects of reproduction equipment on interaction
with a spatial audio interface, CHI’05 Extended Abstracts on Human Factors in
Computing Systems.pp. 1625–1628.
McGookin, D., Brewster, S., 2012. PULSE: the design and evaluation of an auditory
display to provide a social vibe, Proceedings of the 2012 ACM Annual Conference
on Human Factors in Computing Systems. pp. 1263–1272.
McGookin, D.K., Brewster, S.A., 2004. Space, the Final Frontearcon: The Identification of
Concurrently Presented Earcons in a Synthetic Spatialised Auditory
Environment.,ICAD.
MCGREGOR, P., HORN, A.G., TODD, M.A., 1985. Are familiar sounds ranged more
accurately? Perceptual and motor skills 61, 1082–1082.
141
Micallef, S., Sawhney, G., Roussel, J., 2003.Murmur.
Milgram, P., Takemura, H., Utsumi, A., Kishino, F., 1995. Augmented reality: A class of
displays on the reality-virtuality continuum, in: Photonics for Industrial
Applications. pp. 282–292.
Mott, I., Raszewski, M., Sosnin, J., 1998. Sound Mapping.
Mullins, A.T., 1996. AudioStreamer: Leveraging the cocktail party effect for efficient
listening. PhD Thesis, MIT.
Mynatt, E.D., Back, M., Want, R., Baer, M., Ellis, J.B., 1998. Designing audio aura, in:
Proceedings of the SIGCHI Conference on Human Factors in Computing Systems.pp.
566–573.
Navarro, D., Benet, G., 2009. Magnetic map building for mobile robot localization
purpose, in: Emerging Technologies & Factory Automation, 2009. ETFA 2009.IEEE
Conference On. pp. 1–4.
Pascoe, J., Ryan, N., Morse, D., 2000. Using while moving: HCI issues in fieldwork
environments. ACM Transactions on Computer-Human Interaction (TOCHI) 7, pp.
417–437.
Peltola, M., 2009.Augmented reality audio applications in outdoor use.
Pompei, F. J. (1999). The audio spotlight: put sound wherever you want it. J. Audio Eng.
Soc, 47, pp. 726-731.
Rebelo, P., Green, M., Hollerweger, F., 2008. A typology for Listening in Place, in:
Proceedings of the 5th International Mobile Music Workshop. pp. 15–18.
Rocchesso, D., Serafin, S., Behrendt, F., Bernardini, N., Bresin, R., Eckel, G., Franinovic, K.,
Hermann, T., Pauletto, S., Susini, P., 2008. Sonic interaction design: sound,
information and experience, in: CHI’08 Extended Abstracts on Human Factors in
Computing Systems. pp. 3969–3972.
Rozier, J., Karahalios, K., Donath, J., 2000. Hear&There: An Augmented Reality System of
Linked Audio, Online Proceedings of the International Conference on Auditory
Display
Rueb, T., 1999.trace.
Rueb, T., 2004.drift.
Rueb, T., n.d. Core Sample.
142
Sawhney, N., 1998. Contextual awareness, messaging and communication in nomadic
audio environments.PhD Thesis, MIT.
Sawhney, N., Schmandt, C., 2000. Nomadic radio: speech and audio interaction for
contextual messaging in nomadic environments. ACM Transactions on
Computer-Human Interaction (TOCHI) 7, pp. 353–383.
Sawhney, N., Schmandt, C., 1997. Design of spatialized audio in nomadic environments.
ICAD ‘97 Proceedings 3–5.
Schmandt, C., 1998. Audio Hallway, Annual Symposium on User Interface Software and
Technology. p. 163.
Schmandt, C., Mullins, A., 1995. AudioStreamer: exploiting simultaneity for listening,
Conference on Human Factors in Computing Systems. pp. 218–219.
Settel, Z., Bouillot, N., Cooperstock, J.R., 2009. Audio graffiti: A location based
audio-tagging and remixing environment. Ann Arbor, MI: MPublishing, University
of Michigan Library.
Shepard, M., 2006. Tactical Sound Garden [TSG] Toolkit, 3rd International Workshop on
Mobile Music Technology, Brighton, UK.
Suksakulchai, S., Thongchai, S., Wilkes, D.M., Kawamura, K., 2000. Mobile robot
localization using an electronic compass for corridor environment, Systems, Man,
and Cybernetics, 2000 IEEE International Conference On. pp. 3354–3359.
Symons, S., 2004.Aura.The stuff around the stuff around you.
Talbot, M., Cowan, W., 2009. On the audio representation of distance for blind users,
Proceedings of the SIGCHI Conference on Human Factors in Computing Systems.
pp. 1839–1848.
Thompson, J., 2006. Soundbike.
Thurlow, W.R., Mangels, J.W., Runge, P.S., 1967. Head movements during sound
localization.The Journal of the Acoustical society of America 42, 489.
Vawter, N.N.T., 2006. Ambient Addition: How to turn urban noise into music. Master's
Thesis, MIT
Vazquez Alvarez, Y., Brewster, S.A., 2010.Designing spatial audio interfaces to support
multiple audio streams, Proceedings of the 12th International Conference on
Human Computer Interaction with Mobile Devices and Services. pp. 253–256.
143
Vazquez-Alvarez, Y., Oakley, I., Brewster, S.A., 2011.Auditory display design for
exploration in mobile audio-augmented reality. Personal and Ubiquitous
Computing 16, 987–999.
Vercoe, B., 2000. Triple Audio Spotlight.URL: http://www.holosonics.com/PR_MOS.html
Want, R., Hopper, A., Falcão, V., Gibbons, J., 1992. The active badge location system.
ACM Transactions on Information Systems (TOIS) 10, pp. 91–102.
Ward, A., Jones, A., Hopper, A., 1997. A new location technique for the active office.
Personal Communications, IEEE 4, pp. 42–47.
Wenzel, E.M., Wightman, F.L., Foster, S.H., 1988. A Virtual Display System for Conveying
Three-Dimensional Acoustic Information. Proceedings of the Human Factors and
Ergonomics Society Annual Meeting 32, pp. 86–90.
Zhou, Z., Cheok, A.D., Qiu, Y., Yang, X., 2007. The role of 3-D sound in human reaction
and performance in augmented reality environments. Systems, Man and
Cybernetics, Part A: Systems and Humans, IEEE Transactions on 37, pp. 262–272.