logit & probit regression. read the data use clear describe the data codebook summarize...
TRANSCRIPT

Logit & Probit Regression

Read the data use http://www.ats.ucla.edu/stat/stata/dae/log
it.dta, clear
Describe the data Codebook Summarize Tabulate Make graphs
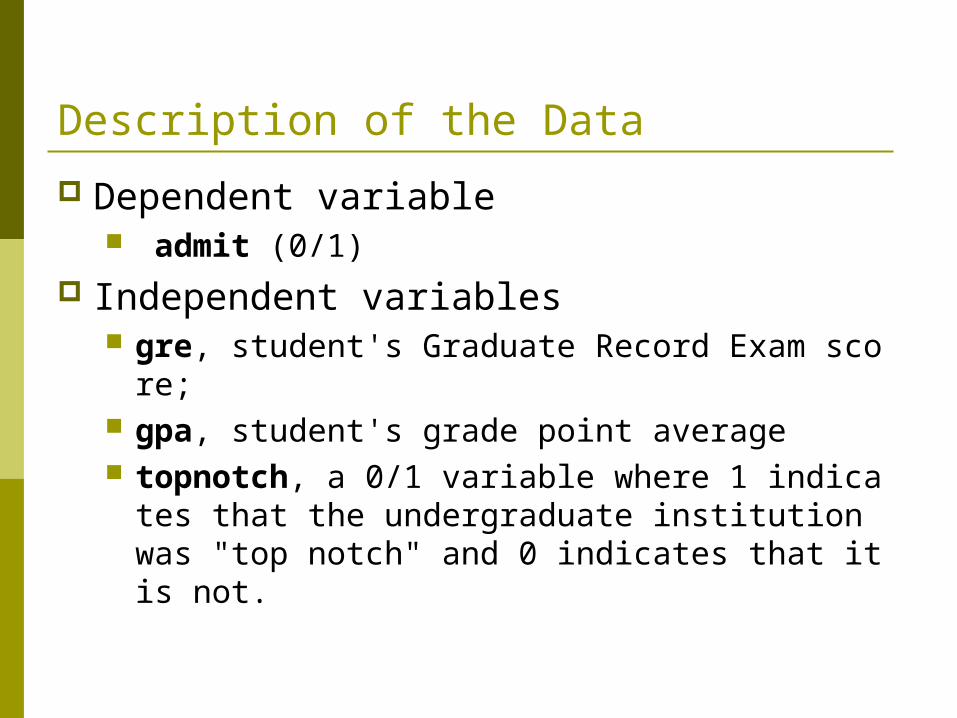
Description of the Data
Dependent variable admit (0/1)
Independent variables gre, student's Graduate Record Exam score; gpa, student's grade point average topnotch, a 0/1 variable where 1 indicates that th
e undergraduate institution was "top notch" and 0 indicates that it is not.


Some Possible Estimation Strategies
OLS regression: this analysis is problematic because the assumptions of OLS are violated when using a binary response variable.
Logit or Probit model Probit analysis will produce results similar l
ogit regression. The choice of probit versus logit regression depends largely on individual preferences.

Using Logit Model Before running logit, check to see if any cell
s (created by the crosstab of our categorical and response variables) are empty or particularly small.
If this occurs, there may be difficulty to run the logit model.


None of the cells are too small or empty (has no cases), so we will run our logit model.


The log likelihood (-239.06481) can be used in comparisons of nested models.
Observations (400) fewer observations would have been used if
any of our variables had missing values. The likelihood ratio chi-square (21.85)
with a p-value (0.0001) our model as a whole fits significantly better
than an empty model.

The interpretation of the coefficients can be awkward. For example, for a one unit increase in gpa, the log odds of being admitted to graduate school (vs. not being admitted) increases by .667.
For this reason, many researchers prefer to exponentiate the coefficients and interpret them as odds-ratios.
Stata will do this computation for you if you use the or option, illustrated below.


Now we can say that for a one unit increase in gpa, the odds of being admitted to graduate school (vs. not being admitted) increased by a factor of 1.94.
Since GRE scores increase only in units of 10, we can take the odds ratio and raise it to the 10th power, e.g. 1.00248 ^ 10 = 1.0250786, and say for a 10 unit increase in GRE score, the odds of admission to graduate school increased by a factor of 1.025.

We will start with prtab. (downloaded from internet)
This command can be used with either a categorical variable or a continuous variable and shows the predicted probability of the outcome being 1 for all levels of the specified predictor.
The predicted probability of being accepted into the graduate program is 0.29 if the undergraduate institution was not "top notch" and .39 if it was, while gre and gpa are held constant at their mean value.


Below we can see that the predicted probability of getting accepted is only .15 if one's GRE score is 220 and increases to .429 if one's GRE score is 800
Notice that gpa and topnotch are held constant at their mean, indicated at the end of the output.


We can use the prvalue command to obtain the predicted probabilities when gpa is set to specific values: 2, 3 and 4.
When one's GPA is 2, the predicted probability of being accepted is only .149, and .85 of not being accepted.
When GPA is 3, the probability of being accepted increases to .255
When one's GPA is 4, the predicted probability of being accepted is .40.

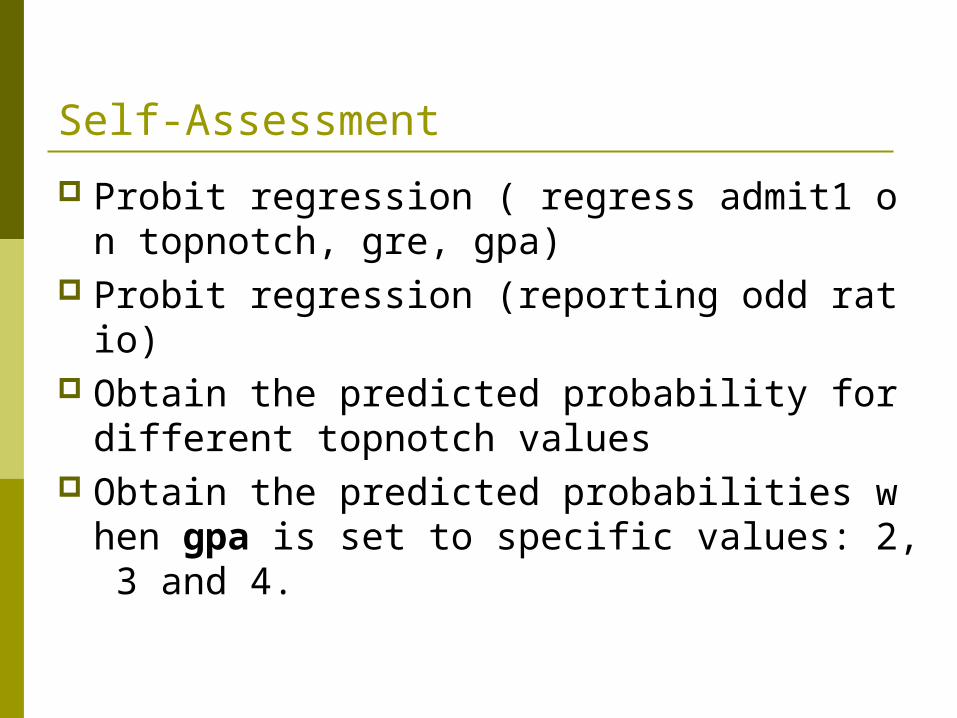
Self-Assessment
Probit regression ( regress admit1 on topnotch, gre, gpa)
Probit regression (reporting odd ratio) Obtain the predicted probability for differen
t topnotch values Obtain the predicted probabilities when gpa
is set to specific values: 2, 3 and 4.