lok sabha unstarred question no. 921 …smt. nirmala sitharaman) (a) & (b): the productivity of...
TRANSCRIPT
GOVERNMENT OF INDIA MINISTRY OF COMMERCE & INDUSTRY
(DEPARTMENT OF COMMERCE)
LOK SABHA UNSTARRED QUESTION NO. 921
TO BE ANSWERED ON 28TH NOVEMBER, 2014
PESTICIDE SEDIMENTS IN TEA
921. SHRI DUSHYANT CHAUTALA:
Will the Minister of COMMERCE & INDUSTRY ( ´ÉÉÉÊhÉVªÉ A´ÉÆ =tÉÉäMÉ àÉÆjÉÉÒ ) be
pleased to state:
a) whether a large number of samples of tea tested positive for a cocktail of toxic
pesticides and DDT was reportedly present in almost 67 per cent of the tea samples;
b) if so, whether the tea board had conducted any study to find out pesticide sediments in
the tea sold in the market with branded names;
c) if so, the details and the findings thereof; and
d) the action taken by the Government to ensure that Indian tea continues to be of high
standards?
ANSWER
वा�ण� य एवं उ�योग रा� य मं�ी ( �वतनतर �भार) )�ीमती �नम�ला सीतारमण (
THE MINISTER OF STATE IN THE MINISTRY OF COMMERCE AND INDUSTRY
(INDEPENDENT CHARGE)
(SMT. NIRMALA SITHARAMAN)
(a) to (c): Analysis of samples of tea carried out by the Tea Board through the accredited
laboratories of Tea Research Institutes indicates that the presence of pesticide residues in
most of the samples are within the limits of Maximum Residue Limits (MRLs) prescribed by
the Food Safety and Standards Authority of India (FSSAI). The tests conducted include
samples of both branded and general tea.
(d): Tea Board works with tea research institutes and other stakeholders to ensure that
Indian tea continues to be of high standard with respect to food safety and quality. A
comprehensive guideline on plant protection and agricultural practices including the usage of
pesticides in form of Plant Protection Code is being implemented. The FSSAI also regularly
reviews and updates MRLs for pesticides that are allowed to be present in tea. Trustea’, an
industry-led initiative, has been launched to enforce quality in manufactured tea. ‘Trustea’
certificate is granted to manufacturing units that do not use plant formulations banned by the
Central and state governments or its affiliated bodies.
*****

GOVERNMENT OF INDIA MINISTRY OF COMMERCE & INDUSTRY
(DEPARTMENT OF COMMERCE)
LOK SABHA UNSTARRED QUESTION NO. 922
TO BE ANSWERED ON 28TH NOVEMBER, 2014
IMPORT OF OIL SEEDS
922. SHRI ARKA KESHARI DEO:
Will the Minister of COMMERCE & INDUSTRY ( ´ÉÉÉÊhÉVªÉ A´ÉÆ =tÉÉäMÉ àÉÆjÉÉÒ ) be
pleased to state:
a) whether the Government has any plan/proposal to import oil seeds to meet country's
demand;
b) if so, the details thereof; and
c) the likely impact of such import on domestic market in the country?
ANSWER
वा�ण� य एवं उ�योग रा� य मं�ी ( �वतनतर �भार) )�ीमती �नम�ला सीतारमण (
THE MINISTER OF STATE IN THE MINISTRY OF COMMERCE AND INDUSTRY
(INDEPENDENT CHARGE)
(SMT. NIRMALA SITHARAMAN)
(a) Decisions on importing agricultural products including oilseeds are taken by the
Government keeping in view several factors viz. domestic demand and production,
domestic and international prices, likely effect on the domestic producers and
consumers etc. Currently, Department of Commerce has no plan of importing oilseeds.
However, Import Policy for oilseeds (other than that of seed quality and copra)
classified under Chapter 12 of ITC HS Code list is ‘free’ subject to conditions
prescribed in the Exim Policy and payment of custom tariff at applicable rates.
(b) & (c) Does not arise in view of (a) above.
******
GOVERNMENT OF INDIA MINISTRY OF COMMERCE & INDUSTRY
(DEPARTMENT OF COMMERCE)
LOK SABHA UNSTARRED QUESTION NO. 925
TO BE ANSWERED ON 28TH NOVEMBER, 2014
TEA PRODUCTION
925. SHRI BADRUDDIN AJMAL:
Will the Minister of COMMERCE & INDUSTRY ( ´ÉÉÉÊhÉVªÉ A´ÉÆ =tÉÉäMÉ àÉÆjÉÉÒ ) be
pleased to state:
a) whether tea productivity in the State of Assam is declining;
b) if so, whether any survey has been conducted to ascertain the reasons therefor;
c) whether the Government has taken any steps for enhancing tea production and
productivity in Assam through promotion of improved technologies and other means;
and
d) if so, the details thereof and if not, the reasons therefor?
ANSWER
वा�ण� य एवं उ�योग रा� य मं�ी ( �वतनतर �भार) )�ीमती �नम�ला सीतारमण (
THE MINISTER OF STATE IN THE MINISTRY OF COMMERCE AND INDUSTRY
(INDEPENDENT CHARGE)
(SMT. NIRMALA SITHARAMAN)
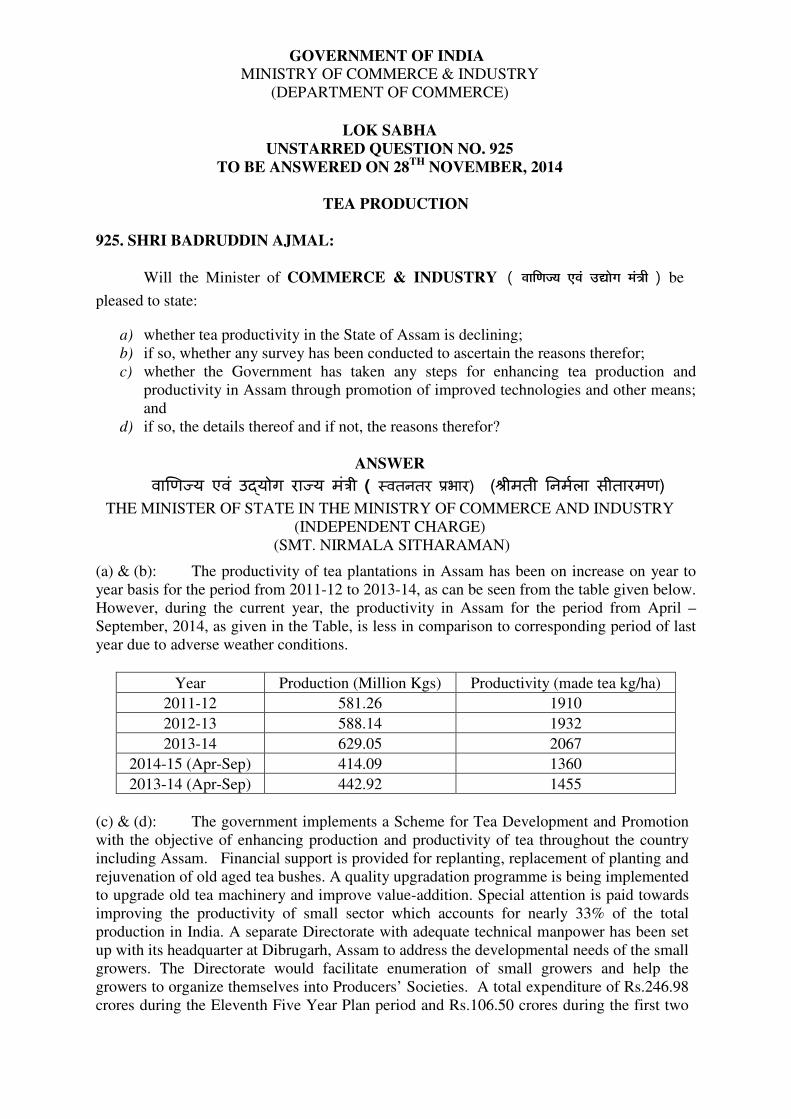
(a) & (b): The productivity of tea plantations in Assam has been on increase on year to
year basis for the period from 2011-12 to 2013-14, as can be seen from the table given below.
However, during the current year, the productivity in Assam for the period from April –
September, 2014, as given in the Table, is less in comparison to corresponding period of last
year due to adverse weather conditions.
Year Production (Million Kgs) Productivity (made tea kg/ha)
2011-12 581.26 1910
2012-13 588.14 1932
2013-14 629.05 2067
2014-15 (Apr-Sep) 414.09 1360
2013-14 (Apr-Sep) 442.92 1455
(c) & (d): The government implements a Scheme for Tea Development and Promotion
with the objective of enhancing production and productivity of tea throughout the country
including Assam. Financial support is provided for replanting, replacement of planting and
rejuvenation of old aged tea bushes. A quality upgradation programme is being implemented
to upgrade old tea machinery and improve value-addition. Special attention is paid towards
improving the productivity of small sector which accounts for nearly 33% of the total
production in India. A separate Directorate with adequate technical manpower has been set
up with its headquarter at Dibrugarh, Assam to address the developmental needs of the small
growers. The Directorate would facilitate enumeration of small growers and help the
growers to organize themselves into Producers’ Societies. A total expenditure of Rs.246.98
crores during the Eleventh Five Year Plan period and Rs.106.50 crores during the first two

years of the Twelfth Five Year Plan Period has been incurred to support various tea
development and promotion activities in Assam. *****
GOVERNMENT OF INDIA MINISTRY OF COMMERCE & INDUSTRY
(DEPARTMENT OF COMMERCE)
LOK SABHA UNSTARRED QUESTION NO. 926
TO BE ANSWERED ON 28TH NOVEMBER, 2014
IMPORT OF MARBLE
926(H). SHRI RAHUL KASWAN:
Will the Minister of COMMERCE & INDUSTRY ( ´ÉÉÉÊhÉVªÉ A´ÉÆ =tÉÉäMÉ àÉÆjÉÉÒ ) be
pleased to state:
a) the quantum and value of marble imported during each of the last three years and the
current year, country-wise;
b) the policy framed/being followed for import of marble;
c) whether the Union Government proposes to amend the existing marble import policy;
d) if so, the details thereof;
e) whether the existing marble import policy has adversely affected Rajasthan marble
industry; and
f) if so, the corrective measures taken by the Government in this regard?
ANSWER
वा�ण� य एवं उ�योग रा� य मं�ी ( �वतनतर �भार) )�ीमती �नम�ला सीतारमण (
THE MINISTER OF STATE IN THE MINISTRY OF COMMERCE AND INDUSTRY
(INDEPENDENT CHARGE)
(SMT. NIRMALA SITHARAMAN)
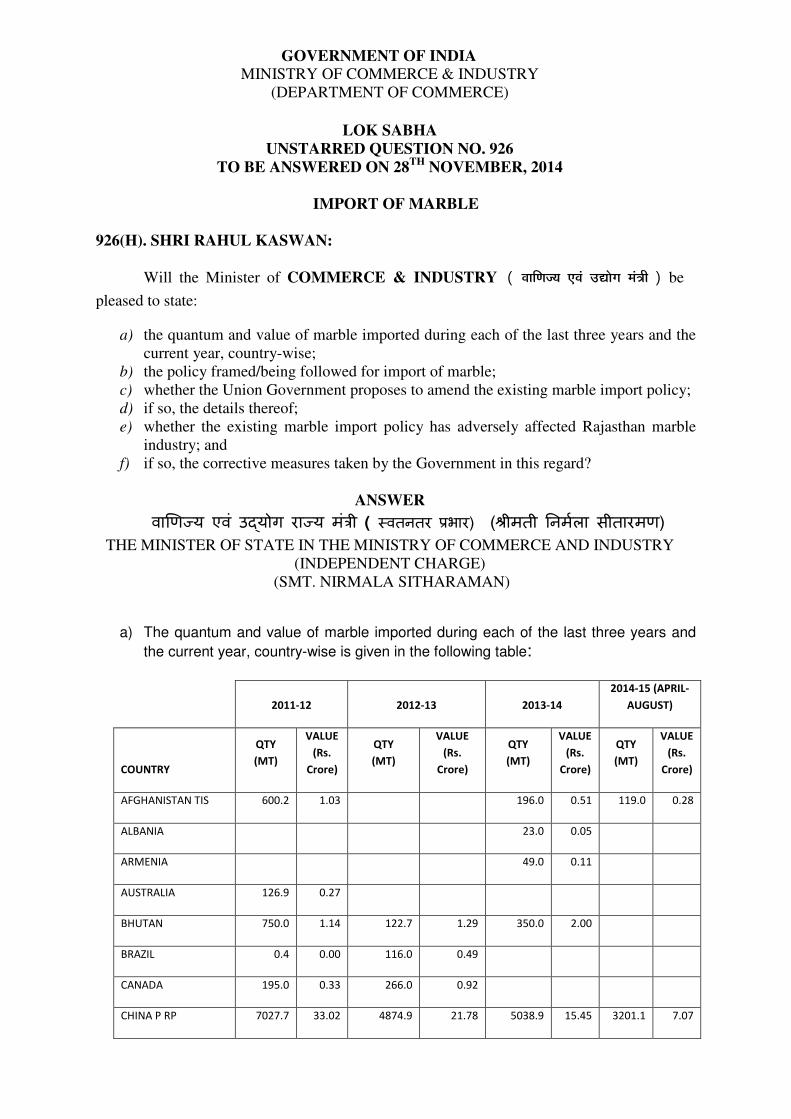
a) The quantum and value of marble imported during each of the last three years and
the current year, country-wise is given in the following table:
2011-12 2012-13 2013-14
2014-15 (APRIL-
AUGUST)
COUNTRY
QTY
(MT)
VALUE
(Rs.
Crore)
QTY
(MT)
VALUE
(Rs.
Crore)
QTY
(MT)
VALUE
(Rs.
Crore)
QTY
(MT)
VALUE
(Rs.
Crore)
AFGHANISTAN TIS 600.2 1.03 196.0 0.51 119.0 0.28
ALBANIA 23.0 0.05
ARMENIA 49.0 0.11
AUSTRALIA 126.9 0.27
BHUTAN 750.0 1.14 122.7 1.29 350.0 2.00
BRAZIL 0.4 0.00 116.0 0.49
CANADA 195.0 0.33 266.0 0.92
CHINA P RP 7027.7 33.02 4874.9 21.78 5038.9 15.45 3201.1 7.07

CROATIA 375.0 0.90 1072.0 2.46
DENMARK 0.2 0.00 0.2 0.00
DOMINIC REP 20.0 0.07
EGYPT A RP 7008.6 15.98 13103.8 23.36 12360.5 26.25 2589.1 5.83
ETHIOPIA 40.0 0.09 211.0 0.49 287.7 0.66
FINLAND 110.0 0.14
FRANCE 47.0 0.12 73.0 0.46 156.0 0.55 65.0 0.22
GERMANY 27.0 0.05
GREECE 2054.2 4.01 3313.6 8.35 3024.8 7.60 3371.4 7.81
HONG KONG 24.6 0.12 294.8 0.69 3.0 0.01 10.0 0.14
INDONESIA 127.7 0.43 64.4 0.13
IRAN 1779.1 3.32 4368.8 8.29 3334.8 7.86 2669.1 5.86
ISRAEL 165.8 0.78 26.5 0.06
ITALY 223040.1 393.90 158728.7 308.26 78508.4 173.47 28608.0 66.97
LEBANON 177.9 0.31
MACEDONIA 89.0 0.33
MADAGASCAR 94.0 0.35
MEXICO 195.0 0.37 377.0 0.75 92.0 0.21
MOROCCO 134.0 0.23 159.0 0.31 147.0 0.31
MOZAMBIQUE 0.1 0.00
NAMIBIA 46.0 0.09 280.0 0.60
NIUE IS 23.0 0.04
NORWAY 264.4 0.52 32.0 0.35
OMAN 4923.1 15.21 1143.6 5.16 1410.1 7.39 67.8 0.55
PAKISTAN IR 221.7 0.45 661.1 1.26 507.0 1.14
PERU 115.3 0.25
PHILIPPINES 78.0 0.18
PORTUGAL 156.0 0.40 1091.0 3.67 695.0 5.13
SAUDI ARAB 300.0 0.74
SINGAPORE 3.0 0.03 24.8 0.24
SLOVENIA 25.0 0.05
SOUTH AFRICA 47.0 0.10

SPAIN 5321.7 9.55 6963.5 13.79 3894.8 9.35 665.4 1.57
SRI LANKA DSR 1478.8 6.15 1253.5 6.13 101.5 0.67 52.9 0.34
TAIWAN 2.2 0.01
TANZANIA REP 765.0 1.61 0.0 0.00
THAILAND 30.0 0.29 71.0 0.08
TUNISIA 151.0 0.28 323.4 0.69 127.5 0.29
TURKEY 60827.6 102.35 64614.3 123.11 41519.8 89.84 14529.0 31.89
U ARAB EMTS 105.8 0.36 1294.0 2.57 136.2 0.30 41.9 0.29
U K 0.4 0.00
U S A 681.8 1.42 56.7 0.18
UNSPECIFIED 172.0 0.25
VIETNAM SOC REP 12466.8 19.04 14891.5 27.94 37162.4 80.15 7149.4 15.78
Grand Total 330200.1 611.44 277566.3 557.43 190759.5 430.73 66026.2 154.80
b) to d) The details of policy framed/being followed for import of Marble are as under:
i) For import of rough marble and travertine blocks- the quantity has been limited t 8 lakh MT for the
financial year 2014-15 with a minimum import price of US $ 325 per MT. This has been notified vide
DGFT Notification No 99 dated 20.11.2014.
ii) The import policy for processed/finished marble (under chapter 68 of ITC HS) is ‘free’ subject to
minimum import price of US $ 60 per sq metre (DGFT Notification No 65 dated 4.8.2011).
e) & f): No Madam, sufficient safeguards have been provided in the Policy to protect domestic
marble industry, including Rajasthan Marble Industry, in the form of annual quota and minimum
import price.
**************

GOVERNMENT OF INDIA MINISTRY OF COMMERCE & INDUSTRY
(DEPARTMENT OF COMMERCE)
LOK SABHA UNSTARRED QUESTION NO. 931
TO BE ANSWERED ON 28TH NOVEMBER, 2014
IRON ORE EXPORT
931. SHRI PRATHAP SIMHA:
Will the Minister of COMMERCE & INDUSTRY ( ´ÉÉÉÊhÉVªÉ A´ÉÆ =tÉÉäMÉ àÉÆjÉÉÒ ) be
pleased to state:
a) the quantum and value of minerals and metals including iron ore exported and
imported during each of the last three years and the current year, mineral/metal and
country-wise;
b) the country's share in world's total export of minerals along with share of various
States, particularly Karnataka therein during the said period; and
c) whether recently export of iron ore from Karnataka has declined sharply and if so, the
reasons therefor and the steps taken by the Government to improve the situation?
ANSWER
वा�ण� य एवं उ�योग रा� य मं�ी ( �वतनतर �भार) )�ीमती �नम�ला सीतारमण (
THE MINISTER OF STATE IN THE MINISTRY OF COMMERCE AND INDUSTRY
(INDEPENDENT CHARGE)
(SMT. NIRMALA SITHARAMAN)
(a) As per Statement annexed.
(b) As per United Nations Conference on Trade and Development (UNCTAD), India’s share of
World Iron Ore Export is 2.91% in 2012. The export data published by the Directorate General
of Commercial Intelligence and Statistics (DGCI&S) does not contain separate information on
value and share of ores and minerals exported from States.
(c) Since the imposition of ban on export of Iron Ore from July, 2010, there are no exports from
the State of Karnataka.
*****

STATEMENT
IMPORT OF IRON ORE AND METAL
Source: DGCI&S, Kolkata
EXPORT OF IRON ORE AND METAL
COMMODITY
2011-12 2012-13 2013-14 (P) 2014-15(Apr'14 to May'14) (P)
UNIT QTY VAL(RS CRORE) QTY
VAL(RS CRORE) QTY
VAL(RS CRORE) QTY
VAL(RS CRORE)
IRON ORE TON 47153196 22184.16 18119401 8984.57 16407789 9480.80 2648982 1260.93
IRON AND STEEL TON 8041503 39759.16 8679786 44041.79 11490022 55991.50 1885350 9159.51
PRODUCTS OF IRON AND STEEL 33850.35 40319.86 41052.64 6998.67
ALUMINIUM, PRODUCTS OF ALUMINM TON 515167 7323.69 574977 8887.82 736888 11797.01 129510 2066.15
COPPER AND PRDCTS MADE OF COPR TON 342526 14000.98 341008 16045.08 342950 17536.76 56150 2576.44
LEAD AND PRODUCTS MADE OF LED TON 69631 907.43 47156 633.90 80766 1199.18 11436 156.64
NICKEL, PRODUCT MADE OF NICKEL TON 5334 588.75 21612 2278.46 26459 2623.71 2269 250.05
TIN AND PRODUCTS MADE OF TIN TON 358 28.36 235 18.31 3349 492.19 460 70.69
ZINC AND PRODUCTS MADE OF ZINC TON 295067 3626.62 198669 2474.81 209370 2652.76 8620 125.08
OTH NON FEROUS METAL AND PRODC 1834.44 2065.33 2525.84 429.71
Source: DGCI&S, Kolkata
COMMODITY
2011-12 2012-13 2013-14 (P) 2014-15(Apr'14 to May'14) (P)
UNIT QTY VAL(RS CRORE) QTY
VAL(RS CRORE) QTY
VAL(RS CRORE) QTY
VAL(RS CRORE)
IRON ORE TON 974787 686.28 3053180 2575.05 367354 337.94 44300 29.00
IRON AND STEEL TON 16663824 65749.40 18447587 74125.25 11580001 54905.88 2184875 10216.13
PRODUCTS OF IRON AND STEEL 21732.49 22184.76 21677.06 3823.43
ALUMINIUM, PRODUCTS OF ALUMINM TON 1119729 14470.71 1337146 17766.28 1360912 19012.80 256203 3511.17
COPPER AND PRDCTS MADE OF COPR TON 363463 13432.43 421852 16504.71 423250 18151.45 86425 3507.19
LEAD AND PRODUCTS MADE OF LED TON 240687 2710.01 238633 2778.16 238353 3133.87 56417 744.12
NICKEL, PRODUCT MADE OF NICKEL TON 34799 3912.31 54331 5516.12 57087 5475.91 6271 649.53
TIN AND PRODUCTS MADE OF TIN TON 7692 866.51 7637 914.22 10753 1482.45 1264 181.59
ZINC AND PRODUCTS MADE OF ZINC TON 131433 1370.48 163878 1762.35 148915 1745.30 33579 418.30
OTH NON FEROUS METAL AND PRODC 3527.29 3934.42 4582.94 837.03

EXPORT OF IRON ORE
2011-12
2012-13
2013-14 (P)
2014-15(Apr'14 to May'14) (P)
COUNTRY VAL(RS CRORE) COUNTRY
VAL(RS CRORE) COUNTRY
VAL(RS CRORE) COUNTRY
VAL(RS CRORE)
CHINA P RP 20099.73 CHINA P RP 7697.78 CHINA P RP 7337.89 CHINA P RP 890.78
JAPAN 1263.96 JAPAN 1012.66 JAPAN 1487.34 JAPAN 336.13
KOREA RP 477.60 NETHERLAND 94.08 KOREA RP 306.49 IRAN 33.63
NETHERLAND 153.30 KOREA RP 75.96 OMAN 180.44 U ARAB EMTS 0.26
BANGLADESH PR 113.90 SINGAPORE 56.61 EGYPT A RP 46.05 SAUDI ARAB 0.09
OTHER COUNTRIES 75.69 OTHER COUNTRIES 47.49
OTHER COUNTRIES 122.60
OTHER COUNTRIES 0.05
TOTAL 22184.16 Total 8984.57 Total 9480.80 Total 1260.93
Source: DGCI&S, Kolkata
EXPORT OF METAL
2011-12
2012-13
2013-14 (P)
2014-15(Apr'14 to May'14) (P)
COUNTRY VAL(RS CRORE) COUNTRY
VAL(RS CRORE) COUNTRY
VAL(RS CRORE) COUNTRY
VAL(RS CRORE)
CHINA P RP 13597.11 U S A 13866.00 CHINA P RP 15093.46 U ARAB EMTS 2429.88
U S A 12093.87 CHINA P RP 13047.96 U S A 13973.30 U S A 2296.67
U ARAB EMTS 6847.74 U ARAB EMTS 9021.67 U ARAB EMTS 10515.01 CHINA P RP 1519.99
KOREA RP 4239.86 KOREA RP 4918.72 KOREA RP 5932.34 KOREA RP 1303.35
GERMANY 3806.55 GERMANY 4176.42 ITALY 4388.23 SAUDI ARAB 792.20
OTHER COUNTRIES 61334.64 OTHER COUNTRIES 71734.60
OTHER COUNTRIES 85969.27
OTHER COUNTRIES 13490.86
TOTAL 101919.78 TOTAL 116765.36 TOTAL 135871.61 TOTAL 21832.95
Source: DGCI&S, Kolkata
IMPORT OF IRON ORE
2011-12
2012-13
2013-14 (P)
2014-15(Apr'14 to May'14) (P)
COUNTRY VAL(RS CRORE) COUNTRY
VAL(RS CRORE) COUNTRY
VAL(RS CRORE) COUNTRY
VAL(RS CRORE)
UKRAINE 197.54 SOUTH AFRICA 878.19 RUSSIA 180.91 AUSTRALIA 28.97
RUSSIA 145.73 BAHARAIN IS 477.20 BAHARAIN IS 57.09 CHINA P RP 0.01
BAHARAIN IS 131.35 UKRAINE 362.87 AUSTRALIA 38.96 SUDAN 0.01
SOUTH AFRICA 85.19 AUSTRALIA 333.45 SOUTH AFRICA 37.36
BELGIUM 81.80 RUSSIA 152.80 SENEGAL 10.61
OTHER COUNTRIES 44.68
OTHER COUNTRIES 370.54
OTHER COUNTRIES 13.00
OTHER COUNTRIES 0.00
TOTAL 686.28 TOTAL 2575.05 TOTAL 337.94 TOTAL 29.00
Source: DGCI&S, Kolkata
IMPORT OF METAL
2011-12 2012-13 2013-14 (P) 2014-15(Apr'14 to May'14) (P)
COUNTRY VAL(RS CRORE) COUNTRY
VAL(RS CRORE) COUNTRY
VAL(RS CRORE) COUNTRY
VAL(RS CRORE)
CHINA P RP 21105.32 CHINA P RP 22238.16 CHINA P RP 20544.08 CHINA P RP 4575.76
KOREA RP 11245.64 KOREA RP 13138.98 KOREA RP 12691.35 KOREA RP 2365.37
JAPAN 9156.95 JAPAN 12054.54 JAPAN 11014.77 JAPAN 2006.66
U ARAB EMTS 7240.77 U ARAB EMTS 8746.37 U ARAB EMTS 10546.49 U ARAB EMTS 1929.52
GERMANY 6632.04 GERMANY 8439.74 GERMANY 6156.28 MALAYSIA 1105.07
OTHER COUNTRIES 72390.90
OTHER COUNTRIES 80868.48
OTHER COUNTRIES 69214.70
OTHER COUNTRIES 11906.11
TOTAL 127771.63 TOTAL 145486.26 TOTAL 130167.67 TOTAL 23888.49
Source: DGCI&S, Kolkata
*******************

GOVERNMENT OF INDIA MINISTRY OF COMMERCE & INDUSTRY
(DEPARTMENT OF COMMERCE)
LOK SABHA UNSTARRED QUESTION NO. 933
TO BE ANSWERED ON 28TH NOVEMBER, 2014
PRODUCTIVITY OF NATURAL RUBBER
933. SHRI ANTO ANTONY:
Will the Minister of COMMERCE & INDUSTRY ( ´ÉÉÉÊhÉVªÉ A´ÉÆ =tÉÉäMÉ àÉÆjÉÉÒ ) be
pleased to state:
a) whether the Government has conducted any study on the productivity of natural
rubber in the country;
b) if so, the details and the outcome thereof;
c) the major factors affecting the rubber productivity in the country;
d) whether climate change has also any adverse impact on rubber productivity and if so,
the details thereof; and
e) the steps taken by the Government to enhance the productivity of natural rubber in the
country?
ANSWER
वा�ण� य एवं उ�योग रा� य मं�ी ( �वतनतर �भार) )�ीमती �नम�ला सीतारमण (
THE MINISTER OF STATE IN THE MINISTRY OF COMMERCE AND INDUSTRY
(INDEPENDENT CHARGE)
(SMT. NIRMALA SITHARAMAN)
(a) & (b): The Rubber Research Institute of India (RRII) under the Rubber Board
regularly conducts studies pertaining to productivity of natural rubber
plantations. The areas of studies undertaken by RRII, inter-alia relate to
developing high yielding clones; genetic improvement through genetic
diversity analysis and genome mapping; collection, conservation and
utilization of domesticated and wild germplasm accessions, and studies on
productivity augmenting agro-management practices. Experimental trials are
undertaken to analyse the productivity of clones. Commercial yield of major
clones realized in rubber plantations is also regularly evaluated.
(c): Quality of clones used, age of rubber plantations, weather conditions, agro-
climatic factors and agro-management practices are the major factors affecting
rubber productivity in the country. Price of rubber also influences
productivity through its impact on harvesting intensity.
(d): Studies conducted by the RRII indicate that natural rubber (NR) productivity
in Kerala could be adversely impacted to the extent of 4% to 7% while
productivity in the North Eastern Region could go up by as much as 11% in
the next decade if the present warming trend continues.
(e): Major steps taken by Government to enhance productivity of NR in the
country include development and popularization of new high yielding
varieties of planting materials; emphasis on group approach through Rubber
Producers Societies (RPS); promotion of replanting of rubber through subsidy

and provision of advisory services; and extension of rubber cultivation in
North Eastern Region and Left Wing Extremism affected areas.
******************

GOVERNMENT OF INDIA MINISTRY OF COMMERCE & INDUSTRY
(DEPARTMENT OF COMMERCE)
LOK SABHA UNSTARRED QUESTION NO. 938
TO BE ANSWERED ON 28TH NOVEMBER, 2014
NEW FOREIGN TRADE POLICY
938. SHRI R. GOPALAKRISHNAN:
Will the Minister of COMMERCE & INDUSTRY ( ´ÉÉÉÊhÉVªÉ A´ÉÆ =tÉÉäMÉ àÉÆjÉÉÒ ) be
pleased to state:
a) whether there is any proposal for introducing new foreign trade policy;
b) if so, the details thereof;
c) the manner in which the new policy differs from the existing foreign trade policy;
d) whether shortcomings, if any, of the existing policy have been rectified in the new
policy;
e) if so, the details thereof; and
f) the extent to which the new policy is expected to protect the interests of the exporters
and especially the Special Export Zones in the country including the SEZs in Tamil
Nadu?
ANSWER
वा�ण� य एवं उ�योग रा� य मं�ी ( �वतनतर �भार) )�ीमती �नम�ला सीतारमण (
THE MINISTER OF STATE IN THE MINISTRY OF COMMERCE AND INDUSTRY
(INDEPENDENT CHARGE)
(SMT. NIRMALA SITHARAMAN)
a): Yes, Madam.
b) to f): The details of the new Foreign Trade Policy are under consultation and finalization
*******************

GOVERNMENT OF INDIA MINISTRY OF COMMERCE & INDUSTRY
(DEPARTMENT OF COMMERCE)
LOK SABHA UNSTARRED QUESTION NO. 939
TO BE ANSWERED ON 28TH NOVEMBER, 2014
CURBS ON ONION TRADE
939. SHRI J.C. DIVAKAR REDDY:
Will the Minister of COMMERCE & INDUSTRY ( ´ÉÉÉÊhÉVªÉ A´ÉÆ =tÉÉäMÉ àÉÆjÉÉÒ ) be
pleased to state:
a) whether the Government has imposed certain restrictions/curbs on onion trade, thus
causing difficulty to the farmers in selling, transportation and exporting them; and
b) if so, the details thereof and the steps taken/being taken to remove such curbs to
protect the interests of those engaged in cultivating/producing onions in the country?
ANSWER
वा�ण� य एवं उ�योग रा� य मं�ी ( �वतनतर �भार) )�ीमती �नम�ला सीतारमण (
THE MINISTER OF STATE IN THE MINISTRY OF COMMERCE AND INDUSTRY
(INDEPENDENT CHARGE)
(SMT. NIRMALA SITHARAMAN)
(a & b) There is an Inter-Ministerial Committee which takes stock of the arrival of onion and
modal prices prevailing in the important production and consumption centres. The
Committee takes appropriate decision to calibrate export through MEP on onion from time to
time after considering various factors like availability of onion in domestic market,
remunerative prices to the growers and availability of agricultural products to common man
at affordable prices.
The Government had imposed a Minimum Export Price (MEP) of USD 300 per MT
on 17th
June, 2014 on export of onions in view of the inordinately high domestic prices and
anticipated shortage of onions in domestic markets with a view to safeguard the interests of
domestic consumers from soaring prices. This MEP has further raised to USD 500 PMT on
2nd
July, 2014 and later brought down to USD 300 PMT w.e.f. 21st August, 2014.
**************
GOVERNMENT OF INDIA MINISTRY OF COMMERCE & INDUSTRY
(DEPARTMENT OF COMMERCE)
LOK SABHA UNSTARRED QUESTION NO. 942
TO BE ANSWERED ON 28TH NOVEMBER, 2014
EXCLUSION OF NATURAL RUBBER IN ASEAN
942. ADV. JOICE GEORGE:
Will the Minister of COMMERCE & INDUSTRY ( ´ÉÉÉÊhÉVªÉ A´ÉÆ =tÉÉäMÉ àÉÆjÉÉÒ ) be
pleased to state:
a) whether the Government proposes to add natural rubber to exclusive/highly sensitive
list under the ASEAN treaty;
b) if so, the details thereof and the steps taken in this regard;
c) whether some difficulties/barriers have been faced by the Government in this regard;
and
d) if so, the details thereof along with the steps taken by the Government to remove the
difficulties?
ANSWER
वा�ण� य एवं उ�योग रा� य मं�ी ( �वतनतर �भार) )�ीमती �नम�ला सीतारमण (
THE MINISTER OF STATE IN THE MINISTRY OF COMMERCE AND INDUSTRY
(INDEPENDENT CHARGE)
(SMT. NIRMALA SITHARAMAN)
(a) No, Government does not propose to add natural rubber to exclusive/ highly
sensitive list under the ASEAN Treaty because all marketed forms of Natural Rubber
(NR) are already under the Exclusion List of India-ASEAN FTA.
(b) to (d): No action is required.
***********
GOVERNMENT OF INDIA MINISTRY OF COMMERCE & INDUSTRY
(DEPARTMENT OF COMMERCE)
LOK SABHA UNSTARRED QUESTION NO. 948
TO BE ANSWERED ON 28TH NOVEMBER, 2014
DEFERMENT OF PLANT PROTECTION CODE BY
TEA BOARD
948. SHRI RAM CHARITRA NISHAD:
Will the Minister of COMMERCE & INDUSTRY ( ´ÉÉÉÊhÉVªÉ A´ÉÆ =tÉÉäMÉ àÉÆjÉÉÒ ) be
pleased to state:
a) whether the Tea Board of India has deferred the implementation of the Plant
Protection Code which was to come into effect from September 1, 2014;
b) if so, the details thereof and the reasons therefor along with the time by which it is
likely to be implemented;
c) whether any request/representation have been received by the Tea Board from small
tea growers in this regard; and
d) if so, the details thereof and the reaction of the Government thereto?
ANSWER
वा�ण� य एवं उ�योग रा� य मं�ी ( �वतनतर �भार) )�ीमती �नम�ला सीतारमण (
THE MINISTER OF STATE IN THE MINISTRY OF COMMERCE AND INDUSTRY
(INDEPENDENT CHARGE)
(SMT. NIRMALA SITHARAMAN)
(a) & (b): As per notification issued by the Tea Board on 29th
August, 2014, all clauses
of the Plant Protection Code (PPC), except three clauses, namely 18, 19 and 20, are effective
from 1st September, 2014. Full compliance of the Code including the above mentioned
clauses is mandated from 1st January, 2015. The PPC is being implemented in phases in
order to enable all stakeholders of tea sector to build adequate capacity within the given time
frame and fully meet all requirements of the PPC.
(c) & (d): Representations have been received from Small Tea Growers Association
from Assam and West Bengal requesting deferment of implementation of Plant Protection
Code to the next cropping season. There is currently no proposal to review the date of full
implementation of the PPC.
*****
GOVERNMENT OF INDIA MINISTRY OF COMMERCE & INDUSTRY
(DEPARTMENT OF COMMERCE)
LOK SABHA UNSTARRED QUESTION NO. 963
TO BE ANSWERED ON 28TH NOVEMBER, 2014
IMPORT OF RICE BY STC
963(H). SHRI SUMEDHANAND SARSWATI:
Will the Minister of COMMERCE & INDUSTRY ( ´ÉÉÉÊhÉVªÉ A´ÉÆ =tÉÉäMÉ àÉÆjÉÉÒ ) be
pleased to state:
a) whether the Food Corporation of India (FCI) has requested State Trading Corporation
(STC) to import rice from Myanmar;
b) if so, the details thereof;
c) whether the STC is facing transport related problems in importing rice from Myanmar
via Manipur due to broad gauge work being carried out on Lamding-Badarpur railway
track; and
d) if so, the manner in which the STC proposes to resolve these problems?
ANSWER
वा�ण� य एवं उ�योग रा� य मं�ी ( �वतनतर �भार) )�ीमती �नम�ला सीतारमण (
THE MINISTER OF STATE IN THE MINISTRY OF COMMERCE AND INDUSTRY
(INDEPENDENT CHARGE)
(SMT. NIRMALA SITHARAMAN)
(a)&(b) Yes, Madam. FCI has advised STC to float tenders for import of 10,000 MTs per
month of rice for Manipur for meeting the requirement of Public Distribution System
(PDS) and Other Welfare Scheme (OWS).
(c)&(d) As per decisions of FCI, STC would hand-over the imported cargo to FCI/State
Government at Moreh Land Customers Station (LCS), Manipur and FCI/State
Government would make necessary arrangement for onward transportation within
State.
*******
GOVERNMENT OF INDIA MINISTRY OF COMMERCE & INDUSTRY
(DEPARTMENT OF COMMERCE)
LOK SABHA UNSTARRED QUESTION NO. 969
TO BE ANSWERED ON 28TH NOVEMBER, 2014
ASSISTANCE TO COFFEE INDUSTRY
969. SHRI E.T. MOHAMMED BASHEER:
Will the Minister of COMMERCE & INDUSTRY ( ´ÉÉÉÊhÉVªÉ A´ÉÆ =tÉÉäMÉ àÉÆjÉÉÒ ) be
pleased to state:
a) whether the coffee industry in the country has been affected by the pest menace;
b) if so, the details thereof and the remedial steps taken by the Government in this
regard; and
c) the other steps taken/proposed to be taken to assist and protect the coffee industry in
the country?
ANSWER
वा�ण� य एवं उ�योग रा� य मं�ी ( �वतनतर �भार) )�ीमती �नम�ला सीतारमण (
THE MINISTER OF STATE IN THE MINISTRY OF COMMERCE AND INDUSTRY
(INDEPENDENT CHARGE)
(SMT. NIRMALA SITHARAMAN)
(a): Stem borer pest is amongst the major constraints affecting cultivation of Arabica
variety of coffee. The combined effects of higher temperatures, reduction of shade for
increasing the yield of pepper grown as intercrop and lack of timely control measures
by the growers have led to increase in the incidence of the pest.
About 3200 hectares of productive area in Karnataka state are reported to have been
affected by stem borer due to long dry spell from Nov.2013 to May 2014 and resultant
high day temperatures. The incidence was lower in other major Arabica coffee
producing areas of Tamil Nadu, Kerala and Non-Traditional Areas.
(b)&(c): Several steps have been initiated to address the problem of pest in coffee
cultivation. The government has approved a two year Action Plan (2014-15 & 2015-
16) for combating the stem borer in affected areas. This includes, inter alia, support for
gap filling, raising coffee seedlings by growers SHGs/ collectives, supply of
pheromone traps at subsidized rates, and a Mission Mode approach for enhanced
education, training and demonstration on stem borer control measures.
The Indian Council of Agricultural Research has included coffee White Stem
Borer(WSB) as one of the components in its mega project viz., Consortium Research
Programme on Insect borers’ for implementation during Twelfth Five year Plan. The
Coffee Board has supported a collaborative research project viz., ‘Studies on Female
Pheromone plant Kairomone on coffee WSB’ with a view to improve the efficiency of
trapping of adult beetles.
Department of Bio-technology is implementing a project through the Central Coffee
Research Institute, University of Agricultural Sciences, Dharwad and a private

laboratory on bio-technological approaches to identify potential Bt toxins against
coffee stem borer.
**************
GOVERNMENT OF INDIA MINISTRY OF COMMERCE & INDUSTRY
(DEPARTMENT OF COMMERCE)
LOK SABHA UNSTARRED QUESTION NO. 995
TO BE ANSWERED ON 28TH NOVEMBER, 2014
EXPORT AND IMPORT OF AGRICULTURAL/FARM PRODUCTS
995. SHRI BIDYUT BARAN MAHATO: SHRI DUSHYANT SINGH: SHRI FEROZE VARUN GANDHI: DR. VIRENDRA KUMAR: DR. K. GOPAL: SHRI RAMSINH RATHWA: SHRI RAJU SHETTI: SHRI BHAGWANTH KHUBA: CHOUDHARY BABU LAL: SHRI VIKRAM USENDI:
Will the Minister of COMMERCE & INDUSTRY ( ´ÉÉÉÊhÉVªÉ A´ÉÆ =tÉÉäMÉ àÉÆjÉÉÒ ) be
pleased to state:
a) the quantum and value of foodgrains and other agricultural/farm products exported
and imported vis-a-vis target fixed in this regard during each of the last three years
and the current year, commodity/item and country-wise;
b) India's share in the global trade in foodgrains and other agricultural products along
with the share of various States therein;
c) whether the export of agricultural products is very low in comparison with other
consumer products from the country and if so, the details thereof along with the
reasons therefor;
d) whether the export of agricultural products particularly wheat and rice has resulted in
shortage and price rise of these products or their processed items in the country and if
so, the details thereof along with the corrective measures taken by the Government in
this regard;
e) the assistance/incentives/facilities being provided by the Government to the exporters
to boost export of agricultural/ farm products; and
f) the measures taken by the Government to boost export of agricultural products
including any scheme being implemented by the Government through Agricultural
and Processed Food Products Export Development Authority (APEDA) in this
regard?
ANSWER
वा�ण� य एवं उ�योग रा� य मं�ी ( �वतनतर �भार) )�ीमती �नम�ला सीतारमण (
THE MINISTER OF STATE IN THE MINISTRY OF COMMERCE AND INDUSTRY
(INDEPENDENT CHARGE)
(SMT. NIRMALA SITHARAMAN)
(a) The details of quantum and value of export of major foodgrains and agricultural/farm
products exported and imported during each of the last three years and the current year,
country-wise (top 5) are given at Annexure – I and Annexure – II respectively. No
targets were fixed as import and export of agri commodities depends on various factors
including availability of stocks in domestic market, concerns of food security, diplomatic /
humanitarian considerations, international demands and supply situation, quality standards
in the importing countries, varieties traded and price competitiveness, need to balance
between remunerative prices to the growers and availability of agricultural products to
common man at affordable prices.
(b) As per the International Trade Statistics, 2014 from WTO, share of India in the global
export of agricultural products is 2.7%. The state wise data is not maintained.
(c) The share of overall agricultural exports in total merchandise export of the country in
2013-14 was 13.6% which has grown from 9.95% in 2009-10. Considering the huge
population and various challenges facing the agricultural sector, the share of agriculture
export cannot be considered as low.
(d) Domestic prices of any agriculture commodity, inter-alia, are a function of several factors
like domestic and international demand and supply, cost of production like labour, capital,
input cost etc., prevailing domestic and international food inflation etc. and, therefore,
cannot be directly attributed to exports alone.
(e & f) The Government is taking steps to encourage exports of agro products through measures
and incentives under Plan schemes of the Commodity Boards and Export Promotion
Councils. Besides these measures, the Ministry of Commerce & Industry has put in place
various schemes namely Market Development Assistance (MDA), Market Assistance
Initiative (MAI), Assistance to States for Developing Export Infrastructure and Allied
Activities(ASIDE), Vishesh Krishi and Gram Upaj Yojana, Focus Product Scheme, Focus
Market Scheme etc. to provide assistance to encourage exports. APEDA provides
assistance to registered members under “Agriculture Export Promotion Plan Scheme” for
Quality, Infrastructure, Market Development and Transport Assistance.
************
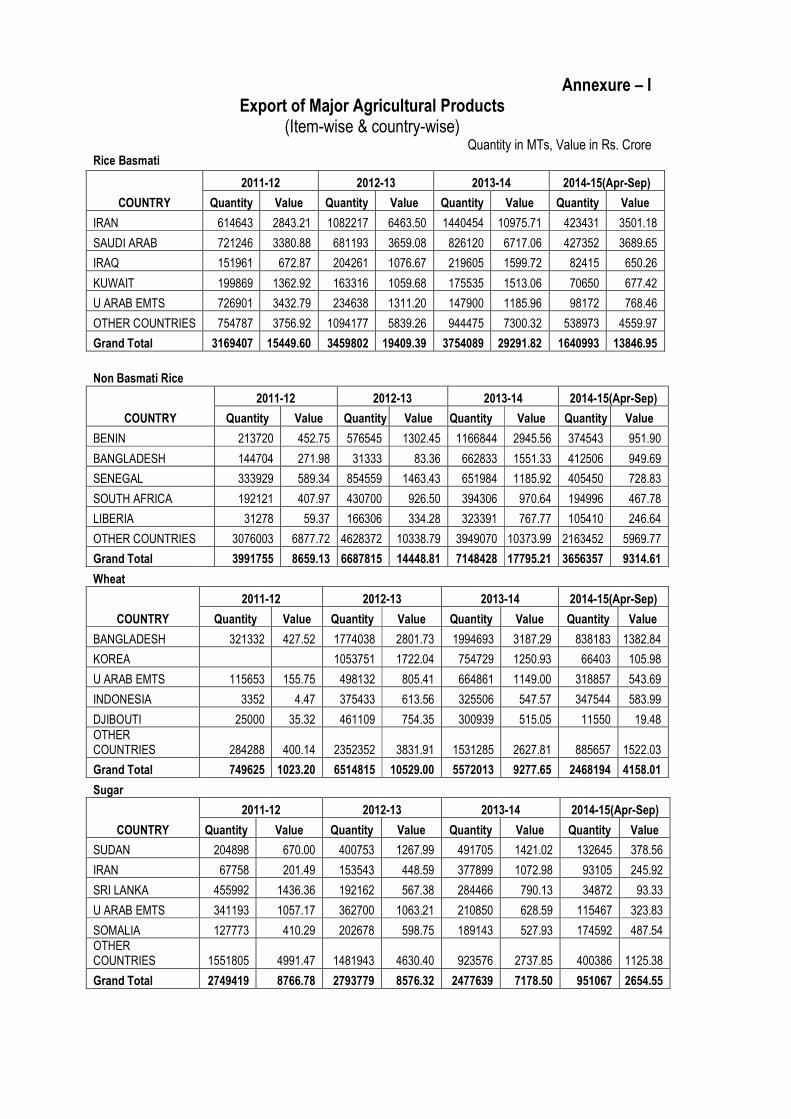
Annexure – I Export of Major Agricultural Products
(Item-wise & country-wise) Quantity in MTs, Value in Rs. Crore
Rice Basmati
COUNTRY
2011-12 2012-13 2013-14 2014-15(Apr-Sep)
Quantity Value Quantity Value Quantity Value Quantity Value
IRAN 614643 2843.21 1082217 6463.50 1440454 10975.71 423431 3501.18
SAUDI ARAB 721246 3380.88 681193 3659.08 826120 6717.06 427352 3689.65
IRAQ 151961 672.87 204261 1076.67 219605 1599.72 82415 650.26
KUWAIT 199869 1362.92 163316 1059.68 175535 1513.06 70650 677.42
U ARAB EMTS 726901 3432.79 234638 1311.20 147900 1185.96 98172 768.46
OTHER COUNTRIES 754787 3756.92 1094177 5839.26 944475 7300.32 538973 4559.97
Grand Total 3169407 15449.60 3459802 19409.39 3754089 29291.82 1640993 13846.95
Non Basmati Rice
COUNTRY
2011-12 2012-13 2013-14 2014-15(Apr-Sep)
Quantity Value Quantity Value Quantity Value Quantity Value
BENIN 213720 452.75 576545 1302.45 1166844 2945.56 374543 951.90
BANGLADESH 144704 271.98 31333 83.36 662833 1551.33 412506 949.69
SENEGAL 333929 589.34 854559 1463.43 651984 1185.92 405450 728.83
SOUTH AFRICA 192121 407.97 430700 926.50 394306 970.64 194996 467.78
LIBERIA 31278 59.37 166306 334.28 323391 767.77 105410 246.64
OTHER COUNTRIES 3076003 6877.72 4628372 10338.79 3949070 10373.99 2163452 5969.77
Grand Total 3991755 8659.13 6687815 14448.81 7148428 17795.21 3656357 9314.61
Wheat
COUNTRY
2011-12 2012-13 2013-14 2014-15(Apr-Sep)
Quantity Value Quantity Value Quantity Value Quantity Value
BANGLADESH 321332 427.52 1774038 2801.73 1994693 3187.29 838183 1382.84
KOREA 1053751 1722.04 754729 1250.93 66403 105.98
U ARAB EMTS 115653 155.75 498132 805.41 664861 1149.00 318857 543.69
INDONESIA 3352 4.47 375433 613.56 325506 547.57 347544 583.99
DJIBOUTI 25000 35.32 461109 754.35 300939 515.05 11550 19.48
OTHER COUNTRIES 284288 400.14 2352352 3831.91 1531285 2627.81 885657 1522.03
Grand Total 749625 1023.20 6514815 10529.00 5572013 9277.65 2468194 4158.01
Sugar
COUNTRY
2011-12 2012-13 2013-14 2014-15(Apr-Sep)
Quantity Value Quantity Value Quantity Value Quantity Value
SUDAN 204898 670.00 400753 1267.99 491705 1421.02 132645 378.56
IRAN 67758 201.49 153543 448.59 377899 1072.98 93105 245.92
SRI LANKA 455992 1436.36 192162 567.38 284466 790.13 34872 93.33
U ARAB EMTS 341193 1057.17 362700 1063.21 210850 628.59 115467 323.83
SOMALIA 127773 410.29 202678 598.75 189143 527.93 174592 487.54
OTHER COUNTRIES 1551805 4991.47 1481943 4630.40 923576 2737.85 400386 1125.38
Grand Total 2749419 8766.78 2793779 8576.32 2477639 7178.50 951067 2654.55

Pulses
COUNTRY
2011-12 2012-13 2013-14 2014-15(Apr-Sep)
Quantity Value Quantity Value Quantity Value Quantity Value
PAKISTAN 42508 218.79 59059 297.52 100170 395.60 41692 188.22
TURKEY 23816 159.93 27720 203.15 60482 335.31 6757 39.43
ALGERIA 32200 211.24 36853 269.75 57553 329.99 12914 79.24
SRI LANKA 16865 117.47 12713 84.60 19794 90.95 14489 71.64
SPAIN 3814 21.27 3192 19.79 14413 82.22 5152 31.77
OTHER COUNTRIES 54299 339.23 63117 410.18 93141 514.73 40214 243.51
Grand Total 173502 1067.93 202654 1284.99 345553 1748.81 121218 653.81
Oil Meal
COUNTRY
2011-12 2012-13 2013-14 2014-15(Apr-Sep)
Quantity Value Quantity Value Quantity Value Quantity Value
IRAN 141971 251.41 714583 2206.12 1175597 4143.36 136430 310.28
PAKISTAN 511776 954.53 539108 1593.16 588697 1906.67 103534 335.20
KOREA RP 613161 554.44 950183 1411.71 1178776 1540.97 471749 534.76
BANGLADESH PR 532741 937.40 354233 918.17 560859 1327.37 244525 563.30
THAILAND 591614 973.38 593883 1588.75 419062 979.51 140697 222.24
OTHER COUNTRIES 5013928 8125.30 3426188 8801.62 2653513 7172.24 500112 1058.14
Grand Total 7405191 11796.46 6578178 16519.53 6576504 17070.13 1597047 3023.92
Source: DGCI&S

ANNEXURE – II Import of Major Agricultural Products
(Item-wise & country-wise) Quantity in MTs, Value in Rs. crore
Vegetable Oil
COUNTRY
2011-12 2012-13 2013-14 2014-15(Apr-Sep)
Quantity Value Quantity Value Quantity Value Quantity Value
INDONESIA 4246764 22397.35 4756402 24253.64 3544424 18261.68 1809283 9633.78
MALAYSIA 1059835 5509.64 2456837 13071.29 1665854 8697.51 1356487 7144.04
UKRAINE 752387 4726.56 1107613 7440.60 1074635 6874.46 866601 4928.47
ARGENTINA 769388 4694.60 818641 5590.12 1091678 6761.36 885440 5097.93
BRAZIL 112363 691.06 218685 1489.96 225743 1394.36 255830 1492.69
OTHER COUNTRIES 141253 889.81 248070 1716.00 340560 2048.67 242163 1485.57
Grand Total 7081990 38909.02 9606248 53561.61 7942894 44038.04 5415804 29782.47
Oil Meal
COUNTRY
2011-12 2012-13 2013-14 2014-15(Apr-Sep)
Quantity Value Quantity Value Quantity Value Quantity Value
TANZANIA REP 846 0.87 63906 90.72 62745 99.44 23378 37.11
NEPAL 39313 41.32 33211 45.32 27572 39.24 16626 25.47
INDONESIA 23223 27.06 11700 15.49 18492 27.40 26706 46.04
CANADA 1058 6.65 1132 8.51 1157 9.36 794 6.66
PHILIPPINES 6000 6.49 17398 22.60 6170 8.42 12800 21.46
OTHER COUNTRIES 15686 16.33 20953 27.74 10796 16.01 10018 14.26
Grand Total 86126 98.72 148300 210.38 126932 199.87 90322 151.00
Pulses
COUNTRY
2011-12 2012-13 2013-14 2014-15(Apr-Sep)
Quantity Value Quantity Value Quantity Value Quantity Value
CANADA 1468145 3057.55 1107459 3000.98 1504717 4603.73 902727 2751.07
MYANMAR 859880 3252.71 963649 3540.89 667148 2768.22 428079 2257.64
AUSTRALIA 299056 854.86 721044 2651.36 342216 1153.87 150627 551.39
U S A 111979 275.77 178275 555.61 195846 673.22 123282 416.46
RUSSIA 272544 574.46 324858 920.11 215619 546.49 61357 164.61
OTHER COUNTRIES 484241 1433.01 717951 2675.69 252337 1291.23 130945 726.89
Grand Total 3495845 9448.35 4013236 13344.63 3177883 11036.75 1797017 6868.07
Sugar
COUNTRY
2011-12 2012-13 2013-14 2014-15(Apr-Sep)
Quantity Value Quantity Value Quantity Value Quantity Value
BRAZIL 98523 302.46 1108215 3041.76 866841 2231.20 933009 2319.56
PAKISTAN 12802 36.61 13127 35.58
U S A 282 4.28 258 5.47 215 5.42 115 2.75
GERMANY 89 1.65 159 3.50 137 4.24 193 6.48
ITALY 1 0.06 1 0.08 63 2.87 49 2.20
OTHER COUNTRIES 830 5.38 824 6.95 575 7.55 465 5.28
Grand Total 99725 313.83 1122259 3094.38 880958 2286.86 933831 2336.26
Source: DGCI&S
**********

GOVERNMENT OF INDIA
MINISTRY OF COMMERCE & INDUSTRY
(DEPARTMENT OF COMMERCE)
LOK SABHA UNSTARRED QUESTION NO. 1013
TO BE ANSWERED ON 28TH NOVEMBER, 2014
DGTR
1013. SHRI FEROZE VARUN GANDHI:
Will the Minister of COMMERCE & INDUSTRY ( ´ÉÉÉÊhÉVªÉ A´ÉÆ =tÉÉäMÉ àÉÆjÉÉÒ ) be
pleased to state:
a) whether the setting up of a Directorate General of Trade Remedies (DGTR) has
provided a level playing field to the industry and exporters, enabling them to
effectively compete against the imported goods in the domestic market; and
b) if so, the details thereof?
ANSWER
वा�ण� य एवं उ�योग रा� य मं�ी ( �वतनतर �भार) )�ीमती �नम�ला सीतारमण (
THE MINISTER OF STATE IN THE MINISTRY OF COMMERCE AND INDUSTRY
(INDEPENDENT CHARGE)
(SMT. NIRMALA SITHARAMAN)
(a) and (b) : Directorate General of Trade Remedies (DGTR) is yet to be constituted.
Directorate General of Anti-Dumping & Allied Duties (DGAD) (to be re-designated as
DGTR when full staff strength is provided) conducts anti-dumping and anti-subsidy
investigations on the basis of duly substantiated petitions filed by domestic industries, and
recommends imposition of duty, wherever appropriate, to the Department of Revenue.
DGAD has recommended imposition of anti-dumping duty on 249 products since 1992,
against 46 number of countries.
The basic intent of the anti-dumping and countervailing (anti-subsidy) measures is to
eliminate injury caused to the domestic industry by the unfair trade practices of dumping
and subsidization and to create a level playing field for the domestic industries by re-
establishing a situation of open and fair competition in the Indian market.
*****

GOVERNMENT OF INDIA MINISTRY OF COMMERCE & INDUSTRY
(DEPARTMENT OF COMMERCE)
LOK SABHA UNSTARRED QUESTION NO. 1024
TO BE ANSWERED ON 28TH NOVEMBER, 2014
EXPORT/IMPORT OF MEAT AND MEAT PRODUCTS
1024. SHRI P.R. SUNDARAM: DR. NEPAL SINGH:
Will the Minister of COMMERCE & INDUSTRY ( ´ÉÉÉÊhÉVªÉ A´ÉÆ =tÉÉäMÉ àÉÆjÉÉÒ ) be
pleased to state:
a) the quantity and value of meat and meat products exported and imported during
each of the last three years and the current year, product and country-wise;
b) the registered meat exporters/ companies in the country, State/UT-wise;
c) the financial assistance or subsidy provided to the registered meat exporters by the
Government during the said period, State/UT-wise;
d) the other facilities/incentives provided by the Government to boost export of meat
and to ensure compliance of the prescribed norms by the exporters for the purpose;
e) whether there has been demand from various States and other quarters to impose
ban/restrictions on export of meat and meat products from the country; and
f) if so, the details thereof along with the reaction of the Government thereto?
ANSWER
वा�ण� य एवं उ�योग रा� य मं�ी ( �वतनतर �भार) )�ीमती �नम�ला सीतारमण (
THE MINISTER OF STATE IN THE MINISTRY OF COMMERCE AND INDUSTRY
(INDEPENDENT CHARGE)
(SMT. NIRMALA SITHARAMAN)
(a) The quantity and value of meat and meat products exported and imported during each of the last three years and the current year, product and country-wise are given below:
(i) EXPORT OF MEAT AND MEAT PRODUCTS: Quantity in MT/Value in Rs.Crore
ITEM 2011-12 2012-13 2013-14
2014-15 (APR TO SEP)*
QTY VAL QTY VAL QTY VAL QTY VAL
BUFFALO MEAT 984966 13741.11 1076100 17409.00 1365632 26457.82 689843 13488.30
OTHER MEAT 318 3.67 193 2.33 269 3.40 575 1.14 PROCESSED MEAT 576 9.50 796 9.37 507 7.68 90 2.56 SHEEP/ GOAT MEAT 10942 252.83 15286 426.47 22610 69412.00 13047 453.33
Grand Total 996802 14007.11 1092375 17847.17 1389018 27163.01 703555 13945.34 Source: DGCI&S *Provisional

(ii) IMPORT OF MEAT AND MEAT PRODUCTS: Quantity in MT/Value in Rs.Crore
ITEM 2011-12 2012-13 2013-14
2014-15 (APR TO SEP)*
QTY
VAL QTY
VAL
QTY
VAL QTY
VAL
PROCESSED MEAT 960 9.74 568 9.02 387 7.64 104 3.21 SHEEP/ GOAT MEAT 5 0.22 20 1.52 59 5.13 52 5.12
OTHER MEAT 544 12.47 427 15.71 360 15.80 250 10.23
Grand Total 1509 22.43 1015 26.25 806 28.57 406 18.56 Source: DGCI&S *Provisional
(iii) COUNTRY-WISE EXPORT OF MEAT & MEAT PRODUCTS:
Value in Rs.Crore
COUNTRY 2011-12 2012-13 2013-14 2014-15(APR TO SEP)*
VIETNAM SOC REP 4051.77 5129.19 10976.18 5875.27
MALAYSIA 1404.13 1943.71 2356.42 1241.49
EGYPT A RP 1143.20 1257.20 2033.33 1457.99
THAILAND 443.80 1448.35 1790.42 810.08
SAUDI ARAB 1079.45 1301.22 1691.79 892.89
Others 5884.76 6767.49 8314.88 3667.62
Total 14007.11 17847.17 27163.01 13945.34 Source: DGCI&S *Provisional
(iv) COUNTRY-WISE IMPORT OF MEAT & MEAT PRODUCTS: Value in Rs.Crore
COUNTRY 2011-12 2012-13 2013-14 2014-15
(APR TO SEP)*
SRI LANKA DSR 10.46 8.53 8.84 4.00
AUSTRALIA - 1.35 4.15 2.46
BELGIUM 1.29 4.31 4.01 3.60
NETHERLAND 5.59 3.81 3.79 1.53
ITALY 1.31 3.90 3.10 1.82
Others 3.78 4.36 4.68 5.15
Total 22.43 26.25 28.58 18.56 Source: DGCI&S *Provisional
(b) State-wise APEDA approved registered meat abattoirs and Meat
Processing Plants are given below:
State Nos. of abattoirs-cum-meat processing plants /standalone abattoirs
Nos. of Meat Processing Plants
U.P. 32 24 Maharashtra 9 5 Punjab 4 - Telengana 3 - Kerala 2 - Haryana 1 1 Nagaland 1 - Chennai 1 1 West Bengal 1 - Bihar 1 - New Delhi - 1 Karnataka - 1 Rajasthan - 1

(c) APEDA, an autonomous organization under the Department of Commerce,
provides financial assistance/subsidy to the registered meat exporters
under the Agriculture Promotion Plan Scheme under components like
specialised transport vehicle for meat products, in house laboratory and
HACCP implementation for meat products and transport assistance for
meat products. The financial assistance/ subsidy provided by APEDA under
the above Plan scheme during the last three years is as under:-
(Rs. in crores)
2011-12 2012-13 2013-14
28.17 18.91 18.16
Source: APEDA
The financial assistance or subsidy provided to the registered meat
exporters are not maintained state-wise. The transport assistance component for
export of meat products has been discontinued since 01.01.2014
(d) In addition to the above, the Government has taken following steps to promote the export of scheduled products including meat and meat products:-
(i) APEDA acts as facilitating body for helping exporters to overcome
various trade related issues, particularly exports.
(ii) APEDA regularly disseminates information of various trade related aspects to the exporters.
(iii) Participation in international trade fairs to promote Indian meat
products.
(e) & (f): No, Madam. There has been no demand from any State to impose ban
/restrictions on export of meat and meat products in the recent past. However,
representations are being received from time to time from some religious/social
organisations demanding ban on export of meat and its products. The existing
export policy is in the interest of the farmers, livestock producers, meat
consumers, traders, stake holders and stake holders of other sectors such as
dairy, leather, animal feed etc.
*****

GOVERNMENT OF INDIA MINISTRY OF COMMERCE & INDUSTRY
(DEPARTMENT OF COMMERCE)
LOK SABHA UNSTARRED QUESTION NO. 1028
TO BE ANSWERED ON 28TH NOVEMBER, 2014
INDO-US TRADE AGREEMENTS
1028. SHRI C.N. JAYADEVEN: SHRI SANJAY HARIBHAU JADHAV: SHRI M. RAJA MOHAN REDDY: SHRI R. DHRUVA NARAYANA: SHRI RAVNEET SINGH
Will the Minister of COMMERCE & INDUSTRY ( ´ÉÉÉÊhÉVªÉ A´ÉÆ =tÉÉäMÉ àÉÆjÉÉÒ ) be
pleased to state:
a) whether any Indian delegation has recently visited the United States (US) to hold
consultation and make agreements relating to bilateral trade;
b) if so, the details thereof indicating the consultations held and agreements signed in
this regard during the said visit;
c) whether any decision was taken to form a Trade Policy Forum (TPF) to discuss
trade and investment issues between the two countries; and
d) if so, the details thereof along with the progress made in this regard?
ANSWER
वा�ण� य एवं उ�योग रा� य मं�ी ( �वतनतर �भार) )�ीमती �नम�ला सीतारमण (
THE MINISTER OF STATE IN THE MINISTRY OF COMMERCE AND INDUSTRY
(INDEPENDENT CHARGE)
(SMT. NIRMALA SITHARAMAN)
(a)&(b): No, Madam. No Indian delegation from Department of Commerce has recently
visited the United States to hold consultations and make agreements relating to
bilateral trade.
(c)&(d): India-US TPF is already in existence since the time it was first established in
July, 2005. The Indo-US TPF is designed to enhance bilateral trade and
investment relations between India and the United States.
The 8th
Ministerial Meeting of the TPF was recently held in New Delhi on
25th
November, 2014. During the meeting a range of issues including Market
Access for identified products, market access for pharmaceutical & traditional
medicines and pharmacopeia besides Totalisation Agreement and US
Immigration Reforms were discussed.
**************************

GOVERNMENT OF INDIA MINISTRY OF COMMERCE & INDUSTRY
(DEPARTMENT OF COMMERCE)
LOK SABHA UNSTARRED QUESTION NO. 1043
TO BE ANSWERED ON 28TH NOVEMBER, 2014
EXPORT AND IMPORT OF SPICES
1043(H). SHRI M.I. SHANAVAS: SHRI ANTO ANTONY:
Will the Minister of COMMERCE & INDUSTRY ( ´ÉÉÉÊhÉVªÉ A´ÉÆ =tÉÉäMÉ àÉÆjÉÉÒ ) be
pleased to state:
a) the quantum and value of export and import of different spices during each of the
last three years and the current year, item and country-wise;
b) the share of India in world's total export along with share of various states therein;
c) whether a huge influx of spices particularly cardamom from foreign countries to
Indian markets has resulted in fall in price of Indian spices, particularly cardamom;
d) if so, the details thereof along with the remedial steps taken by the Government in
this regard; and
e) the measures taken/being taken by the Government to boost export of spices
including pepper and cardamom and indicating the support provided to their
growers for adopting/following organic cultivation and planting methods?
ANSWER
वा�ण� य एवं उ�योग रा� य मं�ी ( �वतनतर �भार) )�ीमती �नम�ला सीतारमण (
THE MINISTER OF STATE IN THE MINISTRY OF COMMERCE AND INDUSTRY
(INDEPENDENT CHARGE)
(SMT. NIRMALA SITHARAMAN) (a) : The item-wise export and import of spices for the last three years and current year up to
September 2014 are given in Annexures I & II respectively. Details of country wise export and
import details of spices are given in Annexures III & IV respectively.
(b): Export of spices from India accounts for 48% in volume and 43% in value of the global spice
trade. Share of states in export is not compiled as spices from various states are transported to
major market centers across the country and exported through the ports.
(c) & (d): Details of production and import of spices including Cardamom and the average
domestic price of Cardamom and the imported Cardamom are given at Annexure-V. Compared
with domestic production, the import of spices including cardamom is small and has not had a
significant impact on domestic prices. The government has taken measures to prevent inflow of
cardamom through illegal means by alerting the custom authorities.
(e): Spices Board implements various export development and promotional activities and assists
the producers and exporters for increasing the export of spices and spice products from the country.
High-end value addition in spices is encouraged through upgradation of quality and providing
infrastructural facilities through spices parks and laboratories. The Spices Board provides financial
assistance to farmers for organic farm certification, support for setting up organic farm input units
and organic cultivation of spices with a view to promote organic production of spices.
********

Annexure-I
ITEM-WISE EXPORT OF SPICES FROM INDIA
ITEM-WISE EXPORT OF SPICES FROM INDIA (QTY. IN TONNES & VALUE IN Rs. LAKHS)
2011-12 2012-13(P) 2013-14(Est) 2014-15(APR- SEPT)
ITEM QTY VALUE QTY VALUE QTY VALUE QTY VALUE
PEPPER 26,700 87,813.45 15,363 63,810.29 21,250 94,002.34 10,100 51,486.00
CARDAMOM(S) 4,650 36,322.28 2,372 21,215.04 3,600 28,380.88 1,295 10,806.75
CARDAMOM(L) 935 6,830.00 1,217 6,254.59 1,110 7,961.15 215 2,826.40
CHILLI 241,000 214,408.00 301,000 238,060.90 312,500 272,227.20 161,000 154,730.00
GINGER 21,550 20,420.02 22,207 18,725.14 23,300 25,614.27 8,300 10,273.00
TURMERIC 79,500 73,434.40 88,513 55,487.70 77,500 66,675.85 43,000 34,455.00
CORIANDER 28,100 16,401.85 35,902 20,182.59 45,750 37,185.65 23,000 24,005.00
CUMIN 45,500 64,442.05 85,602 115,306.61 121,500 160,006.00 87,500 97,750.00
CELERY 3,650 2,340.05 5,171 2,977.26 5,600 3,661.48 3,050 2,160.00
FENNEL 8,100 7,209.20 13,811 10,466.12 17,300 16,001.42 6,450 6,980.50
FENUGREEK 21,800 7,275.20 29,622 10,488.12 35,575 13,378.37 10,950 5,691.50
OTHER SEEDS (1) 13,050 5,881.25 18,442 11,178.60 27,800 15,425.65 12,000 6,755.00
GARLIC 2,200 1,415.70 22,872 6,868.14 25,650 8,387.05 5,810 2,427.00
NUTMEG & MACE 3,620 24,097.51 3,231 22,591.87 4,450 26,285.62 1,525 8,980.00
OTHER SPICES (2) 35,900 32,033.00 34,298 30,209.03 34,700 41,846.80 17,000 22,070.00
CURRY POWDER/PASTE
17,000 25,208.25 17,436 27,515.66 23,750 40,132.03 11,150 20,820.00
MINT PRODUCTS (3) 14,750 222,372.00 20,039 394,049.95 24,500 343,042.20 13,300 146,325.00
SPICE OILS & OLEORESINS
7,265 130,438.28 9,515 155,888.19 11,415 173,324.85 5,925 87,745.00
TOTAL 575,270 978,342.48 726,613 1,211,275.80 817,250 1,373,539.26 421,570 696,286.15
VALUE IN MILLION US $
2,037.76 2,212.13
2,267.67 1152.08
(1) INCLUDE BISHOPS WEED(AJWANSEED), DILL SEED, POPPY SEED, ANISEED, MUSTARD ETC. (2) INCLUDE ASAFOETIDA, CINNAMON, CASSIA, CAMBODGE, SAFFRON, SPICES (NES) ETC.
(3) INCLUDE MENTHOL, MENTHOL CRYSTALS AND MINT OILS. SOURCE : DGCI&S., CALCUTTA/SHIPPING BILLS/EXPORTERS' RETURNS.

Annexure-II
ITEM-WISE IMPORT OF SPICES INTO INDIA
ITEM-WISE IMPORT OF SPICES INTO INDIA (QTY. IN TONNES & VALUE IN Rs. LAKHS)
2011-12 2012-13(P) 2013-14(E) 2014-15 ( APR-
SEPT)
SPICES QTY VALUE QTY VALUE QTY VALUE QTY VALUE
PEPPER (1) 17,565 53339.88 15,600 56944.18 15,680 61620.37 11,950 58,097.50
CARDAMOM(SMALL) 51 361.71 495 1612.44 1,110 3165.00 925 2,295.55
CARDAMOM(LARGE) 2,330 10390.00 3,895 14558.80 3,705 21406.20 400 2,130.00
CHILLI / PAPRIKA 1,740 2133.93 1,225 940.22 580 1034.73 0 0.00
GINGER FRESH / DRY 16,920 4739.26 57,090 10409.89 36,400 10177.90 7,950 5,355.00
TURMERIC 2,325 3060.52 2,495 2173.89 7,350 5931.55 4,950 4,557.00
CORIANDER 3,775 2722.76 4,470 3526.04 4,640 5177.10 700 771.00
CUMIN BLACK / WHITE 665 839.31 120 165.36 570 923.40 0 0.00
MUSTARD SEED 345 92.38 55 12.84 200 99.20 130 55.50
POPPY SEED 24,075 26847.93 11,630 23221.50 14,800 30487.55 8,500 17,135.00
GARLIC 310 220.05 95 105.30 80 99.00 0 0.00
CLOVE 12,175 44081.58 10,105 45188.27 10,900 55496.35 5,050 21,333.50
NUTMEG 735 3173.17 720 3575.04 800 3941.11 190 1,141.00
MACE 280 3466.66 567 4937.27 700 6283.74 205 1,461.50
CASSIA 15,655 9169.33 12,180 8225.59 18,200 13066.45 10,050 9,730.00
STAR ANISE 2,850 4725.10 4,695 7482.40 2,695 4733.15 1,600 2,878.00
OTHER SPICES (2) 7,760 15604.24 4,960 7848.88 9,450 34453.60 4,950 14,940.00
OILS &OLEORESINS (3) 1,580 24479.94 1,325 19303.95 2,150 32417.36 975 16,462.75
TOTAL 111,136 209,447.75 131,722 210,231.86 130,010 290,513.76 58,525 158,343.30
VALUE IN MILLION US $ 445.18 387.90 481.86 264.23
'(P): Provisional (E): Estimate
Import figures for the current year are only quick estimates and subject to revision

(1) INCLUDE WHITE PEPPER, LIGHT PEPPER AND BLACK PEPPER
(2) INCLUDE ANISEED, ASAFOETIDA, CINNAMON, PEPPER LONG, CAMBODGE, HERABAL SPICES AND SPICES NES.
(3) INCLUDE SPICES OILS & OLEORESINS AND MINT PRODUCTS.

Annexure-III
MAJOR COUNTRY-WISE EXPORT OF TOTAL SPICES FROM INDIA
2011-12 2012-13(P) 2013-14(E)
COUNTRY QTY (MT)
VALUE (LAKHS)
QTY (MT)
VALUE (LAKHS) QTY (MT) VALUE (LAKHS)
U.S.A 46046 160543.54 71087 211572.30 71038 235237.87
CHINA 21015 86806.23 25751 201791.56 21571 162896.85
VIETNAM 15929 27712.34 60908 63595.26 84214 106805.69
MALAYSIA 54953 54327.91 64947 49387.73 62796 62951.67
U.A.E 60946 58822.55 57238 47713.42 58932 58007.78
U.K 16511 40106.38 22101 46650.93 23192 54053.57
GERMANY 6427 36795.46 7125 39575.25 8148 38260.15
SINGAPORE 8553 35615.31 7927 36673.94 8362 24576.20
SAUDI ARABIA 21922 42708.93 22351 35594.83 25812 35637.61
THAILAND 13628 15299.43 38303 31870.42 5662 10401.55
NETHERLANDS 5976 26073.27 6586 29694.38 7778 32957.83
SRI LANKA 51035 35598.98 48528 28743.88 58428 39140.34
MEXICO 7641 12075.38 15383 22226.93 12602 18742.84
BANGLADESH 35131 25171.38 34193 21381.62 18969 13308.32
NEPAL 7238 3123.61 26047 18799.07 21525 14397.91
BRAZIL 5508 15767.53 6661 18470.33 8193 15704.82
INDONESIA 26168 22231.87 22237 18331.33 73267 72699.34
PAKISTAN 34891 30616.61 20671 18008.88 7573 9573.46
JAPAN 7155 23873.08 6628 17772.70 6754 21289.80
FRANCE 3232 10524.19 3890 17568.66 3875 14168.04
EGYPT(A.R.E) 11532 10431.36 20911 17554.56 18814 17746.78
SPAIN 5815 11110.38 11031 17328.58 12756 22918.41
SOUTH AFRICA 9787 16305.71 12058 15806.99 11792 17112.33
AUSTRALIA 4686 11545.42 5448 11652.26 5547 12848.33
OTHERS 93546 165155.63 108603 173509.99 179650 262101.74
TOTAL 575270 978342.48 726613 1211275.80 817250 1373539.25
VALUE IN MLNUS$ 2037.76 2212.13 2267.67
Note: The country wise figures are compiled after completion of the financial year.
(P) Provisional (E): Estimate
Source : DGCI&S Kolkata/Exporters returns/DLE from customs
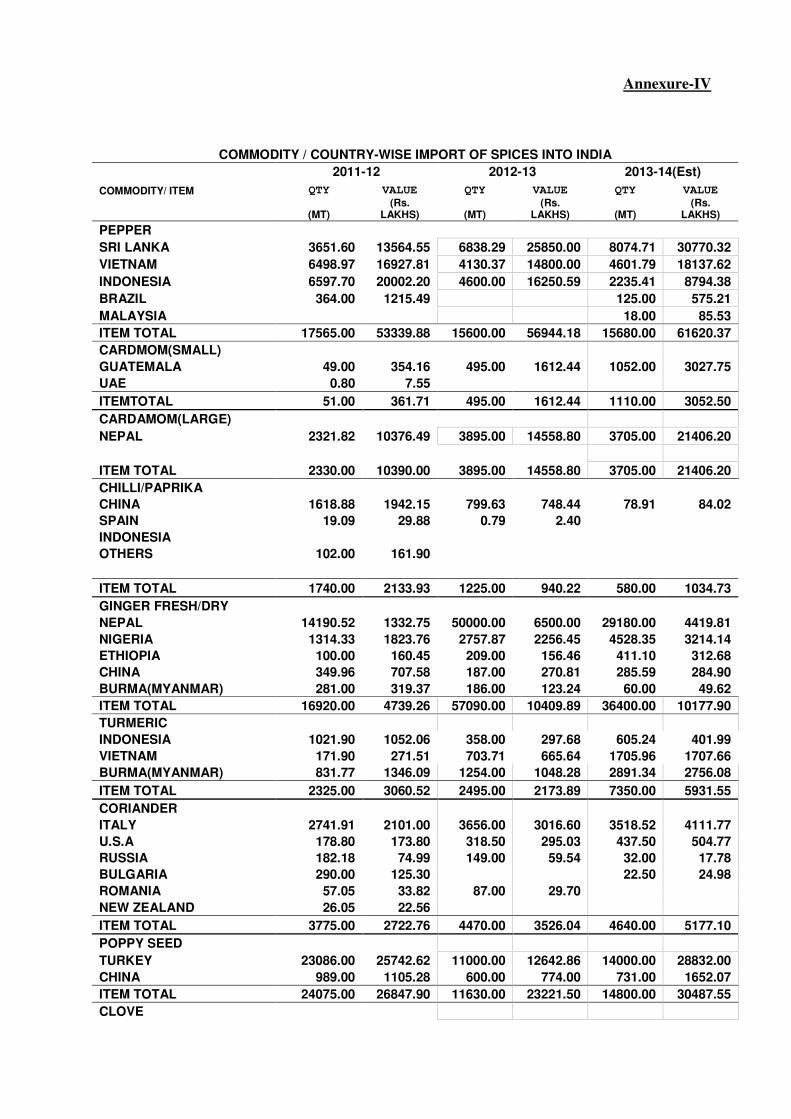
Annexure-IV
COMMODITY / COUNTRY-WISE IMPORT OF SPICES INTO INDIA
2011-12 2012-13 2013-14(Est)
COMMODITY/ ITEM QTY VALUE QTY VALUE QTY VALUE
(MT) (Rs.
LAKHS) (MT) (Rs.
LAKHS) (MT) (Rs.
LAKHS)
PEPPER SRI LANKA 3651.60 13564.55 6838.29 25850.00 8074.71 30770.32
VIETNAM 6498.97 16927.81 4130.37 14800.00 4601.79 18137.62
INDONESIA 6597.70 20002.20 4600.00 16250.59 2235.41 8794.38
BRAZIL 364.00 1215.49 125.00 575.21
MALAYSIA
18.00 85.53
ITEM TOTAL 17565.00 53339.88 15600.00 56944.18 15680.00 61620.37
CARDMOM(SMALL)
GUATEMALA 49.00 354.16 495.00 1612.44 1052.00 3027.75
UAE 0.80 7.55
ITEMTOTAL 51.00 361.71 495.00 1612.44 1110.00 3052.50
CARDAMOM(LARGE)
NEPAL 2321.82 10376.49 3895.00 14558.80 3705.00 21406.20
ITEM TOTAL 2330.00 10390.00 3895.00 14558.80 3705.00 21406.20
CHILLI/PAPRIKA CHINA 1618.88 1942.15 799.63 748.44 78.91 84.02
SPAIN 19.09 29.88 0.79 2.40 INDONESIA
OTHERS 102.00 161.90
ITEM TOTAL 1740.00 2133.93 1225.00 940.22 580.00 1034.73
GINGER FRESH/DRY NEPAL 14190.52 1332.75 50000.00 6500.00 29180.00 4419.81
NIGERIA 1314.33 1823.76 2757.87 2256.45 4528.35 3214.14
ETHIOPIA 100.00 160.45 209.00 156.46 411.10 312.68
CHINA 349.96 707.58 187.00 270.81 285.59 284.90
BURMA(MYANMAR) 281.00 319.37 186.00 123.24 60.00 49.62
ITEM TOTAL 16920.00 4739.26 57090.00 10409.89 36400.00 10177.90
TURMERIC
INDONESIA 1021.90 1052.06 358.00 297.68 605.24 401.99
VIETNAM 171.90 271.51 703.71 665.64 1705.96 1707.66
BURMA(MYANMAR) 831.77 1346.09 1254.00 1048.28 2891.34 2756.08
ITEM TOTAL 2325.00 3060.52 2495.00 2173.89 7350.00 5931.55
CORIANDER
ITALY 2741.91 2101.00 3656.00 3016.60 3518.52 4111.77
U.S.A 178.80 173.80 318.50 295.03 437.50 504.77
RUSSIA 182.18 74.99 149.00 59.54 32.00 17.78
BULGARIA 290.00 125.30 22.50 24.98
ROMANIA 57.05 33.82 87.00 29.70
NEW ZEALAND 26.05 22.56
ITEM TOTAL 3775.00 2722.76 4470.00 3526.04 4640.00 5177.10
POPPY SEED
TURKEY 23086.00 25742.62 11000.00 12642.86 14000.00 28832.00
CHINA 989.00 1105.28 600.00 774.00 731.00 1652.07
ITEM TOTAL 24075.00 26847.90 11630.00 23221.50 14800.00 30487.55
CLOVE

TANZANIA 1555.60 8128.37 1959.80 10659.88 3526.64 23513.32
MADAGASCAR 5568.38 21175.60 4655.17 18579.21 3168.40 14569.44
SRI LANKA 1976.00 8691.98 2252.27 13033.93 2401.21 13725.27
INDONESIA 1691.88 1939.47 1012.42 1078.02 795.20 871.20
ITEM TOTAL 10791.86 39935.42 10105.00 45188.27 10900.00 55496.35
NUTMEG
SRI LANKA 514.17 2264.40 525.08 2352.30 261.77 1500.00
INDONESIA 214.10 880.00 173.00 1084.77 296.69 2011.00
SINGAPORE
ITEM TOTAL 734.47 3173.17 720.00 3575.04 800.00 3941.11
MACE
INDONESIA 111.65 1076.38 425.72 3291.13 296.69 2399.75
SRI LANKA 159.15 2286.14 141.00 1641.17 292.17 3057.96
SINGAPORE
ITEM TOTAL 280.00 3466.66 567.00 4937.27 700.00 6283.74
CASSIA
VIETNAM 10056.68 6182.90 10000.00 7000.00 13826.39 10602.55
CHINA 4351.99 2253.39 2180.00 1200.00 4000.00 2360.00
ITEM TOTAL 14408.67 8436.29 12180.00 8225.59 18200.00 13066.45
STAR ANISE
VIETNAM 1878.45 3186.00 4533.23 7143.13 2500.00 4500.00
CHINA 902.02 1440.59 140.00 250.63 20.40 15.54
HONGKONG 58.00 86.76
ITEM TOTAL 2850.00 4725.10 4695.00 7482.40 2695.00 4733.15
SPICE OILS & OLERNES
CHINA 1116.03 18757.40 863.89 15149.03 1476.09 25276.38
MADAGASCAR 58.00 472.92 20.00 141.89 240.50 2186.29
SRI LANKA 41.62 1551.25 130.10 1131.55 110.28 1880.00
U.S.A 40.77 399.09 47.16 741.37 94.08 1007.37
INDONESIA 213.61 2015.85 160.29 1000.32 56.63 620.45
RUSSIA 5.24 172.86 8.59 250.21 6.14 307.75
FRANCE 19.45 80.00 14.45 117.45 11.31 140.23
SINGAPORE 14.91 149.99 27.47 218.29 1.50 17.68
MEXICO 9.00 189.56 7.00 140.40 4.01 13.71
ITEM TOTAL 1580.00 24479.94 1325.00 19303.95 2150.00 32417.56
GRAND TOTAL 111136.00 209447.75 131722.00 210231.86 130010.00 290513.76
(Est) : Estimate
Source : DGCI&S Kolkata/DLI from customs

Annexure-V
PRODUCTION AND IMPORT OF SPICES INTO INDIA
YEAR
TOTAL PRODUCTION
(MT)
TOTAL IMPORT
(MT)
PRODN. OF CARDAMOM
(MT)
IMPORT OF CARDAMOM
(MT)
2011-12 6324920 111136 15000 51
2012-13 5801114 131722 14000 495
2013-14 5833870 130010 14795 1110
2014-15 (*) NA 58525 16000 925
Note: Total production figures for 2014-15 are available after the current crop season
Cardamom : Preliminary estimates.
Import : Figures - April - September.
Average Domestic Price of the Cardamom and Average Import
Price of Cardamom
***************************
Year Avg. Domestic Price of
Cardamom (Rs/Kg)
Average Import price of Cardamom (Rs/Kg)
2011-12 645.62 709.24
2012-13 686.89 325.75
2013-14 649.2 285.14
2014-15 (Aug- Oct) 767.84 248.17
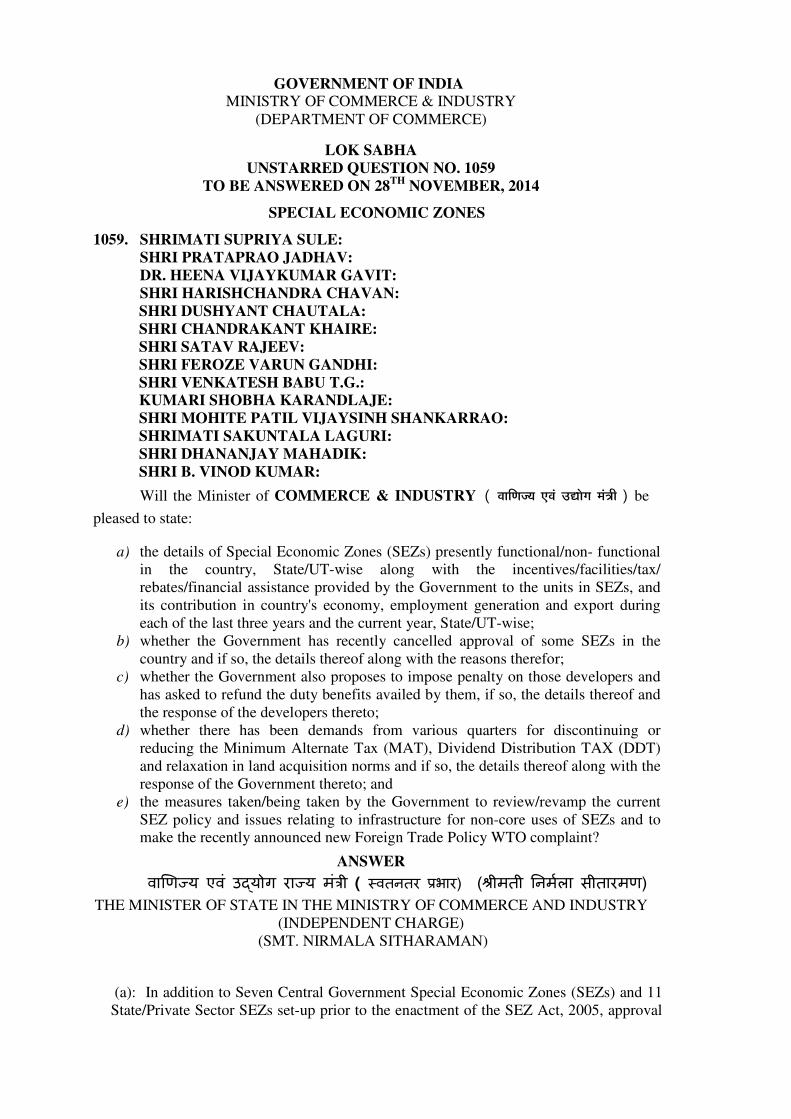
GOVERNMENT OF INDIA MINISTRY OF COMMERCE & INDUSTRY
(DEPARTMENT OF COMMERCE)
LOK SABHA UNSTARRED QUESTION NO. 1059
TO BE ANSWERED ON 28TH NOVEMBER, 2014
SPECIAL ECONOMIC ZONES
1059. SHRIMATI SUPRIYA SULE: SHRI PRATAPRAO JADHAV: DR. HEENA VIJAYKUMAR GAVIT: SHRI HARISHCHANDRA CHAVAN: SHRI DUSHYANT CHAUTALA: SHRI CHANDRAKANT KHAIRE: SHRI SATAV RAJEEV: SHRI FEROZE VARUN GANDHI: SHRI VENKATESH BABU T.G.: KUMARI SHOBHA KARANDLAJE: SHRI MOHITE PATIL VIJAYSINH SHANKARRAO: SHRIMATI SAKUNTALA LAGURI: SHRI DHANANJAY MAHADIK: SHRI B. VINOD KUMAR:
Will the Minister of COMMERCE & INDUSTRY ( ´ÉÉÉÊhÉVªÉ A´ÉÆ =tÉÉäMÉ àÉÆjÉÉÒ ) be
pleased to state:
a) the details of Special Economic Zones (SEZs) presently functional/non- functional
in the country, State/UT-wise along with the incentives/facilities/tax/
rebates/financial assistance provided by the Government to the units in SEZs, and
its contribution in country's economy, employment generation and export during
each of the last three years and the current year, State/UT-wise;
b) whether the Government has recently cancelled approval of some SEZs in the
country and if so, the details thereof along with the reasons therefor;
c) whether the Government also proposes to impose penalty on those developers and
has asked to refund the duty benefits availed by them, if so, the details thereof and
the response of the developers thereto;
d) whether there has been demands from various quarters for discontinuing or
reducing the Minimum Alternate Tax (MAT), Dividend Distribution TAX (DDT)
and relaxation in land acquisition norms and if so, the details thereof along with the
response of the Government thereto; and
e) the measures taken/being taken by the Government to review/revamp the current
SEZ policy and issues relating to infrastructure for non-core uses of SEZs and to
make the recently announced new Foreign Trade Policy WTO complaint?
ANSWER
वा�ण� य एवं उ�योग रा� य मं�ी ( �वतनतर �भार) )�ीमती �नम�ला सीतारमण (
THE MINISTER OF STATE IN THE MINISTRY OF COMMERCE AND INDUSTRY
(INDEPENDENT CHARGE)
(SMT. NIRMALA SITHARAMAN)
(a): In addition to Seven Central Government Special Economic Zones (SEZs) and 11
State/Private Sector SEZs set-up prior to the enactment of the SEZ Act, 2005, approval
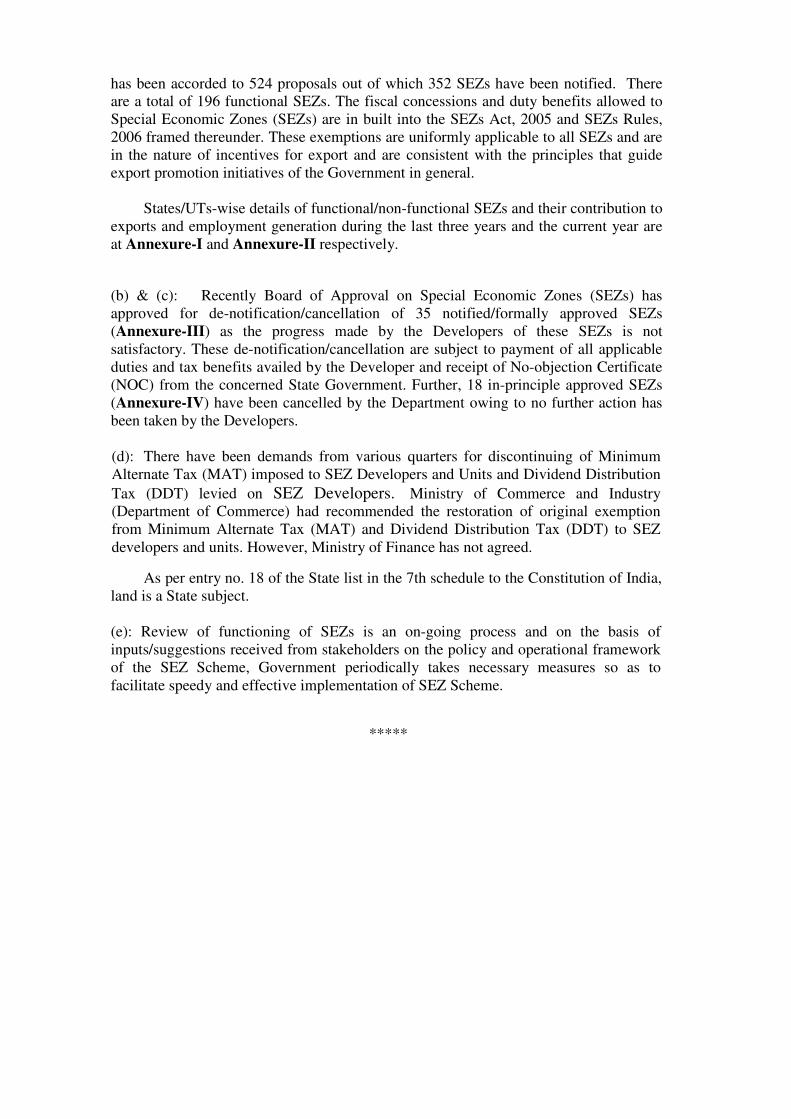
has been accorded to 524 proposals out of which 352 SEZs have been notified. There
are a total of 196 functional SEZs. The fiscal concessions and duty benefits allowed to
Special Economic Zones (SEZs) are in built into the SEZs Act, 2005 and SEZs Rules,
2006 framed thereunder. These exemptions are uniformly applicable to all SEZs and are
in the nature of incentives for export and are consistent with the principles that guide
export promotion initiatives of the Government in general.
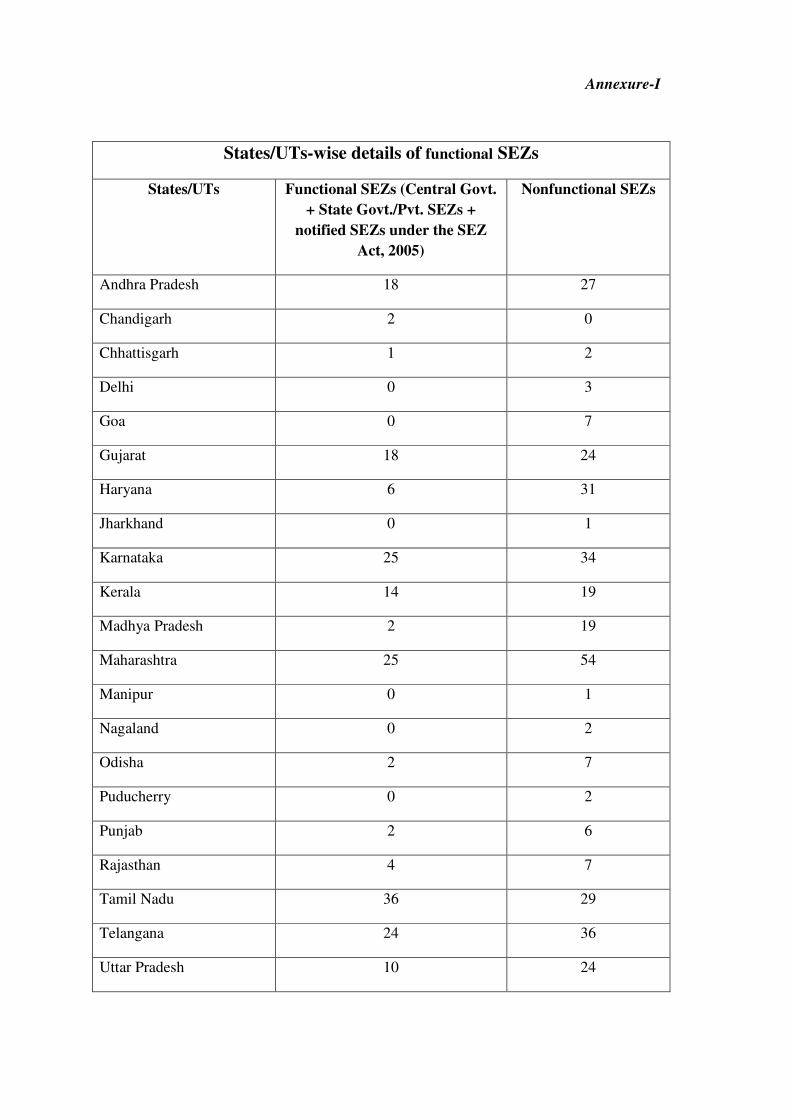
States/UTs-wise details of functional/non-functional SEZs and their contribution to
exports and employment generation during the last three years and the current year are
at Annexure-I and Annexure-II respectively.
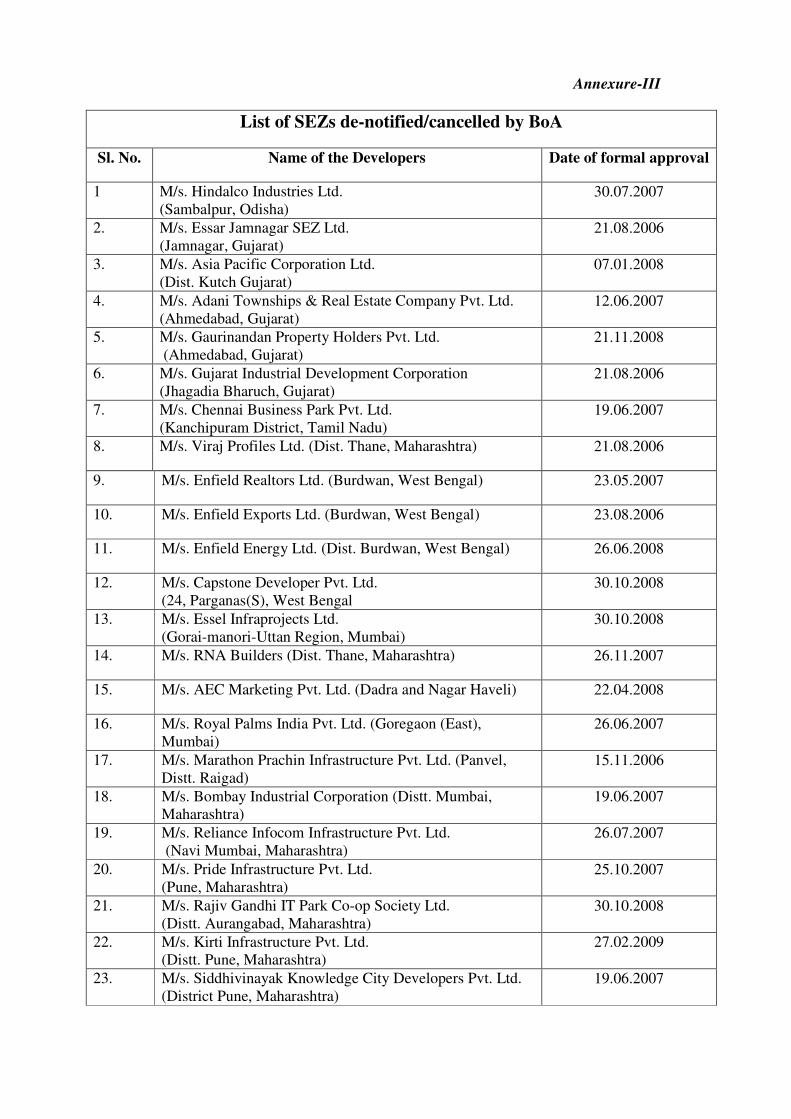
(b) & (c): Recently Board of Approval on Special Economic Zones (SEZs) has
approved for de-notification/cancellation of 35 notified/formally approved SEZs
(Annexure-III) as the progress made by the Developers of these SEZs is not
satisfactory. These de-notification/cancellation are subject to payment of all applicable
duties and tax benefits availed by the Developer and receipt of No-objection Certificate
(NOC) from the concerned State Government. Further, 18 in-principle approved SEZs
(Annexure-IV) have been cancelled by the Department owing to no further action has
been taken by the Developers.
(d): There have been demands from various quarters for discontinuing of Minimum
Alternate Tax (MAT) imposed to SEZ Developers and Units and Dividend Distribution
Tax (DDT) levied on SEZ Developers. Ministry of Commerce and Industry
(Department of Commerce) had recommended the restoration of original exemption
from Minimum Alternate Tax (MAT) and Dividend Distribution Tax (DDT) to SEZ
developers and units. However, Ministry of Finance has not agreed.
As per entry no. 18 of the State list in the 7th schedule to the Constitution of India,
land is a State subject.
(e): Review of functioning of SEZs is an on-going process and on the basis of
inputs/suggestions received from stakeholders on the policy and operational framework
of the SEZ Scheme, Government periodically takes necessary measures so as to
facilitate speedy and effective implementation of SEZ Scheme.
*****
Annexure-I
States/UTs-wise details of functional SEZs
States/UTs Functional SEZs (Central Govt.
+ State Govt./Pvt. SEZs +
notified SEZs under the SEZ
Act, 2005)
Nonfunctional SEZs
Andhra Pradesh 18 27
Chandigarh 2 0
Chhattisgarh 1 2
Delhi 0 3
Goa 0 7
Gujarat 18 24
Haryana 6 31
Jharkhand 0 1
Karnataka 25 34
Kerala 14 19
Madhya Pradesh 2 19
Maharashtra 25 54
Manipur 0 1
Nagaland 0 2
Odisha 2 7
Puducherry 0 2
Punjab 2 6
Rajasthan 4 7
Tamil Nadu 36 29
Telangana 24 36
Uttar Pradesh 10 24
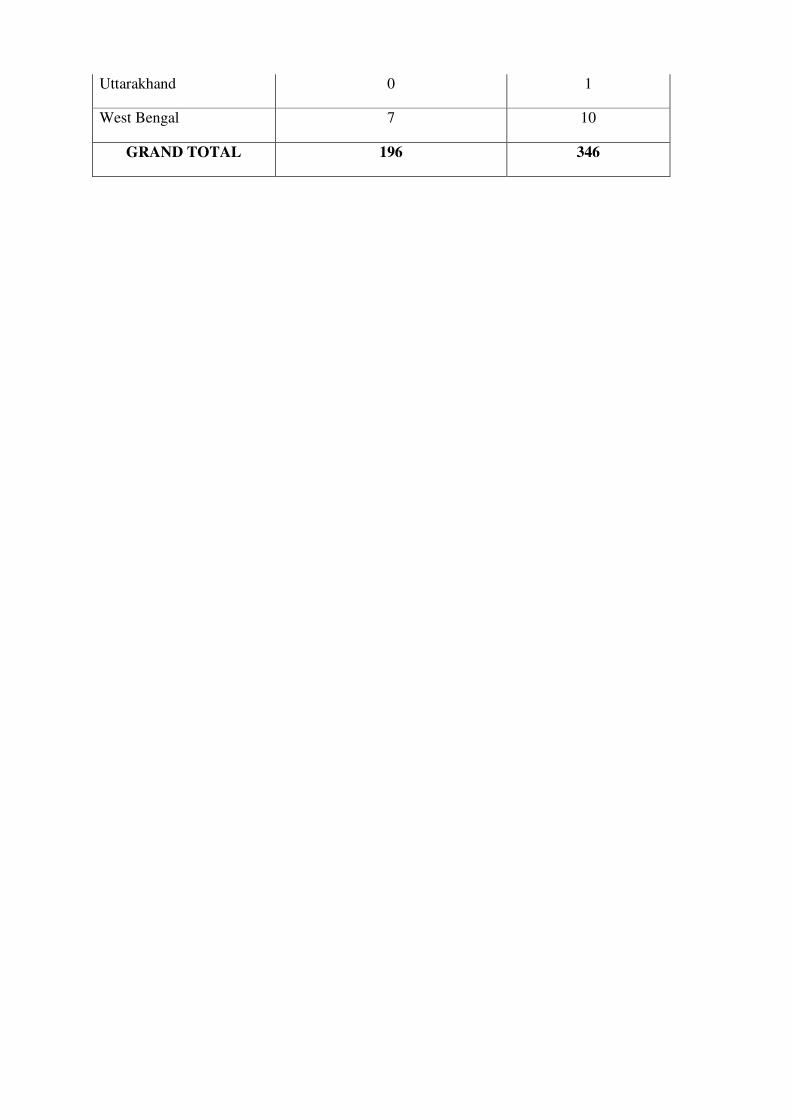
Uttarakhand 0 1
West Bengal 7 10
GRAND TOTAL 196 346

Annexure-II
States/UTs-wise details of contribution of Exports and Employment from SEZs during the
last three years and current financial year
Exports Employment*
(Rs. in Crore) (In Persons)
Sl.
No.
States/UTs 2011-12 2012-13 2013-14 2014-15 (as on
30.9.2014)
2011-
12
2012-13 2013-14 2014-15 (as on
30.9.2014)
1 Gujarat 182414.33 226937.74 225042 107602.42 42097 51190 75586 64356
2 Karnataka 22006.81 39363.94 51372.88 21682.80 85055 141366 193686 206096
3 Tamil Nadu 50152.39 67618 71417 35847.40 219989 237950 268405 288160
4 Maharashtra 24198.83 42962.25 56399.23 26073.40 194469 271134 339919 340061
5 Kerala 31373.3 33824.47 8003.64 2853.77 23799 25701 32311 45581
6 Andhra
Pradesh 18163.8 27687.71 33291.07 3955.01 117266 144346 157280 46024
7 Telangana 0 0 0 16598 0 0 0 128749
8 Uttar Pradesh 13637.38 12591.49 16282.42 7736.87 63637 75101 83970 89684
9 West Bengal 14870.7 15050.7 16204.27 2696.75 36309 55656 48112 49599
10 Haryana 3442.95 4980.75 8740.43 5397.80 29220 38497 50208 54732
11 Madhya
Pradesh 1637.12 1937.16 2984.23 2048.65 12313 12429 10308 10440
12 Rajasthan 1315.69 1498.42 2036.59 1039.78 11028 13163 14574 16254
13 Chandigarh 1103.25 1339.93 1778.15 1024.80 7620 6140 5927 6369
14 Chhattisgarh 0 9.56 1.84 2.96 0 119 119 40
15 Odisha 158.27 217.21 386.09 115.62 1787 1715 1577 2043
16 Punjab 2.91 139.6 136.72 145.52 299 369 1299 1855
17 Goa 0 0 0 0 28 28 28 28
TOTAL 364478 476159 494077 234821 844916 1074904 1283309 1350071
* Calculated on cumulative basis.
Annexure-III
List of SEZs de-notified/cancelled by BoA
Sl. No. Name of the Developers Date of formal approval
1 M/s. Hindalco Industries Ltd.
(Sambalpur, Odisha)
30.07.2007
2. M/s. Essar Jamnagar SEZ Ltd.
(Jamnagar, Gujarat)
21.08.2006
3. M/s. Asia Pacific Corporation Ltd.
(Dist. Kutch Gujarat)
07.01.2008
4. M/s. Adani Townships & Real Estate Company Pvt. Ltd.
(Ahmedabad, Gujarat)
12.06.2007
5. M/s. Gaurinandan Property Holders Pvt. Ltd.
(Ahmedabad, Gujarat)
21.11.2008
6. M/s. Gujarat Industrial Development Corporation
(Jhagadia Bharuch, Gujarat)
21.08.2006
7. M/s. Chennai Business Park Pvt. Ltd.
(Kanchipuram District, Tamil Nadu)
19.06.2007
8. M/s. Viraj Profiles Ltd. (Dist. Thane, Maharashtra) 21.08.2006
9. M/s. Enfield Realtors Ltd. (Burdwan, West Bengal) 23.05.2007
10. M/s. Enfield Exports Ltd. (Burdwan, West Bengal) 23.08.2006
11. M/s. Enfield Energy Ltd. (Dist. Burdwan, West Bengal) 26.06.2008
12. M/s. Capstone Developer Pvt. Ltd.
(24, Parganas(S), West Bengal
30.10.2008
13. M/s. Essel Infraprojects Ltd.
(Gorai-manori-Uttan Region, Mumbai)
30.10.2008
14. M/s. RNA Builders (Dist. Thane, Maharashtra) 26.11.2007
15. M/s. AEC Marketing Pvt. Ltd. (Dadra and Nagar Haveli) 22.04.2008
16. M/s. Royal Palms India Pvt. Ltd. (Goregaon (East),
Mumbai)
26.06.2007
17. M/s. Marathon Prachin Infrastructure Pvt. Ltd. (Panvel,
Distt. Raigad)
15.11.2006
18. M/s. Bombay Industrial Corporation (Distt. Mumbai,
Maharashtra)
19.06.2007
19. M/s. Reliance Infocom Infrastructure Pvt. Ltd.
(Navi Mumbai, Maharashtra)
26.07.2007
20. M/s. Pride Infrastructure Pvt. Ltd.
(Pune, Maharashtra)
25.10.2007
21. M/s. Rajiv Gandhi IT Park Co-op Society Ltd.
(Distt. Aurangabad, Maharashtra)
30.10.2008
22. M/s. Kirti Infrastructure Pvt. Ltd.
(Distt. Pune, Maharashtra)
27.02.2009
23. M/s. Siddhivinayak Knowledge City Developers Pvt. Ltd.
(District Pune, Maharashtra)
19.06.2007

24. M/s. Jindal Photo Limited (Igatpuri Nasik, Maharashtra) 25.06.2007
25. M/s. Dosti Enterprises (Thane, Maharashtra) 18.06.2007
26. M/s. City Parks Pvt. Ltd.(Distt. Pune, Maharashtra) 06.11.2006
27. M/s. Ferrani Hotels Pvt. Ltd. (Malad, Mumbai,
Maharashtra)
30.07.2007
28. M/s. NEPC India Ltd.
(Coimbatore District, Tamil Nadu)
08.05.2008
29. M/s. Best and Crompton Engineering Ltd.
(Kancheepuram District, Tamil Nadu)
26.06.2008
30. M/s. Emaar MGF Land Ltd.
(Comibatore District, Tamil Nadu)
26.02.2009
31. M/s. GVK Perambalur SEZ Pvt. Ltd.
(Perambalur district, Tamil Nadu)
10.02.2009
32. M/s. Kovai Hills Township Pvt. Ltd.
(Coimbatore, Tamil Nadu)
05.12.2007
33. M/s. SAIL Salem SEZ Pvt. Ltd. 26.06.2008
34. M/s. Tamil Nadu Industrial Development Corporation
(TIDCO) (Kancheepuram, Tamil Nadu)
25.06.2007
35. M/s. Anush Infrastructure Pvt. Ltd.
(Kancheepuram Distt., Tamil Nadu)
06.06.2006
*******

Annexure-IV
List of in-principle approved SEZs cancelled
Sl. No. Name of the Developer Location
1.
M/s. Indian Steel Corporation Limited
District Bhuj, Gujarat
2. M/s. Sri Kubera Infracon India Ltd.
Medak District, Andhra Pradesh
3. M/s. Ozone SEZ Developers Pvt. Ltd. Chikkaballapur, Karnataka
4. M/s. Lepakshi Knowledge Hub Private
Limited
Ananthapur District, Andhra Pradesh
5. M/s. Reliable Smartcity Limited
Pachama (Abdullahpur) District, Madhya
Pradesh
6. M/s. RNB Infrastructure Private Limited.
Coimbatore, Tamil Nadu
7. M/s. United Infrastructure Pvt. Ltd.
Indore District, Madhya Pradesh
8. M/s. Tirunelveli Infrastructure Developers
Private Limited.
Tirunelveli District, Tamil Nadu
9. M/s. Industrial Infrastructure Development
Corporation (Gwalior) M.P. Ltd.
Gwalior District, Madhya Pradesh
10. M/s. Chowgule Ports & Infrastructure Pvt.
Limited
District, Ratnagiri, Maharashtra
11. M/s. Videocon Industrial Limited Navi Mumbai Maharashtra
12. M/s. Maharaja Multitrade Private Limited
District Nashik, Maharashtra
13. M/s. Uttam Galva Steels Limited District Raigad, Maharashtra
14. M/s. Maharashtra Airport Development
Company Limited
Nagpur, Maharashtra
15. M/s. Supreme Petrochem Ltd District Raigad, Maharashtra
16. M/s. Plastene Infrastructure Limited Dist. Kutch, Gujarat
17. M/s. LMJ Werehousing Private Limited Kandla Gujarat
18. M/s. Coastal Ferrotech Limited Haldia East Mednipur, West Bengal

**********

GOVERNMENT OF INDIA MINISTRY OF COMMERCE & INDUSTRY
(DEPARTMENT OF COMMERCE)
LOK SABHA UNSTARRED QUESTION NO. 1063
TO BE ANSWERED ON 28TH NOVEMBER, 2014
TRADE DEFICIT
1063. SHRI DHANANJAY MAHADIK: DR. HEENA VIJAYKUMAR GAVIT: SHRI S.R. VIJAYAKUMAR: SHRI SATAV RAJEEV: SHRI CHANDRA PRAKASH JOSHI: SHRIMATI SUPRIYA SULE: SHRI MOHITE PATIL VIJAYSINH SHANKARRAO: SHRI KIRTI AZAD: SHRI INNOCENT: SHRIMATI DARSHANA VIKRAM JARDOSH: SHRI KODIKKUNNIL SURESH:
Will the Minister of COMMERCE & INDUSTRY ( ´ÉÉÉÊhÉVªÉ A´ÉÆ =tÉÉäMÉ àÉÆjÉÉÒ ) be
pleased to state:
a) the quantum and value of export and import including contribution of small and
medium export houses therein during each of the last three years and the current
year, country, commodity/sector-wise along with the country's share in world's
trade including share of various States therein;
b) the share contribution of the export sector in the Gross Domestic Product (GDP) of
the country along with the measures taken by the Government to increase
contribution of manufacturing sector in overall GDP;
c) whether there is an increase in trade deficit, causing negative impact on the
economic condition of the country and if so, the details thereof indicating the
sectors adversely affected thereby during the said period along with the reaction of
the Government thereto;
d) whether the World Trade Organisation (WTO) has cut its forecast on global trade
growth for 2014 and if so, the details thereof; and
e) the measures taken by the Government to boost exports to minimize the impact of
the trade deficit and to enhance the benefits provided to the exporters under various
export promotion schemes along with the target fixed, if any, to boost country's
trade by the year 2020?
ANSWER
वा�ण� य एवं उ�योग रा� य मं�ी ( �वतनतर �भार) )�ीमती �नम�ला सीतारमण (
THE MINISTER OF STATE IN THE MINISTRY OF COMMERCE AND INDUSTRY
(INDEPENDENT CHARGE)
(SMT. NIRMALA SITHARAMAN)
(a)&(b) The details of Export, Import, Trade Deficit and Exports as percentage of GDP
(Financial year wise) for Merchandise goods is given in Table-1. India’s Total Trade and its
share in the World (Calendar year wise) is given in Table-2. The details of state-wise

exports during 2013-14 (as reported by Customs and compiled by DGCI&S Kolkata but not
validated) are given in Table-3.
Table-1: Value (US $ Billion)
YEAR Export
Import Trade deficit Export as Percentage of GDP
2011-12 306.0 489.3 183.3
17.47
2012-13 300.4 490.7 190.3
17.41
2013-14
314.4 450.2 135.8 18.16
2014-15
(Apr-Oct.)*
189.8 273.6 83.8 Not Available
* figures for 2014-15 (Apr-Oct.)are provisional Source: DGCI&S
Table-2: Value (US $ Billion)
Calendar Year India’s Total Trade India’s Share in World Trade
(%)
2010 576.6 1.87
2011 767.4 2.08
2012 785.4 2.12
2013 779.3 2.07
Source: WTO
Table-3:
State
Exports by the
State(2013-14) Share of the
State (%) Sl.No. Value (in Rs.Cr)
1 ANDAMAN & NICOBAR 58.64 0.00
2 ANDHRA PRADESH 93860.34 4.93
3 ARUNACHAL PRADESH 4.60 0.00
4 ASSAM 2465.65 0.13
5 BIHAR 5761.69 0.30
6 CHANDIGARH 596.90 0.03
7 CHATTISGARH 7701.68 0.40
8 DADRA & NAGAR HAVELI 10551.21 0.55
9 DAMAN & DIU 3889.90 0.20
10 DELHI 55894.42 2.93
11 GOA 9305.74 0.49
12 GUJARAT 444477.75 23.33
13 HARYANA 64477.46 3.38
14 HIMACHAL PRADESH 5003.10 0.26
15 JAMMU & KASHMIR 1043.33 0.05
16 JHARKHAND 3710.53 0.19
17 KARNATAKA 107592.68 5.65
18 KERALA 25923.50 1.36
19 LAKSHADWEEP 5.01 0.00
20 MADHYA PRADESH 26463.25 1.39
21 MAHARASHTRA 434591.04 22.81
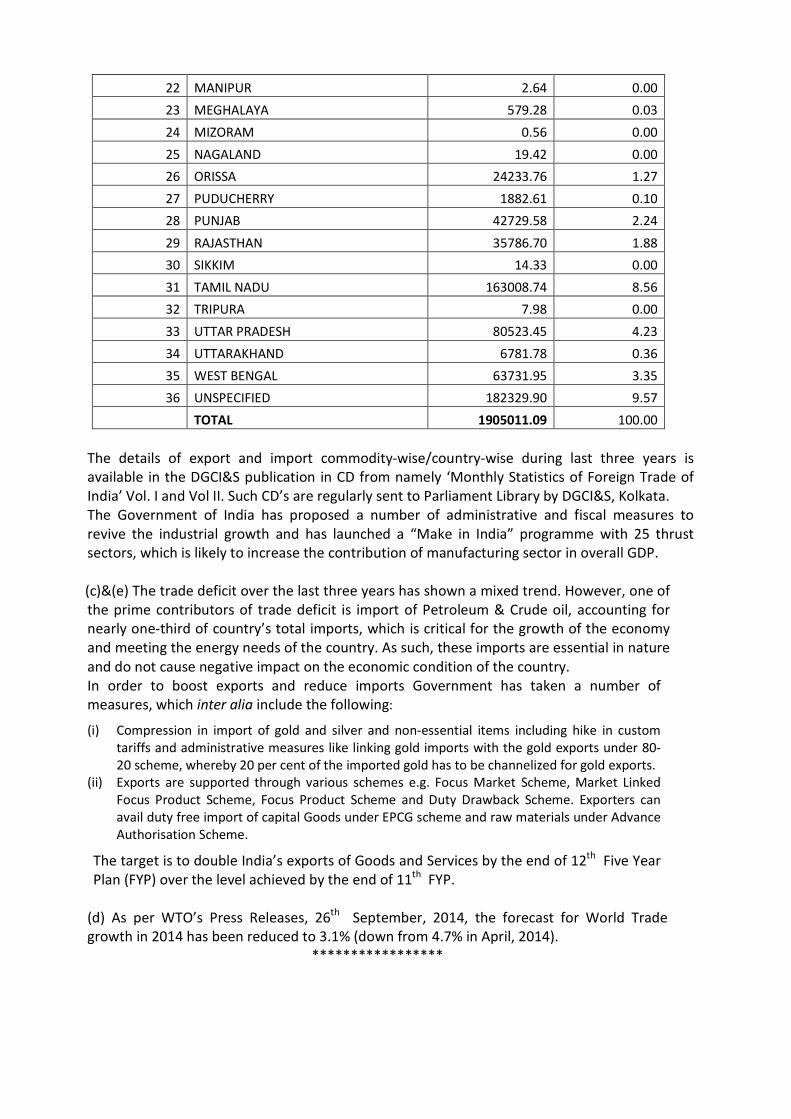
22 MANIPUR 2.64 0.00
23 MEGHALAYA 579.28 0.03
24 MIZORAM 0.56 0.00
25 NAGALAND 19.42 0.00
26 ORISSA 24233.76 1.27
27 PUDUCHERRY 1882.61 0.10
28 PUNJAB 42729.58 2.24
29 RAJASTHAN 35786.70 1.88
30 SIKKIM 14.33 0.00
31 TAMIL NADU 163008.74 8.56
32 TRIPURA 7.98 0.00
33 UTTAR PRADESH 80523.45 4.23
34 UTTARAKHAND 6781.78 0.36
35 WEST BENGAL 63731.95 3.35
36 UNSPECIFIED 182329.90 9.57
TOTAL 1905011.09 100.00
The details of export and import commodity-wise/country-wise during last three years is
available in the DGCI&S publication in CD from namely ‘Monthly Statistics of Foreign Trade of
India’ Vol. I and Vol II. Such CD’s are regularly sent to Parliament Library by DGCI&S, Kolkata.
The Government of India has proposed a number of administrative and fiscal measures to
revive the industrial growth and has launched a “Make in India” programme with 25 thrust
sectors, which is likely to increase the contribution of manufacturing sector in overall GDP.
(c)&(e) The trade deficit over the last three years has shown a mixed trend. However, one of
the prime contributors of trade deficit is import of Petroleum & Crude oil, accounting for
nearly one-third of country’s total imports, which is critical for the growth of the economy
and meeting the energy needs of the country. As such, these imports are essential in nature
and do not cause negative impact on the economic condition of the country.
In order to boost exports and reduce imports Government has taken a number of
measures, which inter alia include the following:
(i) Compression in import of gold and silver and non-essential items including hike in custom
tariffs and administrative measures like linking gold imports with the gold exports under 80-
20 scheme, whereby 20 per cent of the imported gold has to be channelized for gold exports.
(ii) Exports are supported through various schemes e.g. Focus Market Scheme, Market Linked
Focus Product Scheme, Focus Product Scheme and Duty Drawback Scheme. Exporters can
avail duty free import of capital Goods under EPCG scheme and raw materials under Advance
Authorisation Scheme.
The target is to double India’s exports of Goods and Services by the end of 12th Five Year
Plan (FYP) over the level achieved by the end of 11th
FYP.
(d) As per WTO’s Press Releases, 26th
September, 2014, the forecast for World Trade
growth in 2014 has been reduced to 3.1% (down from 4.7% in April, 2014).
*****************
GOVERNMENT OF INDIA MINISTRY OF COMMERCE & INDUSTRY
(DEPARTMENT OF COMMERCE)
LOK SABHA UNSTARRED QUESTION NO. 1078
TO BE ANSWERED ON 28TH NOVEMBER, 2014
BAN ON AMERICAN POULTRY PRODUCTS
1078. SHRI DILIP PATEL: SHRI DUSHYANT SINGH:
Will the Minister of COMMERCE & INDUSTRY ( ´ÉÉÉÊhÉVªÉ A´ÉÆ =tÉÉäMÉ àÉÆjÉÉÒ ) be
pleased to state:
a) whether there was a ban on sale of certain American poultry products in the
country;
b) if so, the details thereof and the reasons therefor;
c) whether the WTO ruled in favour of USA against India and called the ban
inconsistent with norms;
d) whether India and the US are set to begin to sort out their difference against each
other at the World Trade Organisation (WTO) over poultry import ban imposed by
India and penal duties on steel charged by the US;
e) if so, the details thereof;
f) whether India has strengthened its argument in both cases; and
g) if so, the details thereof?
ANSWER
वा�ण� य एवं उ�योग रा� य मं�ी ( �वतनतर �भार) )�ीमती �नम�ला सीतारमण (
THE MINISTER OF STATE IN THE MINISTRY OF COMMERCE AND INDUSTRY
(INDEPENDENT CHARGE)
(SMT. NIRMALA SITHARAMAN)
(a) & (b): There is no ban on import and sale of poultry products including
American Poultry products in the country. However, import of
poultry products is not allowed pursuant to outbreak of Avian
Influenza (highly pathogenic or low pathogenic Avian Influenza) in
the country of export, as per Government of India notification No.
S.O. 1663(E) dated 16 July, 2011.
(c): In the WTO dispute DS430 (Measures Concerning the Importation
of Certain Agricultural Products from the United States), the WTO
Panel had ruled that the import restrictions imposed vide the
aforesaid Notification by India on account of outbreak of Avian
Influenza in the country of export, is inconsistent with the WTO
Agreement, in particular, the Agreement on Sanitary and
Phytosanitary (SPS) Measures.
(d) to (g): In the WTO Dispute DS430, as stated above, no further development
has taken place whereas in the WTO Dispute DS436 (related to
Countervailing Duty imposed by the US against certain carbon steel
flat products) wherein India is complainant, both India and the US
have completed arguments before the WTO Appellate Body.
************

GOVERNMENT OF INDIA MINISTRY OF COMMERCE & INDUSTRY
(DEPARTMENT OF COMMERCE)
LOK SABHA UNSTARRED QUESTION NO. 1082
TO BE ANSWERED ON 28TH NOVEMBER, 2014
TRADE ALONG LoC
1082. SHRI P.C. MOHAN:
Will the Minister of COMMERCE & INDUSTRY ( ´ÉÉÉÊhÉVªÉ A´ÉÆ =tÉÉäMÉ àÉÆjÉÉÒ ) be
pleased to state:
a) the quantum and value of trade generated along the Line of Control (Indo-Pak) and
Nathu La Pass (Indo-China) during each of the last three years;
b) whether the Government has taken note that the trade across the region was
adversely affected because of adulteration;
c) if so, the details thereof indicating the incidents reported in this regard during the
said period; and
d) the steps taken by the Government to check the same and to improve the trade in
the coming days?
ANSWER
वा�ण� य एवं उ�योग रा� य मं�ी ( �वतनतर �भार) )�ीमती �नम�ला सीतारमण (
THE MINISTER OF STATE IN THE MINISTRY OF COMMERCE AND INDUSTRY
(INDEPENDENT CHARGE)
(SMT. NIRMALA SITHARAMAN)
(a) The total quantum and value of trade generated along the Line of Control (Indo-
Pak) i.e. trade through Trade Facilitation Centre (TFC) Chakan-Da-Bagh and TFC
Salamabad, (J&K) during the last three years is at Annexure-A.
The total quantum and value of trade generated along Nathu La Pass (India-
China) during the last three years is at Annexure-B.
(b) No incidence of adulteration which adversely affected trade has come to the notice
of Government.
(c) & (d) : Do not arise in view of (b) above.
***

Annexure-A
Quantity and Value of Items Traded from Salamabad to Chakoti(POK) and from Chakandabad to Rawalkote(POK)
Year Quantity (MT) Value (Rs. in Crores) 2011-12 46526.00 319.24
2012-13 76806.00 372.72
2013-14 62460.00 347.59
Quantity and Value of Items Traded from Chakoti(POK) to Salamabad and from Rawalkote(POK) to Chakandabad
Year Quantity (MT) Value (Rs. in Crores) 2011-12 36852.00 477.52
2012-13 79024.00 617.41
2013-14 35294.00 465.47

Annexure-B
2011-12
IMPORT
Commodities Quantity Value(Rs.)
Nil Nil Nil
EXPORT
Commodities Quantity Value(Rs.)
Copper Items 20652 kgs 57,17,625.00
Canned Foods 15671 Ctns 44,41,170.00
Textiles 10637 Mtr 12,42,300.00
Tea 9976 Kgs 14,24,620.00
Utensils 7269 Kgs 21,17,750.00
Spices 563 Kgs 1,45,350.00
Cigarettes 32 Ctns 20,000.00
Vegetable Oil 424173 Lts 2,01,30,022.00
Snuff 1020 Kgs 76,000.00
Misri 1200 Kgs 60,000.00.00
Blanket 7667 Pcs 3,71,85,947.00
Total 7,25,60,784.00
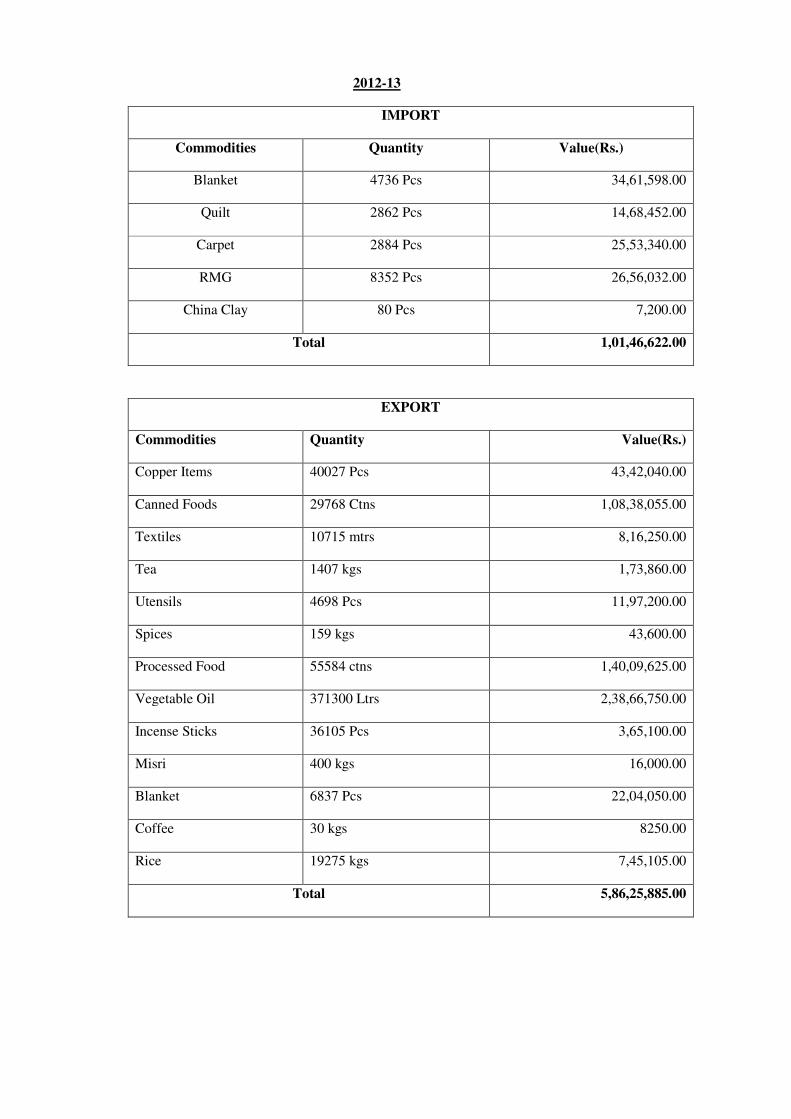
2012-13
IMPORT
Commodities Quantity Value(Rs.)
Blanket 4736 Pcs 34,61,598.00
Quilt 2862 Pcs 14,68,452.00
Carpet 2884 Pcs 25,53,340.00
RMG 8352 Pcs 26,56,032.00
China Clay 80 Pcs 7,200.00
Total 1,01,46,622.00
EXPORT
Commodities Quantity Value(Rs.)
Copper Items 40027 Pcs 43,42,040.00
Canned Foods 29768 Ctns 1,08,38,055.00
Textiles 10715 mtrs 8,16,250.00
Tea 1407 kgs 1,73,860.00
Utensils 4698 Pcs 11,97,200.00
Spices 159 kgs 43,600.00
Processed Food 55584 ctns 1,40,09,625.00
Vegetable Oil 371300 Ltrs 2,38,66,750.00
Incense Sticks 36105 Pcs 3,65,100.00
Misri 400 kgs 16,000.00
Blanket 6837 Pcs 22,04,050.00
Coffee 30 kgs 8250.00
Rice 19275 kgs 7,45,105.00
Total 5,86,25,885.00

2013-14
Import
Commodities Quantity Value (Rs.)
Blankets 4810 Pcs 41,99,455.00
Quilt 2174 Pcs 19,62,067.00
Carpet 1860 Pcs 22,24,339.00
RMG 8190 Pcs 31,15,523.00
Shoes 454 pcs 1,69,105.00
Total 1,16,70,489.00
Export
Commodities Quantity Value (Rs.)
Copper items 8264pcs 75,22,950.00
Canned food 19956Ctns 84,16,900.00
Processed Food 35241 Ctns 1,26,25,925.00
Vegetable Oil 538666 Ltrs 3,83,32,640.00
Utensils 5690 Pcs 15,24,600.00
Tea 4750 Kgs 7,08,550.00
Blankets 3744 Pcs 14,89,250.00
Textiles 42570 Pcs 46,35,750.00
Incense Sticks 326 Ctns 7,94,700.00
Coffee 871 Kgs. 3,69,270.00
Spices 185 Kgs 81,200.00
Gur 1995 Kgs 86,500.00
Rice 3010 Kgs 1,34,450.00
Misri 16197 Kgs 8,04,250.00
Total 7,75,26,935.00
************

GOVERNMENT OF INDIA MINISTRY OF COMMERCE & INDUSTRY
(DEPARTMENT OF COMMERCE)
LOK SABHA UNSTARRED QUESTION NO. 1090
TO BE ANSWERED ON 28TH NOVEMBER, 2014
TASK FORCE FOR EXPORT FACILITATION
1090. SHRI ANTO ANTONY:
Will the Minister of COMMERCE & INDUSTRY ( ´ÉÉÉÊhÉVªÉ A´ÉÆ =tÉÉäMÉ àÉÆjÉÉÒ ) be
pleased to state:
a) whether the Government has recently constituted a Task Force, to remove
procedural complexities in exports and reduce the transaction costs;
b) if so, the details thereof;
c) whether the Task Force has since submitted its report to the Government; and
d) if so, the recommendations made by it along with the follow-up action taken by the
Government thereon?
ANSWER
वा�ण� य एवं उ�योग रा� य मं�ी ( �वतनतर �भार) )�ीमती �नम�ला सीतारमण (
THE MINISTER OF STATE IN THE MINISTRY OF COMMERCE AND INDUSTRY
(INDEPENDENT CHARGE)
(SMT. NIRMALA SITHARAMAN)
(a)&(b) The ‘2nd Task Force on Transaction Costs in Exports’ was constituted by the
Government in April 2013.Thescope of the Task Force involved identifying key issues
and evolving a strategy towards reducing transaction costs in terms of specific
operational problems for export/import processes.
(c)&(d) The Task Force has submitted its report in July, 2014. It has
made recommendations for simplification of procedures and processes relating to
procedural and EDI level changes. In addition, specific recommendations relating to
Ministry of Agriculture, Ministry of Civil Aviation, Ministry of Commerce & Industry,
Ministry of Environment & Forests, Ministry of Finance , Ministry of Health and Family
Welfare, Ministry of Railways, Ministry of Shipping and Ministry of Textiles have also
been suggested by the Task Force. Besides, it has suggested framework for an efficient
trade facilitation mechanism in India. Task Force Report containing details of the issues
as well as recommendations is available at DGFTs website at
http://dgft.gov.in/exim/2000/tcostrep2011/tcostenglish2.pdf. Respective Departments /
Ministries / Authorities have been requested to take appropriate action on these
recommendations.
*******

GOVERNMENT OF INDIA MINISTRY OF COMMERCE & INDUSTRY
(DEPARTMENT OF COMMERCE)
LOK SABHA UNSTARRED QUESTION NO. 1094
TO BE ANSWERED ON 28TH NOVEMBER, 2014
FTA WITH GUATEMALA 1094. ADV. JOICE GEORGE:
Will the Minister of COMMERCE & INDUSTRY ( ´ÉÉÉÊhÉVªÉ A´ÉÆ =tÉÉäMÉ àÉÆjÉÉÒ ) be
pleased to state:
a) whether the Government proposes to sign Free Trade Agreement (FTA) with
Guatemala;
b) if so, the details thereof along with the commodities/products enlisted in the said
agreement;
c) whether the Government has included cardamom in the said agreement; and
d) if so, the details thereof?
ANSWER
वा�ण� य एवं उ�योग रा� य मं�ी ( �वतनतर �भार) )�ीमती �नम�ला सीतारमण (
THE MINISTER OF STATE IN THE MINISTRY OF COMMERCE AND INDUSTRY
(INDEPENDENT CHARGE)
(SMT. NIRMALA SITHARAMAN)
a) to d): No, Madam.
************************
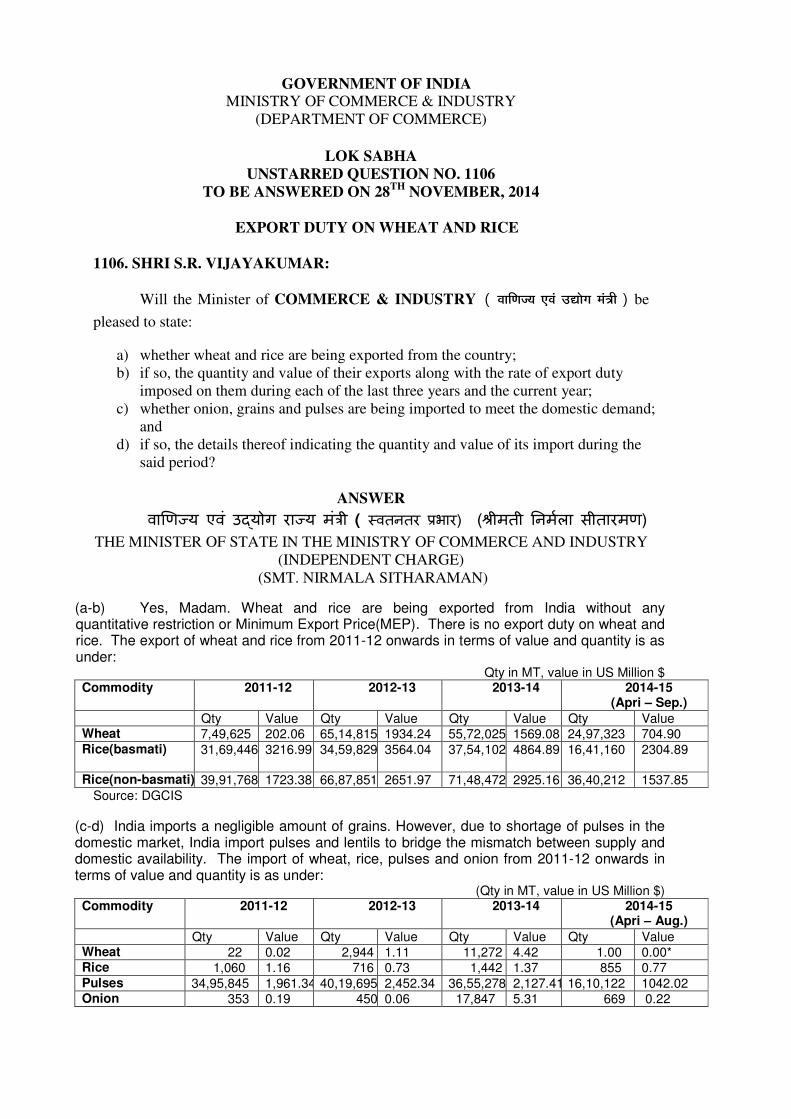
GOVERNMENT OF INDIA MINISTRY OF COMMERCE & INDUSTRY
(DEPARTMENT OF COMMERCE)
LOK SABHA UNSTARRED QUESTION NO. 1106
TO BE ANSWERED ON 28TH NOVEMBER, 2014
EXPORT DUTY ON WHEAT AND RICE
1106. SHRI S.R. VIJAYAKUMAR:
Will the Minister of COMMERCE & INDUSTRY ( ´ÉÉÉÊhÉVªÉ A´ÉÆ =tÉÉäMÉ àÉÆjÉÉÒ ) be
pleased to state:
a) whether wheat and rice are being exported from the country;
b) if so, the quantity and value of their exports along with the rate of export duty
imposed on them during each of the last three years and the current year;
c) whether onion, grains and pulses are being imported to meet the domestic demand;
and
d) if so, the details thereof indicating the quantity and value of its import during the
said period?
ANSWER
वा�ण� य एवं उ�योग रा� य मं�ी ( �वतनतर �भार) )�ीमती �नम�ला सीतारमण (
THE MINISTER OF STATE IN THE MINISTRY OF COMMERCE AND INDUSTRY
(INDEPENDENT CHARGE)
(SMT. NIRMALA SITHARAMAN)
(a-b) Yes, Madam. Wheat and rice are being exported from India without any quantitative restriction or Minimum Export Price(MEP). There is no export duty on wheat and rice. The export of wheat and rice from 2011-12 onwards in terms of value and quantity is as under:
Qty in MT, value in US Million $ Commodity 2011-12 2012-13 2013-14 2014-15
(Apri – Sep.) Qty Value Qty Value Qty Value Qty Value Wheat 7,49,625 202.06 65,14,815 1934.24 55,72,025 1569.08 24,97,323 704.90 Rice(basmati) 31,69,446 3216.99 34,59,829,443564.04 37,54,102 4864.89
16,41,160 2304.89
Rice(non-basmati) 39,91,768 1723.38 66,87,851 2651.97 71,48,472 2925.16 36,40,212 1537.85 Source: DGCIS
(c-d) India imports a negligible amount of grains. However, due to shortage of pulses in the domestic market, India import pulses and lentils to bridge the mismatch between supply and domestic availability. The import of wheat, rice, pulses and onion from 2011-12 onwards in terms of value and quantity is as under:
(Qty in MT, value in US Million $) Commodity 2011-12 2012-13 2013-14 2014-15
(Apri – Aug.) Qty Value Qty Value Qty Value Qty Value Wheat 22 0.02 2,944 1.11 11,272 4.42 1.00 0.00* Rice 1,060 1.16 716 0.73 1,442 1.37 855 0.77 Pulses 34,95,845 1,961.34 40,19,695 2,452.34 36,55,278 2,127.41 16,10,122 1042.02 Onion 353 0.19 450 0.06 17,847 5.31 669 0.22

Source: DGCIS/Website of DOC *negligible
**************

GOVERNMENT OF INDIA MINISTRY OF COMMERCE & INDUSTRY
(DEPARTMENT OF COMMERCE)
LOK SABHA UNSTARRED QUESTION NO. 1110
TO BE ANSWERED ON 28TH NOVEMBER, 2014
WELFARE OF SMALL TEA GROWERS
1110. SHRI BADRUDDIN AJMAL: SHRI ADHIR RANJAN CHOWDHURY:
Will the Minister of COMMERCE & INDUSTRY ( ´ÉÉÉÊhÉVªÉ A´ÉÆ =tÉÉäMÉ àÉÆjÉÉÒ ) be
pleased to state:
a) whether a large number of small tea growers in various parts of the country
including Assam are being deprived of the benefits from different schemes of the
Central Government and are facing starvation;
b) if so, the details thereof and the remedial action taken by the Government in this
regard;
c) whether the small tea growers are not able to register themselves under tea board in
absence for/want of their land holding certificates;
d) if so, the remedial measures taken by the Government in this regard; and
e) whether such small tea growers including tea growers from Assam are also being
deprived of the genuine price of the green leaves produced by them; and
f) if so, whether the Government has any proposal to regularize such small tea
growers to allow them to get proper market value of their produce and if so, the
details thereof?
ANSWER
वा�ण� य एवं उ�योग रा� य मं�ी ( �वतनतर �भार) )�ीमती �नम�ला सीतारमण (
THE MINISTER OF STATE IN THE MINISTRY OF COMMERCE AND INDUSTRY
(INDEPENDENT CHARGE)
(SMT. NIRMALA SITHARAMAN)
(a) to (f): Small tea groups are entitled to receive all benefits under the scheme
of Tea Development and Promotion implemented by the Tea Board subject to
fulfillment of conditions relating to ownership of land and registration as a small
grower. With a view to facilitate coverage under the various components of the
Scheme, the growers are encouraged to become members of collective units such as
Self Help Groups/Producer societies and are provided financial support for upkeep
and maintenance of the tea fields as well as proper post harvest handling of green
leaf.
A separate Small Growers Directorate with adequate field officers has been set up to
address the developmental needs of the small growers. The growers are issued
identification card after physical verification of the area cultivated and are assisted to
enroll with the primary producer groups or self-help groups. So far, 1,09,848 small
growers have been enumerated throughout the country and 50,411 identification
cards have been issued.

A price sharing formula (PSF) for the green tea leaves sold by small growers to
Bought Tea Factories has been notified as per the provisions of the Tea (Marketing)
Control Order. The formula takes into account the cost of production of green tea
leaf by the small growers and cost of manufacturing by the Bought Leaf Factories
and provides for the net sale proceeds to be shared in the ratio of 65:35. Minimum
bench mark prices are fixed and notified for each tea district based on the above
formula and payment of green leaf price to the growers is closely monitored by the
District Level Price Monitoring Committees set by the Tea Board.
*****

GOVERNMENT OF INDIA MINISTRY OF COMMERCE & INDUSTRY
(DEPARTMENT OF COMMERCE)
LOK SABHA UNSTARRED QUESTION NO. 1113
TO BE ANSWERED ON 28TH NOVEMBER, 2014
EXPORT/IMPORT OF FERTILISERS
1113(H). SHRI NARANBHAI KACHHADIYA: SHRIMATI JYOTI DHURVE:
Will the Minister of COMMERCE & INDUSTRY ( ´ÉÉÉÊhÉVªÉ A´ÉÆ =tÉÉäMÉ àÉÆjÉÉÒ ) be
pleased to state:
a) the quantum and value of fertilisers exported and imported during each of the last
three years and the current year, country and item-wise; and
b) the measures taken being taken by the Government to boost their exports?
ANSWER
वा�ण� य एवं उ�योग रा� य मं�ी ( �वतनतर �भार) )�ीमती �नम�ला सीतारमण (
THE MINISTER OF STATE IN THE MINISTRY OF COMMERCE AND INDUSTRY
(INDEPENDENT CHARGE)
(SMT. NIRMALA SITHARAMAN)
(a) The item-wise quantum and value of fertilisers exported and imported during each of the last
three years and the current year, is given below:
Quantity in Thousand TON Values in US$ Millions
Import
Fertilizer
CRUDE
Fertilizer
MANUFACTURED
SULPHER,
UNROASTED
IRON PYRITE
Total
Fertilizer
CRUDE
Fertilizer
MANUFACTURED
SULPHER,
UNROASTE
D IRON
PYRITE
Total
2011-12 9745.0 18095.1 2039.9 29880.0 478.4 9206.5 478.4 10163.4
2012-13 8167.1 15950.2 1549.6 25666.9 319.5 7403.9 319.5 8042.8
2013-14 7170.7 14890.9 1292.9 23354.4 926.1 5337.8 183.1 6446.9
2014-15
(April-Sept) 4150.6 7677.5 905.5 12733.6 498.8 2741.0 158.6 3398.4

Quantity in Thousand TON Values in US$ Millions
Export
Fertilizer
CRUDE
Fertilizer
MANUFACTURED
SULPHER,
UNROAS
TED IRON
PYRITE
Total
Fertili
zer
CRUD
E
Fertilizer
MANUFACTURED
SULPHER,
UNROASTED
IRON PYRITE
Total
2011-12 16.7 127.7 163.4 307.8 5.0 78.0 35.2 118.2
2012-13 30.5 159.0 370.3 559.7 4.1 84.5 61.8 150.5
2013-14 10.7 137.4 577.8 725.8 6.4 75.4 66.3 148.1
2014-15
(April-Sept) 4.4 52.1 22411.5 22467.9 3.7 25.3 49.2 78.2
The commodity-wise/country-wise details of export and import during last three years are
available in the DGCI&S publication in CD form, namely ‘Monthly Statistics of Foreign Trade of
India’ Vol.I and Vol.II. Such CDs are regularly sent to Parliament Library by DGCI&S, Kolkata.
(b) To encourage manufacturing/exports of fertiliser, the Government has been encouraging Indian
Companies to establish Joint ventures abroad in countries which are rich in fertilizer resources
for production facilities, with buy back arrangements and to enter into long term agreement for
supply of fertilizers and fertilizer inputs to India. To boost exports of fertilizers, the concerned
Export Promotion Council, namely CHEMEXCIL, arranges International Trade Fairs and Buyers-
Sellers meets in India and abroad.
************

GOVERNMENT OF INDIA MINISTRY OF COMMERCE & INDUSTRY
(DEPARTMENT OF COMMERCE)
LOK SABHA UNSTARRED QUESTION NO. 1116
TO BE ANSWERED ON 28TH NOVEMBER, 2014
FTA PROVISIONS
1116. DR. KIRIT SOMAIYA:
Will the Minister of COMMERCE & INDUSTRY ( ´ÉÉÉÊhÉVªÉ A´ÉÆ =tÉÉäMÉ àÉÆjÉÉÒ ) be
pleased to state:
a) whether the Government has taken note of the observations, concern raised by
Indian industries, particularly, Metal Industries regarding custom duty
concession/exemption extended to various projects/industries under Free Trade
Agreement (FTA) with ASEAN countries;
b) if so, the details thereof;
c) whether as per FTA, the exemption extended to import copper products such as
Copper Cathodes, Copper Rods, Copper Scrap, Brass and Zinc Ingots has
negatively impacted Indian industries;
d) if so, the details thereof; and
e) the protective measures taken by the Government to protect Metal industries in the
country?
ANSWER
वा�ण� य एवं उ�योग रा� य मं�ी ( �वतनतर �भार) )�ीमती �नम�ला सीतारमण (
THE MINISTER OF STATE IN THE MINISTRY OF COMMERCE AND INDUSTRY
(INDEPENDENT CHARGE)
(SMT. NIRMALA SITHARAMAN)
(a) to (b): Some industries and associations have indicated their sensitivities on
products in the metal industries (including copper) due to imports from FTA partners.
(c) to (e) The share of preferential imports under Free Trade Agreements (FTAs) to the
total imports for copper products during the period 2013-14 is insignificant. Moreover,
for protecting the interest of the domestic including metal industries, these agreements
provide for maintaining sensitive/negative lists of items on which limited or no tariff
concessions are granted. In addition, in case of a surge in imports and injury to the
domestic industry, a country is allowed to take recourse to the measures such as anti-
dumping and safeguards.
**************

GOVERNMENT OF INDIA MINISTRY OF COMMERCE & INDUSTRY
(DEPARTMENT OF COMMERCE)
LOK SABHA UNSTARRED QUESTION NO. 1141
TO BE ANSWERED ON 28TH NOVEMBER, 2014
REVIEW OF SEZ AND FTA AGREEMENTS
1141. SHRI G. HARI:
Will the Minister of COMMERCE & INDUSTRY ( ´ÉÉÉÊhÉVªÉ A´ÉÆ =tÉÉäMÉ àÉÆjÉÉÒ ) be
pleased to state:
a) whether the review of Special Economic Zones and Free Trade Agreements has
been delayed;
b) if so, the details thereof and the reasons therefor;
c) whether the Government proposes new Foreign Trade Policy to give domestic
manufacturers and exporters the benefit of the revisions; and
d) if so, the details thereof?
ANSWER
वा�ण� य एवं उ�योग रा� य मं�ी ( �वतनतर �भार) )�ीमती �नम�ला सीतारमण (
THE MINISTER OF STATE IN THE MINISTRY OF COMMERCE AND INDUSTRY
(INDEPENDENT CHARGE)
(SMT. NIRMALA SITHARAMAN)
(a) & (b): Review of functioning of Special Economic Zones (SEZs) is an on-going
process and on the basis of inputs/suggestions received from stakeholders on the policy
and operational framework of the SEZ Scheme, Government periodically takes necessary
measures so as to facilitate speedy and effective implementation of SEZ Scheme.
Further, every Free Trade Agreements (FTAs) has a joint review mechanism which
monitors the implementation of the FTA. Moreover, evaluation of FTAs is a continuous
process which starts even before FTA negotiations are entered into and is done
periodically, thereafter.
(c) & (d): New Foreign Trade Policy (FTP), 2014-19 has not been announced so far.
Present FTP 2009-14 is in operation.
*****

GOVERNMENT OF INDIA MINISTRY OF COMMERCE & INDUSTRY
(DEPARTMENT OF COMMERCE)
LOK SABHA UNSTARRED QUESTION NO. 1145
TO BE ANSWERED ON 28TH NOVEMBER, 2014
FREE TRADE AGREEMENTS
1145. SHRI RAM CHARITRA NISHAD: DR. KIRIT SOMAIYA: SHRI ANANTKUMAR HEGDE: SHRI P.R. SUNDARAM: SHRI JYOTIRADITYA M. SCINDIA: DR. P. VENUGOPAL: SHRI SHIVKUMAR UDASI: SHRI MUTHAMSETTI SRINIVASA RAO (AVANTHI): SHRI M.B. RAJESH: SHRI R. GOPALAKRISHNAN: SHRI BHAGWANTH KHUBA:
Will the Minister of COMMERCE & INDUSTRY ( ´ÉÉÉÊhÉVªÉ A´ÉÆ =tÉÉäMÉ àÉÆjÉÉÒ ) be
pleased to state:
a) the details of countries with which India has entered into Free Trade Agreements
and Preferential Trade Agreements along with the total trade (import/export) with
FTA partner countries including ASEAN countries during the year 2014;
b) whether the Government has made any assessment/evaluation or proposes to make
any review of the impact of FTAs signed with various countries including the
ASEAN countries on the domestic stakeholders and if so, the details thereof;
c) whether FTAs have resulted in preferential imports from FTA partner countries and
the export from the country has declined and if so, the details thereof indicating
items that have recorded major increase in imports during the said period;
d) whether companies/MNCs from major countries like China, USA and Japan are
setting up plants in neighbouring ASEAN countries misusing/abusing the FTA
provisions as a result thereof and if so, the details thereof and the reaction of the
Government thereto; and
e) the protective measures taken by the Government to boost exports as well as
protect domestic industries and agricultural sector from the adverse impact of
import?
ANSWER
वा�ण� य एवं उ�योग रा� य मं�ी ( �वतनतर �भार) )�ीमती �नम�ला सीतारमण (
THE MINISTER OF STATE IN THE MINISTRY OF COMMERCE AND INDUSTRY
(INDEPENDENT CHARGE)
(SMT. NIRMALA SITHARAMAN)
(a) The details of the Free Trade Agreements (including Comprehensive Economic
Cooperation Agreements or CECAs and Comprehensive Economic Partnership
Agreements or CEPA) and Preferential Trade Agreements entered into by India is given in
Annexure 1 and Annexure 2 respectively. The total trade, along with imports and exports

with the FTA partner countries including ASEAN countries during the period 2014 is
given in Annexure 3.
(b) and (c) Assessment evaluation of FTAs is a continuous process which starts even
before FTA negotiations are entered into. Before entering into negotiations with its trading
partners, studies are undertaken internally, as well as through the Joint Study Group (JSG)
to study the feasibility of the proposed FTAs, including their impact on the domestic
stakeholders including the Apex Chambers of Commerce and Industry, Industry
Associations as well as the Administrative Ministries and Departments. An analysis based
on the available preferential import data from some key FTA partners reveals that the
percentage of overall preferential imports are low in relation to the overall imports from
these partners. However, share of preferential imports to total imports is significant with
some trading partners in specific sectors such as iron and steel, plastics and organic
chemicals.
(d) The government is not aware of any specific instances of companies being set up
by China, Japan and the United States in the ASEAN region for misusing/ abusing the
FTA provisions.
(e) In order to protect the interest of the domestic industry and agriculture sector, these
agreements provide for maintaining sensitive/negative lists of items on which limited or no
tariff concessions are granted under the FTA. In addition, in case of a surge in imports and
injury to the domestic industry, a country is allowed to take recourse to the measures such
as anti-dumping and safeguards.
**************
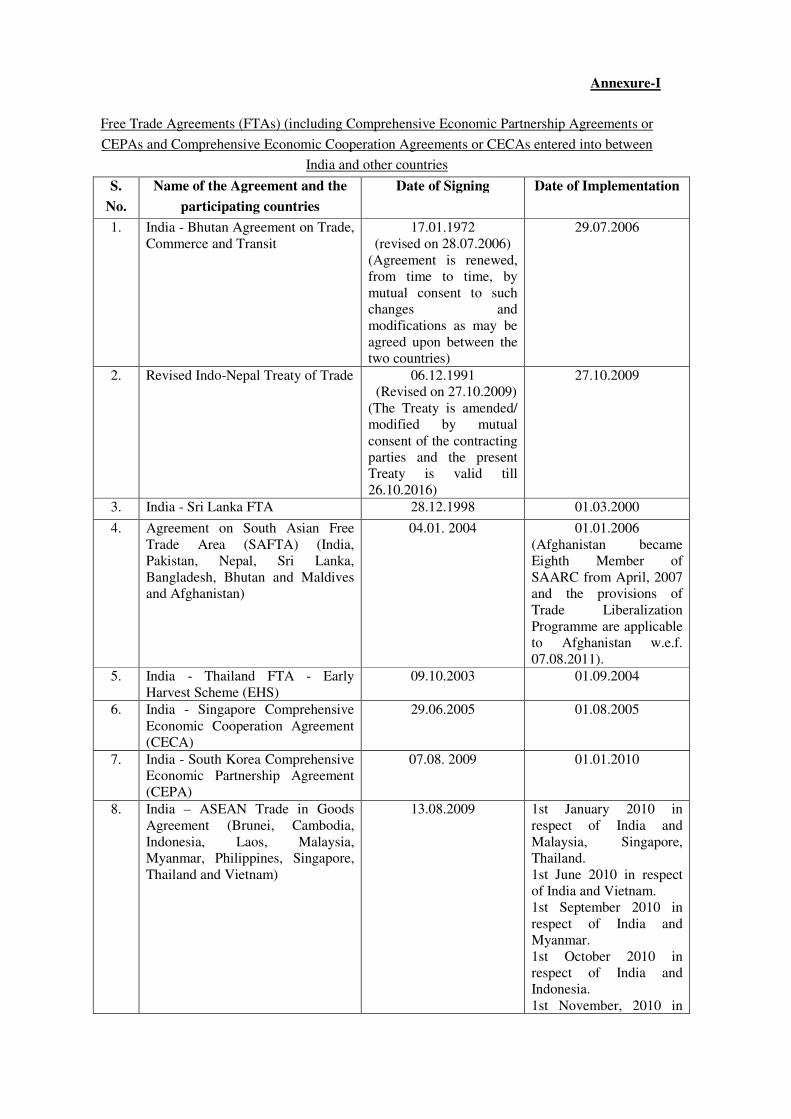
Annexure-I
Free Trade Agreements (FTAs) (including Comprehensive Economic Partnership Agreements or
CEPAs and Comprehensive Economic Cooperation Agreements or CECAs entered into between
India and other countries
S.
No.
Name of the Agreement and the
participating countries
Date of Signing Date of Implementation
1. India - Bhutan Agreement on Trade,
Commerce and Transit
17.01.1972
(revised on 28.07.2006)
(Agreement is renewed,
from time to time, by
mutual consent to such
changes and
modifications as may be
agreed upon between the
two countries)
29.07.2006
2. Revised Indo-Nepal Treaty of Trade 06.12.1991
(Revised on 27.10.2009)
(The Treaty is amended/
modified by mutual
consent of the contracting
parties and the present
Treaty is valid till
26.10.2016)
27.10.2009
3. India - Sri Lanka FTA 28.12.1998 01.03.2000
4. Agreement on South Asian Free
Trade Area (SAFTA) (India,
Pakistan, Nepal, Sri Lanka,
Bangladesh, Bhutan and Maldives
and Afghanistan)
04.01. 2004 01.01.2006
(Afghanistan became
Eighth Member of
SAARC from April, 2007
and the provisions of
Trade Liberalization
Programme are applicable
to Afghanistan w.e.f.
07.08.2011).
5. India - Thailand FTA - Early
Harvest Scheme (EHS)
09.10.2003 01.09.2004
6. India - Singapore Comprehensive
Economic Cooperation Agreement
(CECA)
29.06.2005 01.08.2005
7. India - South Korea Comprehensive
Economic Partnership Agreement
(CEPA)
07.08. 2009 01.01.2010
8. India – ASEAN Trade in Goods
Agreement (Brunei, Cambodia,
Indonesia, Laos, Malaysia,
Myanmar, Philippines, Singapore,
Thailand and Vietnam)
13.08.2009 1st January 2010 in
respect of India and
Malaysia, Singapore,
Thailand.
1st June 2010 in respect
of India and Vietnam.
1st September 2010 in
respect of India and
Myanmar.
1st October 2010 in
respect of India and
Indonesia.
1st November, 2010 in

S.
No.
Name of the Agreement and the
participating countries
Date of Signing Date of Implementation
respect of India and
Brunei.
24 January 2011 in
respect of India and Laos.
1st June 2011 in respect
of India and the
Philippines.
1st August, 2011 in
respect of India and
Cambodia.
9. India - Japan Comprehensive
Economic Partnership Agreement
16.02.2011 01.08.2011
10. India - Malaysia Comprehensive
Economic Cooperation Agreement
18.02.2011 01.07. 2011
11 India - ASEAN Services and
Investment Agreement
(Brunei, Cambodia, Indonesia,
Laos, Malaysia, Myanmar,
Philippines, Singapore, Thailand
and Vietnam)
9.9.2014 1.7.2015

Annexure 2
Preferential Trade Agreement (Limited tariff lines with Margin of Preference i.e. percentage of
Tariff concession) entered into by India with other countries/ groupings:
S.
No.
Name of the Agreement and the
participating countries
Date of Signing Date of
Implementation
1 Asia Pacific Trade Agreement (APTA)
(Bangladesh, China, India, Lao PDR,
Republic of Korea, and Sri Lanka)
July, 1975
(revised Agreement
signed on
02.11.2005)
01.11.1976
2 Global System of Trade Preferences (G S
T P)
(Algeria, Argentina, Bangladesh, Benin,
Bolivia, Brazil, Cameroon, Chile,
Colombia, Cuba, Democratic People's
Republic of Korea, Ecuador, Egypt,
Ghana, Guinea, Guyana, India,
Indonesia, Iran, Iraq, Libya, Malaysia,
Mexico, Morocco, Mozambique,
Myanmar, Nicaragua, Nigeria, Pakistan,
Peru, Philippines, Republic of Korea,
Romania, Singapore, Sri Lanka, Sudan,
Thailand, Trinidad and Tobago, Tunisia,
Tanzania, Venezuela, Viet Nam,
Yugoslavia, Zimbabwe)
13.4.1988 19.4.1989 (for 15
signatory countries)
3 India - Afghanistan PTA 06.03.2003 May, 2003
4 India - MERCOSUR PTA 25.01.2004 01.06.2009
5 India - Chile PTA 08.03. 2006 13.01.2009 (full
implementation)

Annexure 3
Total trade of India with its FTA partners for the period January-August, 2014
Country Export (in $ million) Import (in $ million) Trade (in $ million)
AFGHANISTAN 307 106.31 413.31 BANGLADESH 4,488.89 383.99 4872.88 BHUTAN 274.88 103.16 378.04 BRUNEI 29.76 607.71 637.47 CAMBODIA 99.57 10.73 110.3 INDONESIA 3,098.61 9,711.25 12809.86 JAPAN 4,099.71 6,117.61 10217.32 KOREA 3,225.23 8,831.95 12057.18 LAO PD RP 39.31 18.7 58.01 MALAYSIA 3,102.40 7,154.15 10256.55 MALDIVES 83.92 2.73 86.65 MYANMAR 597.12 1,125.54 1722.66 NEPAL 2,885.08 389.41 3274.49 PAKISTAN 1,561.39 343.46 1904.85 PHILIPPINES 967.14 276.99 1244.13 SINGAPORE 6,383.70 4,658.15 11041.85 SRI LANKA 3,805.46 362.83 4168.29 THAILAND 2,285.32 3,672.80 5958.12 VIETNAM 3,837.00 1,636.37 5473.37
Total 41171.49 45513.84 86685.33
******************

