lola hernández hernández
TRANSCRIPT
Graduate School of Development Studies
A Research Paper presented by:
Lola Hernández Hernández
(Nicaragua)
in partial fulfilment of the requirements for obtaining the degree of
MASTERS OF ARTS IN DEVELOPMENT STUDIES
Specialization:
Economics of Development (ECD)
Members of the examining committee:
Prof. Dr Michael Grimm
Prof. Dr Arjun Bedi
The Hague, The Netherlands November, 2009
DETERMINANTS OF FIRMS DYNAMICS IN THE INFORMAL
SECTOR
A CASE STUDY FROM PERÚ

ii
Disclaimer:
This document represents part of the author’s study programme while at the Institute of Social Studies. The views stated therein are those of the author and not necessarily those of the Institute.
Research papers are not made available for circulation outside of the Institute.
Inquiries:
Postal address: Institute of Social Studies P.O. Box 29776 2502 LT The Hague The Netherlands
Location: Kortenaerkade 12 2518 AX The Hague The Netherlands
Telephone: +31 70 426 0460
Fax: +31 70 426 0799

iii
Acknowledgements
Special thanks to Michael Grimm and Arjun Bedi for their guidance. To my family, classmates and professors for sharing their knowledge with me along this year. My thanks also to the Peruvian Institute of Statistic and Information for making available the necessary data.
iv
Contents
List of Tables ........................................................................................................... v
List of Figures ........................................................................................................... v
List of Maps ........................................................................................................... v
List of Acronyms ....................................................................................................... vi
Abstract .......................................................................................................... vii
Chapter 1 Introduction ........................................................................................ 1
Chapter 2 Background ........................................................................................ 3
2.1 Investment theories for formal firms and some empirical results ............. 3
2.2 Investment decisions and growth of informal firms ................................... 6
2.3 Profits and investment in informal economies............................................. 8
2.4 Investment decision and firm survival .........................................................11
Chapter 3 Data and Empirical Strategy ...............................................................13
3.1 Empirical model and specification ...............................................................13
3.2 The data .........................................................................................................15
3.2.1 Exploring heterogeneity: characteristics of firms by size ........................16
3.2.2 Characteristics of firms becoming inactive and remaining active along the period 2004-2006 .................................................................................................18
Chapter 4 Results .......................................................................................21
4.1 Probability of remaining active .....................................................................21
4.2 Probability of investment...............................................................................23
4.2.1 Probability of investing by firm size ...........................................................23
Chapter 5 Conclusion ......................................................................................26
Appendices ......................................................................................27
References ....................................................................................30

v
List of Tables
Table 1 Investment by year and size 17
Table 2 Probability of remaining active – Marginal effects 22
Table 3 Probability of investment of single-person firms 24
Table 4 Probability of investment of small firms 25
Table A2 Summary statistics by firm size 29
Table A3 Summary statistics of firms becoming inactive 30
List of Figures
Figure 1 Investment by firm size 9
Figure 2 Panel sample composition by year 10
List of Maps
Map A1 27

vi
List of Acronyms
IADB Inter American Development Bank
INEI Instituto Nacional de Estadística e Informática
IFC International Financial Coorporation
vii
Abstract
The paper examines the characteristics of small and medium-sized enterprises and their dynamics using a panel database of urban informal firms from Perú. Investment and survival comprise key decisions explaining firms’ dynamics. The evidence shows that determinants of investment are explained by the firms’ regional location, the owner’s reasons for creating the firm, his or her marital status, the profit rate and in a lower percentage having credit experience, the size of their family, the household’s total wage-income and characteristics as education and age of the owner. On the other hand, firms’ survival is determined by the owners’ and the firm’s age, the number of firms in the household and the firm’s size.
Relevance to Development Studies
Small and medium-sized urban firms in the informal sector account for 76 percent of the Peruvian employed labour force, turning this Latin-American country into the one with the largest share of informal employment. The importance of these firms as sources of employment and the tendency of their owners and workers to be located in the lower end of the income spectrum highlighting a situation which resembles a poverty trap. Hence, identifying the determinants of investment and survival of informal firms allows to shed light on the design of policies focused to promote higher levels of investment of informal entrepreneurs in developing countries in order to overcome poverty.
Keywords
Informal sector, Small and medium-sized firms, dynamics, investment, survival, Perú

1
Chapter 1 Introduction
Small and medium-sized urban firms in the informal sector account for seventy six percent of the Peruvian employed labour force, turning this Latin-American country into the one with the largest share of informal employment1. The sector includes firms selling food, beer, groceries, cosmetics, clothing and shoes; producing furniture, jewelry or baskets and those in the service sectors as garage, repair shops, taxi drivers and other firms providing transportation services. The importance of these firms as sources of employment and the tendency of their owners and workers to be located in the lower end of the income spectrum (Cunningham and Maloney 2001:131), highlighting a situation which resembles a poverty trap.
The mainstream theoretical literature has traditionally defined the informal sector following the standard view of the dualistic labour market. Having its roots in Harris’ and Todaro (1970) wage-market segmentation, this one presents it as an inferior and excluded segment, rationed out of modern salaried employment and characterized by low levels of productivity (Harris and Todaro 1970). Influenced by this approach, the definition of the informal sector by the International Labour Organizations describes firms in this sector as family owned small scale economic activities present in competitive markets, being labour intensive, relying on indigenous resources and characterized by falling under no governmental regulations such as minimum wage or tax laws (Ilo 1972). A newer definition has been introduced under a more legalistic view according to which enterprises in the informal sector are considered production units operated by single individuals or households that are not constituted as separate legal entities independent of their owners, being also characterized for their low levels of productivity and capital accumulation (Worldbank 2008).
A large number of studies exploring firm dynamics, like above-mentioned research by Cunningham and Maloney (2001), prove that there is a high level of heterogeneity in developing countries’ informal sector (Bigsten and Gebreeyesus 2007,Maloney 2004). This heterogeneity has been explored from different points of view, conveniently identifying those factors associated to the individual characteristics of the entrepreneur, and those to the characteristics of the firm. In this line, variables explaining the entrepreneur’s education, age, marital status, household’s income-wage, reason for being self-employed, as well as firm size and age, play an important role determining firm dynamics. Despite this high degree of heterogeneity, small and medium-sized informal firms have proven to be profitable business oriented units reporting high returns (Mckenzie and Woodruff 2008). So far there is no evidence on why these informal firms, despite perceiving high returns to capital, have not grown by the potential reinvestment of their profits. With this paper I seek to contribute to the debate about the characteristics of the Peruvian informal sector, its firm dynamics, and determinates firms’ investment and survival.
1 Small firms are defined as those employing up to 5 employees and medium-sized those
one with 6 to 14 employees.
2
Perú’s informal sector has been known for being analyzed from (see (Soto 1989), however so far there is no empirical evidence approaching the dynamics of small and medium-sized firms through the analysis of investment decisions and the determinant of firms’ survival . In this paper I analyze the determinants of investment in the Peruvian urban informal firms. Additionally I approach the exploration of firm’s survival by analyzing firms’ probability of remaining active during the period under study. To achieve this, I start by exploring the characteristics of the firms and the characteristics of their owners’ using an unbalanced household panel database of urban unregistered firms for the period 2004 to 2006. According to these characteristics, findings reveal that the determinants of investment are explained by firms’ regional location, the owner’s reasons for creating the firm, his or her marital status, the profit rate and in a lower percentage having credit experience, the size of their family, the household’s total wage-income and characteristics as education and age of the owner. On the other hand, firms’ survival is determined by the owners’ and the firm’s age, the number of firms in the household and the firm’s size.
The paper is structured as follows. Section 2 presents the background on investment theories, firms’ growth and presents related literature review. Section 3 describes the empirical strategy and data used for the analysis. Section 4 presents the discussion of the main results and Section 5 concludes.
3
Chapter 2 Background
Literature analysing firm level investment has mainly focused on private formal firms with more than ten employees, in both developing as developed countries. On the other hand, informal small and medium-sized enterprises have been largely studied in terms of their returns to capital, labour and entrepreneur characteristics, the firms’ role in the household and national economy, and its relationship with the credit market. However, firm level investment in these informal firms has not yet been studied. So far there is little evidence on why informal firms, despite perceiving high returns to capital, have not grown on their own by reinvesting profits in their enterprise.
To analyze investment in the informal sector, I will begin by presenting a theoretical framework and a literature review of investment, focused on firms with up to 100 or more employees. Then I will continue briefly conceptualizing and presenting a literature review on investment, survival and firms’ growth in developing countries.
2.1 Investment theories for formal firms and some empirical results
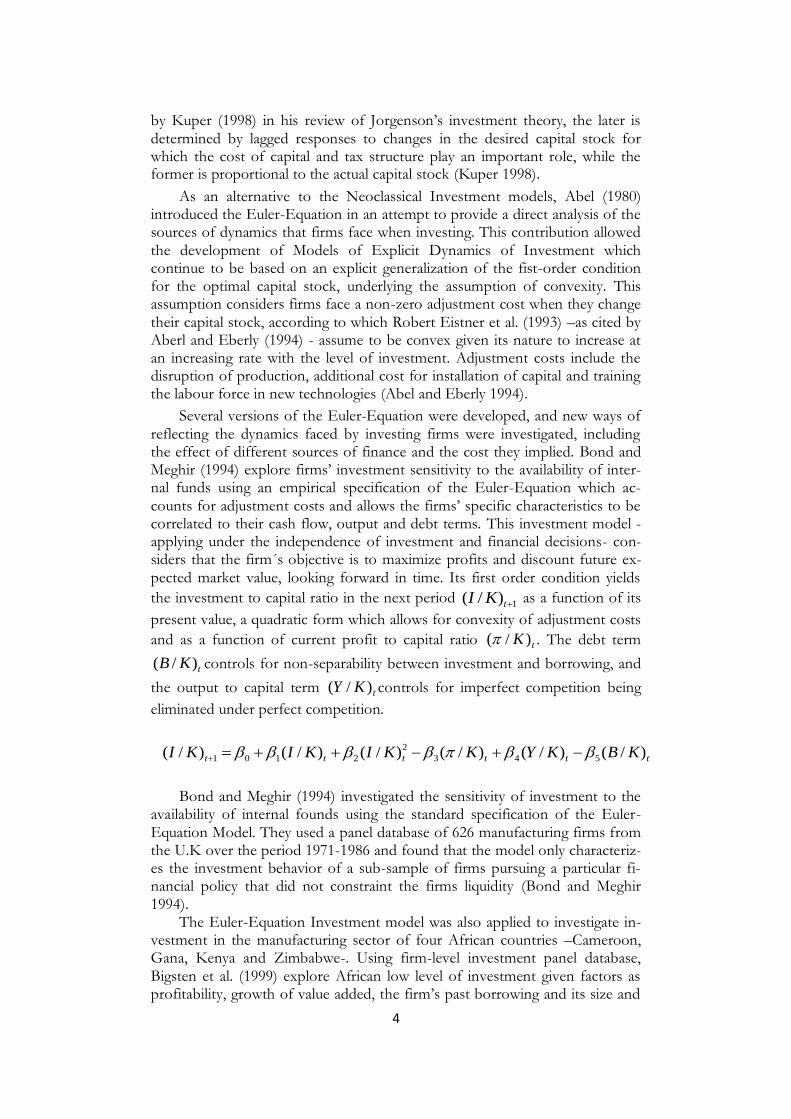
Three different trends in the literature of empirical models of investment applied to developing countries context can be noticed. The Neoclassical approach, the Euler-Equation Investment Model and the approach presented by Tybout (1983), who also presents an empirical application for Colombia.
In the early sixties, a static model of investment was developed by Jorgenson based on the Neoclassical Theory of Optimal accumulation of Capital under competitive conditions (Jorgenson 1963). As has been pointed out previously, although this model did not take into account the dynamics faced by firms as are uncertainty and irreversibility, it is the most prominent and widely used model of investment (Dixit and Pindyck 1994). It underlies two basic assumptions. First, each firm has a desired capital stock (K*) to which investment responds. Second, it is assumed that there are no frictions in the adjustment of capital stock, thus the desired capital stock can be achieved instantaneously and free of cost. Moreover, the determinants of changes in the desired capital stock can be represented by three factors: quantity, price and shocks while the depreciation is considered to be a fixed parameter. The firm equates marginal value product of capital with its marginal cost.
J
j
tjtjtjt
n
t
r
tt UCYKIII0
1 )(
This theory defines investment as a recurring event and divides it in two;
replacement investment )( r
tI and expansion investment )( n
tI . As mentioned
4
by Kuper (1998) in his review of Jorgenson’s investment theory, the later is determined by lagged responses to changes in the desired capital stock for which the cost of capital and tax structure play an important role, while the former is proportional to the actual capital stock (Kuper 1998).
As an alternative to the Neoclassical Investment models, Abel (1980) introduced the Euler-Equation in an attempt to provide a direct analysis of the sources of dynamics that firms face when investing. This contribution allowed the development of Models of Explicit Dynamics of Investment which continue to be based on an explicit generalization of the fist-order condition for the optimal capital stock, underlying the assumption of convexity. This assumption considers firms face a non-zero adjustment cost when they change their capital stock, according to which Robert Eistner et al. (1993) –as cited by Aberl and Eberly (1994) - assume to be convex given its nature to increase at an increasing rate with the level of investment. Adjustment costs include the disruption of production, additional cost for installation of capital and training the labour force in new technologies (Abel and Eberly 1994).
Several versions of the Euler-Equation were developed, and new ways of reflecting the dynamics faced by investing firms were investigated, including the effect of different sources of finance and the cost they implied. Bond and Meghir (1994) explore firms’ investment sensitivity to the availability of inter-nal funds using an empirical specification of the Euler-Equation which ac-counts for adjustment costs and allows the firms’ specific characteristics to be correlated to their cash flow, output and debt terms. This investment model - applying under the independence of investment and financial decisions- con-siders that the firm´s objective is to maximize profits and discount future ex-pected market value, looking forward in time. Its first order condition yields
the investment to capital ratio in the next period 1)/( tKI as a function of its
present value, a quadratic form which allows for convexity of adjustment costs
and as a function of current profit to capital ratio tK )/( . The debt term
tKB )/( controls for non-separability between investment and borrowing, and
the output to capital term tKY )/( controls for imperfect competition being
eliminated under perfect competition.
tttttt KBKYKKIKIKI )/()/()/()/()/()/( 543
2
2101
Bond and Meghir (1994) investigated the sensitivity of investment to the availability of internal founds using the standard specification of the Euler-Equation Model. They used a panel database of 626 manufacturing firms from the U.K over the period 1971-1986 and found that the model only characteriz-es the investment behavior of a sub-sample of firms pursuing a particular fi-nancial policy that did not constraint the firms liquidity (Bond and Meghir 1994).
The Euler-Equation Investment model was also applied to investigate in-vestment in the manufacturing sector of four African countries –Cameroon, Gana, Kenya and Zimbabwe-. Using firm-level investment panel database, Bigsten et al. (1999) explore African low level of investment given factors as profitability, growth of value added, the firm’s past borrowing and its size and

5
age. They discovered profitability and output have a positive and significant effect on investment; larger firms are reported as being more likely to invest every year although in small amounts, and small firms do not invest every year as they are credit constrained and might wait to accumulate earnings. However, for small firms their profits have a higher effect than for larger firms. They present evidence that older firms do not tend to invest, suggesting that it might be due to higher maintenance costs related to the firms’ age, as well as due to other non-capital related factors affecting investment decisions (Bigsten et al. 1999).
In either of these empirical applications of the Euler-Equation in a devel-oping country context, analyzed firms where assumed to be profit maximizers which is not the case when analyzing informal firms given the fact that these ones need to make consumption and production decisions simultaneously. If separability holds, households would maximize their profits and then given their profits maximize utility. In the case of formal firms, production decisions would be independent of consumption decisions, so there would be no differ-ences for the chosen decisions. However, in the case of informal firms, separa-bility does not hold, making households unable to behave as profit maximizers. A reason explaining this could be the lack of insurance or households’ limited access to capital.
The approach presented by Tybout (1983) takes into consideration costs and liquidity constraints of firms with credit rationing. The empirical model he suggests suits firms with or without binding liquidity constraints, in which the function of investment demand has two components. One is a linear function of past output levels -for those unconstrained firms- and the other one presents investment as distributed lag in earnings -for those firms facing ongoing liquidity constraints-. This last component allows the possibility that installation of new capital goods may take time, and that lumpy2 capital goods may force firms to accumulate funds over several periods before investing. To measure the cost effect of credit rationing, he used a standard flexible accelerator model, however this could not be applied to calculate the liquidity effects. Given that firms behave according to the accelerator model only when they have the funds to do so, credit constrained ones will allocate their profits to capital formation, as an evident source of investment (Tybout 1983).
)1()1()1()1(11
tIststQIS
s
s
S
s
st
Tybout (1983) analyzed the investment behaviour of Colombian manufacturing firms with different degrees of credit access, using a time series for the period 1973 to 1976 with a cross-industry sample of manufacturing firms with 25 observations per year and size class. He finds out that, as in industrialized economies, small firms relay more on internal funds when undergoing investment activities. As suggested by McKinnon (1973), the
2 Lumpiness refers to coexistence of long inaction periods, being the opposite to smooth
adjustment which occurs when adjustment is done in a continuous way.
6
determinant issue for accurately predicting investment behaviour will be to define whether the liquidity effect overshadows the cost effects or vice versa.
Although Tybout’s Investment Model suits a developing country context and it suits firms facing financial constraints, it is only applicable to profit maximizer firms. As explained for the Euler-Equation Investment Model given separability does not hold, investment behaviour of informal firms cannot be analyzed using this approach. Nevertheless, by combining the theoretical insights of investment theories with those of informal firms it is possible to identify key variables that should be incorporated into the analysis of investment in this sector.
2.2 Investment decisions and growth of informal firms
Cunningham and Maloney (2001) explored heterogeneity among Mexican microenterprises using firm-level data of 11,000 enterprises with firms employing less than six individuals. They identified several distinct subsectors according to the firms’ characteristics as productivity, demographic and reason for entry, revealing normal levels of heterogeneity expected in any small-firm sector rather than the standard view of a dualistic labour market. Although their empirical evidence shows the sector served as a refuge of those unable to get salaried jobs, it also presented that the majority of the subsectors expressed to be voluntarily self-employed in search of independence and higher earnings (Cunningham and Maloney 2001).
This heterogeneity explaining firms growth can be explored from different points of view. It is convenient to identify those factors associated to the individual characteristics of the entrepreneur, and those to the characteristics of the firm.
a) Individual Entrepreneur Characteristics
Nichter and Goldmark (2009) identified factors associated with small firms growth by gathering significant empirical evidence from previous studies. They argue that given developing countries have low levels of education, owners and workers tend to follow this trend since poor people in these countries often create survival oriented small-firms due to the lack of alternative employment opportunities. However, they highlight contrasting evidence, for Latin America the Inter-American Development Bank (IADB) has found no discernible impact of secondary education on firm growth (Kantis et al. 2004). On the contrary evidence from Sub-Sahara Africa suggest that firms with owners who completed secondary education tend to grow more rapidly in Kenya and Zimbabwe (Mead and Liedholm 1998).
Nichter and Goldmark (2009) argue that women own the majority of small firms in many developing countries, however they typically face unequal access to the household’s resources and asymmetrical obligations within it, challenging their firms potential to grow. At the same time these women-
7
owned firms play a crucial role in increasing and diversifying their households’ income. As a consequence of this survival strategy, women’s firms tend to grow more slowly; previous studies show that male-headed firms grow on average 11 percent a year, versus 7 percent for female-headed firms (Mead and Liedholm 1998). There is also evidence showing female headed MSEs tend to be concentrated in a narrow band of sectors or activities being also more likely to operate from their home(Liedholm 2002). This makes them appear hidden or overlooked, increasing their likelihood to be “invisible entrepreneurs” (Liedholm 2002:230).
The owner’s age is another key characteristic used to describe firms performance given its relation with access to finance and human capital accumulation. Although early postulations claimed that young people are likely to be less risk-averse (Jovanovic 1979), later on it was this was explained by a component in which binding liquidity constraints may make individuals to delay or miss profitable business opportunities, taking time to accumulate physical capital or networks to diminish this constraints (Evans and Jovanovic 1989).
Finally, two additional factors determining individual entrepreneur characteristics are its marital status and the household’s income-wage. Spanish empirical data show that men who are married may be more risk-averse (Carrasco 1999). On the other hand, households’ wage-income can be a source of the firm’s growth, since there is evidence showing that the households earning coming from formal sectors are a source of investment for informal businesses ran by other household members (Grimm and Gunther 2006).
b) Firm Characteristics
Certain firm characteristics may help disentangle explanations for firms investment performance or the lack of it. There are two main variables that may influence the cost of capital to the firm; the firm size and the firm´s age. The first one measured by the number of workers could be a proxy for the cost of capital, if this is the case larger firms would be expected to have more access to capital market by facing lower capital costs. In this situation, size should affect the propensity to invest. The second variable to be considered is the age of the firm, in the same line as with the age of the owner, older firms should be able to accumulate capital and experience. If the firm´s age is a proxy of capital it should also affect the decision to invest. Bigsten et al. (1999) find that for four African countries -Cameroon, Ghana, Kenya and Zimbabwe- the size and age of the firm are highly significant determinants for the decision whether to invest, where larger firms are more likely to do so while older firms are less likely. However, this study was for manufacturing firms with up to 100 or more employees. Although -for firms with less than 10 employees- there is no empirical evidence regarding the effect of their age and size on their investment decisions, the relationship with firms growth in terms of employment has been explored. An IADB study reveals that the major expansion of a firm occurs during the third year of operation (Kantis et al.
8
2004). Additionally other studies suggest that the average growth rate of firms decreases with age (Burki and Terrell 1998) as cited in Nichter and Goldmark (2009). This last case evidences that for Latin American firms’ productivity diminish as they grow older, what may be explained as a consequence of firms failure to invest sufficiently in existing and emerging technologies, leaving them with relatively outmoded equipment and hindering productivity levels relative to those of younger firms (Nichter and Goldmark 2009).
Another variable explaining firms investment performance is their access to finance. An IFC study for 10,000 firms in 80 countries found that credit is mentioned more frequently by owners of small firms as a constraints on their firms growth (Schiffer and Weder 2001). Moreover, given the fact that developing countries often have imperfect financial markets which structures do not reach small firms easily, small firms in these countries usually do not apply for formal loans and rather rely on other types of informal sources of trade credit or informal loans (Bigsten et al. 2003).
2.3 Profits and investment in informal economies
Perhaps the more accurate measure of small firms’ growth potential, in term of real capital returns, are those presented by De Mel et. al (2008) and Mckenzie and Woodruff (2008). Two randomized experiments, conducted among small firms in Sri Lanka and Mexico, that measured the impact of additional capital on business profits, reveal/show that profit rates substantially exceeded the market interest rate, suggesting a close relation with missing credit markets.
The experiment conducted by De Mel et al (2008) consisted in randomizing grants of US$100 or US$200, in-kind -as equipment or inventories- or in cash, among 659 firms from the retail or manufacturing sector that had less than 10,000 Sri Lankan rupees (LKR, about US$1,000) in capital other than land and buildings. This study was conducted from 2005 to 2007 while a microenterprise survey was carried out quarterly, reaching a total of nine waves. From the initial number of firms, 408 where finally selected conforming the baseline; after each wave a treatment and control group were defined and the grants started being given after the first wave. The experiment also included a component to measure the ability of the entrepreneur3 and another component to measure risk aversion4, which are two key factors explaining profits that are usually very difficult to measure in non-experimental studies. The treatment was used as instrument for capital stock in order to
3 A Digit Span Recall Test was included as a measure of numeracy and short-term
cognitive processing ability of the entrepreneur. Respondents were shown a three-digit number, after taking it away for ten seconds, they were ask to repeat it my memory; those who successfully recall the initial number were shown a second one with four-digits, and so on up to eleven digits. (De Mel et al. 2008)
4 The risk aversion test came from a lottery game played in the second wave of the
survey.
9
estimate the real marginal return on capital using IV regressions. Their findings reveal firms’ returns to capital ranges from 4.6 to 5.3 percent per month, on the order of 60 percent per year, which are much higher than the market interest rates ranging from 12 to 18 percent per year. The authors find that there is a considerable heterogeneity of the returns, being these ones a lot higher for those firms with more severely capital constrained, than for those with higher ability and with fewer other wage-workers in the households who could represent a source of liquidity. They found no evidence of differing capital returns based on the risk aversion of the entrepreneur or with the perceived uncertainty about future profits. Contrary to the conventional wisdom holding that women are more severely credit constrained, their findings reveal that returns are a lot higher in enterprises owned by males than in those owned by females, however there is a high variance in the impact of the treatment. About half the female owners reported characteristics suggesting negative returns, and almost 60% of them reported returns lower than the market interest rates; while for the men-owned enterprises this percentage was just over 20%. They suggest this high variance could be the reason why only a few firms in their sample borrowed from formal lenders. The authors highlight that it is exactly by combining the strong negative correlation between the impact on capital returns and measures of household liquidity, and the strong positive correlation between the impact and the entrepreneur’s ability, that it is possible to identify those small firms where investment is likely to be most profitable.
Replicating the randomized grant experiment conducted in Sri Lanka, Mckenzie and Woodruff (2008) implement the same experiment in Mexico, this time restricting it to male entrepreneurs in the retail trade industry, finding as well a high impact of the treatment despite the very different context. They conducted the experiment from November 2005 to November 2006 among 207 firms -in the baseline year- which had less than 10,000 pesos (about $1,000) in non-real estate capital, assigning a grant of 1,500 pesos (about $140) in cash or in-kind after the first wave of the survey representing a substantial shock for the enterprises given it represented a quarter of their mean baseline capital stock and half of their median monthly profits. Their reason of mixing grants was to determine whether conditional (in-kind) or unconditional (cash) grants had different impacts. As in the Sri Lankan case, before the first round of the survey entrepreneurs were told that the compensation for participating in the study was the chance to receive a prize to be given after each survey round. Results show that firms’ profits increase by 300 to 1,500 pesos, a 20-100 percent monthly return on the 1,500 pesos given to the treated groups, however they deepened their analysis by exploring the interaction effect of treatment with different measures of whether or not a firm is credit constrained. The reason for this is that in Mexico returns are much higher than interest rates offered by banks and microfinance institutions, which again suggests that many firms are credit constrain. The authors confirmed this by asking the owners of the firms if they considered lack of finance as an obstacle to the growth of their business, finding that 64% of the owners reported it as a constraint. However, they find that those owners with more education and whose father owned a business were less likely to report finance as a constraint. Another way to explore financial constraints among firms was
10
carried out by asking the owners if they had ever used formal finance or supplier credit at the time of the baseline survey, which would reveal that those who had used them would be less financially constrained. Only 15.6% of firms had ever had a formal loan while only 31.7% of them have had supplier credit. It is interesting to note that this study found there is evidence that formally registered firms are more likely to have had a formal loan or supplier credit. The result of the interaction effect of the treatment with the different measures for firms’ financial constraints, reveal that the treatment effect was a lot stronger for the 64% of the firms reporting finance as a constraint. For them monthly profits increased in 70-70 percent (1,051-1,192 pesos), the treatment effect was always positive and significant. Additionally the treatment effect increased even more for firms that, besides reporting finance as a constraint, never had a formal loan or supplier credit. Up to 38% of the firms in the sample fall into this category and were categorized as “financially superconstrained”. Impressively, for these firms the treatment increased profits in 100 percent (1,430-1,515 pesos) (Mckenzie and Woodruff 2008).
Both experiments prove that additional external capital shocks increase the profits of small firms in developing countries, ranging from 60% per year in Sri Lanka to 20-100% per year in Mexico. In both contexts, the more financially constrained firms reported the higher impacts of the grants. Despite the variance of the treatment among male and female owned enterprises and of those reporting different degrees of finance constraint, entrepreneurial ability and variance in the number of wage-workers in the household the average impact of the treatment proves that entrepreneurs freely chose to invest the grants in their business, obtaining high returns. Some owners even added more money in order to complete purchase exceeding the amount of the grant. Although the variance in returns may limit the willingness of banks to lend to these firms, still the average reports high returns to capital. This makes one wonder why these profitable small firms have not grown by themselves by reinvesting their own profits in their business (Mckenzie and Woodruff 2008).
If a poverty trap would be considered, it would be expected to be as a result of the combination of low returns at low capital levels, however this is not the case. Although small firms heterogeneity reveals that many are survival oriented enterprises, the two experiments proved that on average the majority of the entrepreneurs invested the grant in their business even while having the opportunity to do so in their households, revealing that small family-owned firms are strongly business oriented. As suggested by Mckenzie and Woodruff (2008), this question reveals the need for a better understanding of how small firms make investment decisions. To this it could be added the need to explore evidence on firms’ survival behaviour, since this last one sums up the consequences of small and medium-sized firms’ characteristics and decision-making processes.
11
2.4 Investment decision and firm survival
Another unanswered question to which this paper seeks to provide evidence is why small and medium-sized enterprises, although having high profit rates, they die more often than their large counterparts working in the same economic sector, as predicted by Ericson and Pakes (1995) and cited in Shiferaw (2006). It is assumed that, as time passes, firms would acquire competitive skills and the risk of failure should begin to decline; while small firms have the advantage that their size allows them to be more flexible and to develop the ability to specialize in niche markets, giving them advantages to overcome the potential business failure (Shiferaw 2006). However the theoretical and empirical literature remains inconclusive explaining the survival-size relationship. Evidence on micro and small enterprises in Africa reveals that one of the main reasons for closing a firm does not rely on business factors but on idiosyncratic shocks -as death of the owner- or by reasons following the opening up of better opportunities (Liedholm and Mead 1999).
Shiferaw (2006) makes a contribution to determining factors explaining firm entry, survival and growth in the Ethiopian manufacturing sector over the period 1992-2002, while also exploring the relationship of these factors with firms’ investment. Although his study restricts to units with more than 10 employees, it assesses investment revealing that during the period 1996 to 2002, 50 percent of manufacturing firms did not invest at all. He highlights that small firms with non-zero investment have a tendency to decline passing from 55 percent in 1999 to 33 percent in 2002, which brings again to the question why this happens despite the evidence of high returns. Contrary to evidence from African micro and small enterprises, the author reveals that firm size is an important determinant of its survival; the risk of exit among medium-sized enterprises decreases in 40 to 50 percent than compared to small enterprises. However, firms that undertook investment during the study period were able to prolong their survival time compared to those firms that did not invest, regardless of the magnitude of investment. Another interesting finding is that the capital intensity of firms did not have significant impact on the risk of failure, which he suggest would be a matter of whether the firms have sufficient demand on their products.
Fajnzylber et al. (2006) also explore the determinants of entry, survival and growth, in their case in the Mexican self-employment sector restricting it to microenterprises managed by males aged 15-65 years. They use two data sets; the National Urban Employment Survey and the National Survey of Microenterprises from 1991, 1994, 1996 and 1998. In the same line as Shiferaw’s findings, they find a positive and significant relationship between firm size and survival. They reveal that the effect of having at least one employee increases the owner’s probability of remaining in self-employment with 6 percent, while for those with at most five workers it increases it in 2.9 percent and up to 12.5 percent for those employing at least six workers (Fajnzylber et al. 2006). Additionally they explore other determinants of surviving self-employment. Taking into account other firms’ characteristics as earnings, they find that for those firms with at least one employee their
12
probability of survival increases in 8.8 percent with the doubling of self-employment earnings. The effect of the owner’s characteristics as age and education was also explored. Age has a positive relationship with survival, which was explored according to different age groups; those owners with ages ranging between 15-20 years have a 33.3 percent probability of staying in self-employment, whereas for individuals with similar personal characteristics, the probability of survival was 18.7 percentage points higher in the 21-35 age range and 27.2 percentage points higher for older owners in the 33-50 age range (Fajnzylber et al. 2006). Education has a negative impact on the probability of staying in self-employment, with a reduction of 2 percentage points in this probability for those owners with secondary or tertiary education, while for those with at most primary education the probability of staying in self-employment increases in a 70 percent. However, after restricting the sample to owners with at least one worker, the effect of education becomes positive and significant, especially for those with some college education (Fajnzylber et al. 2006)
13
Chapter 3 Data and Empirical Strategy
3.1 Empirical model and specification
In order to identify the dynamics of urban informal firms from Perú, I will calculate the probability of remaining active –an approximation to firms survival- and the probability of investment using a Probit model. The variables for survival and of investment are represented as a binary ones, i.e. a variables that can only take two different outcomes: One if the firm remains active or investment in any year and zero otherwise. When dealing with binary dependent variables it is inappropriate to treat it as an approximately
continuous variable as the estimators of )|( ii XYE are not bound by 0 and 1,
the error-term has a non-normal distribution and the variables of the disturbances are heteroskedastic (Gujarati 2003). For this reasons, in the case of binary dependent variables it is more appropriate to use logit or probit models. Logit and probit models have non-linear distribution of the data, the
estimators of )|( ii XYE lie between 0 and 1, and are usually estimated using
the maximum likelihood technique. The disadvantage of this technique compared to Ordinary Least Square (OLS) is that an additional assumption about the distribution of the error term is required. For this study, I assume
that the error term u is normally distributed, i.e. )1,0(Nu , consequently I
apply a probit model for the estimation of the determinants of investment and the determinants of remaining active during the period of study.
In line with the explanation above, I will start by calculating the probability of remaining active during the period 2004 to 2006. I will do so for those firms who only remained active during the first year, for those who did so during the first two years, and the probability of remaining active during the whole period. Although with a small panel data of three years that does not exceed the average firm age, it is difficult to measure survival rates, I present the short run determinants of those firms that remained active during the period 2004 to 2006, and those who did not. This makes it possible to paint an initial portrait of the type of firm with a higher likelihood of survival.
1iActive if iiii tionOwnerEducaOwnerAgeFirmAgeFemale 4321
iiii meHHwageincoInvestmentofitRateNofirmsHH 8765 Pr
iiiii FamilySizeCreditcesmitSize 1211109 tanRe
>0
0iActive otherwise
Where Active takes the value of 1 if the firm i remains active and 0 otherwise, Female is defined in the same way, FirmAge and OwnerAge refers to the age in years of the firm and owner respectively, OwnerEducation is the
14
owner’s years of education, NofirmsHH is the number of firms within the household, ProfitRate refers to the profits5 over capital ratio. Investment was calculated given the capital stock change between years, it takes the value of 1 if the firm i invest or 0 otherwise, HHwageincome refers to the household’s total wage-income. The size dummy variables and Remittances, Credit and FamilySize are defines as before.
The basic idea is to explain the determinants of remaining active given the firm’s and owner’s characteristics, as have been done in previous studies [see (Liedholm 2002) and (Fajnzylber et al. 2006)].
A very similar model is estimated to analyze the firm’s determinants of investment, including additional explanatory variables describing the firm regional location, reasons for creating the firm, working hours and a dummy for the owner’s marital status.
1iInvestment if iiii NofirmsHHOwnerAgeFirmAgeFemale 4321
iii SizemeHHwageincoofitRate 765 Pr
iiii gionFamilySizeCreditcesmit RetanRe 111098
iiii tusMaritalStaWorkingHrsasonFirm 141312 Re
>0
0iInvestment otherwise
Where Investment takes the value of 1 if the firm i invest in at least one year and 0 otherwise. The probability is estimated for three different scenarios: including profits and the household’s income-wage –being the full specification-, including profits while excluding the income-wage, and a last case which excludes both profits and the household’s income-wage. The objective is to present the specification including and excluding endogenously defined variables as the profit rate, credit experience and the household’s income-wage in order to explore its role in defining investment. Although the full specification includes these endogenous variables, concerns regarding their possible endogeneity must be kept in mind. Having recent credit experience while running a firm is associated with the owner’s prospects of investing. The same applies with profit rates and the household’s income-wage.
5 Profits reported by the entrepreneur
15
3.2 The data
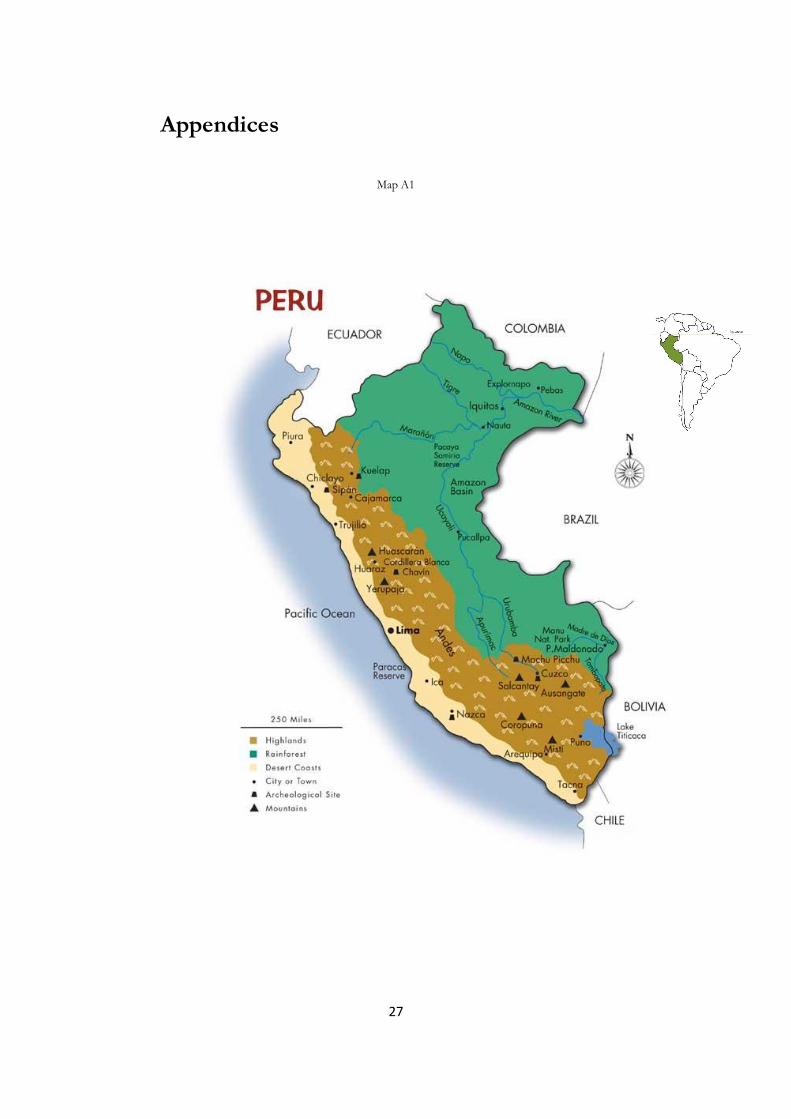
The analysis employs an unbalanced household panel database of urban unregistered firms for the period 2004 to 2006. It comes from the Peruvian National Household survey [Encuesta Nacional de Hogares (ENAHO)] which is annually conducted by the National Institute for Statistics and Information (INEI) and is representative at the national, regional, provincial and urban-rural level (Inei 2004). Sample selection was based on a probabilistic, stratified, several-stage design selecting households within clusters with a sampling level of confidence of 95 percent. Households in the panel sample are annually surveyed. ENAHO is a multipurpose survey that gathers intensive information about households and its members covering a wide range of socioeconomic indicators, including a section specifically for household’s firms. The survey categorizes employment according to the labor market status of the individuals during the week preceding the implementation of it. I focus on individuals who report that their main job was either “employers” (patrones) or “own-account workers” “Trabajador independiente”, defining them as firm owners. Firms covered in these categories comprise a wide range of typical small informal business found in developing countries. Examples include firms selling food, beer, groceries, cosmetics, clothing and shoes; producing furniture, jewelry or barkets, or firms in the service sectors as garage, repair shops, taxi drivers and other providing transportation services. The firm-level database examines information as profits, sales, capital stock, labor force’ characteristics, reasons for being self-employed, owner’s characteristics and similar others. It provides information at the regional levels, however these ones answer to three geographical regions: the coast, the highlands and the rainforest (see map A1 in the appendix). One of the largest geographical regions is the Rainforest, which is named after the inner area of the country in which the Amazon is located, however a large share of this area covers urban villages. Much of the economic activity in this region of focused around the provision of products and services to the tourists.
For the purpose of this paper and based on the characteristics of the data, I will use a simplified definition of informal firms considering them as those that are not registered with any public institution although they derive income from the production or trade of legal goods and services. The panel database provides information for a total of 2,482 unregistered urban firms from year 2004 to 2006. The first year serves as a baseline, and along the following ones the number of firms decreases to 1,229 in 2005 and 803 in 2006. This means a reduction of 50 percent after the first year, while at the end of the period only 32 percent of the initial firms remain active.
16
3.2.1 Exploring heterogeneity: characteristics of firms by size
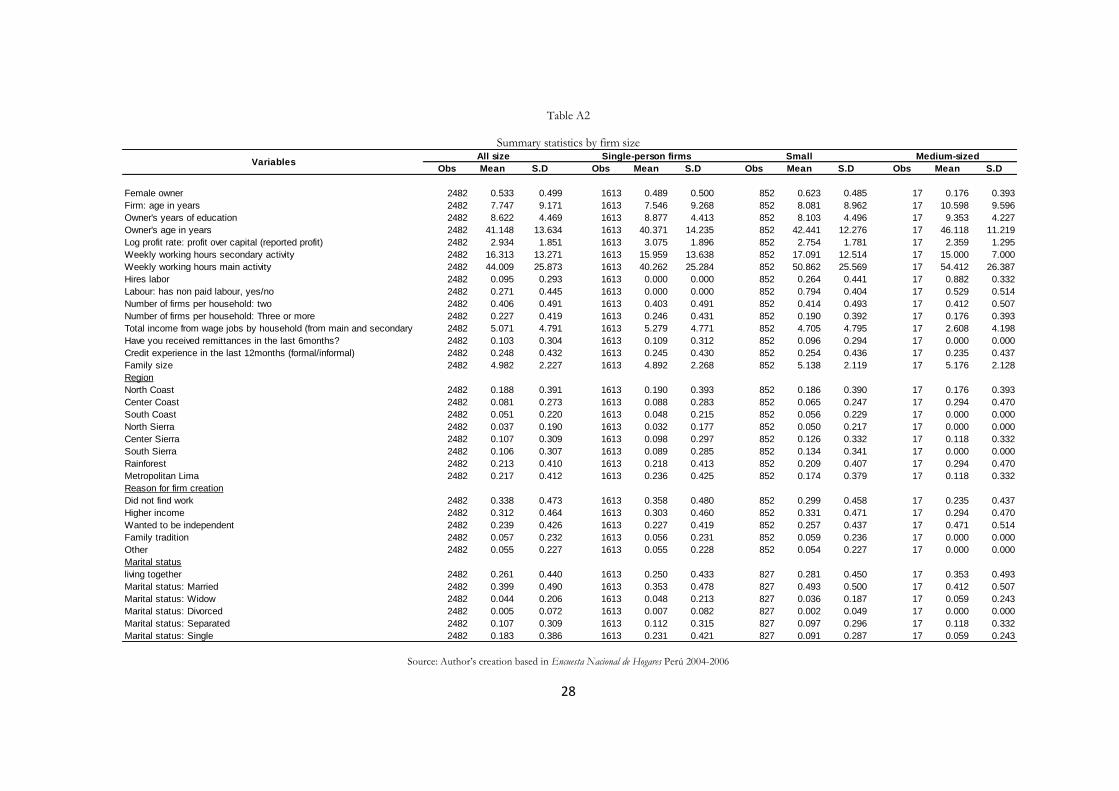
Comparing firms according to their size, on the basis of number of workers, allows exploring the heterogeneous characteristic of the informal sector. Table A1 in the appendix presents descriptive statistics according for those single-person firms6, those employing from 2 to 5 workers –small firms- and more than 5 workers –medium-sized firms7-.
Firms in the whole sample have been operating for a period of 8 to 11 years. The average age of owners is forty three years and their education level is up to 8 to 9 years of education. Households managing these firms are composed by 4 to 5 members and on average they own more than one firm. Moreover, around 32 percent of all firms have invested in at least one of the three years under study. About 22 percent of the firms are located in the Rainforest geographical region –which covers a large number of urban areas-, 20 percent in Metropolitan Lima and 20 percent in the Northern Coast region. In the lower bound, single-person firms are the more capital intensive ones –meaning they obtain higher profits at low levels of capital-, 48 percent of them are owned by women, they were created as an employment alternative -given they did not find work- and are owned by household with higher income coming from wage-jobs. Up to twenty four percent of these firms have more than two firms in their households while their owners on average work 32 percent less time in their main economic activity than those owning medium-sized firms. This category holds the lowest percentage of firms undergoing investing activities, while presenting the highest share of households reporting to receive remittances from abroad (9 percent more than the medium-sized firms) and the smaller percentage of firms reporting to have had either formal or informal credit experience. This reflects that single-person firms appear to be the poorer ones who are on average involuntarily in the informal sector. Despite presenting higher profit rates they are owned by households depending on a larger number of sources of income -as are the firm itself, secondary ones, wage-jobs and remittances- which what can be seen as a risk diversification method while preventing them of specializing. The lower share of firms investing and the higher share of them receiving remittances, might be related to the low percentage of firms with a credit experience.
In the upper bound medium-sized firms are the less capital intensive, they present the highest share of firms investing -nearly 60 percent- and their owners are characterize on average by being men -68 percent- with slightly more years of education than the average, who opened up their firms as an alternative to earn a higher income and as a way of being independent. A clear difference with the rest of categories refers to hiring paid labor, 75 percent of large firms hire labor compared to a scarce 24 percent of small firms hiring. In spite of this, the share of medium-sized firms having non-paid labor is still a high -68 percent-, plausibly composed by the extended family. Owners of medium-sized firm are the ones working more hours per week in their main
6 As were also named by Fajnzylber et al. (2006) 7 Labor size in terms of number of workers, including those paid and non-paid.

17
activity (55 hours) and simultaneously in their secondary one (19 hours), which reflects the opportunity cost of hiring labor allowing owners to work more hours in their main and secondary economic activities. Although this category holds the higher percentage of firms reporting to have credit experience -40 percent- this is still very low and can answer to the inflexible structure of the financial system.
In a middle bound, 64 percent of small firms are owned by women, with slightly less years of education than the average, who opened up their firms mainly as an alternative for earning higher income and in almost the same share, as an employment option. Fifty six percent of them invested in at least one year, and 82 percent of them has non-paid labor force. Fifty one percent of the firms have two firms in their households, while –as well as the large firms- forty two percent of them manages three or more firms in the household. As for individual firms, households with small firms receive remittances however in a lower share than the overall average but higher than larger firms. The share of firms with credit experience is above the average (37 percent).
3.2.1.1 Investment by firm size
Table 1 presents the distribution of firms investing by year and by size. During the whole period a total of 815 firms invested in at least one year representing 32 percent of all firms in the sample. In 2004 the largest percentages of those investing were small firms, 62 percent of their total; while in the next year, medium-sized firms had a larger percentage of them investing (60 percent). In year 2005, fifty six percent of all firms invested while the next year it reduced to fifty percent.
Table 1
Investment by year and firm size
Size No. % No. % No. %
Single-person firms 221 51 149 50 370 51.05
Small firm (>1 x < = 5) 270 62 162 50 432 62.18
Medium-sized firm (> 5) 10 59 3 60 13 59.12
All firms 501 56 314 50 815 100
Source: Analysis based on data from Encuesta Nacional de Hogares 2004-2996
* % answ ering to the mean of each category
2005 2006 All years
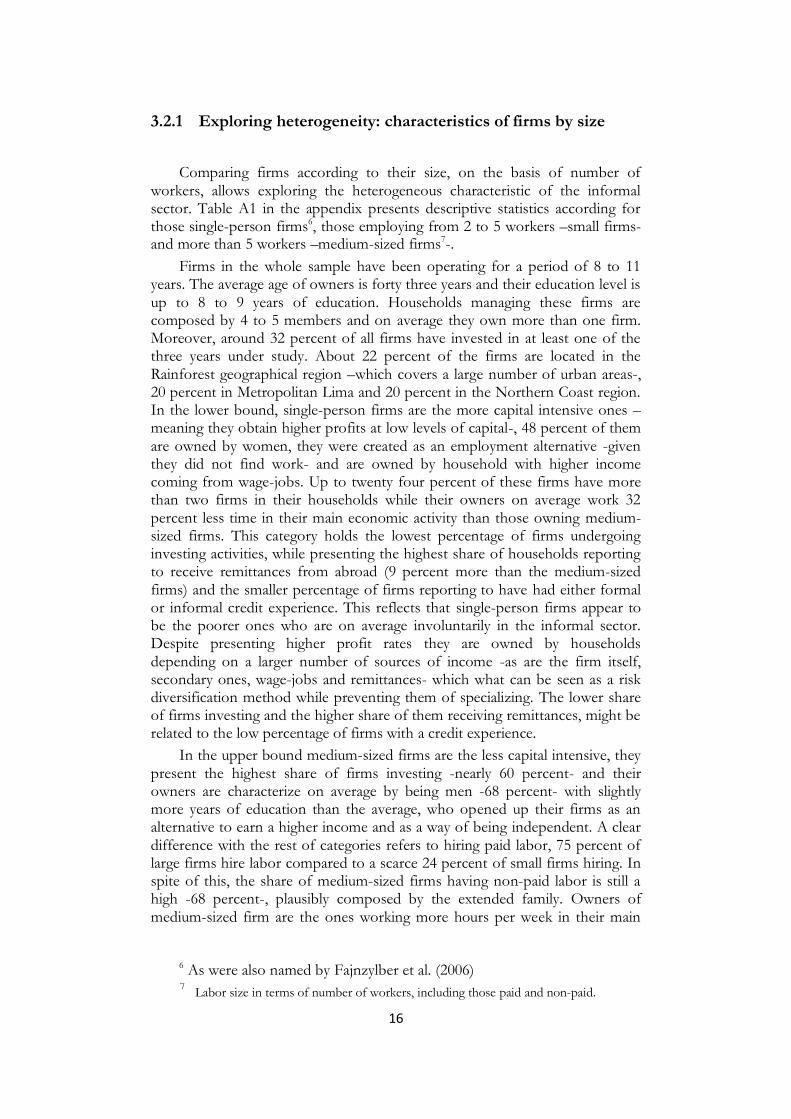
Figure 1 presents the firms investing in terms of hiring labor or not. The inner circle shows that forty six percent of firms hiring labor do invest, while only
18
eleven percent of them have paid labor force8. The outer circle shows that fifty four percent of firms hiring, do not invest, while only thirteen percent of them hires labor. Both firms, investing and not investing, have similar percentages of hiring paid labor which could suggest that there is no relationship between hiring and investing.
Figure 1
Investment by firm size
Invest (46%), Does not hire
89%
Invest (46%), Hires 11%
Does not invest (54%), Does not hire
87%
Does not invest (54%),
Hires 13%
Invest & does not hire Hires Does not invest & does not hire
Source: Based on Encuesta Nacional de Horages – Enaho 2004-2006
3.2.2 Characteristics of firms becoming inactive and remaining
active9 along the period 2004-2006
The determinants of firms staying in business are estimated using a probit specification that links owners and firm characteristics’ to the probability of remaining active after the first year of the period under study, those doing so during two of the three years, and finally those remaining active during the complete period. Although with a small panel data of three years that does not
8 Not including the owner as paid worker 9 Although the survey does not specifies for the death of each firm, this one will be assumed when the firm
does not appear in a following year despite the fact that the household continues being surveyed (remains in the panel sample).
19
exceed the average firm age, it is difficult to measure survival rates, I present the short run determinants in order to paint an initial portrait of the type of firm with a higher likelihood of survival.
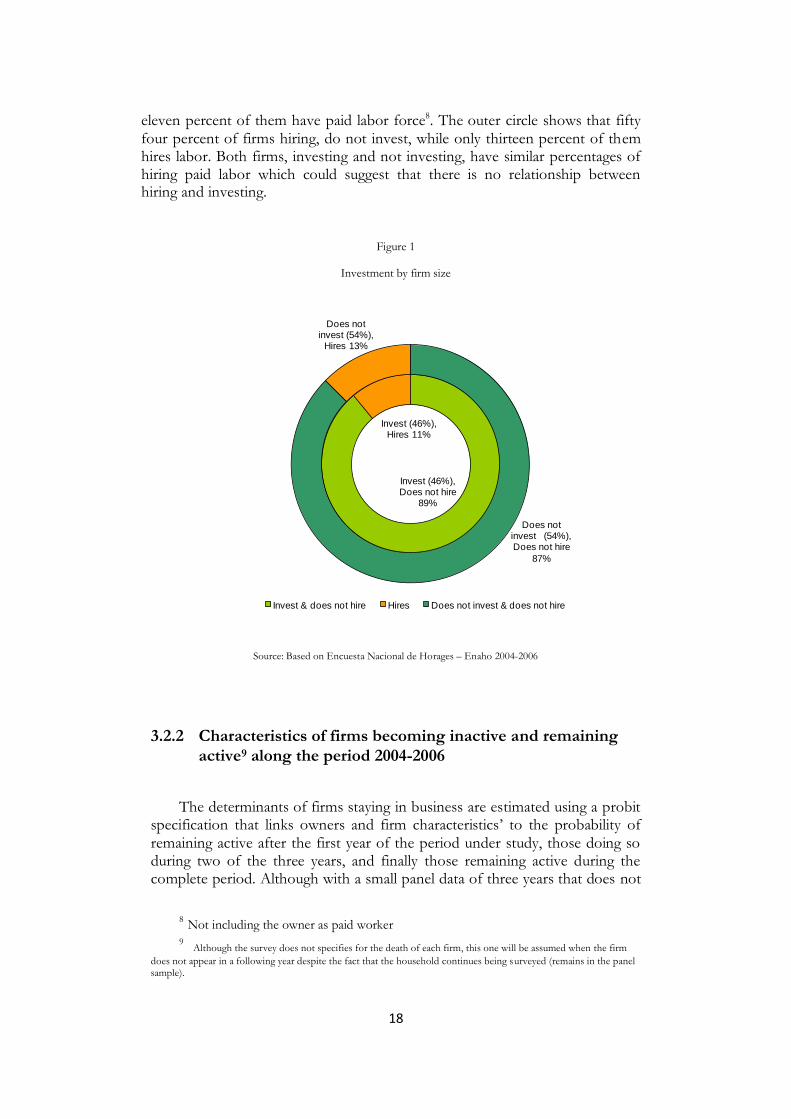
As it was pointed out above and how Figure 2 presents, after the first year of the period under study, 50 percent of the firms became inactive while only 32 percent of the initial number remained active in the last year, 2006.
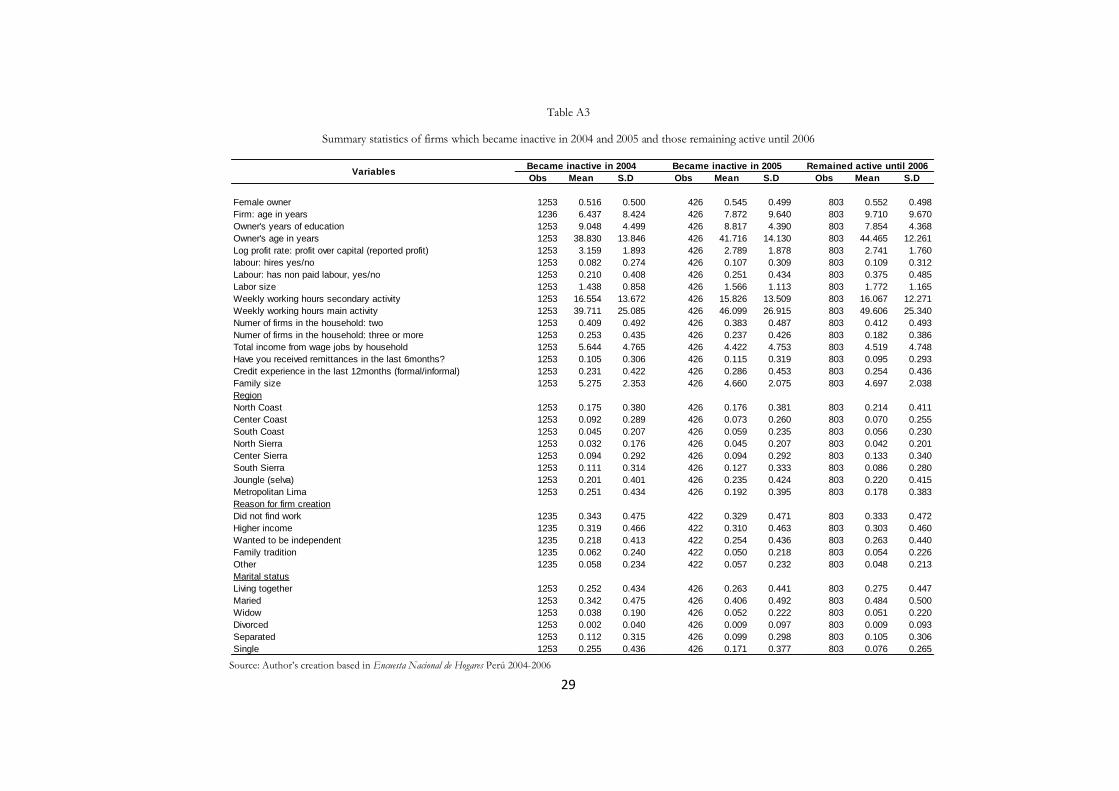
Table A2 presents the characteristics of those firms becoming inactive in the first and second year of the period under study, and of those remaining active along it. It can be seen that those becoming inactive after the first year of the period (2004) are the younger, more capital-intensive firms whose and have the highest average of years of education. These ones present the highest share of firms belonging to households managing three or more firms (25%) which can explain the lowest percentage of working hours allocated to the owner’s main economic activity. This category on average report the higher household’s income from wage-jobs, 10 percent of them recently received remittances from abroad and 23 percent had a credit experience in the last year, which although being the smaller share it does not differ much from the other ones. A third of these firms were created as an employment alternative and the household owning them are larger in terms of members. The firms’ regional location and the marital status of their owners follow a similar pattern of those categories presented in the previous section.
Figure 2
Panel sample composition by year
0
500
1000
1500
2000
2500
3000
2004 2005 2006
Year
Number of Firms
Source: Based on Encuesta Nacional de Horages – Enaho 2004-2006
Firms becoming inactive after the second year of the period under have owners almost 3 years older than those doing so in the first year but with slightly less years of education. These firms are less capital intensive and have more employees although without a great difference. They allocate more working hours in their main economic activity and have fewer firms within the household. These firms present the higher share of them who recently received remittances, 12 percent. Having remittances as a source of income, might be a reason influencing the household to decide to close the firm, this will be studied in the following section. As well as those firms inactive after 2004,
20
these firms were mainly created as an employment alternative however a higher –although slightly- share of them were created as a source of independence.
Finally, a total of 803 firms remain active from 1,253 at the beginning of the period. The gender composition among this group is similar to the other ones however it has the higher share of female owners. The fact that firms remaining active during the whole period present the lowest average of the owner’s years of education might reflect the lower opportunity/cost of closing the firm given the their level of education (see Maloney 2004). Although the firms are older than those becoming inactive in the previous year, they are as capital intensive as these ones. Meaning that despite the opportunity time can give to accumulate profits and develop entrepreneurial abilities, it is plausible that these firms have not managed to accumulate more capital. As for those becoming inactive in the previous year, the same share hires labor while up to 37.5 percent of them has non-paid workers. This last number represents a share 12.5 percent larger than those becoming inactive in 2005 and almost 17 percent higher than those doing so in year 2004. For those becoming inactive after the second year of the period. The average family size is the same as for the firms becoming inactive in 2005 and the main reason for its creation was as employment alternative, even in a slightly higher share than in the previous category.
In the next section, I present the probability of becoming inactive after the first and second year of the panel as well as the probability of remaining active along it.
21
Chapter 4 Results
4.1 Probability of remaining active
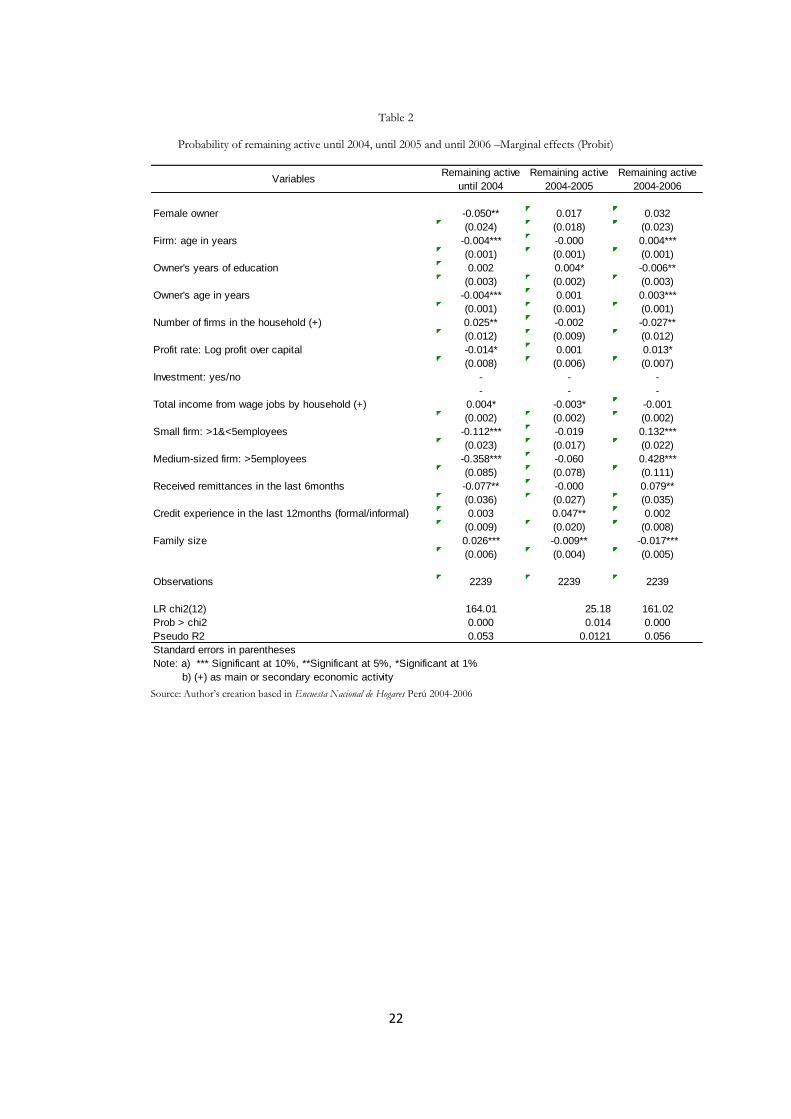
The results of the estimated probability specification of remaining active as outlined in section 3.1 are present in Table 2. Key determinants are the firm and the owner’s age, the number of firms managed in the household and the firm and family size.
Having a female owner decreases the probability of remaining active until 2004 in five percent, as well as an additional year of the firm’s age decreases the probability of remaining active until the first year of the period under study. The owner’s age decreases the probability of remaining active dur ing the whole period in small but statistically significant 0.3 percent. Owners’ years of education decrease the probability of remaining active for the whole period in 0.6 percent. A higher number of firms in the household decrease the firms’ probability of living longer and higher profit rate increases in 1.3 percent the probability of living longer. Higher household’s income from wage-jobs decreases the probability of living longer, although this variable is only significant for those remaining active until 2004 and until 2005. Being a small firm increases the probability of living longer in up to 13 percent while being a large firm increases it in 43 percent, revealing that the larger the firm, the longer it tends to live. This finding is in line with the results of previous empirical evidence, e.g. by McPherson (1995) in Botswana, Malawi, Swaziland and Zimbabwe, who found that growing MSE are more likely to survive than those that remained the same size. Moreover, receiving remittances increases the probability of living longer in 8 percent while firms from bigger families are 1.7 percent less probable to live longer.
22
Table 2
Probability of remaining active until 2004, until 2005 and until 2006 –Marginal effects (Probit)
Female owner -0.050** 0.017 0.032
(0.024) (0.018) (0.023)
Firm: age in years -0.004*** -0.000 0.004***
(0.001) (0.001) (0.001)
Owner's years of education 0.002 0.004* -0.006**
(0.003) (0.002) (0.003)
Owner's age in years -0.004*** 0.001 0.003***
(0.001) (0.001) (0.001)
Number of firms in the household (+) 0.025** -0.002 -0.027**
(0.012) (0.009) (0.012)
Profit rate: Log profit over capital -0.014* 0.001 0.013*
(0.008) (0.006) (0.007)
Investment: yes/no - - -
- - -
Total income from wage jobs by household (+) 0.004* -0.003* -0.001
(0.002) (0.002) (0.002)
Small firm: >1&<5employees -0.112*** -0.019 0.132***
(0.023) (0.017) (0.022)
Medium-sized firm: >5employees -0.358*** -0.060 0.428***
(0.085) (0.078) (0.111)
Received remittances in the last 6months -0.077** -0.000 0.079**
(0.036) (0.027) (0.035)
Credit experience in the last 12months (formal/informal) 0.003 0.047** 0.002
(0.009) (0.020) (0.008)
Family size 0.026*** -0.009** -0.017***
(0.006) (0.004) (0.005)
Observations 2239 2239 2239
LR chi2(12) 164.01 25.18 161.02
Prob > chi2 0.000 0.014 0.000
Pseudo R2 0.053 0.0121 0.056
Standard errors in parentheses
Note: a) *** Significant at 10%, **Significant at 5%, *Significant at 1%
b) (+) as main or secondary economic activity
Remaining active
until 2004
Remaining active
2004-2005
Remaining active
2004-2006Variables
Source: Author’s creation based in Encuesta Nacional de Hogares Perú 2004-2006
23
4.2 Probability of investment
4.2.1 Probability of investing by firm size
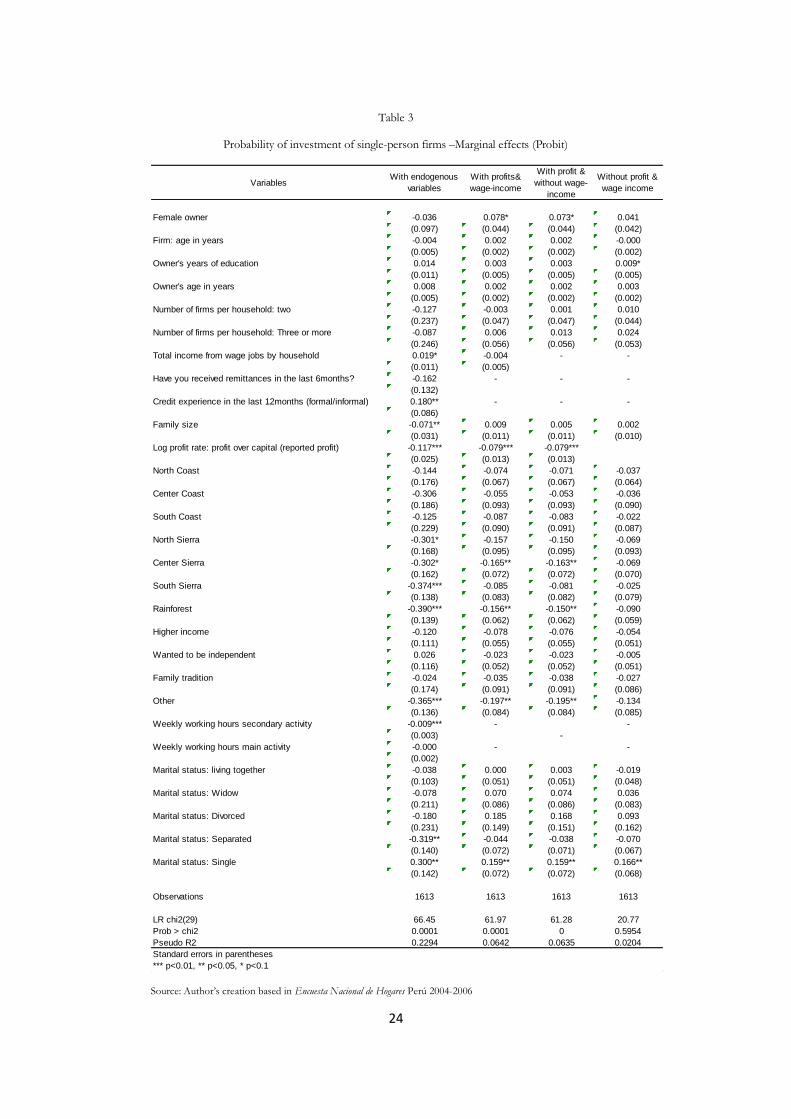
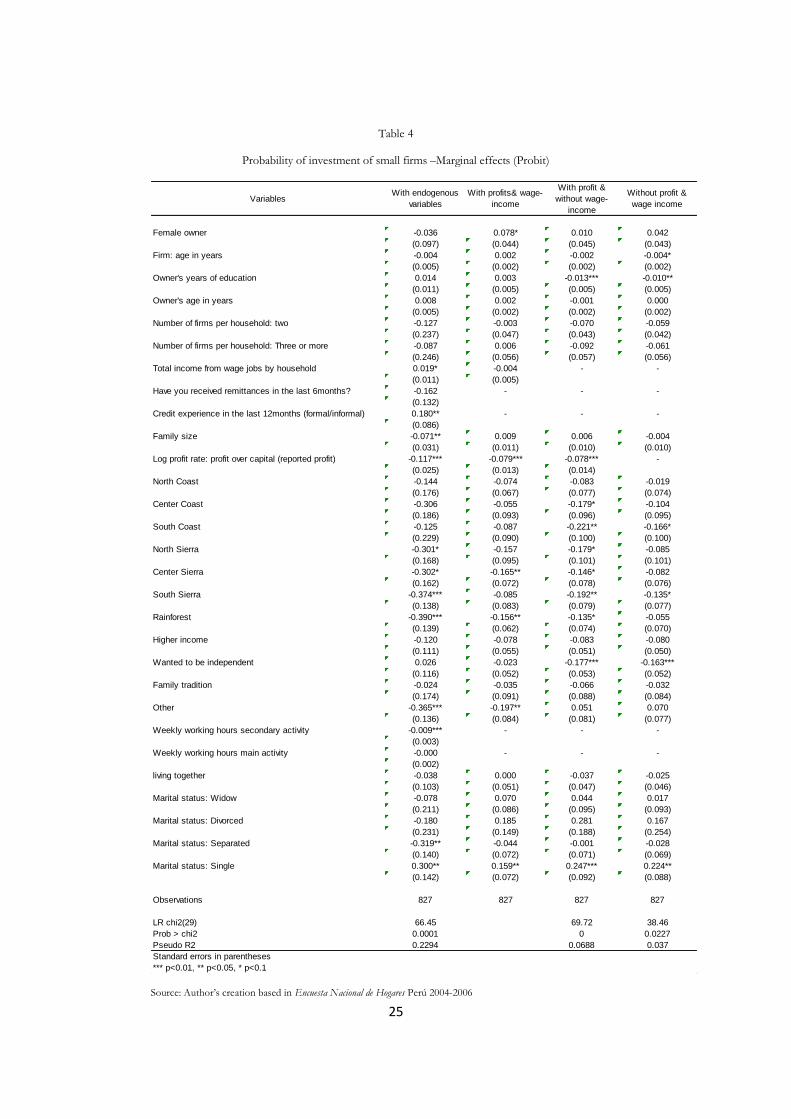
Table 3 and 4 shows the results of the specification calculating the probability of investing of small and single-person firms. I present specifications including and not including potentially endogenous variables. Focusing on statistically significant ones, the firm’s determinants to invest or not, are those answering to their regional location, the reasons for creating the firm, the owner’s marital status, the profit rate and in a lower percentage having credit experience, family size, the household’s total wage-income and owner’s characteristics as education and age. The specification for single-person firms has a higher explanatory power than that one of small firms however, both are statistically significant at one and ten percent respectively.
The probability of investing for single-person firms decreases when the firm is located in the Rainforest region, Northern Coast and in either part of the Highlands (Sierra). This is compared to those living in the Metropolitan area of Lima. As well, non-specified reasons for creating the firm decrease in 35 to 19 percent the probability to invest compared to those opened-up as an employment alternative of the owner. It is plausible that those unspecified reasons are the ones answering to business opportunities identified by the owners given specific moment and business opportunity. Being a single owner increases the probability of investing in 32 percent while being separated decreases it in 33 percent.
Higher profit rates of single-person firms decrease their probability of investment ranging from 8 to 11 percent. Having recent credit experience increases the probability of investing in almost 10 percent. An additional monetary unit in the household’s wage-income increases the probability of investing in 2 percent, proving that households rely in internal founds when undergoing investment activities, as was suggested by Tybout (1983).
The probability of investing for small firms is determined mainly by their regional location; reason of creation, profit rate and in lower percentages their household’s total wage-income and the owner’s years of education. There is a negative relationship between being located in the Rainforest, Highlands (Sierra) or Coast and the probability to invest which ranges between 32 to 38 percent. The probability decreases for those located in the South Highlands (Sierra). Similarly than for single-person firms, a higher profit rate decreases the probability of investing.
24
Table 3
Probability of investment of single-person firms –Marginal effects (Probit)
VariablesWith endogenous
variables
With profits&
wage-income
With profit &
without wage-
income
Without profit &
wage income
Female owner -0.036 0.078* 0.073* 0.041
(0.097) (0.044) (0.044) (0.042)
Firm: age in years -0.004 0.002 0.002 -0.000
(0.005) (0.002) (0.002) (0.002)
Owner's years of education 0.014 0.003 0.003 0.009*
(0.011) (0.005) (0.005) (0.005)
Owner's age in years 0.008 0.002 0.002 0.003
(0.005) (0.002) (0.002) (0.002)
Number of firms per household: two -0.127 -0.003 0.001 0.010
(0.237) (0.047) (0.047) (0.044)
Number of firms per household: Three or more -0.087 0.006 0.013 0.024
(0.246) (0.056) (0.056) (0.053)
Total income from wage jobs by household 0.019* -0.004 - -
(0.011) (0.005)
Have you received remittances in the last 6months? -0.162 - - -
(0.132)
Credit experience in the last 12months (formal/informal) 0.180** - - -
(0.086)
Family size -0.071** 0.009 0.005 0.002
(0.031) (0.011) (0.011) (0.010)
Log profit rate: profit over capital (reported profit) -0.117*** -0.079*** -0.079***
(0.025) (0.013) (0.013)
North Coast -0.144 -0.074 -0.071 -0.037
(0.176) (0.067) (0.067) (0.064)
Center Coast -0.306 -0.055 -0.053 -0.036
(0.186) (0.093) (0.093) (0.090)
South Coast -0.125 -0.087 -0.083 -0.022
(0.229) (0.090) (0.091) (0.087)
North Sierra -0.301* -0.157 -0.150 -0.069
(0.168) (0.095) (0.095) (0.093)
Center Sierra -0.302* -0.165** -0.163** -0.069
(0.162) (0.072) (0.072) (0.070)
South Sierra -0.374*** -0.085 -0.081 -0.025
(0.138) (0.083) (0.082) (0.079)
Rainforest -0.390*** -0.156** -0.150** -0.090
(0.139) (0.062) (0.062) (0.059)
Higher income -0.120 -0.078 -0.076 -0.054
(0.111) (0.055) (0.055) (0.051)
Wanted to be independent 0.026 -0.023 -0.023 -0.005
(0.116) (0.052) (0.052) (0.051)
Family tradition -0.024 -0.035 -0.038 -0.027
(0.174) (0.091) (0.091) (0.086)
Other -0.365*** -0.197** -0.195** -0.134
(0.136) (0.084) (0.084) (0.085)
Weekly working hours secondary activity -0.009*** - -
(0.003) -
Weekly working hours main activity -0.000 - -
(0.002)
Marital status: living together -0.038 0.000 0.003 -0.019
(0.103) (0.051) (0.051) (0.048)
Marital status: Widow -0.078 0.070 0.074 0.036
(0.211) (0.086) (0.086) (0.083)
Marital status: Divorced -0.180 0.185 0.168 0.093
(0.231) (0.149) (0.151) (0.162)
Marital status: Separated -0.319** -0.044 -0.038 -0.070
(0.140) (0.072) (0.071) (0.067)
Marital status: Single 0.300** 0.159** 0.159** 0.166**
(0.142) (0.072) (0.072) (0.068)
Observations 1613 1613 1613 1613
LR chi2(29) 66.45 61.97 61.28 20.77
Prob > chi2 0.0001 0.0001 0 0.5954
Pseudo R2 0.2294 0.0642 0.0635 0.0204
Standard errors in parentheses
*** p<0.01, ** p<0.05, * p<0.1
Source: Author’s creation based in Encuesta Nacional de Hogares Perú 2004-2006
25
Table 4
Probability of investment of small firms –Marginal effects (Probit)
VariablesWith endogenous
variables
With profits& wage-
income
With profit &
without wage-
income
Without profit &
wage income
Female owner -0.036 0.078* 0.010 0.042
(0.097) (0.044) (0.045) (0.043)
Firm: age in years -0.004 0.002 -0.002 -0.004*
(0.005) (0.002) (0.002) (0.002)
Owner's years of education 0.014 0.003 -0.013*** -0.010**
(0.011) (0.005) (0.005) (0.005)
Owner's age in years 0.008 0.002 -0.001 0.000
(0.005) (0.002) (0.002) (0.002)
Number of firms per household: two -0.127 -0.003 -0.070 -0.059
(0.237) (0.047) (0.043) (0.042)
Number of firms per household: Three or more -0.087 0.006 -0.092 -0.061
(0.246) (0.056) (0.057) (0.056)
Total income from wage jobs by household 0.019* -0.004 - -
(0.011) (0.005)
Have you received remittances in the last 6months? -0.162 - - -
(0.132)
Credit experience in the last 12months (formal/informal) 0.180** - - -
(0.086)
Family size -0.071** 0.009 0.006 -0.004
(0.031) (0.011) (0.010) (0.010)
Log profit rate: profit over capital (reported profit) -0.117*** -0.079*** -0.078*** -
(0.025) (0.013) (0.014)
North Coast -0.144 -0.074 -0.083 -0.019
(0.176) (0.067) (0.077) (0.074)
Center Coast -0.306 -0.055 -0.179* -0.104
(0.186) (0.093) (0.096) (0.095)
South Coast -0.125 -0.087 -0.221** -0.166*
(0.229) (0.090) (0.100) (0.100)
North Sierra -0.301* -0.157 -0.179* -0.085
(0.168) (0.095) (0.101) (0.101)
Center Sierra -0.302* -0.165** -0.146* -0.082
(0.162) (0.072) (0.078) (0.076)
South Sierra -0.374*** -0.085 -0.192** -0.135*
(0.138) (0.083) (0.079) (0.077)
Rainforest -0.390*** -0.156** -0.135* -0.055
(0.139) (0.062) (0.074) (0.070)
Higher income -0.120 -0.078 -0.083 -0.080
(0.111) (0.055) (0.051) (0.050)
Wanted to be independent 0.026 -0.023 -0.177*** -0.163***
(0.116) (0.052) (0.053) (0.052)
Family tradition -0.024 -0.035 -0.066 -0.032
(0.174) (0.091) (0.088) (0.084)
Other -0.365*** -0.197** 0.051 0.070
(0.136) (0.084) (0.081) (0.077)
Weekly working hours secondary activity -0.009*** - - -
(0.003)
Weekly working hours main activity -0.000 - - -
(0.002)
living together -0.038 0.000 -0.037 -0.025
(0.103) (0.051) (0.047) (0.046)
Marital status: Widow -0.078 0.070 0.044 0.017
(0.211) (0.086) (0.095) (0.093)
Marital status: Divorced -0.180 0.185 0.281 0.167
(0.231) (0.149) (0.188) (0.254)
Marital status: Separated -0.319** -0.044 -0.001 -0.028
(0.140) (0.072) (0.071) (0.069)
Marital status: Single 0.300** 0.159** 0.247*** 0.224**
(0.142) (0.072) (0.092) (0.088)
Observations 827 827 827 827
LR chi2(29) 66.45 69.72 38.46
Prob > chi2 0.0001 0 0.0227
Pseudo R2 0.2294 0.0688 0.037
Standard errors in parentheses
*** p<0.01, ** p<0.05, * p<0.1
Source: Author’s creation based in Encuesta Nacional de Hogares Perú 2004-2006

26
Chapter 5 Conclusion
The present paper attempt to provide an analysis of the dynamics of small and medium-sized firms, approaching them directly through the analysis of the determinant of investment and firm survival. The data employed is an unbalanced household panel database of urban unregistered firms for the period 2004 to 2006 coming from the Peruvian National Household survey [Encuesta Nacional de Hogares (ENAHO)], which is annually conducted by the National Institute for Statistics and Information (INEI).
The determinants of investment and firm survival are estimated using a probit specification that links them to the individual characteristics of the entrepreneur and characteristics of the firm. Findings reveal that the determinants of investment are explained by the firms’ regional location, the owner’s reasons for creating the firm, his or her marital status, the profit rate and in a lower percentage having credit experience, the size of their family, the household’s total wage-income and characteristics as education and age of the owner. On the other hand, firms survival is determined by the owners’ and the firm’s age, the number of firms in the household and the firm’s size. However, it should be kept in mind the possible endogenous characteristics of some of these explanatory variables.
27
Appendices
Map A1
28
Table A2
Summary statistics by firm size
Obs Mean S.D Obs Mean S.D Obs Mean S.D Obs Mean S.D
Female owner 2482 0.533 0.499 1613 0.489 0.500 852 0.623 0.485 17 0.176 0.393
Firm: age in years 2482 7.747 9.171 1613 7.546 9.268 852 8.081 8.962 17 10.598 9.596
Owner's years of education 2482 8.622 4.469 1613 8.877 4.413 852 8.103 4.496 17 9.353 4.227
Owner's age in years 2482 41.148 13.634 1613 40.371 14.235 852 42.441 12.276 17 46.118 11.219
Log profit rate: profit over capital (reported profit) 2482 2.934 1.851 1613 3.075 1.896 852 2.754 1.781 17 2.359 1.295
Weekly working hours secondary activity 2482 16.313 13.271 1613 15.959 13.638 852 17.091 12.514 17 15.000 7.000
Weekly working hours main activity 2482 44.009 25.873 1613 40.262 25.284 852 50.862 25.569 17 54.412 26.387
Hires labor 2482 0.095 0.293 1613 0.000 0.000 852 0.264 0.441 17 0.882 0.332
Labour: has non paid labour, yes/no 2482 0.271 0.445 1613 0.000 0.000 852 0.794 0.404 17 0.529 0.514
Number of firms per household: two 2482 0.406 0.491 1613 0.403 0.491 852 0.414 0.493 17 0.412 0.507
Number of firms per household: Three or more 2482 0.227 0.419 1613 0.246 0.431 852 0.190 0.392 17 0.176 0.393
Total income from wage jobs by household (from main and secondary 2482 5.071 4.791 1613 5.279 4.771 852 4.705 4.795 17 2.608 4.198
Have you received remittances in the last 6months? 2482 0.103 0.304 1613 0.109 0.312 852 0.096 0.294 17 0.000 0.000
Credit experience in the last 12months (formal/informal) 2482 0.248 0.432 1613 0.245 0.430 852 0.254 0.436 17 0.235 0.437
Family size 2482 4.982 2.227 1613 4.892 2.268 852 5.138 2.119 17 5.176 2.128
Region
North Coast 2482 0.188 0.391 1613 0.190 0.393 852 0.186 0.390 17 0.176 0.393
Center Coast 2482 0.081 0.273 1613 0.088 0.283 852 0.065 0.247 17 0.294 0.470
South Coast 2482 0.051 0.220 1613 0.048 0.215 852 0.056 0.229 17 0.000 0.000
North Sierra 2482 0.037 0.190 1613 0.032 0.177 852 0.050 0.217 17 0.000 0.000
Center Sierra 2482 0.107 0.309 1613 0.098 0.297 852 0.126 0.332 17 0.118 0.332
South Sierra 2482 0.106 0.307 1613 0.089 0.285 852 0.134 0.341 17 0.000 0.000
Rainforest 2482 0.213 0.410 1613 0.218 0.413 852 0.209 0.407 17 0.294 0.470
Metropolitan Lima 2482 0.217 0.412 1613 0.236 0.425 852 0.174 0.379 17 0.118 0.332
Reason for firm creation
Did not find work 2482 0.338 0.473 1613 0.358 0.480 852 0.299 0.458 17 0.235 0.437
Higher income 2482 0.312 0.464 1613 0.303 0.460 852 0.331 0.471 17 0.294 0.470
Wanted to be independent 2482 0.239 0.426 1613 0.227 0.419 852 0.257 0.437 17 0.471 0.514
Family tradition 2482 0.057 0.232 1613 0.056 0.231 852 0.059 0.236 17 0.000 0.000
Other 2482 0.055 0.227 1613 0.055 0.228 852 0.054 0.227 17 0.000 0.000
Marital status
living together 2482 0.261 0.440 1613 0.250 0.433 827 0.281 0.450 17 0.353 0.493
Marital status: Married 2482 0.399 0.490 1613 0.353 0.478 827 0.493 0.500 17 0.412 0.507
Marital status: Widow 2482 0.044 0.206 1613 0.048 0.213 827 0.036 0.187 17 0.059 0.243
Marital status: Divorced 2482 0.005 0.072 1613 0.007 0.082 827 0.002 0.049 17 0.000 0.000
Marital status: Separated 2482 0.107 0.309 1613 0.112 0.315 827 0.097 0.296 17 0.118 0.332
Marital status: Single 2482 0.183 0.386 1613 0.231 0.421 827 0.091 0.287 17 0.059 0.243
Single-person firms Small Medium-sizedAll sizeVariables
Source: Author’s creation based in Encuesta Nacional de Hogares Perú 2004-2006
29
Table A3
Summary statistics of firms which became inactive in 2004 and 2005 and those remaining active until 2006
Obs Mean S.D Obs Mean S.D Obs Mean S.D
Female owner 1253 0.516 0.500 426 0.545 0.499 803 0.552 0.498
Firm: age in years 1236 6.437 8.424 426 7.872 9.640 803 9.710 9.670
Owner's years of education 1253 9.048 4.499 426 8.817 4.390 803 7.854 4.368
Owner's age in years 1253 38.830 13.846 426 41.716 14.130 803 44.465 12.261
Log profit rate: profit over capital (reported profit) 1253 3.159 1.893 426 2.789 1.878 803 2.741 1.760
labour: hires yes/no 1253 0.082 0.274 426 0.107 0.309 803 0.109 0.312
Labour: has non paid labour, yes/no 1253 0.210 0.408 426 0.251 0.434 803 0.375 0.485
Labor size 1253 1.438 0.858 426 1.566 1.113 803 1.772 1.165
Weekly working hours secondary activity 1253 16.554 13.672 426 15.826 13.509 803 16.067 12.271
Weekly working hours main activity 1253 39.711 25.085 426 46.099 26.915 803 49.606 25.340
Numer of firms in the household: two 1253 0.409 0.492 426 0.383 0.487 803 0.412 0.493
Numer of firms in the household: three or more 1253 0.253 0.435 426 0.237 0.426 803 0.182 0.386
Total income from wage jobs by household 1253 5.644 4.765 426 4.422 4.753 803 4.519 4.748
Have you received remittances in the last 6months? 1253 0.105 0.306 426 0.115 0.319 803 0.095 0.293
Credit experience in the last 12months (formal/informal) 1253 0.231 0.422 426 0.286 0.453 803 0.254 0.436
Family size 1253 5.275 2.353 426 4.660 2.075 803 4.697 2.038
Region
North Coast 1253 0.175 0.380 426 0.176 0.381 803 0.214 0.411
Center Coast 1253 0.092 0.289 426 0.073 0.260 803 0.070 0.255
South Coast 1253 0.045 0.207 426 0.059 0.235 803 0.056 0.230
North Sierra 1253 0.032 0.176 426 0.045 0.207 803 0.042 0.201
Center Sierra 1253 0.094 0.292 426 0.094 0.292 803 0.133 0.340
South Sierra 1253 0.111 0.314 426 0.127 0.333 803 0.086 0.280
Joungle (selva) 1253 0.201 0.401 426 0.235 0.424 803 0.220 0.415
Metropolitan Lima 1253 0.251 0.434 426 0.192 0.395 803 0.178 0.383
Reason for firm creation
Did not find work 1235 0.343 0.475 422 0.329 0.471 803 0.333 0.472
Higher income 1235 0.319 0.466 422 0.310 0.463 803 0.303 0.460
Wanted to be independent 1235 0.218 0.413 422 0.254 0.436 803 0.263 0.440
Family tradition 1235 0.062 0.240 422 0.050 0.218 803 0.054 0.226
Other 1235 0.058 0.234 422 0.057 0.232 803 0.048 0.213
Marital status
Living together 1253 0.252 0.434 426 0.263 0.441 803 0.275 0.447
Maried 1253 0.342 0.475 426 0.406 0.492 803 0.484 0.500
Widow 1253 0.038 0.190 426 0.052 0.222 803 0.051 0.220
Divorced 1253 0.002 0.040 426 0.009 0.097 803 0.009 0.093
Separated 1253 0.112 0.315 426 0.099 0.298 803 0.105 0.306
Single 1253 0.255 0.436 426 0.171 0.377 803 0.076 0.265
Became inactive in 2004 Became inactive in 2005 Remained active until 2006Variables
Source: Author’s creation based in Encuesta Nacional de Hogares Perú 2004-2006
References
Abel, A.B. and J.C. Eberly (1994) 'A Unified Model of Investment Under Uncertainty', The American Economic Review 84(5): 1369-1384.
Bigsten, A., P. Collier, S. Dercon, M. Fatchamps, B. Gauthier and J.W. Gunning (2003) 'Credit constraints in manufacturing enterprises in Africa', Journal of African Economies 12(1): 104-125.
Bigsten, A., P. Collier, S. Dercon, B. Gauthier, J.W. Gunning, A. Isaksson et al. (1999) 'Investment in Africa's Manufacturing Sector: A Four Country Panel Data Analysis', Oxford Bulletin of Economics and Statistics 61(4): 489-512.
Bigsten, A. and M. Gebreeyesus (2007) 'The Small, the Young, and the Productive: Determinants of Manufacturing Firm Growth in Ethiopia', Economic Development and Cultural Change 55(4): 813-840.
Bond, S. and C. Meghir (1994) 'Dynamic Investment Models and the Firm's Financial Policy', The Review of Economic Studies 61(2): 197-222.
Burki, A. and D. Terrell (1998) 'Measuring Production Efficiency of small firms in Pakistan', World Development 26(1): 155-169.
Carrasco, R. (1999) 'Transitions to and from Self-Employment in Spain: An Empirical Analysis', Oxford Bulletin of Economics and Statistics 61(3): 315-341.
Cunningham, W.V. and W.F. Maloney (2001) 'Heterogeneity among Mexico's Microenterprises: An Application of Factor and Cluster Analysis', Economic Development and Cultural Change 50(1): 131-156.
de Mel, S., D. McKenzie and C. Woodruff (2008) 'Returns to Capital in Microenterprises: Evidence from a Field Experiment*', Quarterly Journal of Economics 123(4): 1329-1372.
Dixit, A.K. and R.S. Pindyck (1994) Investment under uncertainty. New Jersey: Princeton University.
Evans, D. and B. Jovanovic (1989) 'An Estimated Model of Entrepreneurial Choise under Liquidity Constraints', Journal of Political Economy 97(4): 808-827.
Fajnzylber, P., W. Maloney and G.M. Rojas (2006) 'Microenterprise Dynamics in Developing Countries: How Similar are They to
31
Those in the Industrialized World? Evidence from Mexico', The World Bank Economic Review 20(3): 389'419.
Grimm, M. and I. Gunther (2006) 'Inter- and Intra-household Linkages Between the Informal and Formal Sector: A Case Study for Urban Burkina Faso', in B. Guha-Khasnobis et al. (eds), Informal Labor Markets and Development (pp. 155-179). London: Palgrave Macmillan.
Gujarati, D.N. (2003) Basic Econometrics (4th ed.). New York: McGraw-Hill.
Harris, J.R. and M.P. Todaro (1970) 'Migration, Unemployment and Development: A Two-Sector Analysis', The American Economic Review 60(1): 126-142.
ILO (1972) Employment, Incomes and Equality: A strateg for Increasing Productive Employment in Kenya. International Labour Office.
INEI (2004) Ficha Técnica: Encuesta Nacional de Hogares sobre Condiciones de Vida y Pobreza. Instituto Nacional de Estadística e Informática.
Jorgenson, D.W. (1963) 'Capital Theory and Investment Behavior', The American Economic Review 53(2): 247-259.
Jovanovic, B. (1979) 'Job Matching and the Theory of Turnover', Journal of Polical Economy 87(5): 972-990.
Kantis, H., P. Angelli and V.M. Koening (2004) Desarrollo emprendedor-América Latina y la experiencia internacional. Inter-American Development Bank.
Kuper, G.H. (1998) 'Review: Review of Jorgenson's Capital Theory and Investment Behaviour & Tax Policy and the Cost of Capital', The Economic Journal 108(451): 1876-1878.
Liedholm, C. (2002) 'Small Firm Dynamics: Evidence from Africa and Latin America', Small Business Economics 18(3): 225-240.
Liedholm, C. and D.C. Mead (eds) (1999) Small Enterprises and Economic Development. London: Routledge.
Maloney, W.F. (2004) 'Informality Revisited', World Development 32(7): 1159-1178.
McKenzie, D. and C. Woodruff (2008) 'Experimental Evidence on Returns to Capital and Access to Finance in Mexico', The World Bank Economic Review 22(3): 457-482.
Mead, D.C. and C. Liedholm (1998) 'The dynamics of micro and small enterprises in developing countries', World Development 26(1): 61-74.
Nichter, S. and L. Goldmark (2009) 'Small Firm Growth in Developing Countries', World Development 37(9): 1453-1464.

32
Schiffer, M. and B. Weder (2001) Firm size and the business environment: Worldwide survey reuslts. International Finance Corporation.
Shiferaw, A. (2006) Entry, survival, and growth of manufacturing firms in Ethiopia Institute of Social Studies
Soto, H.d. (ed.) (1989) The Other Path. NY: Harper and Row. Tybout, J.R. (1983) 'Credit Rationing and Investment Behavior in a
Developing Country', The Review of Economics and Statistics 65(4): 598-607.
WorldBank (2008) 'Informality: Exit and Exclusion'. Washington, D.C: World Bank.