london company market statistics report - insurance journal
TRANSCRIPT

London company market
Statistics ReportOctober 2020

Executive summary
● Gross premium income for the London company market in 2019 was £21.436bn. In addition, a further £6.197bn was identified as written in other offices outside London, but overseen and managed by London operations. Combining these two totals the overall intellectual and economic premium is £27.633bn.
● A total of £3.972bn was underwritten via delegated authority arrangements.
● Premium underwritten in London is still mostly made up of direct/facultative placements (76%) with treaty business accounting for 24%. For business written elsewhere, but ‘controlled’ by London the picture is now different with direct/facultative at 55% and treaty up to 45%. Non-treaty income overall breaks down as 68% direct placements and 32% facultative.
● Political risk (£0.261bn), trade credit (£0.243bn) and standalone cyber (£0.253bn) are identified as separate classes of business for the first time in this year’s London company market statistics report. Property remains the largest class of business (£5.365bn) followed by liability (£3.575bn).
● Marine, professional lines and aviation have all also recorded noticeable rates of growth over the past 12 months of respectively 11.3%, 15.8% and 37.3%.
● There has been a growth in premium written in London from all geographical regions, except for continental Europe. For controlled business, written outside London but overseen and managed by operations in the City, there has been a 60% drop in premium sourced from continental Europe.
● Company restructuring necessitated by Brexit has meant large amounts of premium (estimated at £4.508bn) that were previously written in across Europe and reported back to London are now recorded by continental operations instead.
● Without Brexit-related reorganisation it is likely that this year’s report would be publishing a premium income for the London company market in 2019 in excess of £32bn, rather than the actual figure of £27.633bn.
Australia
Introduction
Welcome to the tenth annual edition of the International Underwriting Association’s London Company Market Statistics Report. When we first published this research it was a new departure. Questions were often asked about the size and income of the international insurance and reinsurance firms operating in London’s unique global hub, but no definitive answer could be given. Figures for the Lloyd’s marketplace, with its self-regulatory structure, have always been available, of course. Known premiums handled by London’s central processing service, Xchanging Ins-sure, also gave an indication of our sector’s overall scale. Yet no central data existed for the dozens of companies operating independently in the London Market. Many IUA members are branch offices of large multinational organisations, writing business against their parent company’s capital. They report to a home state regulator and may not separately identify London Market business in their published accounts.
Thus, in 2011 the IUA embarked on its own data collection exercise, inviting all its member firms to submit premium income results which could be aggregated to provide a comprehensive assessment of the London company market. Over subsequent years this annual survey has been expanded and enhanced to provide more detailed analysis and insight. It is now a well-regarded and keenly anticipated research project that has played an important role in promoting the strength of our market and its contribution to the UK economy.
That market has certainly changed significantly over the decade in which we have been studying it. There has been substantial growth, from a total of £19.620bn in 2010 to £27.633bn for 2020. The make-up of market participants has also altered, as illustrated earlier this year in the London Market Group’s London Matters report. The amount of capital invested by almost all regions outside the UK has grown as international insurers have sought to widen their portfolios by including more exposure to the specialist risks that come to London. There has been consolidation with the top ten carriers increasing their share of market premium. Companies are also increasingly operating in both the Lloyd’s and company markets. The share of premium accounted
for by firms operating only in the company market has remained relatively stable, dropping from 24% to 21% according to London Matters. Yet the contribution of Lloyd’s only entities has fallen from 41% to only 12% whilst those with a dual platform have almost doubled their presence from 35% to 67% of total premium.
Throughout these changes we have continued to track the premium earned by IUA members. In recent years we have looked, in particular, for any impact as a result of organisational changes necessitated by Brexit. Our 2017 report showed that premium of £1.554bn was earned from continental Europe by companies either UK headquartered or UK subsidiaries of parent companies in a third country outside Europe. The following year we reported that premium of £7.757bn was written by branch operations likely to be subject to the UK Government’s Temporary Permissions Regime before transitioning to third country branches or subsidiaries. This year’s report, however, is the first to illustrate a material impact on income earned as London companies have established new operating models in order to continue serving international clients post-Brexit.
We look forward to continuing our survey of premiums earned by the London company market in the years ahead. In the meantime I hope you find the results and conclusions from this year’s study useful and engaging.
Dave Matcham Chief Executive International Underwriting Association
Pho
to J
ohn
Lock
woo
d.
Fro
nt c
over
pho
to P
hoen
ix H
an.
All
phot
os s
ourc
ed fr
om U
nspl
ash
London Company Market Statistics Report 1
For the London Company Market Statistics Report 2020 the IUA has once again conducted its own comprehensive survey of insurance and reinsurance firms conducting business in the city. Members of the association were asked to complete a data template detailing their premium income over the previous 12 months. The following definition was used to describe business covered by the survey:
London Market slip business written through brokers or direct with clients and any other risks which could be categorised as large commercial/wholesale risks, eg global programme business or delegated authority business through coverholders or managing general agents.
Companies were also asked to identify additionally any ‘controlled premium’ in order to present the most comprehensive picture of London Market activity. This is defined as income written in overseas or regional UK offices, but subject to oversight and management by London operations. The inclusion of such premium allows us to present the overall intellectual and economic premium generated by the market.
An important change to this year’s London Company Market Statistics Report is the introduction of more detailed class of business breakdowns. Separate categories were added to our data template for standalone cyber, political risk, trade credit and professional indemnity business. In previous years we have recorded cyber liability premium. In order to capture the full range of this expanding class, however, we have now requested all standalone cyber business written as a dedicated policy outside traditional classes, covering both first party and third party risks. Political risk and trade credit are two separate new categories for this report. Our definition of professional lines has been expanded. In addition to directors and officers business, professional indemnity and errors and omissions, it now also specifies financial institutions business and construction professional indemnity.
The data template for 2020 was also redesigned to make it much easier for companies to complete, with colour-coded boxes highlighting different data sets
required. In total statistics from 73 firms have been collected and aggregated for this publication.
In addition to the class of business breakdowns requested, companies were also asked to categorise premium according to placement type with an income split between treaty and direct/facultative business. This conforms to general London Market practice where it is usual to combine direct and facultative placements for reporting purposes. In order to provide a more detailed analysis a simple percentage split between direct and facultative contracts for total overall premium was also requested.
Companies were given the option of providing data sets in pounds sterling, US dollars or Euros. Where necessary figures were then converted to pounds sterling using agreed exchange rates of US$1.28 = £1 and ¤1.13 = £1. These rate represent yearly averages throughout 2019.
In a limited number of cases where data returns have not been received from individual companies we have used figures from business processed by the London Market’s central business processing service, Xchanging Ins-sure, or data from returns made in previous years.
Methodology
Cyber, political risk, trade credit and professional indemnity have all been added as separate business categories for this year’s report
Pho
to J
erem
y B
isho
p
2 The International Underwriting Association

The following guidance notes were provided to companies for assistance in completing the data submission breakdowns by class of business and geographical territory.
Class of business breakdownPlease allocate your premium to the class of business category that you feel it is best described by.
Property Includes engineering, but not construction
ConstructionConstruction (or builders’ risk insurance) is not included under property, but identified as a separate class
LiabilityPlease enter a total figure for all liability business in this field (includes employers’ and public liability, medical malpractice etc). In addition please, if possible, breakdown this total liability figure to identify the amount of business in the following sub categories:
•Employers’liability•Publicliability•Environmentalliability
NB. The total liability figure may be higher than the sum of the three sub categories if your company is also writing other liability business which does not fit into these sub categories.
Professional linesPlease enter a total figure for all professional lines business in this field. In addition, if possible, breakdown this total professional lines figure to identify the amount of business in the following sub categories:
•DirectorsandOfficers(D&O)•ErrorsandOmissions(E&O)•FinancialInstitutions(FI)•ProfessionalIndemnity(PI)•ConstructionProfessionalIndemnity
NB. The total liability figure may be higher than the sumoffivesubcategoriesifyourcompanyisalsowriting other professional lines business which does not fit into these sub categories.
Accident and HealthAllaccidentandhealthbusinesscoveringdisease,accidental injury, accidental death, and related health expenses
CyberAll standalone cyber business written as a dedicated policy outside traditional classes, coveringbothfirstpartyandthirdpartyrisks
Political RiskAll political risk business for losses caused by governmentactionsand/orpoliticalperils,including,forexample,politicalviolenceandterrorism,warandcivilwar,currencyinconvertibility
Trade CreditIncludes credit risk and contract frustration, non-paymentandnon-delivery,pre-shipmentandpost-shipment insurance
MarineAll marine business including hull, cargo, energy, liability, specie and war risks
AviationAllaviationbusinessincludinghull,publicliability,passenger liability, aerospace
MotorIncludes fleet and large single risks
OtherIfnoneofthesixnamedclassesabovematchinany way then please allocate premium to the ‘other’ category.
Geographical breakdownPlease allocate your premium to the geographical region that you feel it is best described by. When making this allocation please use the appropriate identifier in accordance with your normal procedures, for example, address of the insured, location of the risk itself, location of the cedent and, for global programme business, location of the client’s headquarters.
USA
Results
London £bn
Controlled £bn
London+ Controlled
£bn2010 15.110 4.510 19.620
2011 16.044 5.462 21.506
2012 16.370 7.762 24.132
2013 15.467 7.464 22.932
2014 15.518 6.917 22.435
2015 16.031 6.038 22.068
2016 16.034 6.691 22.725
2017 18.331 7.984 26.314
2018 19.559 8.877 28.437
2019 21.436 6.197 27.633
20180
2
4
6
8
10
12
14
16
18
20Elsewhere
London
2019
20
18
16
14
12
10
8
6
4
2
0
London
Elsewhere
Prem
ium
(£bn
)
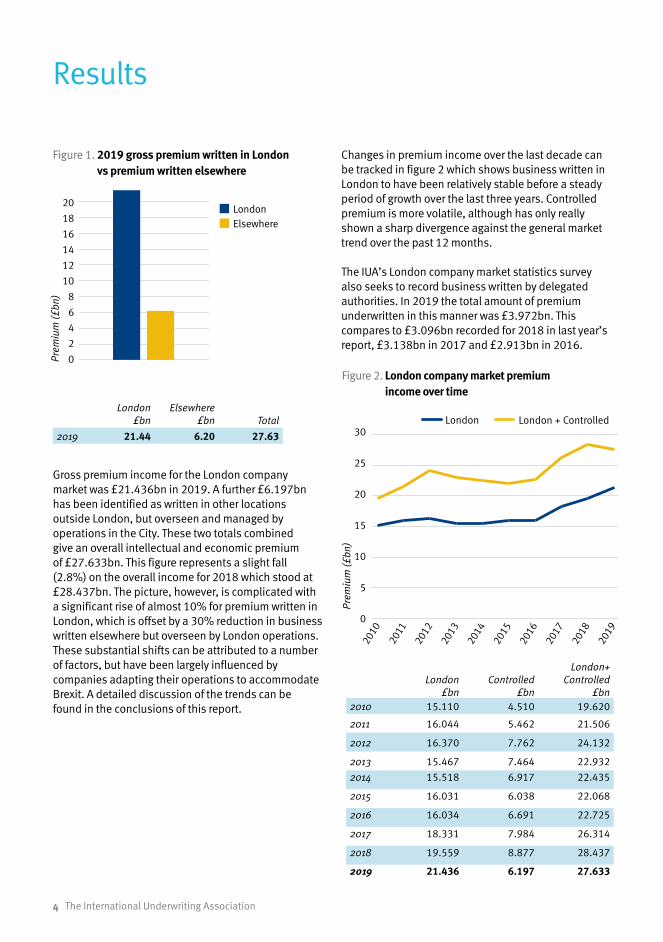
Figure 1. 2019 gross premium written in London vs premium written elsewhere
Gross premium income for the London company market was £21.436bn in 2019. A further £6.197bn has been identified as written in other locations outside London, but overseen and managed by operations in the City. These two totals combined give an overall intellectual and economic premium of £27.633bn. This figure represents a slight fall (2.8%) on the overall income for 2018 which stood at £28.437bn. The picture, however, is complicated with a significant rise of almost 10% for premium written in London, which is offset by a 30% reduction in business written elsewhere but overseen by London operations. These substantial shifts can be attributed to a number of factors, but have been largely influenced by companies adapting their operations to accommodate Brexit. A detailed discussion of the trends can be found in the conclusions of this report.
London £bn
Elsewhere £bn Total
2019 21.44 6.20 27.63
Figure 2. London company market premium income over time
0
5
10
15
20
25
30 London+Controlled
London
2019201820172016201520142013201220112010
Prem
ium
(£bn
)
30
25
20
15
10
5
0
London + ControlledLondon
Changes in premium income over the last decade can be tracked in figure 2 which shows business written in London to have been relatively stable before a steady period of growth over the last three years. Controlled premium is more volatile, although has only really shown a sharp divergence against the general market trend over the past 12 months.
The IUA’s London company market statistics survey also seeks to record business written by delegated authorities. In 2019 the total amount of premium underwritten in this manner was £3.972bn. This compares to £3.096bn recorded for 2018 in last year’s report, £3.138bn in 2017 and £2.913bn in 2016.
2010
2011
2012
2013
2014
2015
2016
2017
2018
2019
4 The International Underwriting Association
London £bn
Controlled £bn
London+ Controlled
£bn2010 15.110 4.510 19.620
2011 16.044 5.462 21.506
2012 16.370 7.762 24.132
2013 15.467 7.464 22.932
2014 15.518 6.917 22.435
2015 16.031 6.038 22.068
2016 16.034 6.691 22.725
2017 18.331 7.984 26.314
2018 19.559 8.877 28.437
2019 21.436 6.197 27.633
Direct/Facultative Treaty Total
London £bn % £bn % £bn2010 11.911 79 3.216 21 15.127
2011 12.727 79 3.324 21 16.051
2012 12.812 78 3.557 22 16.370
2013 12.317 80 3.151 20 15.467
2014 11.969 77 3.549 23 15.518
2015 12.170 76 3.860 24 16.031
2016 12.120 76 3.914 24 16.034
2017 14.150 77 4.181 23 18.331
2018 15.178 78 4.381 22 19.559
2019 16.323 76 5.113 24 21.436
Direct/Facultative Treaty Total
Controlled £bn % £bn % £bn2012 5.809 75 1.952 25 7.762
2013 5.959 80 1.505 20 7.464
2014 5.606 81 1.310 19 6.917
2015 4.796 79 1.242 21 6.038
2016 5.046 75 1.644 25 6.691
2017 6.422 80 1.562 20 7.984
2018 6.249 70 2.628 30 8.877
2019 3.438 55 2.749 45 6.197
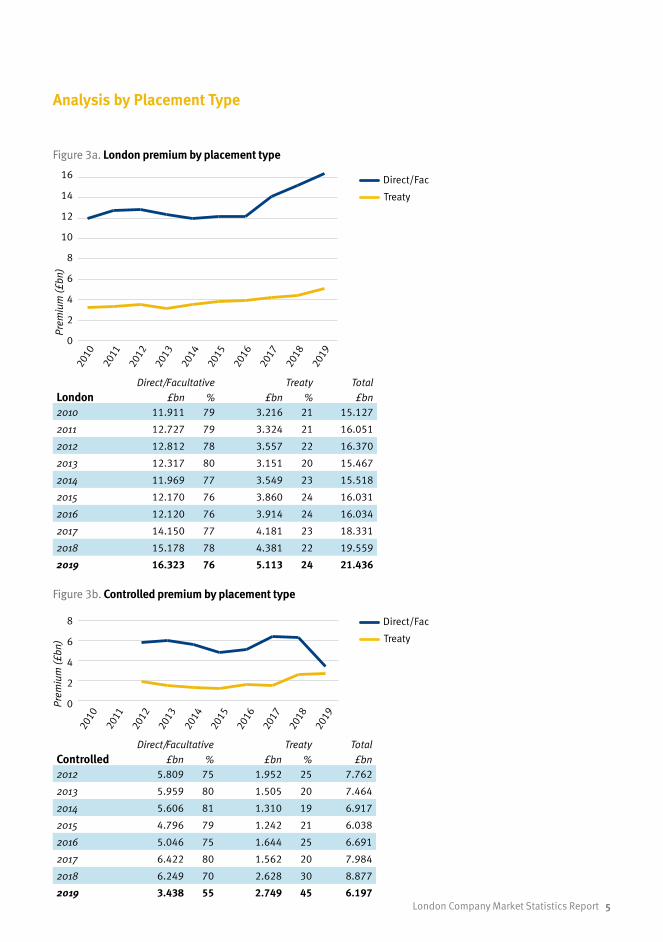
Analysis by Placement Type
Figure 3a. London premium by placement type
0
2
4
6
8
10
12
14
16
18Treaty
Direct/Fac
2019201820172016201520142013201220112010
Prem
ium
(£bn
)
16
14
12
10
8
6
4
2
0
TreatyDirect/Fac
TreatyDirect/Fac
Figure 3b. Controlled premium by placement type
TreatyDirect/Fac
TreatyDirect/Fac
0
2
4
6
8
10Treaty
Direct/Fac
2019201820172016201520142013201220112010
Prem
ium
(£bn
)
8
6
4
2
0
2010
2011
2012
2013
2014
2015
2016
2017
2018
2019
2010
2011
2012
2013
2014
2015
2016
2017
2018
2019
London Company Market Statistics Report 5

Direct %
Facultative %
2011 58 42
2012 66 34
2013 63 37
2014 70 30
2015 62 38
2016 65 35
2017 65 35
2018 71 29
2019 68 32
Over the ten year period that the London Company Market Statistics Report has been published facultative/direct premiums have consistently accounted for the majority of income. In 2019 this remained the case for business written in London where facultative/direct placements were £16.323bn or 76% compared to £5.113bn or 24% for treaty placements. However, for controlled business, written outside London but overseen by London operations, the picture is now quite changed. The overall decline in controlled premium seen during 2019 was concentrated in facultative/direct placements which saw a dramatic fall from £6.249bn in 2018 to just £3.438bn in 2019. Controlled treaty business actually saw a small amount of growth, from £2.628bn in 2018 to £2.759bn in 2019. As a result facultative/direct placements now account for only 55% of controlled London company market premium with treaty at 45%.
Recording direct and facultative placements together is usual London Market practice and is followed in this survey in order make it easier for companies to complete our data templates. A simple overall percentage split between these two contract types is, however, also requested. In 2019 this showed direct placements accounting for 68% of all non-treaty premium and facultative placements representing the remaining 32%.
Figure 3c. Direct and facultative premium over time
% s
plit
100
80
60
40
20
00
10
20
30
40
50
60
70
80
90
100Facultative
Direct
201920182017201620152014201320122011
Direct Facultative
2011
2012
2013
2014
2015
2016
2017
2018
2019
6 The International Underwriting Association

Figure 4. 2019 gross premium by placement type
0
1
2
3
4
5Treaty
Direct/Fac
Other Motor Aviation Marine Trade CreditPolitical RiskCyberAccident & Health Prof Lines Liability Construction Property
Direct/Facultative Treaty
Prop
erty
Cons
truct
ion
Liab
ility
Prof
Line
sAc
cide
nt
& Hea
lthCy
ber
Polit
ical
Ris
kTr
ade
Cred
itM
arin
eAv
iatio
n
Mot
or
Other
Prem
ium
(£bn
)
5
4
3
2
1
0
2019Direct/Fac £bn Gross %
Treaty £bn Gross %
Total £bn Gross %
Property 4.111 77 1.253 23 5.365 25.0
Construction 0.486 93 0.034 7 0.520 2.4
Liability 2.819 79 0.756 21 3.575 16.7
Prof Lines 2.503 88 0.335 12 2.837 13.2
Accident & Health 0.692 91 0.068 9 0.760 3.6
Cyber 0.183 72 0.070 28 0.253 1.2
Political Risk 0.184 70 0.078 30 0.261 1.2
Trade Credit 0.203 84 0.040 16 0.243 1.1
Marine 2.144 69 0.956 31 3.100 14.5
Aviation 0.760 67 0.373 33 1.133 5.3
Motor 0.970 52 0.910 48 1.880 8.8
Other 1.267 84 0.241 16 1.508 7.0
Total 16.323 76 5.113 24 21.436 100.0
Our breakdown of premium income by placement type can also be examined at an individual class of business level in figure 4. This data refers only to business written in London and does not cover controlled premium. It shows that facultative/direct placements are especially prevalent in construction, professional lines, accident and health and trade credit where they make up well over 80% of total premiums. Treaty placements, meanwhile, are more common for the aviation, marine, political risk and cyber sectors where they represent around 30% of all business. For motor the proportion is even higher at close to half of total premium.
London Company Market Statistics Report 7
Analysis by Class of Business
Marine
Trade Credit
Other
Motor
Aviation
Accident & Health
Prof Lines
Liability
Construction
Political Risk
Cyber
Trade Credit
Property
1%2%
5% 25%
14%
4%
7%
9%
13%17%
Marine
Trade Credit
Other
Motor
Aviation
Accident & Health
Prof Lines
Liability
Construction
Political Risk
Cyber
Trade Credit
Property
1%2%
5% 25%
14%
4%
7%
9%
13%17%
Figure 5a. 2019 Gross premium by class of business
Figure 5b. 2019 Gross liability premium breakdown by placement type
Figure 5c. 2019 Gross professional lines premium breakdown by placement type
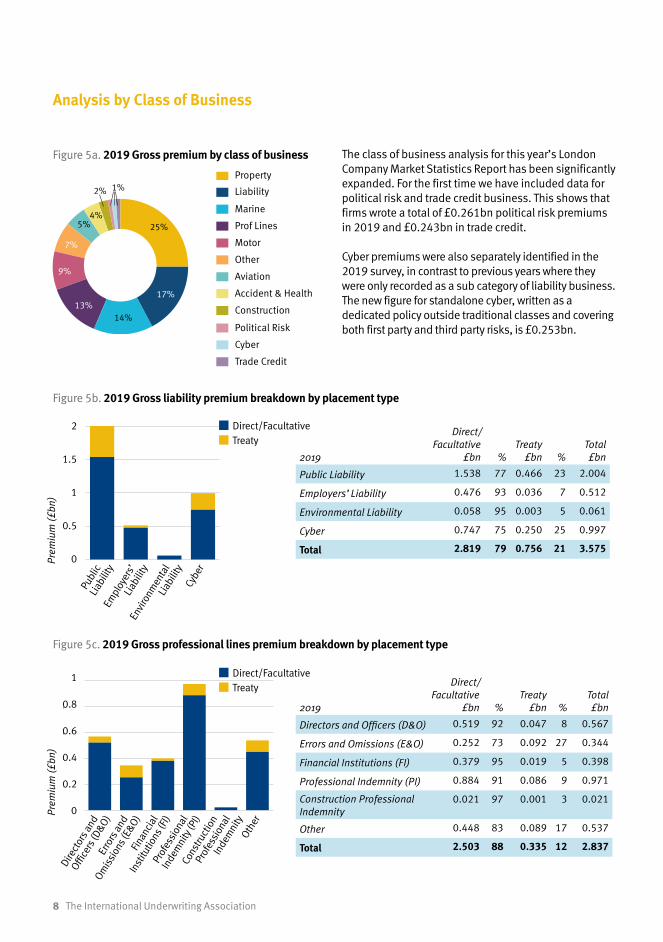
The class of business analysis for this year’s London Company Market Statistics Report has been significantly expanded. For the first time we have included data for political risk and trade credit business. This shows that firms wrote a total of £0.261bn political risk premiums in 2019 and £0.243bn in trade credit.
Cyber premiums were also separately identified in the 2019 survey, in contrast to previous years where they were only recorded as a sub category of liability business. The new figure for standalone cyber, written as a dedicated policy outside traditional classes and covering both first party and third party risks, is £0.253bn.
2019
Direct/ Facultative
£bn
%Treaty
£bn
%Total £bn
Public Liability 1.538 77 0.466 23 2.004
Employers’ Liability 0.476 93 0.036 7 0.512
Environmental Liability 0.058 95 0.003 5 0.061
Cyber 0.747 75 0.250 25 0.997
Total 2.819 79 0.756 21 3.575
2019
Direct/ Facultative
£bn
%Treaty
£bn
%Total £bn
Directors and Officers (D&O) 0.519 92 0.047 8 0.567
Errors and Omissions (E&O) 0.252 73 0.092 27 0.344
Financial Institutions (FI) 0.379 95 0.019 5 0.398
Professional Indemnity (PI) 0.884 91 0.086 9 0.971
Construction Professional Indemnity
0.021 97 0.001 3 0.021
Other 0.448 83 0.089 17 0.537
Total 2.503 88 0.335 12 2.837
0.0
0.5
1.0
1.5
2.0
2.5 Treaty
Direct/Fac
CyberEnvironmental liabilityEmployer's liabilityPublic liability
0.0
0.2
0.4
0.6
0.8
1.0 Treaty
Direct/Fac
OtherConstruction Professional IndemnityProfessional Indemnity (PI)Financial Institutions (FI)Errors and Omissions (E&O)Directors and Officers (D&O)
Publ
ic
Liab
ility
Empl
oyer
s’
Liab
ility
Envi
ronm
enta
l Li
abili
tyCy
ber
Dire
ctor
s and
Office
rs (D
&O)Er
rors
and
Omis
sion
s (E&
O)Fin
anci
al
Inst
itutio
ns (F
I)Pr
ofes
sion
al
Inde
mni
ty (P
I)Co
nstru
ctio
n
Prof
essi
onal
In
dem
nity
Other
Prem
ium
(£bn
)Pr
emiu
m (£
bn)
2
1.5
1
0.5
0
1
0.8
0.6
0.4
0.2
0
Direct/Facultative
Treaty
Direct/Facultative
Treaty
8 The International Underwriting Association
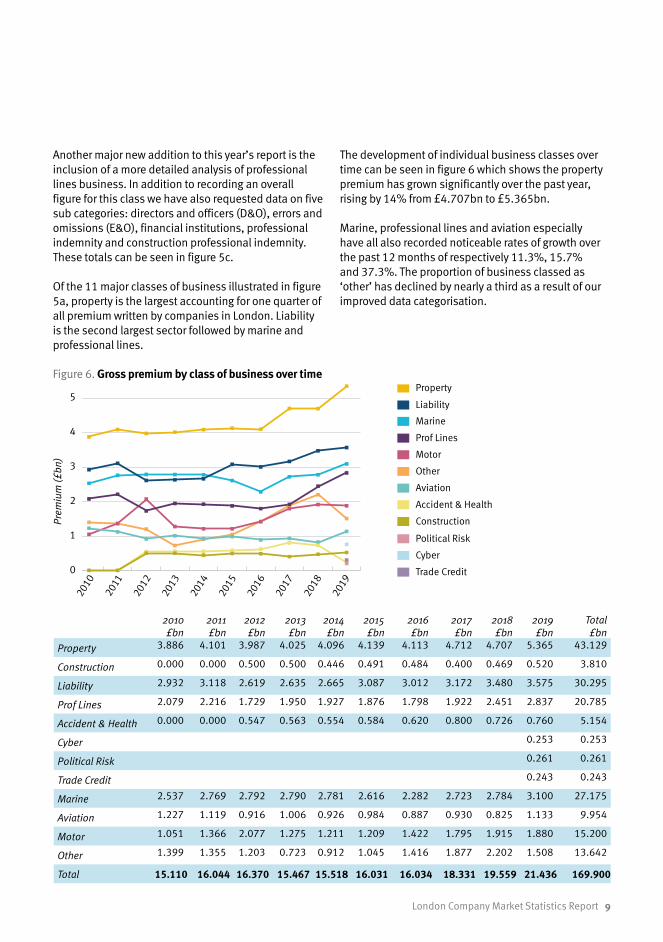
Figure 6. Gross premium by class of business over time
2010 £bn
2011 £bn
2012 £bn
2013 £bn
2014 £bn
2015 £bn
2016 £bn
2017 £bn
2018 £bn
2019 £bn
Total £bn
Property 3.886 4.101 3.987 4.025 4.096 4.139 4.113 4.712 4.707 5.365 43.129
Construction 0.000 0.000 0.500 0.500 0.446 0.491 0.484 0.400 0.469 0.520 3.810
Liability 2.932 3.118 2.619 2.635 2.665 3.087 3.012 3.172 3.480 3.575 30.295
Prof Lines 2.079 2.216 1.729 1.950 1.927 1.876 1.798 1.922 2.451 2.837 20.785
Accident & Health 0.000 0.000 0.547 0.563 0.554 0.584 0.620 0.800 0.726 0.760 5.154
Cyber 0.253 0.253
Political Risk 0.261 0.261
Trade Credit 0.243 0.243
Marine 2.537 2.769 2.792 2.790 2.781 2.616 2.282 2.723 2.784 3.100 27.175
Aviation 1.227 1.119 0.916 1.006 0.926 0.984 0.887 0.930 0.825 1.133 9.954
Motor 1.051 1.366 2.077 1.275 1.211 1.209 1.422 1.795 1.915 1.880 15.200
Other 1.399 1.355 1.203 0.723 0.912 1.045 1.416 1.877 2.202 1.508 13.642
Total 15.110 16.044 16.370 15.467 15.518 16.031 16.034 18.331 19.559 21.436 169.900
Another major new addition to this year’s report is the inclusion of a more detailed analysis of professional lines business. In addition to recording an overall figure for this class we have also requested data on five sub categories: directors and officers (D&O), errors and omissions (E&O), financial institutions, professional indemnity and construction professional indemnity. These totals can be seen in figure 5c.
Of the 11 major classes of business illustrated in figure 5a, property is the largest accounting for one quarter of all premium written by companies in London. Liability is the second largest sector followed by marine and professional lines.
The development of individual business classes over time can be seen in figure 6 which shows the property premium has grown significantly over the past year, rising by 14% from £4.707bn to £5.365bn.
Marine, professional lines and aviation especially have all also recorded noticeable rates of growth over the past 12 months of respectively 11.3%, 15.7% and 37.3%. The proportion of business classed as ‘other’ has declined by nearly a third as a result of our improved data categorisation.
0
1
2
3
4
5Other
Motor
Aviation
Marine
Accident & Health
Trade Credit
Political Risk
Cyber
Prof Lines
Liability
Construction
Property
2019201820172016201520142013201220112010
Marine
Other
Motor
Aviation
Accident & Health
Prof Lines
Liability
Construction
Political Risk
Cyber
Trade Credit
Property
0
1
2
3
4
5Other
Motor
Aviation
Marine
Accident & Health
Trade Credit
Political Risk
Cyber
Prof Lines
Liability
Construction
Property
2019201820172016201520142013201220112010
Marine
Other
Motor
Aviation
Accident & Health
Prof Lines
Liability
Construction
Political Risk
Cyber
Trade Credit
Property
Prem
ium
(£bn
)
5
4
3
2
1
0
2010
2011
2012
2013
2014
2015
2016
2017
2018
2019
London Company Market Statistics Report 9

Figure 7a. 2019 London gross premium by territory
Geographical Analysis
UK/Ireland
Australasia
Africa
Asia
Latin/South America
USA/Canada
Europe (excl UK/Ireland)
Australasia
Africa
Asia
Europe (Excl UK/Ireland
Latin/South America
USA/Canada
UK/Ireland
2%1%
55%
15%
16%
4%
7%
Australasia
Africa
Asia
Europe (Excl UK/Ireland
Latin/South America
USA/Canada
UK/Ireland
2%
35%
31%
22%4%
6%
Australasia
Africa
Asia
Europe (Excl UK/Ireland
Latin/South America
USA/Canada
UK/Ireland
1% 1%
50%
18%
7%9%
17%
4%
9%
Figure 7c. 2019 overall gross premium by territory (London + controlled)
Figure 7b. 2019 controlled gross premium by territory
2019 Total
£bn %
UK/ Ireland 11.697 55
USA/ Canada 3.432 16
Latin/ South America 0.927 4
Europe (excl UK/ Ireland) 3.145 15
Asia 1.555 7
Africa 0.368 2
Australasia 0.311 1
Total 21.436 100
2019 Total
£bn %
UK/ Ireland 2.190 35
USA/ Canada 1.342 22
Latin/ South America 0.245 4
Europe (excl UK/ Ireland) 1.952 31
Asia 0.351 6
Africa 0.025 0
Australasia 0.093 2
Total 6.197 100
2019Total £bn %
UK/ Ireland 13.887 50
USA/ Canada 4.774 17
Latin/ South America 1.172 4
Europe (excl UK/ Ireland) 5.097 18
Asia 1.907 7
Africa 0.393 1
Australasia 0.404 1
Total 27.633 100
10 The International Underwriting Association

Data for 2019 confirms that, as in previous years, business underwritten in London is largely sourced from the UK and Ireland, with these home territories representing 55% of the total. Europe and the USA/Canada account for the majority of the remainder, followed by Asia and then Latin/South America. Africa and Australasia each make up less than two per cent of the overall figure. Almost all territories have contributed to the growth in premium that business written in London has enjoyed over the past year. Both the USA/Canada and Asia have seen growth rates in excess of 25% (USA/Canada 26.9% from £2.705bn to £3.432bn and Asia 25.8% from £1.236bn to £1.555bn). Premium earned from the UK/Ireland, meanwhile, has risen by 6.5% from £10.981bn to £11.697bn. The one notable exception is continental Europe which has seen a decline in premium of 3.5%, from £3.258bn to £3.145bn.
For controlled business, written outside London but overseen and managed by operations in the City, this trend is even more pronounced. Here the amount of premium sourced from continental Europe has been slashed by an incredible 60% from £4.890bn to just £1.952bn. Australasia, Latin/South America and Asia all also saw a reduction in controlled premium, although much less dramatic. The amount of such business sourced from the USA/Canada, however, is now at £1.342bn, having increased by a remarkable one third from last year’s total of £0.803bn.
The amount of controlled premium sourced from continental Europe has been slashed by 60%
Pho
to K
imon
Mar
itz
Switzerland

Geographical Timeline Analysis
Prem
ium
(£bn
)
12
10
8
6
4
2
00
2
4
6
8
10
12Australasia
Africa
Asia
Europe (Excl UK/ Ireland)
Latin/ South America
USA/ Canada
UK/ Ireland
2019201820172016201520142013201220112010
Figure 8a. London gross premium by territory over time
London2010 £bn
2011 £bn
2012 £bn
2013 £bn
2014 £bn
2015 £bn
2016 £bn
2017 £bn
2018 £bn
2019 £bn
Total £bn
UK/ Ireland 8.745 9.482 9.442 8.011 8.196 8.745 8.700 10.433 10.981 11.697 94.433
USA/ Canada 1.933 2.054 1.752 2.103 2.202 2.321 2.284 2.555 2.705 3.432 23.341
Latin/ South America
0.678 0.721 0.743 0.675 0.750 0.665 0.613 0.613 0.830 0.927 7.216
Europe (excl UK/ Ireland)
2.082 2.104 2.627 2.754 2.611 2.727 2.775 2.964 3.258 3.145 27.047
Asia 1.182 1.176 1.075 1.336 1.166 1.057 1.167 1.254 1.236 1.555 12.205
Africa 0.319 0.301 0.376 0.290 0.311 0.291 0.291 0.268 0.307 0.368 3.122
Australasia 0.170 0.207 0.354 0.299 0.283 0.224 0.204 0.242 0.243 0.311 2.536
Total 15.110 16.044 16.370 15.467 15.518 16.031 16.034 18.331 19.559 21.436 169.900
2010
2011
2012
2013
2014
2015
2016
2017
2018
2019
UK/Ireland
Australasia
Africa
Asia
Latin/South America
USA/Canada
Europe (excl UK/Ireland)
12 The International Underwriting Association

Controlled2012 £bn
2013 £bn
2014 £bn
2015 £bn
2016 £bn
2017 £bn
2018 £bn
2019 £bn
Total £bn
UK/ Ireland 2.795 2.459 2.278 1.969 2.013 1.616 1.918 2.190 17.238
USA/ Canada 0.796 1.054 0.869 0.659 0.697 0.739 0.803 1.342 6.958
Latin/ South America 0.154 0.299 0.326 0.376 0.490 0.400 0.344 0.245 2.634
Europe (excl UK/ Ireland) 2.585 2.406 2.381 2.138 2.306 4.480 4.890 1.952 23.137
Asia 0.819 0.480 0.507 0.429 0.566 0.582 0.586 0.351 4.321
Africa 0.069 0.052 0.053 0.042 0.050 0.039 0.059 0.025 0.389
Australasia 0.545 0.714 0.502 0.425 0.569 0.128 0.277 0.093 3.254
Total 7.762 7.464 6.917 6.038 6.691 7.984 8.877 6.197 57.930
Prem
ium
(£bn
)
5.0
4.5
4.0
3.5
3.0
2.5
2.0
1.5
1.0
0.5
00.0
0.5
1.0
1.5
2.0
2.5
3.0
3.5
4.0
4.5
5.0Australasia
Africa
Asia
Europe (Excl UK/ Ireland)
Latin/ South America
USA/ Canada
UK/ Ireland
20192018201720162015201420132012
Figure 8b. Controlled gross premium by territory over time
2012
2013
2014
2015
2016
2017
2018
2019
UK/Ireland
Australasia
Africa
Asia
Latin/South America
USA/Canada
Europe (excl UK/Ireland)
London Company Market Statistics Report 13

2019
IUA Direct/Facultative
£bn
Lloyd’s Direct
£bn
IUA Property + Construction Lloyd’s Property
5.884 9.586
IUA Liability + Professional Lines + Accident & Health Lloyd’s Casualty
7.173 9.459
IUA Marine+ AviationLloyd’s Marine + Aviation + Transport + Energy
4.234 4.302
Motor 1.880 1.053
All Lloyd’s figures exclude reinsurance business
All IUA figures exclude company market business controlled by London but written elsewhere
Comparison with the Lloyd’s Market
The total premium for the London company market, as measured by this report, can be used to calculate an overall income figure for the wider London Market of £63.538bn. This is determined by adding our total of £27.633bn with Lloyd’s of London’s gross written premium income of £35.905, as published in its annual report.
Further comparison between the two markets is provided in figure 9. When considering this data it should be understood that Lloyd’s identifies direct business only for each class, separating all reinsurance into a separate category. The IUA figures cover both direct and facultative premium. Class of business totals for the IUA (unlike those for Lloyd’s) cover only premium written in London and not business written in any overseas offices.
Traditionally Lloyd’s has been the dominant destination in London for marine and aviation business, This year’s London Company Market Statistics Report shows that is no longer the case with the company market total for these two classes of business at £4.234bn now almost matching the Lloyd’s figure of £4.302bn. Motor business meanwhile is now more likely to be written in the company market where premium of £1.880 was recorded in 2019 compared to £1.053bn for Lloyd’s.
More direct property business is written in Lloyd’s than the company market (£9.586bn compared to £5.884bn). The same is true for liability/casualty premium although here the gap is narrower at £9.459bn against £7.173bn.
Figure 9. IUA and Lloyd’s premium by class of business
Pho
to M
icha
el B
acci
n
14 The International Underwriting Association

The amount of marine and aviation business written in the company market is now almost exactly equal to that conducted at Lloyd’s
Italy

Property Construction Liability Prof Lines Accident &
Health Cyber Political Risk Credit Risk Marine Aviation Motor Other Total
2019 £bn % £bn % £bn % £bn % £bn % £bn % £bn % £bn % £bn % £bn % £bn % £bn % £bn % 2019
UK/ Ireland 2.806 52 0.261 50 2.042 57 2.041 72 0.458 60 0.161 64 0.129 49 0.142 58 1.032 33 0.299 26 1.361 72 0.966 64 11.697 55 UK/ Ireland
USA/ Canada 1.069 20 0.114 22 0.690 19 0.250 9 0.184 24 0.040 16 0.027 10 0.007 3 0.648 21 0.095 8 0.076 4 0.232 15 3.432 16 USA/ Canada
Latin/ South America 0.262 5 0.015 3 0.131 4 0.065 2 0.002 0 0.007 3 0.009 3 0.004 2 0.294 9 0.108 10 0.005 0 0.025 2 0.927 4 Latin/ South America
Europe (excl UK/ Ireland) 0.678 13 0.040 8 0.454 13 0.284 10 0.097 13 0.024 9 0.041 16 0.048 20 0.655 21 0.232 20 0.423 23 0.169 11 3.145 15 Europe (excl UK/ Ireland)
Asia 0.344 6 0.060 12 0.164 5 0.121 4 0.015 2 0.016 6 0.035 13 0.034 14 0.346 11 0.330 29 0.013 1 0.077 5 1.555 7 Asia
Africa 0.124 2 0.016 3 0.034 1 0.014 0 0.002 0 0.003 1 0.019 7 0.002 1 0.067 2 0.055 5 0.001 0 0.032 2 0.368 2 Africa
Australasia 0.080 1 0.014 3 0.062 2 0.063 2 0.001 0 0.003 1 0.002 1 0.005 2 0.057 2 0.015 1 0.001 0 0.008 1 0.311 1 Australasia
Total 5.365 25 0.520 2 3.575 17 2.837 13 0.760 4 0.253 1 0.261 1 0.243 1 3.100 14 1.133 5 1.880 9 1.508 7 21.436 100 Total
% of total 25 2 17 13 4 1 1 1 14 5 9 7 100 % of total
Property Construction Liability Prof Lines Accident &
Health CyberPolitical
Risk Credit Risk Marine Aviation Motor Other Total
2018 £bn % £bn % £bn % £bn % £bn % £bn % £bn % £bn % £bn % £bn % £bn % £bn % £bn % 2018
UK/ Ireland 2.543 54 0.295 63 2.068 60 1.674 68 0.473 65 1.115 40 0.193 23 1.359 71 1.262 57 10.981 56 UK/ Ireland
USA/ Canada 0.805 17 0.067 14 0.594 17 0.249 10 0.124 17 0.484 18 0.066 8 0.094 5 0.221 10 2.705 14 USA/ Canada
Latin/ South America 0.220 5 0.023 5 0.128 4 0.082 3 0.002 0 0.267 9 0.065 8 0.007 0 0.036 2 0.830 4 Latin/ South America
Europe (excl UK/ Ireland) 0.746 16 0.023 5 0.477 13 0.302 12 0.111 15 0.524 19 0.226 27 0.434 23 0.417 19 3.258 17 Europe (excl UK/ Ireland)
Asia 0.249 5 0.042 10 0.147 4 0.086 4 0.013 2 0.272 10 0.225 27 0.017 1 0.184 8 1.236 6 Asia
Africa 0.090 2 0.012 3 0.026 1 0.017 1 0.001 0 0.068 2 0.038 5 0.000 0 0.055 3 0.307 2 Africa
Australasia 0.055 1 0.007 2 0.041 1 0.041 2 0.001 0 0.056 2 0.012 1 0.003 0 0.027 1 0.243 1 Australasia
Total 4.707 24 0.469 2 3.480 18 2.451 12 0.726 4 2.784 14 0.825 4 1.915 10 2.202 11 19.559 100 Total
% of total 24 2 18 12 4 14 4 10 11 100 % of total
Results Tables
16 The International Underwriting Association

Property Construction Liability Prof Lines Accident &
Health Cyber Political Risk Credit Risk Marine Aviation Motor Other Total
2019 £bn % £bn % £bn % £bn % £bn % £bn % £bn % £bn % £bn % £bn % £bn % £bn % £bn % 2019
UK/ Ireland 2.806 52 0.261 50 2.042 57 2.041 72 0.458 60 0.161 64 0.129 49 0.142 58 1.032 33 0.299 26 1.361 72 0.966 64 11.697 55 UK/ Ireland
USA/ Canada 1.069 20 0.114 22 0.690 19 0.250 9 0.184 24 0.040 16 0.027 10 0.007 3 0.648 21 0.095 8 0.076 4 0.232 15 3.432 16 USA/ Canada
Latin/ South America 0.262 5 0.015 3 0.131 4 0.065 2 0.002 0 0.007 3 0.009 3 0.004 2 0.294 9 0.108 10 0.005 0 0.025 2 0.927 4 Latin/ South America
Europe (excl UK/ Ireland) 0.678 13 0.040 8 0.454 13 0.284 10 0.097 13 0.024 9 0.041 16 0.048 20 0.655 21 0.232 20 0.423 23 0.169 11 3.145 15 Europe (excl UK/ Ireland)
Asia 0.344 6 0.060 12 0.164 5 0.121 4 0.015 2 0.016 6 0.035 13 0.034 14 0.346 11 0.330 29 0.013 1 0.077 5 1.555 7 Asia
Africa 0.124 2 0.016 3 0.034 1 0.014 0 0.002 0 0.003 1 0.019 7 0.002 1 0.067 2 0.055 5 0.001 0 0.032 2 0.368 2 Africa
Australasia 0.080 1 0.014 3 0.062 2 0.063 2 0.001 0 0.003 1 0.002 1 0.005 2 0.057 2 0.015 1 0.001 0 0.008 1 0.311 1 Australasia
Total 5.365 25 0.520 2 3.575 17 2.837 13 0.760 4 0.253 1 0.261 1 0.243 1 3.100 14 1.133 5 1.880 9 1.508 7 21.436 100 Total
% of total 25 2 17 13 4 1 1 1 14 5 9 7 100 % of total
Property Construction Liability Prof Lines Accident &
Health CyberPolitical
Risk Credit Risk Marine Aviation Motor Other Total
2018 £bn % £bn % £bn % £bn % £bn % £bn % £bn % £bn % £bn % £bn % £bn % £bn % £bn % 2018
UK/ Ireland 2.543 54 0.295 63 2.068 60 1.674 68 0.473 65 1.115 40 0.193 23 1.359 71 1.262 57 10.981 56 UK/ Ireland
USA/ Canada 0.805 17 0.067 14 0.594 17 0.249 10 0.124 17 0.484 18 0.066 8 0.094 5 0.221 10 2.705 14 USA/ Canada
Latin/ South America 0.220 5 0.023 5 0.128 4 0.082 3 0.002 0 0.267 9 0.065 8 0.007 0 0.036 2 0.830 4 Latin/ South America
Europe (excl UK/ Ireland) 0.746 16 0.023 5 0.477 13 0.302 12 0.111 15 0.524 19 0.226 27 0.434 23 0.417 19 3.258 17 Europe (excl UK/ Ireland)
Asia 0.249 5 0.042 10 0.147 4 0.086 4 0.013 2 0.272 10 0.225 27 0.017 1 0.184 8 1.236 6 Asia
Africa 0.090 2 0.012 3 0.026 1 0.017 1 0.001 0 0.068 2 0.038 5 0.000 0 0.055 3 0.307 2 Africa
Australasia 0.055 1 0.007 2 0.041 1 0.041 2 0.001 0 0.056 2 0.012 1 0.003 0 0.027 1 0.243 1 Australasia
Total 4.707 24 0.469 2 3.480 18 2.451 12 0.726 4 2.784 14 0.825 4 1.915 10 2.202 11 19.559 100 Total
% of total 24 2 18 12 4 14 4 10 11 100 % of total
London Company Market Statistics Report 17

BrexitFour years after the UK’s referendum vote to leave the EU, the impact of Brexit on insurers and reinsurers is starkly illustrated by this year’s London Company Market Statistics Report. Large amounts of premium that were previously included under our definition of controlled premium written in Europe, but overseen and managed by London operations, have disappeared from this survey. A loss of financial services passporting rules has meant that companies have had to restructure in order to continue serving clients within the remaining EU states. In a number of cases London operations are now branch operations of newly established European entities. Whilst London underwriters may still provide expertise and advice on European risks, business from the continent is no longer overseen and managed in the same way, but reported directly to operations located within the EU.
Overall controlled premium overseen and managed by London operations has fallen by 30% from £8.877bn in 2018 to £6.197bn in 2019. But the decline is much more dramatic when focusing on our geographical analysis of premium. Here it can be seen that income originating from Europe (excluding the UK and Ireland) is down by 60% from £4.890bn to £1.952bn.
A further analysis of the situation can be conducted by examining the individual data returns of all companies reporting a decline in controlled business and aggregating those numbers where firms have specifically cited company reorganisation as a cause. This exercise has revealed a total of £4.508bn in premium that can be said to have been lost as a direct result of Brexit.
Whilst the overall decline of 30% in controlled premium is significant, therefore, it is true to say that an even greater impact caused by Brexit restructuring has been masked by a number of companies reporting increases in such income for various other reasons. Similarly, premium written in London has grown by almost 10% over the past year from £19.559bn to £21.436bn, despite a 3.5% drop in income sourced from continental Europe (from £3.258bn in 2018 to £3.145bn in 2019). Without Brexit-necessitated reorganisation it is likely that we would be reporting a premium income for the London company market in 2019 in excess of £32bn, rather than the actual figure of £27.633bn.
Premium GrowthStrong rates of premium growth were experienced by many companies across a wide variety of business lines during 2019. Our data collection templates include a section that invites firms to comment on their figures for the year and these reports provide much evidence for a hardening pricing environment. Improved renewal rates were cited, in particular, for the energy, aviation, property and professional lines markets, although all classes appear to have benefited from this trend to some extent.
A number of companies commented that more new business is being written through managing general agents. These reports are borne out by a market aggregate delegated authority premium total of £3.972bn in 2019, which represents an increase of 28% on the 2018 figure of £3.096bn.
Other commentaries received from companies outlined a determination to focus on developing lines of business such as cyber. This contrasts with another stated policy from the market which explains a decline in engineering premium as a result of exiting power generation business in order to focus on renewable energy which is more in line with corporate social responsibility values.
Another trend that has contributed to the increased premiums found in this year’s report is a transfer of business from Lloyd’s of London into the company market. This has been especially noted in the marine and aviation sectors. Some company returns confirmed a withdrawal from writing marine business in 2019, but even so our aggregate premium total for this line still rose by 11% while aviation grew by more than a third. Taken together the amount of marine and aviation business written in the company market is now almost exactly equal to that conducted at Lloyd’s.
Conclusions
Pho
to S
ilas
Bai
sch
18 The International Underwriting Association

Conclusions
Strong rates of premium growth were experienced across a wide variety of business lines during 2019
Vietnam

London,

For more research and information published by the International Underwriting Association, visit: www.iua.co.uk/publications
Pho
to O
livie
r Cha
tel

International Underwriting Association Ltd London Underwriting Centre 1 Minster Court, Mincing Lane, London EC3R 7AA tel +44 (0)20 7617 4444 email [email protected] web www.iua.co.uk
China