long distance market study 2013 - network rail – network ... · the rail market in london and the...
TRANSCRIPT
Long Term Planning Process: London and South East Market StudyOctober 2013
What’s inside this document
Foreword 03
Executive Summary 04
Chapter 1 - Background 09
Chapter 2 - Market Description 14
Chapter 3 - Study Approach 17
Chapter 4 - Literature Review 19
Chapter 5 - Strategic Goals 22
Chapter 6 - Long Term Demand Scenarios 25
Chapter 7 - Long Term Conditional Outputs 44
Chapter 8 - Consultation Chapter 62
Chapter 9 - Appendices 66
Glossary 77
Network Rail London and South East Market Study 02October 2013

Network Rail London and South East Market Study 03October 2013Foreword
I am pleased to introduce the completed London and South East Passenger Market Study, following the London and South East Passenger Market Study Draft for Consultation which was published in April 2013.
This Market Study is one of four. Together, the London and South East Passenger, Long Distance Passenger, Regional Urban Passenger and Freight Market Studies set out how demand is expected to change in each of these rail markets in Great Britain over the next 30 years.
The rail market in London and the South East is dominated by demand for travel into central London, in which public transport predominates with a 90 per cent market share. Roughly half of the trips into central London involve use of National Rail, delivering 575,000 people into the centre each morning. Continuing growth in such peak demand, dominated by commuting, is predicted at a rate of 1.3 per cent annually. The remainder of the market, consisting of off-peak travel and non-Central London commuting, has been growing faster over the last 20 years at a yearly rate in the region of four per cent, a trend that is expected to continue. Thus rail plays a critical role in the economy of London and its surrounding area and will face continuing challenges to deal with the growing demand, driven in part by the projected substantial increase in Greater London’s population.
In publishing this Market Study, the rail industry sets out a new approach to developing plans for the future. It demonstrates rail’s impact on the economic life of the region, and enables strategic change, such as the implementation of the Crossrail and Thameslink programmes and the development of High Speed 2, to be effectively considered in industry planning.
By looking at the long term strategic goals of stakeholders, this study demonstrates how the railway is best placed to deliver the ‘conditional outputs’ that would meet current and potential future funders’ strategic goals for the London and South East passenger market sector. These include how the development of services can support economic growth, reduce the transport sector’s environmental impact, improve the quality of life for communities and individuals and meet outputs in an affordable way.
This study has been developed with full input of the wider industry including passenger and freight operators, the Department for Transport, local authorities, Local Enterprise Partnerships, London TravelWatch, the Office of Rail Regulation and Transport for London. The document has been strengthened as a result of the responses to the Draft for Consultation and engagement with The Rail Delivery Group’s Planning Oversight Group and the Rail Industry Planning Group. I would like to thank all those parties and those organisations and individuals who have both responded to the Draft for Consultation and contributed to the development of this London and South East Market Study.
The next stage is the development of a series of Route Studies, which will develop options to deliver the conditional outputs, across the four markets, in each of Network Rail’s devolved routes, and to test them against funders’ appraisal criteria. The output will be a series of choices for our funders to consider.
I look forward to continuing to work with the rail industry and wider stakeholders on the next steps of the Long Term Planning Process.
Paul PlummerGroup Strategy Director

Network Rail London and South East Market Study 04October 2013Executive Summary
When established, this document and the other Market Studies will form a key input to route planning and investment decision making over the next 30 years.
Introduction
The rail industry has changed the way it approaches long term planning. The new ‘Long Term Planning Process’ (LTPP) is designed to enable the industry to take account, and advantage of long term strategic investment being made in Great Britain’s rail network.
This document, the ‘London and South East Market Study’, is a key element of this work. This document and the other Market Studies form a key input to route planning and investment decision making over the next 30 years.
Scope and Context
Increasingly, long term strategic investments are being made in the rail network. These include plans for the development of a high speed line between London, Birmingham, Leeds and Manchester, implementation of modern signalling systems, the Crossrail and Thameslink programmes and electrification of significant parts of the system.
The balance of funders’ objectives has changed, both in the light of the tighter fiscal environment brought on by economic uncertainty and as a result of the ‘Rail Value for Money Report’ (McNulty report), published in May 2011. This has led to an increasing focus on making best use of the existing rail network, and Governments are seeing an increasing role for rail in supporting economic activity.
The LTPP has been designed to take these changes into account, building on work completed in the preceding Route Utilisation Strategy process, and will enable an informed view to be taken of the role of rail in the economic life of Great Britain. Planning over 30 years clearly involves uncertainties, however, the approach is designed to take into account strategic change in the economy, and Great Britain’s approach to social and environmental responsibility, so that the rail industry can respond to change over the long term life of assets used to operate the rail network.
There are three key elements to the LTPP:
• Market Studies. These articulate strategic goals for each particular market sector, forecast future rail demand, and develop “conditional outputs”.
• Cross-boundary analysis, which considers options for services that run across multiple routes.
• Route Studies, which will develop options for future services and for development of the rail network.
The LTPP will provide a key part of the evidence base for future investment in the rail network.
Four Market Studies have been published:
• Long Distance passenger.
• London & South East passenger.
• Regional Urban passenger.
• Freight.
It is important to emphasise that each passenger Market Study considers a particular market, rather than a particular set of train services. The Market Studies have three key outputs:
• Identification of the long term strategic goals which define the successful provision of rail services in the three passenger market sectors.
• Demand forecasts for the sector, over a 10 and 30 year horizon.
• Conditional outputs for the sector in terms of, for example, frequency, journey time and/or passenger capacity on key flows.
Markets that are relevant for the planning of train services or infrastructure within a single Route Study area, e.g. services operating wholly within Scotland or Wales, will be considered in more detail in the relevant Route Study. The outputs from the Market Studies are conditional on both affordability and a value for money business case being determined.
The Freight Market Study has produced demand forecasts over a 10 and 30-year planning horizon, with preferred routeing of services and the implied requirements in terms of network capacity and capability.
Further information on the Long Term Planning Process can be found on Network Rail’s website at www.networkrail.co.uk.

Network Rail London and South East Market Study 05October 2013Executive Summary
London and South East Passenger Market
The rail market in London and the South East is dominated by demand for travel into central London, in which public transport predominates with a 90 per cent market share. Roughly half of the trips into central London involve use of National Rail, delivering 575,000 people into the centre each day. Historically, the market for central London commuting has grown at an average rate of 1.5 – 2 per cent annually, with predictions of 1.3 per cent in the peaks going forward.
In terms of passenger km, half of the London and South East market consists of off-peak travel or commuting into regional centres. This market has shown stronger growth at a typical rate of four per cent per year over the last 20 years, with further growth expected, driven in part by the projected increase in the Greater London population.
In a national context, London is by far the largest single attractor of rail demand in the UK, with 500 million journeys made each year to or from central London.
Study approach
The approach taken to produce this study was threefold:
• A review of the published literature relating to rail industry funders’, stakeholders’ and passengers’ requirements for the London and South East passenger market.
• An extensive and ongoing dialogue with stakeholders.
• Primary research into the impact of improvements to rail services on the wellbeing of Great Britain, building on previous work undertaken by the rail industry, Government, and academic institutions.
The work to produce this study has been overseen by a Working Group comprising train operators, funders and central government, Transport for London, London Travelwatch, the Association of Train Operating Companies and the Office of Rail Regulation, the latter as an observer. The group has supported the development of the strategic goals and has provided support and a review of the work to produce the demand forecasts and conditional outputs.
The Working Group has been aided by a series of smaller locally devolved groups who have provided location specific spatial and economic context for the study.
The London and South East Market Study Draft for Consultation was published in April 2013. It presented a framework for developing conditional outputs for the London and South East Market Study.
The three month consultation period on the Draft for Consultation document provided a wide range of organisations and individuals with the opportunity to review the concepts and ideas set out in that document, and to provide a considered response. These responses have been used to inform and complete this final version of the London and South East Market Study. Network Rail, and the industry working group, wish to thank those organisations and individuals that have taken the time to respond to the London and South East Market Study Draft for Consultation.

Network Rail London and South East Market Study 06October 2013Executive Summary
Strategic Goals
The London and South East Market Study identifies the role of this passenger market in achieving the key priorities of current and potential future funders over the long term. These statements of priorities are the strategic goals that the London and South East market should aim to meet over this period. Strategic goals have been developed in collaboration with industry partners, stakeholders and through a review of literature.
The strategic goals are split by the overall goals for transport (in bold) and the subsequent goals for rail (in italics):
• Enabling economic growth
– by providing sufficient capacity for people travelling to take part in economically productive activities.
– by improving business to business connectivity.
• Reducing carbon and the transport sectors’ impact on the environment
– by directly reducing the environmental impact of rail.
– by reducing the use of less carbon efficient modes of transport.
• Improving the quality of life for communities and individuals
– by connecting communities.
– by providing access to social infrastructure such as educational establishments and major leisure venues.
– by reducing road congestion.
• Improving affordability
– by meeting other outputs in an affordable way
– by directly reducing whole industry subsidy.
Long Term Demand Scenarios
Identifying the appropriate role of rail in the context of these long term strategic goals requires an extension of Network Rail’s current demand projections to a 30-year time horizon as typical major railway infrastructure components, such as track systems, have an asset life of around 30 years. Ten year projections are also required to provide a snapshot of the likely situation at the start of control period six in 2019, the next rail industry planning period where investment priorities have yet to be established.
A three-stage approach has been used to develop the long term demand projections:
• A review of the factors which influence the demand for travel by rail.
• Development of four alternative futures for Great Britain’s economy and social and environmental planning, to examine how the factors which influence the demand for travel by rail could change.
• Production of a projected range of future passenger demand based on these four scenarios.
Development of these projections has been focussed on understanding the likely long term demand for travel to/from central London at the busiest times. This is because the under provision of future capacity on the most densely used and congested part of the network is a major threat to the strategic goals, given the importance of London as a centre of employment, commerce, population, and leisure activity.
Whilst undoubtedly an important consideration, overcrowding outside London and/or away from peak times tends to be a result of location-specific factors, and it is therefore more appropriate to forecast the future change in these factors as part of the Route Studies, in cases where there are likely to be a future capacity problem of this nature.

Network Rail London and South East Market Study 07October 2013Executive Summary
The demand projections suggest that in the absence of major changes to rail services and/or the constraining effect of overcrowding the market for travel to/from central London is likely to grow steadily, with a relatively narrow range in these forecasts when compared to those for the other Passenger Market Studies. This is partly due to the dominance and unique nature of the central London employment core, (with little change to the current long term employment trend expected over the next 10 years), and partly due to the extremely large total size of the market dampening the impact of major changes in land usage.
At a corridor-by-corridor level the demand projections are the most variable where major interventions are planned, in particular Crossrail and Thameslink upgrade programmes. Passenger growth is forecast to be very high in the corridors in which these services will operate, and lower than the average for the sector in the corridors where services and/or passengers will transfer to Crossrail or Thameslink services (e.g. routes into London Fenchurch Street and London Victoria).
Interventions of this nature are forecast to both stimulate new demand and mitigate the constraining effects of current and potential future overcrowding.
Long term conditional outputs – aspirations for 2043
The requirement to look to the long term has changed the emphasis of industry planning, from consideration of ‘what can be achieved given existing constraints’, to ‘what should be achieved to deliver the desired outcome’.
The conditional outputs for the London and South East passenger market are a statement of the long term aspirations for the level of service provided and are required to inform future investment decisions. They are therefore the key deliverable of the Market Study and form the basis for the rest of the LTPP for this market. They are not constrained by considerations of cost and deliverability.
The conditional outputs have been developed using an assessment of how to deliver three of the four strategic goals:
• Enabling economic growth
• Reducing carbon and the transport sector’s impact on the environment
• Improving the quality of life for communities and individuals.
An assessment of the fourth goal has not been considered, although supporting commentary is provided where appropriate:
• Improving affordability.
This goal will be considered in the remainder of the LTPP.
The conditional outputs are therefore conditional on a subsequent favourable assessment of value for money and affordability for current and potential future rail industry funders. They should be viewed as aspirations for the future rather than recommended investment decisions.
It is important to emphasise that improvements to rail services are only one of the conditions required to generate funders’ desired outcomes, and the conditional outputs should be viewed as a statement of rail’s role in a wider policy context.
It is also important to state that the conditional outputs shown are conditional on both affordability and a value for money business case being made for any interventions that subsequent Route Studies in the LTPP may consider as a way to deliver them. Equally the conditional outputs will need to be deliverable both technologically, operationally and physically. Lastly London and South East travel is only one of the markets present on a significant part of the railway in the region and the nature of a mixed traffic (or market) network means that Route Studies will need to examine the trade offs between potentially differing conditional outputs when considering how they can be accommodated.
In this context the following conclusions were reached in developing a series of quantitative, service-level, conditional outputs:
• The rail industry can help create the conditions to improve economic growth, the environment, and the quality of life for communities and individuals by improving short distance services covering typical passenger trips of 15 – 30 miles by accommodating peak demand, providing a minimum of three to four trains per hour and incremental improvements in journey times.

Network Rail London and South East Market Study 08October 2013
• For longer distance journeys to central London, benefits will similarly arise in terms of improved connectivity yielding benefits for improved business productivity, the ability to commute, a better quality of life and reduced environmental impact of transport. Research indicates that the level of commuting becomes significant once the total journey time is under 100 minutes and increased benefits are generated until the journey time is around 40 minutes. Given that this is a very large market with a high volume of rail trips, it can be seen that any improvement in journey times will yield a substantial benefit. A primary conditional output for this journey type is therefore to move towards a typical journey time of 40 minutes.
• Whilst improving connectivity to/from central London is particularly beneficial, service improvements between regional centres will also be of benefit against the strategic goals.
• Provision of improved opportunities to travel between a number of locations that are not currently directly served would be beneficial against the strategic goals.
Other, qualitative, conditional outputs have been developed relating to factors which could enable a successful outcome from the quantitative conditional outputs. These relate to:
• Access to airports, High Speed 2 stations and ports.
• Access to higher education establishments and other key social infrastructure.
• Passenger satisfaction.
• Access to the rail network.
Executive Summary

Network Rail London and South East Market Study 09October 201301: Background
Since summer 2011, Network Rail and the industry have worked to develop a revised methodology to the RUS process to continue to develop the long term strategic direction of the rail network. This successor programme, the Long Term Planning Process, was endorsed by the ORR in April 2012.
1.1 Background to the development of the Long Term Planning
Process
In June 2005 the Office of Rail Regulation (ORR) modified Network Rail’s network licence to require the establishment and maintenance of Route Utilisation Strategies (RUSs), for the use and development of the network consistent with the funding that is, or is likely to become, available. This modification to the Network Rail network licence followed the Rail Review in 2004 and the Railways Act 2005.
The geographic RUS programme led by Network Rail commenced in late 2004 and a suite of strategies has been produced covering the whole of the country, culminating in the establishment of the West Coast Main Line RUS in August 2011. As the network licence requires the maintenance of RUSs, the completion of the initial programme of geographic RUSs gave the opportunity to review how best to discharge this requirement in the future. Since summer 2011, Network Rail and the industry have worked to develop a revised methodology to the RUS process to continue to develop the long term strategic direction of the rail network. This successor programme, the Long Term Planning Process, was endorsed by the ORR in April 2012.
1.2 Changes of context
Since the start of the RUS programme in 2004 there have been changes in administrations in England, Wales and Scotland and there have been very significant changes in planning policy context.
Long term strategic investments are being made in the rail network rather than tactical solutions to individual problems – examples include the development of a high speed line between London and Birmingham and beyond to Leeds and Manchester (HS2), electrification of significant route mileage, Crossrail, changes to signalling technology through deployment of the European Rail Traffic Management System (ERTMS) and progression of the Network Rail Operating Strategy. Therefore, there is a need for the industry to consider network-wide long term infrastructure development rather than ‘as now plus isolated enhancements’ to the rail network. This will also need to inform maintenance and renewal strategies in both the short and medium term.
The balance of funders’ objectives has also changed in the light of a significantly tighter fiscal environment and the emerging conclusions from the ‘Rail Value for Money’ report published by Sir Roy McNulty in May 2011. There is a clear policy shift towards revenue generation and making best use of the existing railway. Indeed, the Rail Value for Money report explicitly recommends that rail planning should place more emphasis on making best use of the existing network, before considering further infrastructure investment. Franchises are becoming less prescriptive in England and Wales and shorter term options in the future are expected to be driven more by franchises. All administrations see greater emphasis on the role of transport in supporting the economy, for example by widening access to labour markets and by improving connectivity between businesses.
Network Rail has recently restructured to become more accountable to its customers with the creation of nine devolved Routes to enable greater local decision making.
In the context of these changes, the RUS process to date has a number of limitations. The key challenge is that RUSs have developed options as incremental changes to existing services. This is unlikely to be appropriate in the future – at least as the only or main approach to option development – because many of the changes described above imply a need to consider step changes to services. In the future, making best use of the network may require looking beyond existing service patterns. Stakeholder aspirations for services to support economic growth, for example by connecting residential areas to labour markets, may involve entirely new services. Investments such as HS2 and electrification also give opportunities for step changes in train service, not only on the parts of the network directly affected, but well beyond.
Another limitation of the process to date is in the way that it has dealt with services that run across several RUS areas. Such services have generally been considered by each geographic RUS in isolation, each RUS looking at changes within its area but not considering the service as a whole. This has been workable only because, as noted above, options have been defined as incremental changes to existing services. With step changes to services likely in future, for example as a result of HS2 or electrification, this approach will no longer be appropriate.

Network Rail London and South East Market Study 10October 201301: Background
1.3 Long Term Planning Process overview
The Long Term Planning Process consists of a number of different elements, which, when taken together, seek to define the future capability of the Network. The individual elements are detailed below:
• Market Studies, which forecast the future rail demand, and develop “conditional outputs” for future rail services, based on stakeholders’ views of how rail services can support delivery of the market’s strategic goals.
• Route Studies, which will develop options for future services and for development of the rail network, based on the conditional outputs and demand forecasts from the Market Studies, and assess those options against funders’ appraisal criteria in each of Network Rail’s devolved Routes.
• Cross-boundary analysis, which considers options for services that run across multiple routes to enable Route Studies to make consistent assumptions in respect of these services.
The Market Studies, Route Studies and Cross-boundary analysis are described in further detail in Sections 1.4, 1.5 and 1.6 below.
The Long Term Planning Process (and in particular the Route Studies) will provide a key part of the evidence base for future updates of the Network and Route Specifications which bring together all the medium and long term plans for the development of a route, drawing on sources including RUSs, renewal plans, development of major projects and resignalling programmes.
In addition, the existing Network RUS process will continue to look at network-wide issues. Further information on the Long Term Planning Process, the current Network and Route Specifications and the Network RUS can be found on Network Rail’s website at www.networkrail.co.uk.
1.4 Market Studies
There are four Market Studies: London and South East, Long Distance, Regional Urban and Freight. Although the three passenger Market Studies have obvious connections to the three ’sectors’ into which passenger train services are often divided, it is important to emphasise that each Market Study considers a particular passenger market, rather than a particular set of train services.
The passenger Market Studies have three key outputs:
• Identification of the long term strategic goals which define the successful provision of rail services to each of the three market sectors. These are based on the aspirations of current and likely future rail industry funders.
• Demand forecasts for the sector, over a 10 and 30-year planning horizon. Scenarios will be used to reflect key uncertainties, where appropriate.
• “Conditional outputs” for the sector. The conditional outputs will be aspired levels of service (in terms of, for example, frequency, journey time and/or passenger capacity on key flows in the sector). The conditional outputs will reflect stakeholder views of how rail can support delivery of their strategic goals, and opportunities created by planned investments, as well as reflecting current service levels and forecast future demand. The aim of the Market Studies is to provide demand forecasts, and conditional outputs, that are consistent across the Route Studies. The Market Studies will not consider in detail markets that are relevant for the planning of train services or infrastructure, only within a single Route Study area and the aspirations for such markets (e.g. services operating wholly within Scotland or Wales) will be considered in more detail in the relevant Route Study. The conditional outputs will be conditional on both affordability and a value for money business case being determined in subsequent Route Studies.
The Freight Market Study will produce demand forecasts over a 10 and 30-year planning horizon, with preferred routeing of services and the implied requirements in terms of network capacity and capability. Scenarios will be used to reflect key uncertainties.
Network Rail London and South East Market Study 11October 201301: Background
All of the Market Studies will draw on existing work where appropriate, for example work done in RUSs, development of the Strategic Freight Network and Local Authority multi-modal studies.
1.5 Route Studies
There will generally be one Route Study for each of Network Rail’s nine devolved routes. In a few cases a devolved Route may be covered by more than one Route Study, where part of the Route is not largely self-contained.
A Route Study will develop and assess options for the long term use and development of the network. Its starting point will be to determine whether the conditional outputs from the relevant Market Studies can be accommodated on the existing network, with committed enhancements. It will then develop train service options, corresponding to different uses of the network (and hence to different trade offs between stakeholders’ strategic goals). A Route Study will first look at options for making use of the existing network, and only then at options involving infrastructure investment. Options will be assessed against funders’ decision-making criteria. This will include quantitative appraisal as in the previous RUS process. It will also, where appropriate, include a wider assessment against factors such as strategic fit, wider economic impacts and affordability.
The output from a Route Study will be evidence based choices which will be available to Network Rail and industry funders to determine the long term use and development of the network.
1.6 Cross-boundary analysis
Services that run across more than one Route Study area will be considered in a separate “cross-boundary” workstream. This workstream will develop and assess options for cross-boundary services (passenger and freight), in a similar way to the Route Studies. The output from this workstream will be a set of common assumptions that Route Studies should adopt regarding cross-boundary services. Assumptions might include the frequency and calling patterns of passenger services, and the frequency and operating characteristics (e.g. gauge, speed, tonnage) of freight services.
The workstream may also specify options for cross-boundary services to be examined in more detail in Route Studies, in order to better understand the trade-offs between cross-boundary and other services. The assumptions regarding cross-boundary services may be revised from time to time based on the analysis in Route Studies.
1.7 Long Term Planning Process outputs
The Long Term Planning Process occupies a particular place in the planning activity of the rail industry. The choices presented and the evidence of relationships and dependencies revealed in the work across all elements of the process form an input into decisions made by industry funders and suppliers on issues such as franchise specifications and investment plans. In particular, the Long Term Planning Process will form an essential evidence base for the development of the High Level Output Specification for Control Period 6 (2019-2024).
1.8 Long Term Planning Process Governance Arrangements
The Long Term Planning Process is designed to be as inclusive as possible with contributions encouraged both from the rail industry and wider stakeholders. Overall governance responsibility for the process lies with Rail Industry Planning Group (RIPG) which meets quarterly and whose membership comprises:-
• Association of Train Operating Companies (ATOC)
• Department for Transport
• Freight Operators
• London TravelWatch
• Network Rail
• Office of Rail Regulation (as an observer)
• Passenger Focus
• Passenger Transport Executive Group (PTEG)
• Rail Freight Group
• Railway Industry Association
• Rail Freight Operators Association

Network Rail London and South East Market Study 12October 201301: Background
• Rolling Stock Leasing Companies
• Transport for London
• Transport Scotland
• Welsh Government.
A two-tier structure for stakeholder dialogue has been established to oversee and help produce this London and South East Market Study:
First, a Working Group provides high level support for developing the three key output deliverables detailed in Section 1.4, a mandate to discuss these deliverables on behalf of the rail industry with other stakeholders, and a review of the ongoing work to develop them.
The working group comprises the Department for Transport, Transport for London, London Travelwatch, all the current train operating companies who operate in the sector, ATOC, a freight industry representative nominated by the Strategic Freight Network Steering Group, Network Rail and the Office of Rail Regulation as an observer.
Second, a series of smaller locally devolved groups provide location specific spatial and economic context and evidence of planned and existing studies to enable the production of study output deliverables that are appropriate for both local circumstances and the wider rail market sectors.
These groups typically comprise Local Enterprise Partnerships (LEPs), shire county and unitary local authorities, Transport for London, the Department for Transport, airport operators, the current train operating companies relevant to the market and locality and Network Rail.
The London and South East Market Study groups are termed Local Groups and are based around logical geographical/train service areas within the region. The meeting groupings are as follows:
• Chiltern, Great Western and West Coast Main Lines
• East Anglia, East Coast and Midland Main Lines
• South of the Thames.
Additionally a number of one to one meetings have been held with stakeholders to assist in the development of this Market Study.
1.9 Document Structure
This study has been developed based on input from a wide range of stakeholders and comprehensive appraisal and analysis work:
• Chapter 2 provides a description of the London and South East passenger market sector in terms of its characteristics, total demand and passenger kilometres. It identifies typical passenger journey purposes before considering those circumstances where rail is most competitive
• Chapter 3 summarises the way in which the study has been approached. It details how and what evidence has been collected, the primary economic research, the consultation undertaken and sets the goals forecasts and outputs
• Chapter 4 details the literature review that has been undertaken to assist the study
• Chapter 5 sets out the strategic goals for the London and South East market sector in terms of how they have been developed and what they are
• Chapter 6 looks at the long term demand scenarios and details how the scenarios have been developed, the methodology used and the consequent forecasts themselves
• Chapter 7 identifies the long term conditional outputs for the London and South East market sector. It shows how the outputs were developed before summarising what they are
• Chapter 8 describes the consultation process and the responses that have been received following the publication of the Long Distance Market Study Draft for Consultation in March 2013, before detailing the next steps.

Network Rail London and South East Market Study 13October 201301: Background
This document has been published exclusively on Network Rail’s website. If you would like a paper copy please write to or email the following address to arrange for a copy to be sent to you:
RUS PlannerKings Place90 York WayLondonN1 9AG

Network Rail London and South East Market Study 14October 201302: London and South East Passenger Market DescriptionThe rail network in the London and South East area is extensive and complex, with many of the busiest routes in Great Britain
2.2 Geographic scope of Market Study area
The Market Study area covered by the London and South East region includes passenger demand in the Greater London area and abutting regions of South East England, as shown in Figure 2.1 on the following page. This is broadly the extent of the area from which significant numbers of people commute to/from London.
2.1 Introduction
This chapter sets the remainder of this document in context by explaining the characteristics that define the London and South East passenger market sector.
These characteristics comprise:
• The product(s) offered to the marketplace, and the circumstances in which this product enjoys a competitive advantage over travel by other modes.
• The passengers who use this product as defined by their journey purpose.
• The total size of the market and how this has developed over time.
Figure 2.1 shows the geographic scope of the Market Study area.
London
South East
King’s Lynn - 99 miles
Peterborough - 76 miles
Northampton - 66 miles
Banbury - 69 miles
Swindon - 77 miles
Salisbury - 84 miles
Weymouth - 143 miles
London and South East
Figures indicate approximate distance in miles from the London terminal

Network Rail London and South East Market Study 15October 201302: London and South East Passenger Market Description
2.3 Market description
The rail network in the London and South East area is extensive and complex, with many of the busiest routes in Great Britain. Passenger trains operating upon them may comprise a mix of services ranging from long distance high speed (LDHS) to inner suburban, the latter serving many stations along a route, with the various types of service having different operating, rolling stock and passenger characteristics. Away from central London there are some routes which are more rural in nature.
London is the largest employment centre in the UK, with over 4.5 million people employed in the Greater London area. Much of this employment is concentrated in central London creating high demand for inwards commuting. Half of these inward journeys in the morning peak use National Rail for all or part of their journey, including almost all longer distance commuters from outside the Greater London administrative boundary.
London is also by far the largest attractor of rail trips in the UK, with over 500 million rail journeys being made to or from central London annually. In addition to this there are growing markets to destinations such as Canary Wharf, Croydon and Hammersmith, plus large numbers of travellers throughout the day to the major airports of Gatwick, Heathrow, Luton and Stansted.
Given city centre traffic congestion, charges and car parking limitations, public transport dominates the London and South East market. 90 per cent of all peak trips are made using public transport with half using National Rail, which delivers 575,000 passengers into central London every week day morning.
Rail therefore plays a very significant role in supporting London’s economy. The rail network extends this economic prosperity to towns and cities across the wider South East region by providing connections to greater employment and trade opportunities.
The rail network also supports the extremely large tourism and retail sector in the South East region, connecting populous areas with many city centre retail and tourism cores, as well as providing fast direct links to the region’s National Parks and other tourist attractions.
Travel to, from and within London and the South East accounts for
70 per cent of all rail journeys within England and Wales and 50 per cent of passenger vehicle miles are operated by franchised operators within this region. Rail travel within the London and South East region is dominated by the commuter market. People travelling to their normal place of work account for 85 per cent of trips into London in the morning peak, between 0700 and 0859.
The London and South East train services often accommodate passengers from other market sectors, particularly the long distance sector. There is a trade off between the requirement for high speed services and high frequency, multi-stop services.
2.4 Growing demand
The demand for rail services in the London and South East region is determined principally by the level of employment in central and inner London. Historically, the market has grown at an average rate of 1.5–2 per cent per year, consistent with central London employment growth. The London Plan 2011 predicts longer term employment growth in central and inner London of 27 per cent by 2031, over 600,000 extra jobs, and as a result the current established strategies for the sector are based upon longer term rail demand growth of 1.3 per cent per year in the peak. Greater London is characterised by the highest housing costs in London and the South East but also the greatest range of employment opportunities. As a result, higher rates of commuting growth into central London are expected from areas of the South East outside Greater London.
In addition, there is also an increasing market for travel to work outside of central London, especially to London Docklands.
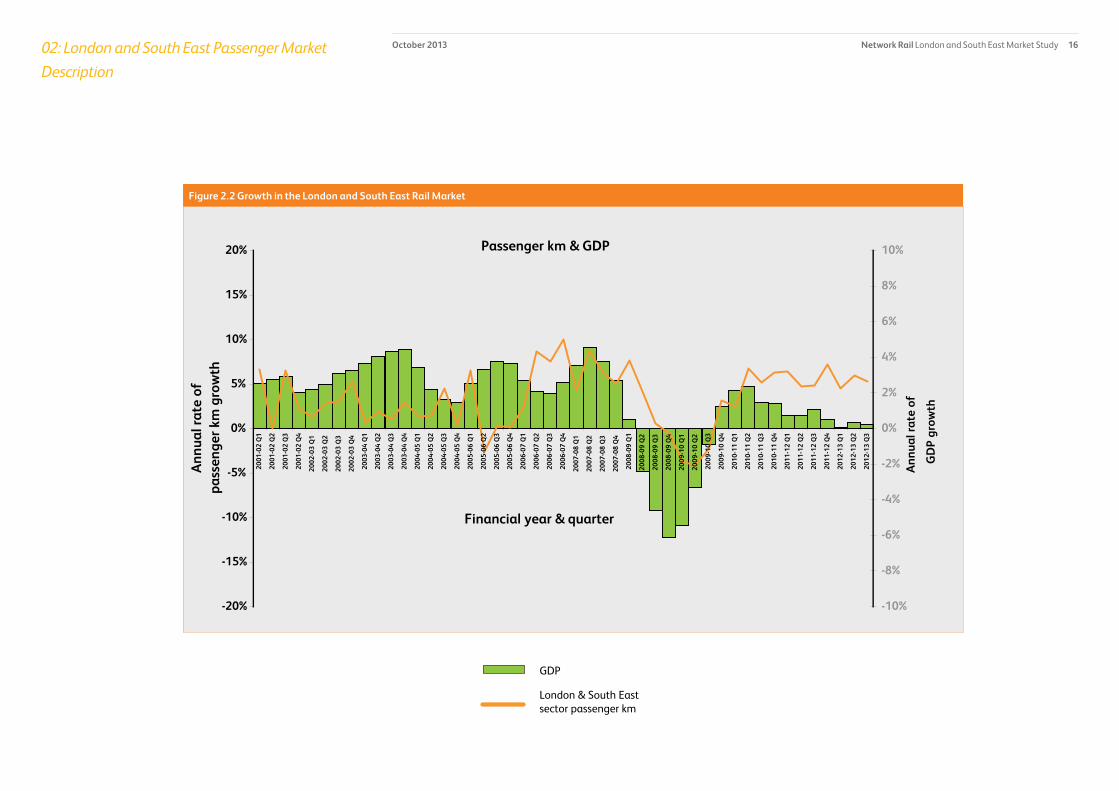
In terms of passenger km, over half of the London and South East market relates to off-peak travel, or commuting into regional centres. This market has grown at a faster rate than the central London commuter market. The sector as a whole grew on average four per cent annually since the mid 1990s. See Figure 2.2. Further growth is expected, which in part will be driven by the forecast increase in Greater London’s population of 1.25 million people by 2031.
The demand projections for this London and South East Market Study are presented in detail in Chapter 6.
Network Rail London and South East Market Study 16October 201302: London and South East Passenger Market Description
Passenger km & GDP
-20%
-15%
-10%
-5%
0%
5%
10%
15%
20%20
01-0
2 Q
1
2001
-02
Q2
2001
-02
Q3
2001
-02
Q4
2002
-03
Q1
2002
-03
Q2
2002
-03
Q3
2002
-03
Q4
2003
-04
Q1
2003
-04
Q2
2003
-04
Q3
2003
-04
Q4
2004
-05
Q1
2004
-05
Q2
2004
-05
Q3
2004
-05
Q4
2005
-06
Q1
2005
-06
Q2
2005
-06
Q3
2005
-06
Q4
2006
-07
Q1
2006
-07
Q2
2006
-07
Q3
2006
-07
Q4
2007
-08
Q1
2007
-08
Q2
2007
-08
Q3
2007
-08
Q4
2008
-09
Q1
2008
-09
Q2
2008
-09
Q3
2008
-09
Q4
2009
-10
Q1
2009
-10
Q2
2009
-10
Q3
2009
-10
Q4
2010
-11
Q1
2010
-11
Q2
2010
-11
Q3
2010
-11
Q4
2011
-12
Q1
2011
-12
Q2
2011
-12
Q3
2011
-12
Q4
2012
-13
Q1
2012
-13
Q2
2012
-13
Q3
Financial year & quarter
Ann
ual r
ate
of
pass
enge
r km
gro
wth
-10%
-8%
-6%
-4%
-2%
0%
2%
4%
6%
8%
10%
Ann
ual r
ate
of
GD
P gr
owth
Figure 2.2 Growth in the London and South East Rail Market
GDP
London & South Eastsector passenger km

Network Rail London and South East Market Study 17October 201303: Study approach
An extensive and ongoing dialogue with stakeholders has been undertaken using meetings of the Working Group and Local Groups outlined in Chapter 1 as forums for this discussion.
3.1 Background
The Market Study approach has been designed to produce the three key deliverables outlined in Chapter 1, namely:
• Identification of the long term strategic goals for the market sector, based on the aspirations of current and likely future rail industry funders.
• Production of long term demand scenarios for the market sector.
• Identification of conditional outputs for the specification of train services in the long term which will achieve the strategic goals for each market sector, given future circumstances identified in the demand scenarios.
These outputs are conditional upon subsequent value for money and affordability assessments.
The resultant study approach is outlined below.
3.2 Study approach
3.2.1 Literature review
The first stage in the process was to conduct a review of the published literature relating to rail industry funders’, stakeholders’ and passengers’ requirements for the London and South East passenger market. This provided the starting point for the development of the strategic goals for the market, and was used to help understand how improvements to the train services in this market sector can help to achieve these goals.
This literature review is summarised in Chapter 4.
3.2.2 Stakeholder dialogue
An extensive and ongoing dialogue with stakeholders has been undertaken using meetings of the Working Group and Local Groups outlined in Chapter 1 as forums for this discussion.
Meetings of these groups were timed to coincide with the completion of each of the Market Study deliverables, whereby the Working Group was asked to help develop and articulate strategic goals across the Market Study area, demand scenarios and conditional outputs, and the Local Groups were asked to confirm whether these deliverables were appropriate in the circumstances
that apply to the areas they represent.
3.2.3 Primary research
Research into the impact of improvements to rail services on the wellbeing of Great Britain was undertaken to provide a thorough evidence base for development of the conditional outputs. This research sought to establish statistical relationships between the quality of transport opportunities and indicators of national and local wellbeing. This involved the collection of a significant body of new data on travel patterns, and social, demographic and economic trends, as well as estimating a series of statistical relationships between this data. This work is detailed in Chapter 7.
Research was also conducted to provide new long term passenger demand projections. This is explained in detail in Chapter 6.
Both pieces of research are built on existing work undertaken by Network Rail and other industry organisations such as the 2011 London and South East Route Utilisation Study Forecasts and Prioritising Investment to Support our Economy, Network Rail 2010.
As part of the Local Group meetings, stakeholders were invited to meet Network Rail on a ‘one to one’ basis if they felt it would be helpful in taking matters forward. Several organisations opted to do so, and the case study below is an example of the dialogues that took place.
3.2.4 Consultation
In April 2013 the London and South East Market Study Draft for Consultation was published by Network Rail on behalf of the Working Group. It set out the conditional outputs for the London and South East Market and received a significant number of responses. These responses have been collated, reviewed, and have informed the production of this document. Details of the key themes emerging from the consultation are articulated in Chapter 8.

Network Rail London and South East Market Study 18October 201303: Study approach
In the early stages of the London and South East Market Study, Network Rail met with Essex County Council. This was an opportunity for the council to inform the work on the study, and to gain insight into the methodology and milestones in the Long Term Planning Process (LTPP).
Local expertise, priorities and aspirations from stakeholders, such as Essex County Council, help Network Rail develop a robust understanding of how rail can make a successful long term contribution towards the needs of local communities.
It was possible to freely discuss a broad range of topics including passenger preferences, housing growth, intra-modal transport solutions, freight, aviation and major infrastructure projects. Together, options to improve connectivity across the region were discussed.
It was agreed that contact would be maintained as the LTPP proceeded, enabling a better informed, more collaborative process to help achieve a railway that will provide the local transport needs for the growing population of Essex.
Working with industry stakeholders is highly valuable in informing the study. Views and aspirations from a local level, such as those of Essex County Council, influence the Market Study analysis, and ultimately help the development of outputs for future rail services that will support the delivery of their strategic goals.
A number of similar meetings were held with other stakeholders throughout the study.
Case Study: Stakeholder Dialogue with Essex County Council

Network Rail London and South East Market Study 19October 20134: Literature review
This chapter presents a review of the published literature relating to rail industry funders’, stakeholders’ and passengers’ requirements for the London and South East passenger market.
4.1 Introduction
This chapter presents a review of the published literature relating to rail industry funders’, stakeholders’ and passengers’ requirements for the London and South East passenger market. This provided the starting point for the development of the strategic goals, long term demand scenarios and conditional outputs. The review considered three types of documents:
• Central Government policy as evidenced by recent investment decisions, and the rail industry’s activities to deliver this policy.
• Stakeholders’ rail and transport strategies.
• Research on the demand for travel by rail.
4.2 Government policy
The Department for Transport (DfT), the principal public funding authority for the rail industry, published its investment priorities for 2014-2019 (Network Rail Control Period 5, CP5) in the 2012 High Level Output Specification (HLOS) for England & Wales.
The HLOS document outlines Government commitment to improvements to the capability of the rail network and the services which use it, with a combined value of over £11 billion. It identifies four priorities around which its specifications are built:
• Supporting business and economic growth.
• An improved environmental outcome.
• Supporting and connecting people and communities.
• Maintaining and improving the value for money and financial sustainability of the rail industry.
A number of the specified schemes and ring-fenced investment funds in the document target improvements to rail services in London and the South East and infrastructure as a means to achieving these priorities. These include:
• Increases to the capacity of the UK’s busiest station, London Waterloo.
• Further electrification of the network1 – electrification of a number of route sections, amongst others from Basingstoke to Reading, Oxford – Leamington – Coventry and the East West Rail core route from Oxford to Bedford via Bletchley to create a direct link between the Great Western, West Coast and Midland Main Lines.
• Conversion to overhead AC electrification for the route from Southampton to Basingstoke as a pilot project for possible eventual conversion of direct current (DC) third rail routes.
• A proposal for a new western connection from the Great Western Main Line to Heathrow Airport Terminal 5.
• Plans for improved access to Gatwick Airport by partial remodelling and a new platform at Redhill station.
The HLOS also specifies an increment in passenger capacities to be accommodated at London termini.
There are a number of sizeable previously committed schemes that will have a major impact on the London and South East region. Amongst others, these include:
• Crossrail, a new line crossing London providing significant additional capacity and connectivity in the capital.
• Thameslink, a high capacity passenger scheme across the capital from north to south.
• Intercity Express Project, a new fleet of long distance high speed trains on the East Coast and Great Western Main Lines.
While not specifically focussed on the London and South East area, several ring-fenced funds are also defined. The fund to improve capacity and reduce journey times between key destinations on the East Coast Main Line is likely to affect the London and South East area to some extent. One of the illustrative schemes named by the HLOS is a capacity enhancement from Huntingdon to Fletton Junction (near Peterborough).
1 Following publication of the HLOS, Government has also announced funding for electrification of the Gospel Oak to Barking Line.

Network Rail London and South East Market Study 20October 20134: Literature review
The Department for Transport is also supporting the development of the High Speed 2 project to connect London, the West Midlands and the north of England with a new high speed railway line, and is currently preparing a bill which is to be presented before Parliament for the first phase of this line. If implemented, this unprecedented investment would lead to a step change in the capacity available for business passengers, commuters and freight whilst significantly reducing the journey times between Britain’s largest clusters of economic activity.
The rail industry received broadly £4.5bn support from the taxpayer in 2011/12. This demonstrates the value that funders attach to the role of rail in a successful outcome for Great Britain, but also highlights that the overall affordability of the rail industry is a key challenge.
The industry is taking responsibility for this challenge through the Rail Delivery Group (RDG), which brings together senior leaders of the rail industry. RDG has initiated a number of working groups to examine opportunities to deliver efficiencies across the industry including asset, programme and supply chain management, contractual and regulatory reform, train utilisation, and technology, innovation and working practices. A work stream to examine the opportunities to reduce the costs of major projects through greater industry engagement in the development and delivery of enhancement schemes has also recently been started.
The rail industry is in agreement that efficiencies can be achieved over the forthcoming Control Periods. An implication of this is that some market sectors and sub-sectors could achieve a financial break even in the future and as such places a greater emphasis on private sector funding.
4.3 Stakeholders’ rail/transport strategy
Most stakeholder organisations have a strategy for future rail services intended to deliver their desired outcome for the areas they represent.
Some of the key documents for the Market Study were provided by Transport for London (TfL) and the Greater London Authority (GLA).
Planning documents from Local Authorities, Local Enterprise Partnerships (LEPs), airports and other stakeholders have been
included in the literature review.
The following documents have been reviewed in development of the strategic goals presented in Chapter 5. Whilst the details of these strategies are location specific the themes of supporting economic growth, a greener environment, connecting communities, and financial efficiency are common to most:
• Mayor’s Transport strategy. Mayor for London. May 2010.
• Route Utilisation Strategies (RUS). Network Rail. 2006 to 2011.
• Network RUSs. Network Rail. 2007 to 2012.
• High speed rail: investing in Britain’s future phase two – the route to Leeds, Manchester and beyond, Department for Transport January 2013.
• Industry Strategic Business Plans for Control Period 5, and associated documents. Network Rail, ATOC, RIA, RFOA. 2013.
• Strategic Business Plans for Control Period 5, and associated documents. Network Rail. 2013.
• Planning ahead 2010, the long term planning framework. Network Rail, ATOC and RFOA. August 2010.
• Local planning documents provided by councils and LEPS .
• The Eddington Transport Study. Sir Rod Eddington. December 2006.
• Delivering a Sustainable Transport System: Main report. Department for Transport. November 2008.
• Draft Aviation Framework. Department for Transport. July 2012.
• Airport publications including Airport Surface Access Strategies, and other planning documents.
• Economic Case for HS2. Department for Transport. February 2011.
• Prioritising investment to support our economy. Network Rail. September 2010.
Some of these publications are part of a more extensive (regulatory) framework. The London Plan is a statutory document, required

Network Rail London and South East Market Study 21October 20134: Literature review
under the GLA Act 1999, with the current version published in 2011. The London Plan is the overall strategic development plan for the capital until 2031 and sets out an integrated economic, social, environmental and transport policy framework for London.
The Plan forecasts population growth of 1.3 million people from 2007 to 2031, and 750,000 additional jobs over the same period. Referred to in the GLA Act as the ‘spatial development strategy’, it brings together the geographic and locational aspects of other strategies, including the Mayor’s Transport Strategy (MTS). The MTS sets the following five strategic goals for transport in London, including:
• Economic development and employment growth.
• Quality of life (in particular air quality, climate change and comfort of travel).
• Safety and security (maintaining and improving safety and security of streets and the transport network).
• Transport opportunities for all (improving the accessibility of the transport system).
• Climate change (cutting CO2 emissions and preparing for change).
The MTS sets out a comprehensive range of proposals to improve London’s transport network, with 14 specific proposals for the National Rail network in the Greater London area.
4.4 Research into the demand for travel by rail in Great Britain
The final section of this chapter references the research that has been used to develop the long term demand scenarios and projections.
An extensive body of research exists into the factors which influence the demand for travel by rail. Since 1986, the Passenger Demand Forecasting Handbook (PDFH) has formed the rail industry’s main source of reference for this research, detailing summaries of the most pertinent studies and providing advice on the practical applications of this work.
The Passenger Demand Forecasting Council (PDFC) is the rail industry association responsible for commissioning new research. It
periodically updates the PDFH when significant advancements in this research have been made.
Full members of the PDFC include:
• The Association of Train Operating Companies (ATOC).
• All Train Operating Companies (TOCs).
• Department for Transport.
• Transport Scotland.
• All Passenger Transport Executives.
• The Office of Rail Regulation (ORR).
• Network Rail.
Associate members of the PDFC include a number of consultancy firms which specialise in transport economics as well as some universities.
The PDFH/PDFC has provided the majority of the evidence used to develop the long term demand scenarios. The most recent synopsis of this research is provided in PDFH version 5.
This Market Study has also used research that has not been commissioned by the PDFC (although some of this work has been undertaken by PDFC members). Publications include:
• The portfolio of established Route Utilisation Strategies, Network Rail 2006 - 2012.
• On the Move. Making sense of car and train travel trends in Britain, ORR, ITC, TS, RAC Foundation, 2012.
• The Billion Passenger Railway. Lessons from the Past: Prospects for the Future, ATOC 2008.
• Robust Foundations. Econometric Analysis of Long Time Series Rail Passenger Demand Aggregates Report to the Department for Transport, MVA 2008.
• National Passenger Survey, Passenger Focus, (annually).

Network Rail London and South East Market Study 22October 201305: Strategic goals
This Market Study identifies the long term role of the London and South East passenger market in enabling the key priorities of the current and potential future funders to be met. These statements of priorities are the strategic goals that the London and South East rail market should aim to meet in the long term.
5.1 Introduction
This chapter sets out the strategic goals for the London and South East rail market, explains how they have been developed, and lists the types of improvements to rail services that could deliver these goals.
5.2 Identification of strategic goals
This Market Study identifies the long term role of the London and South East passenger market in enabling the key priorities of current and potential future funders to be met. These statements of priorities are the strategic goals that the London and South East rail market should aim to meet in the long term.
Strategic goals are identified based on the aspirations of current and likely future rail industry funders. They are also developed through collaboration with industry partners and stakeholders and a review of existing literature. Conditional outputs are developed to meet these identified strategic goals. They specify the rail service provisions that the rail service should aim to deliver, where they are affordable and represent value for money. Deliverability of these conditional outputs, which are presented in Chapter 7, will be considered during the Route Study phase of the Long Term Planning Process.
The strategic goals are summarised below and explained in more detail in the following section. To clarify, these are a product of funders’ policy, the literature review discussed in Chapter 4, stakeholder discussions and industry research largely contained within the Passenger Demand Forecasting Handbook. They are split by the overall goals for transport (in bold) and the subsequent goals for rail (in italics):
• Enabling economic growth.
– By providing sufficient capacity for people travelling to take part in economically productive activities.
– By improving business to business connectivity.
– By improving connectivity to/from the retail, leisure and tourism sectors of the economy
• Reducing carbon and the transport sector’s impact on the environment.
– By directly reducing the environmental impact of rail.
– By reducing the use of less carbon efficient modes of transport..
• Improving the quality of life for communities and individuals.
– By connecting communities.
– By providing access to social infrastructure such as educational establishments and major leisure venues.
– By reducing road congestion.
• Improving affordability and value for money.
– By meeting other outputs in an affordable and value for money way.
– By directly reducing whole industry subsidy.
5.2.1 Enabling economic growth
Rail plays a key role in supporting economic growth in the London and South East region by connecting people and businesses. Commuters travel to employment clusters and businesses gain access to labour supply through the railway network. It also enables people to undertake business transactions on behalf of their employers and supports the retail and leisure economy.
The majority of rail passengers travel to undertake economically productive activity. Accommodating this travel is therefore important for Great Britain’s economic wellbeing in general and that of the London and South East region in particular.
Commuters value personal space, frequency, speed, reliability, receiving accurate information about their journey, the ability to work on the train and good interchange with other modes. Improving these factors will improve access between employment and labour, by increasing the willingness to commute.
Business travellers primarily value effective connections between places of business. Improving rail services helps to increase business efficiency and business interactions between cities and support

Network Rail London and South East Market Study 23October 201305: Strategic goals
agglomeration of economic activities. Improved interchange, increased service frequency, and faster train speeds all help achieve better connectivity.
Leisure travel also supports important sections of the economy such as tourism and retail, and rail has an important role in connecting people with these sectors of the economy, particularly where a centre of population and/or a major tourist attraction or retail centre can be made easily accessible to the rail network. It is recognised, however, that improved connectivity to retail and leisure sectors of the economy may be difficult to achieve at a market level, and may be more appropriate to consider in detail in the Route Studies.
The strategic goals for rail are therefore to:
• Provide sufficient capacity for people travelling to take part in economically productive activities.
• Improve business to business connectivity.
• Improve connectivity for the retail and leisure sectors of the economy.
5.2.2 Reducing carbon and the transport sector’s impact on the environment
Depending on the mix of power generation, electric traction is more carbon efficient and environmentally friendly than the diesel equivalent. Electrification of the network, in particular on sections connecting longer distance routes which are already electrified, will reduce the transport sector’s harmful impact on the environment, particularly where renewable sources are used at the point of production.
Again depending on the mix of power generation and fuel type, travel by rail is more environmentally friendly than by car and thus the carbon footprint of transport can be reduced by modal shift from road to rail. Rail can also alleviate some of the factors exacerbating road related emissions, in particular urban congestion. As such, a more effective rail network results in a reduced carbon footprint for the transport sector. In the South East, rail is already competitive with car travel on a number of motorway and trunk routes, particularly between London and other major
urban centres. Conversely, car tends to have a dominant market position where rail journey times are slow and/or access to the rail network is poor.
The strategic goals for rail are therefore to:
• Directly reduce the environmental impact of rail.
• Reduce the use of less carbon efficient modes of transport.
5.2.3 Improving the quality of life for communities and individuals
Rail plays an important role in connecting centres of population in the London and South East region. The railway connects large numbers of people with key social infrastructure, such as universities, city centre shopping areas and leisure sites and locations of national importance.
It also provides a key alternative to the motorway and trunk road network which can often suffer from congestion at times of the highest demand for the leisure market such as Friday evenings and Sunday evenings.
Modal shift from road to rail also provides significant benefit to the remaining road users by reducing congestion and the other associated external impacts of road usage.
Strategic goals for London and South East rail are therefore to:
• Better connect communities.
• Provide access to social infrastructure such as educational establishments and major leisure venues.
• Reduce road congestion.
Some of the strategic goals for rail articulated above also overlap with the overall goal of improving the quality of life for communities and individuals. The quality of the passenger experience provided by rail, in terms of such factors as speed, frequency, reliability, receiving accurate information about their journey and ease of ticket purchase and use will also enhance the perception of rail as an enabler of this overall goal.

Network Rail London and South East Market Study 24October 201305: Strategic goals
5.2.4 Improving affordability and value for money
Providing value for money is a key criterion, both for governments’ funding decisions as part of a wider transport appraisal framework and for the rail industry’s customers. All rail industry investment proposals need to be justified in terms of an assessment of the likely value generated by the level of public investment sought.
In the context of government funding, the continuing pressure on UK public finances and a significant, albeit reducing, rail industry subsidy requirement per passenger kilometre, means that improving industry affordability is a key priority. The importance of providing excellent value for money has been reinforced through the McNulty Value for Money report, Network Rail’s Strategic Business Plan and the Industry Strategic Business Plan.
In broader terms, however, the balance of funding between the public sector and the railway’s direct customers can and will vary, so affordability cannot be viewed from a purely public sector perspective. The 30 year timeframe considered by the LTPP means that affordability has to be considered in the round, considering the contributions that passengers and other customers are likely to make, rather than being conditioned solely by whether the availability of public finances increases or reduces.
Irrespective of the likely balance of future funding, it is important that, where possible, the difference between the rail industry’s costs and revenue is reduced.
In developing the strategic goals for rail, the Market Studies do not provide statements on what the level of fares and pricing policies should be in the long term.
The strategic goals for rail are therefore to:
• Meet all of the strategic goals (from above) in a value for money and affordable way.
• Directly reduce the whole industry subsidy.
These strategic goals cannot be addressed at a market level without also considering the specification of rail services and infrastructure to meet them. They are therefore more appropriate for detailed consideration in the later stages of the LTPP, however given the importance of these issues to funders they have been published at this stage of the process.

Network Rail London and South East Market Study 25October 201306: Long Term Demand Scenarios
Identifying the appropriate role of rail in the context of these long term priorities requires extension of Network Rail’s current demand projections to a 30-year time horizon.
6.1 Introduction
As discussed in Chapter 5, the aim of the Market Studies is to develop an understanding of how rail can make a successful long term contribution to the key priorities of current and potential future rail industry funders. These priorities or strategic goals are economic growth, a reduction in carbon and other adverse environmental impacts, improved quality of life, and improved industry affordability.
Identifying the appropriate role of rail in the context of these long term priorities requires extension of Network Rail’s current demand projections to a 30-year time horizon. This is because many common major railway infrastructure components, such as track systems, have an asset life of around 30 years. Decisions to change the capability of the network therefore require an understanding of the likely usage of it over this time period to maximise the value and useful life of the investment, and to capitalise on the significant opportunity for improved outputs available at the point where infrastructure systems fall due for renewal. Demand forecasting over such a long term period represents a considerable challenge and a three-stage approach has been undertaken to develop these long term demand projections:
• First, the extensive body of industry research on rail demand has been reviewed to identify and group the likely factors that determine the number of people who travel by rail.
• Second, a series of potential alternative economic futures for Great Britain has been developed which would result in differences in these factors. These futures are articulated as four scenarios.
• Third, these scenarios have been used to define the inputs into long term demand models for each of the passenger market sectors. These models combine existing industry research and techniques with some primary research undertaken by Network Rail.
The rest of this chapter is structured on the basis of this methodology:
Section 6.2 explains the factors that influence demand for travel by rail
Section 6.3 details the long term scenarios, and how they are likely to affect the factors which influence demand
Sections 6.2 and 6.3 are similar for all three passenger Market Studies.
Section 6.4 explains the demand modelling approach for the London and South East Market Study
Section 6.5 presents the forecasts produced using these scenarios and modelling approach for the London and South East (LSE) Market Study.
6.2 Factors which influence the demand for travel by rail
6.2.1 Background
A summary of factors which determine the demand for travel by rail is presented below. This summary is based on a review of the extensive body of existing evidence on the subject referenced in Chapter 4, and some primary research carried out by Network Rail.
The existing research considered includes ongoing work by the Passenger Demand Forecasting Council (detailed in Section 4.4) and by some of its member organisations including Network Rail, the Department for Transport (DfT), Train Operating Companies, the Passenger Transport Executives, and academic institutions, and by other organisations such as local authorities, the Independent Transport Commission and the Office for National Statistics.
The ongoing body of existing research into the factors which influence the demand for travel for rail is extensive, dating back to the 1980s. Compiling a summary of this research is therefore a challenging undertaking and there are many, equally valid, ways to categorise and structure it.
Network Rail’s compendium of this research is presented below. Given the complexity of compiling this summary, the text in Section 6.2 is largely common to all three passenger Market Studies, with the specific impact on the London and South East passenger market discussed in more detail in subsequent sections of this chapter.
The factors which influence the demand for travel have been grouped into five headline categories. These are listed below and then described in more detail:

Network Rail London and South East Market Study 26October 201306: Long Term Demand Scenarios
• Macro economic factors.
• Micro economic factors.
• Demographics.
• Consumer tastes.
• The supply of travel opportunities.
A number of the factors presented under this categorisation are interdependent.
6.2.2 Macro economic factors
These are the factors which influence the demand for travel by rail as a result of economic incentives and pressures that occur outside the transport sector, and comprise the following:
• National and regional employment levels by type of employment. Total employment levels affect the aggregate number of trips by all modes of transport including rail for the purposes of commuting, and the type of employment affects the proportion of these trips for which rail is a viable option. For example office based employees are more likely to travel by rail than construction workers who may be required to transport heavy apparatus to and from their workplace.
The level and type of employment is driven by the performance and composition of the national and regional economies.
• The distribution of employment between principal regional centres (e.g. London) and other areas. In particular this affects the number of people for whom commuting or travelling on employers’ business by rail is more attractive than by other modes. This is because travel by rail into central urban areas at peak times is often faster than via the highway network, as travel by rail is not subject to urban traffic congestion or limitations on the availability of city centre car parking.
The distribution of employment between urban and other areas is driven by a number of factors, including the structure of the economy discussed above, the cost and supply of an appropriately skilled labour force, and public and private investment decisions.
• National and regional income levels. Income levels affect the number of discretionary trips that people make, by all modes of transport.
Income levels are driven by factors such as the performance of the domestic economy, and wage inflation versus increases in the cost of living.
• The distribution of income across the population of Great Britain. Similarly to the above, the level of domestic income equality affects the number of rail trips, as only the higher income groups in society tend to have the financial means to travel regularly. This is particularly true of long distance travel, although it is also relevant in the London and South East..The level of income inequality can be influenced by a combination of taxation policy, and the ability of supply side innovations to reduce the cost of consumables in Great Britain.
• The distribution of homes across Great Britain and between urban and other areas. The distribution of homes and in particular the relationships between where people live, work, and spend leisure time affects the demand for travel for all purposes and by all modes including rail. For example large numbers of homes on the outskirts of urban areas lead to significant inward commuting and leisure trips, and a dominant regional centre of population leads to large levels of business and leisure travel between the centre and elsewhere. The distribution of homes is driven by a number of factors including the attractiveness of urban areas as places to live, the distribution of employment opportunities, the stability of employment markets and Great Britain employment practices, immigration and migration trends, and national demographics (see Section 6.2.4).
• The coverage of individuals’ social networks. The geographical coverage of people’s social network affects the number of people who travel to visit friends and relatives by rail. This is because travel by rail, particularly over longer distances, is often faster than by other modes. This demand driver is most relevant for the long distance sector, but also applies in the London and South East market. A number of factors influence the coverage of the typical social network, including migration patterns (e.g. driven by university admissions), immigration trends, and the extent to

Network Rail London and South East Market Study 27October 201306: Long Term Demand Scenarios
which mobile technology helps people to maintain long distance relationships.
6.2.3 Micro economic factors
These are the factors which influence the demand for travel through economic incentives and pressures that occur within the transport sector, principally via the cost of travel by the various modes of transport:
• Cost of travel by car and car ownership. Car has a dominant mode share in most markets for travel and in most parts of Great Britain, and a change in the cost of car travel can therefore have a significant proportional impact on the demand for travel by rail. There can often be a time delay before this impact occurs as the decision to travel by car or not can be associated with choices around car ownership.
Several factors influence the cost of travel by car including the price of crude oil, vehicle efficiency, the availability, cost and suitability of cleaner or non-fossil fuels, the cost of car parking, Government taxation policy, the price of new and used cars and the cost of insurance.
These factors in turn influence the level of car ownership.
• Cost of domestic travel by air. The cost of travel by air can have a significant effect on the demand for travel by rail on a number of long distance routes to London where air and rail compete. It also affects the level of rail demand to and from airports within London and the South East.
Similar to travel by car, the factors which drive the cost of domestic air travel are the price of crude oil, vehicle efficiency, and Government taxation policy.
• Cost of travel by rail. The impact of the cost of travel by rail depends on the characteristics of the market which rail serves. Where rail has a dominant market position, e.g. for commuter travel into central London, the impact of a change in cost on rail demand is typically small, whereas in markets where car travel is very competitive, e.g. for off-peak travel between medium sized towns, a change in cost can significantly affect the number of rail passengers.
The price of travel by rail is influenced by a number of factors including the rail industry cost base, rail fares policy and commercial decisions.
6.2.4 Demographics
These are the elements of the composition of Great Britain’s population which affect the demand for travel by rail. Namely:
• The population of Great Britain and its regions. Population affects the demand for travel by all modes including rail.
The factors which drive the size of the population are life expectancy, birth rates, immigration, emigration, and domestic migration.
• Age of the population. The age of the population affects the number of people who travel by rail regularly such as commuters, both directly and indirectly through its relationship with the state retirement age and the ability to travel by car.
The factors which determine the age of the population are the same as for the size of the population.
• Household composition. The structure of a household affects the number of people who travel by rail, particularly for the purposes of commuting and employers’ business. For example, households with multiple occupants in employment generate more travel per person for these purposes than households where one or fewer people are employed. This is partly a result of the proportion of the household which is in employment, and partly as it is more difficult for a household with multiple workers to locate in an area close to the employer of all the workers within it. These factors lead to longer distance commuting which plays to rail’s competitive strengths.
A number of inter-dependent factors influence household composition including the cost of living versus incomes, the age of parents when their first child is born and social preferences.

Network Rail London and South East Market Study 28October 201306: Long Term Demand Scenarios
6.2.5 Consumer tastes
These are the factors that influence the demand for travel by rail as a result of the attitudes, preferences, and choices of consumers. Namely:
• Use of travel time. The facilities for people to use time spent travelling in the way they choose can influence the demand for travel by rail, particularly as it is not currently possible to use time spent on driving a car for other purposes.
Factors which influence this are journey purpose (passengers are more likely to work during transit if they are commuting or on employers’ business), on-board facilities, and the availability of enabling mobile technology.
• The match between consumer tastes, consumer perceptions and rail travel products. The ability of the rail industry to tailor its products to meet the requirements, tastes and expectations of customers will influence the number of people who travel by rail. Passengers’ perceptions of the overall rail journey experience compared to the experience of using competitor modes of transport will also affect mode choice.
These factors include the provision of information around rail fares and journey opportunities, ticket booking facilities, ticketing technology, real time journey and product information and journey comfort. Individuals’ expectations around these factors are partly driven by how well products in other transport and non-transport sectors are tailored to their requirements, and their willingness to accept these elements will vary accordingly.
6.2.6 Supply of travel opportunities
These factors relate to the supply and quality of opportunities to travel by rail and the modes that compete with rail. The impact of these factors on the demand for travel by rail is similar to the micro economic factors described above. The supply and quality of travel opportunities have been categorised as follows:
• Capacity of the rail network. This is influenced by demand for travel at peak times and investment in additional capacity to keep pace with this demand.
• Rail (generalised) journey times and punctuality. This is influenced by investment in schemes to reduce journey times or increase the frequency of direct services between locations, commercial decisions and by the ability of the network to operate punctually.
• Availability and capacity of other public transport networks. The availability and capacity of other modes of public transport, such as London Underground, bus and tram networks, affects mode choice. This is influenced by demand for travel at peak times and investment in additional capacity to keep pace with this demand.
• Capacity of the highway network. This is driven by demand for travel at peak times and investment in additional capacity to keep pace with this demand.
• Highway (generalised) journey times. This is driven by the ability of the road network to maintain/improve journey times given expected future traffic levels, and investment to maintain journey times on the existing network and expand the network to new locations.
• Access to the rail network. This is influenced by investment in car parking and cycle facilities, and integration with other public transport modes such as London Underground, bus and light rail.
• Capacity of Britain’s airports. This will be determined by Government policy on future aviation capacity.

Network Rail London and South East Market Study 29October 201306: Long Term Demand Scenarios
6.3 Long term scenarios
Forecasting market demand over a very long period of time such as 30 years is a difficult undertaking despite a strong body of market research of the type summarised above. This is because over a long time period structural changes can occur in society which radically alter the factors which have historically influenced demand in a market. Relying exclusively on a continuation of historical relationships is therefore likely to fail given a sufficient time period. For example most forecasts of national rail passengers produced in the late 1980s and based only on an extrapolation of decades of declining and stagnating patronage, would have failed to recognise any likelihood of the approximate doubling of passenger journeys that occurred over the following 20 years.
Network Rail has therefore used an approach called “scenario planning” which is designed to consider the range of societal outcomes that can occur over a long time period, then to estimate how these outcomes would be likely to change the factors which influence demand. This approach is common in other industries with very long term planning horizons and large sunk costs, and Network Rail first undertook scenario based demand forecasting in the June 2009 Network RUS Scenarios & Long Distance Forecasts.
The development of long term demand scenarios for the Market Studies has built on this approach developed in the Network RUS by updating and expanding the factors considered to all of those discussed in the previous section, by considering the London and South East and Regional Urban passenger markets, and also by increasing the time horizon to 30 years. The demand scenarios are generic to all passenger Market Studies and share similar demand factors. The resultant narrative was discussed at meetings of the Working Group and Local Groups, and refined to reflect the consensus of opinions from these groups. This narrative postulates four future scenarios which would be likely to result in large differences in the factors which influence demand described in Section 6.2. These scenarios are intended to produce a range of the likely future demand for rail in 30 years and are not intended to be exhaustive. The scenarios are explained in detail below and summarised in Figure 6.1.
Two headline characteristics have been identified which determine
these scenarios, namely:
• The economy. The performance of Great Britain’s economy measured against the strength of other national economies and the extent to which this economy is integrated with other national economies.
The economy can either remain strong on the global stage maintaining its position within the G20 group of leading economies, or lose ground, perhaps only remaining in the top 50 world economies.
The economy can either be integrated with other national economies, trading regularly across all types of goods and services, or be isolated, producing all or most of its goods and services domestically.
This implies four long term outcomes for the national` economy:
– Strong, global. A strong economy on the global stage which prospers from its integration with the rest of the world.
– Strong, insular. A strong economy on the global stage which prospers from its self-sufficient nature.
– Mid-ranking, global. A mid ranking economy on the global stage which suffers from its integration and trading position with other national economies.
– Mid-ranking, insular. A mid ranking economy on the global stage which suffers from an absence of trade with other countries.
• Our social and environmental planning. The extent to which Great Britain is willing to intervene to address the negative impacts associated with modern society and globalisation, namely social inequality and carbon emissions, and the extent to which technology enables interventions.
British society can either decide to intervene actively to reduce social inequality and carbon emissions, or to take a passive approach. Technological advancements will either provide effective low cost solutions to the negative impacts associated with modern life and globalisation, for example through provision of low-cost consumables and alternatives to fossil

Network Rail London and South East Market Study 30October 201306: Long Term Demand Scenarios
fuels, or it will provide piecemeal high cost support to some of these problems.
This implies four long term outcomes for Great Britain’s social and environmental planning:
• Active, technologically enabled. Great Britain society and Governments actively seek to reduce social inequality and carbon emissions, with technology limiting the requirement for this to be achieved through taxation.Passive, technologically enabled. Great Britain society and Governments are passive in their approach to social inequality and carbon emissions, although technological advancements allow some problems to be addressed.
• Active, technologically limited. Great Britain society and Governments actively seek to reduce social inequality and carbon emissions, although limited assistance from technology requires taxation to achieve this.
• Passive, technologically limited. Great Britain society and Governments are passive in their approach to social inequality and carbon emissions, and technology offers little solution to these problems.
These long term outcomes for Britain’s social and environmental planning have been combined with those for the economy in order to articulate four future scenarios which examine the range in the likely factors which influence the demand for travel by rail. It is envisaged that these four scenarios represent the four most likely combinations of the economic and social/environmental outcomes, but other future combinations may also be possible.
These scenarios and their likely impact on the factors which influence rail demand articulated in Section 6.2 is detailed in Figures 6.1 and 6.2. As discussed above the scenarios are not intended to be exhaustive and it is possible that over the next 30 years circumstances could change to reflect more than one scenario, or reflect a combination of scenarios.
Prospering in global stability (PGS). The British economy is strong, prospering through its integration with other national economies by exporting high value products and importing low value products. Britain takes an active role in solving social and environmental
problems, partly to maintain a stable service industry for its high value activities and a stable supply chain for the imports it requires, and partly because its technological advancement and high national wealth allows this to be done without worsening individuals’ standard of living.
Prospering in isolation (PII). The British economy is strong, prospering by concentrating on domestic production in isolation from global market pressures. Britain takes little interest in solving social and environmental problems. This is partly because it has neither a dependency on stable foreign import markets, nor a stake in global technological innovation, and partly because the mixture in value of domestic economic activities undertaken to maintain self-sufficiency prevents redistribution of domestic resources without worsening individuals’ standard of living.
Struggling in global turmoil (SGT). The British economy is performing poorly, struggling to compete in high value export markets as the global supply chain and credit markets are volatile and other countries improve their employee skill levels and resource base. Britain takes an active role in addressing social and environmental problems, partly in an attempt to stabilise global import and credit markets, and partly because global technological innovation allows it to do so without worsening individuals’ standard of living.
Struggling in isolation (SII). The British economy is performing poorly in the absence of both an export market for its high value products and a source of inexpensive imported materials and technological innovation to support domestic production. Britain takes little interest in solving social and environmental problems as it has neither the wealth nor the technology to achieve this without worsening individuals’ standard of living.

Network Rail London and South East Market Study 31October 201306: Long Term Demand Scenarios
GB Economy
GB social and environmental planning
KeyFigure 6.1. Long term scenarios
Struggling in isolation
Prospering in global stabilityProspering in isolation
Struggling in global turmoil
Prospering
Struggling
Insular Global
Technologically limited
Passive Active
Technologically enabled

Network Rail London and South East Market Study 32October 201306: Long Term Demand Scenarios
Figure 6.2. Impact of the long term scenarios on the factors which influence the demand for rail*
*The term HS2 in this graphic refers to the proposed new high speed line between London, Birmingham, and the north of England (the Y-shaped network) currently being developed by High Speed 2 Limited.
GB Economy
GB social and environmental planning
Key
Struggling in isolation
- High employment and low turnover- Mixed economic structure- Employment spread between urban and other areas- High income, unevenly distributed- Moderate immigration- Low domestic migration - Moderately spread social networks- Low taxation on travel- Cars are very e�cient/environmentally friendly- Moderate population- Mixed population age profile and composition of households - Travel time used productively- Rail products well matched to consumers’ needs- High car ownership- Investment in surface transport including HS2- No investment in airport capacity
Struggling in global turmoil
P rospering
Struggling
Insular GlobalPassive Active
Prospering in isolation Prospering in global stability
- Very high employment and low turnover- Knowledge-based economy- Employment concentrated in towns and cities- High income, evenly distributed- High immigration- High domestic migration from urban areas- Widespread social networks- Moderate taxation on travel- Cars are very e�cient/environmentally friendly- High population- Mixed population age profile and composition of households - Travel time used productively- Rail products well matched to consumers’ needs- Moderate car ownership- Investment in all forms of transport including HS2 and airport capacity
- Low employment and low turnover- Mixed economy- Employment spread between urban and other areas- Low income, unevenly distributed- Low immigration- Moderate domestic migration from urban areas- Predominantly local social networks- Low taxation on travel- Cars are ine�cient/environmentally polluting- Moderate population- High population age profile, high proportion of multiple income households - Travel time not used productively- Rail products not well matched to consumers’ needs- Moderate car ownership- Limited investment in surface transport
- Low employment and high turnover- Mixed economic structure- Employment concentrated in towns and cities- Low income, partially equalities of distribution- Low immigration- Moderate domestic migration - Moderately spread social networks- High/medium taxation on travel- Cars are ine�cient/environmentally polluting- Moderate population- High population age profile, high proportion of multiple income households - Travel time used productively- Rail products not well matched to consumers’ needs- Low car ownership- Investment in all forms of transport including HS2 and airport capacity
Technologically limited
Technologically enabled
Network Rail London and South East Market Study 33October 201306: Long Term Demand Scenarios
6.4 Demand modelling approach
6.4.1 Introduction
At peak times on weekdays the railway lines to/from central London are both the most frequently served and the most congested rail corridors in the study area. Given the strategic importance of London as a centre of employment, commerce, population, and leisure activity, understanding the likely future demand for travel to/from central and inner London during the weekday peak is fundamental to establishing the role of rail in delivering the strategic goals articulated in Chapter 5.
Providing sufficient capacity to accommodate the demand for travel between other locations in the study area and at other times of the week are important considerations, however instances of current and likely future overcrowding are far less prevalent than in the corridors to/from London at peak times.
The demand modelling work has therefore primarily focussed on travel to/from central and inner London during the weekday peak.
Outside London and/or away from peak times overcrowding tends to be a result of location-specific factors including localised special events, and it is therefore more appropriate to forecast the future change in these factors during the Route Studies, in those instances where there is likely to be a future capacity problem of this nature.
Of the factors detailed in Section 4.2, six have a dominant impact on the demand for travel into central and inner London during peak periods. These are:
• The level of employment in central and inner London.
• The population of the London commuter catchment area.
• The propensity of the population of the main rail catchment areas to work in central and inner London.
• The interaction between the national rail network and the total public transport system in London, in particular the London Underground and local bus networks.
• Major changes to rail services and infrastructure.
• Major changes in land usage.
Modelling the impact of the interaction between the national rail network and the local public transport network in London is an extremely complex exercise. An exercise of this nature was undertaken for the London and South East Route Utilisation Strategy (RUS), published in 2011, using Transport for London’s (TfL’s) multi-modal models, London Transportation Studies (LTS) and RailPlan1.
This work forecast the impact on the demand for travel by rail by 2031 of the interaction between the London public transport network and the major changes in national rail services and infrastructure scheduled for implementation in Control Periods 4 and 5 (CP4 and CP5), such as Crossrail and the Thameslink upgrade programme, using a single central scenario around employment, catchment population and land usage.
The London and South East RUS demand modelling was used as the starting point of the London and South East Market Study forecasting approach. The demand modelling was then adapted2 by Network Rail, as follows:
1) A review of the key assumptions in the RUS work, with amendments where necessary.
2) An estimate of how the RUS forecasts for 2031 are likely to have materialised by 2023 (year 10 of the 30-year period considered by London and South East Market Study).
1 The LTS model is a multi-modal model focussed on Greater London and the area within the M25 motorway. LTS is the only current demand model to combine trip generation, distribution and modal choice across the whole of this area in detail, combining both public transport usage and highway assignment choices for road users. RailPlan is a public transport assignment model, which forecasts the specific routes that travellers take to make their journeys. It provides more detail than LTS on demand assigned to the public transport network for Inner London in particular. Together, the two models provide the best tools for modelling and future predictions for the majority of the London peak market.2 The demand modelling was adapted outside of the LTS and Railplan suite of models.

Network Rail London and South East Market Study 34October 201306: Long Term Demand Scenarios
3) Development of a range of outcomes around London employment, the London and South East population, and the propensity of the rail catchment population to commute to London, and major changes in land usage, based on the scenarios in Section 6.2. Then based on these outcomes, an extension of the RUS projections for 2031 to provide a forecast range for 2043 (the end of the 30-year period considered by London and South East Market Study).
6.4.2 Review of the London and South East RUS work
The RUS modelling produced forecasts of passenger demand growth to 2031 for the busiest hour in the morning peak (generally 08:00 – 08:59 arrivals in central London) on National Rail services, for each corridor into London. For simplicity, the evening peak is assumed to be equally as busy as the morning peak. In practice, the evening peak tends to be spread over a longer time period.
A review was undertaken of the key assumptions which underpinned this demand modelling work to ascertain whether these assumptions would differ significantly if the work were repeated, and whether any such differences would materially alter the demand projections.
These assumptions include:
• The number and geographical distribution of current and future jobs and households.
• The size and geographical distribution of the current and future population.
• The current and future national rail and London public transport network.
The review concluded that these assumptions had not changed significantly since the development of the London and South East RUS demand modelling, and that the London and South East RUS forecasts would not differ materially if they were produced again.
The RUS forecasts were therefore viewed as an appropriate building block for the London and South East Market Study.
6.4.3 Short term forecasting approach
As discussed above, the London and South East RUS forecasts were an estimate of how the composite impact of changes to exogenous factors and major rail service changes planned for implementation in CP4 and CP5 such as the Crossrail and the Thameslink upgrade programmes, were likely to have affected peak passenger demand to/from London during the weekday peak by 2031.
The 10-year Market Study demand projections for each corridor were produced by applying the average compound annual growth rate from the RUS forecasts over 10 years, to the estimated demand impact of the forthcoming rail service changes.
It is anticipated that the risk to the exogenously-driven growth is relatively small over this time period. Given the magnitude of the service changes, it is not possible to articulate meaningfully the risk to the service driven demand changes through further modelling work. It was therefore decided to report a single demand projection per corridor, rather than a range of projections for the ten year period.
This forecasting approach is illustrated in Figure 6.3.
Demand projections for long distance travel to/from London were produced as part of the recently published Long Distance Passenger Market Study. For completeness, these forecasts are also reported in this document, in Figures 6.5 and 6.7.

Network Rail London and South East Market Study 35October 201306: Long Term Demand Scenarios
2011 20432023 P
asse
nger
jour
neys
Background growth
Induced growth
Scenarios
Figure 6.3: London and South East Passenger Market Study demand modelling approach - weekday peak
Market study 30 year
Market study 10 year
London and South East RUS
Network Rail London and South East Market Study 36October 201306: Long Term Demand Scenarios
6.4.4 Long term forecasting approach
A bespoke demand model was produced to convert the London and South East RUS projections into long term demand scenarios based on the four future scenarios articulated above. This model, which is based on the exogenous forecasting framework detailed in the Passenger Demand Forecasting Handbook (PDFH), allows the exogenous factors (listed in Section 6.4.1) which have a dominant impact on the demand for peak rail travel to/from central London to vary by scenario.
Several of the factors in the model were therefore set at levels that are commensurate with the circumstances articulated by the four scenarios. These are described below and summarised in Figure 6.4.
For all four scenarios the level of growth in central and inner London employment over the first 10 years of the forecasts was kept at the rate used in the London and South East RUS. This growth rate of 0.86 per cent per annum was taken from the London Plan 2011.
This high rate relative to the national trend is reflective of London’s unique position as a global employment market and, as alluded to above, selection of a single rate for the first 10 years is based on an expectation that significant changes to the London employment market would take many years to materialise.
However, over the final 20 years of the forecasts central and inner London employment growth was varied based on the characteristics of each scenario, as major changes could occur over this time period. For each scenario the employment growth rate was based on a combination of the assumed rate of UK economic growth, and the share of this growth accounted for by economic activity in large cities versus other places. This is consistent with the forecasting approach used for the Long Distance and Regional Urban Passenger Market Studies, with recognition of London’s currently unique status provided through use of a single (relatively high) growth rate for the first 10 years.
In the Prospering in Global Stability scenario, where London is the first and principal point of interaction between a prospering UK economy and foreign economies, employment growth is forecast at 0.88 per cent per annum.
In the Prospering in Isolation scenario, where strong UK economic
growth is driven by burgeoning domestic production located outside of large city centres, employment growth is forecast at 0.67 per cent per annum.
In the Struggling in Global Turmoil scenario, where the little growth that occurs in the UK economy is concentrated in large city centres, employment growth is forecast at 0.22 per cent per annum.
In the Struggling in Isolation scenario, with minimal economic growth and a proliferation of economic activity away from large city centres, employment growth is forecast at 0.17 per cent per annum.
Similarly to the above, under all four scenarios the population of the London commuting catchment area was assumed to grow at a single rate (0.85 per cent per year) for the first 10 years considered. This rate is based on the Office for National Statistics (ONS) 2010 sub-national population projections.
Thereafter, the London commuting catchment population was allowed to vary with the characteristics of each scenario.
Under the ‘global’ scenarios the population of the London commuting catchment area is assumed to grow at a faster rate than the ONS projections, and vice versa for the ‘isolation’ scenarios.
A change in the UK retirement age was used as a proxy for a change in the propensity for the population of the London commuter catchment to work in London. In the ‘isolation’ scenarios where Britain is passive in its approach to social equality, it is assumed that the state retirement age is 70, leading to 50 per cent of 65-69 year olds remaining in the workforce. Conversely, in the ‘global’ scenarios it is assumed that the retirement age is 65, leading to no 69 year olds remaining in the workforce. The impact of this varies from corridor to corridor depending on the projected future age profile of the people in the rail catchment area.
The location of the main London and South East hub airport was used as a proxy for a major potential change in land usage. It was assumed that in the ‘global’ scenarios, where the economy of Britain is integrated with other national economies, additional airport capacity is built in the London and South East study area, equivalent to that provided by two additional runways. In order to

Network Rail London and South East Market Study 37October 201306: Long Term Demand Scenarios
test the likely maximum potential impact of this on each rail corridor, it was further assumed that the future location of the main hub airport including this additional capacity varied on a corridor-by-corridor basis to the place which would be most attractive for travel by rail.
As discussed in Figure 6.4, demand projections for long distance travel to/from London were produced as part of the recently published Long Distance Passenger Market Study. For completeness, these forecasts are also reported in this document.
Figure 6.4: Modelled factors which vary by scenario
PII PGS SGT SII
London employment
0.86% p.a. (2013 – 2023)
0.67% p.a. (2024 – 2043)
0.86% p.a. (2013 – 2023)
0.88% p.a. (2024 – 2043)
0.86% p.a.(2013 – 2023)
0.22% p.a.(2024 – 2043)
0.86% p.a. (2013 – 2023)
0.17% p.a. (2024 – 2043)
London and South East population
0.85% p.a. (2013 – 2023)
0.84% p.a. (2024 – 2043)
0.85% p.a. (2013 – 2023)
0.90% p.a. (2024 – 2043)
0.85% p.a. (2013 – 2023)
0.86% p.a. (2024 – 2043)
0.85% p.a. (2013 – 2023)
0.84% p.a. (2024 – 2043)
Propensity to commute to/from central London50% age 65-69 in workforce
0% age 65-69 in workforce
0% age 65-69 in workforce
50% age 65-69 in workforce
Major changes in land usageNo investment in London and South East airport capacity
Investment in London and South East airport capacity, location of main hub maximises rail demand
Investment in London and South East airport capacity, location of main hub maximises rail demand
No investment in London and South East airport capacity

Network Rail London and South East Market Study 38October 201306: Long Term Demand Scenarios
6.5 Passenger demand forecasts, Central London peak
6.5.1 Overview
The forecasts presented in this study relate only to growth rates affecting the busiest points on routes at the busiest times of the day.3 It is likely that different growth rates will apply for passengers not travelling into central London, and for those not travelling in the busiest hour of the commuter peak.
In most cases, the main capacity constraint on a route affects capacity in the morning and evening peaks. Where sufficient capacity exists to accommodate peak capacity, there is usually the necessary route capacity and infrastructure to accommodate off-peak demand. This is not necessarily the case in some instances where specific constraints exist outside peak periods (such as the need to provide timetable slots for freight services or maintenance access at these times). The figures shown in Figures 6.5 and 6.7 should not be used to infer rates of growth other than in the busiest peak hour at the critical load point.
6.5.2 Short term demand forecast
Figure 6.5 shows the corridor-by-corridor peak hour demand projections for 2023. As discussed in Chapter 1, this is to help understand the likely progress towards the projected long term outcomes at the conclusion of Control Period 6. This is the first industry planning period for which major investment decisions are yet to be taken, and is hence a key focus for the Long Term Planning Process (LTPP).
The figures correspond to the level of growth expected by 2023 as a result of the factors considered in the methodology described above, plus the impact of the schemes for which funding has been committed in CP4 and CP5 (such as the Thameslink and Crossrail programmes).
The highest level of growth is forecast for the corridors where major service changes will be implemented in the next 10 years.
The projection for the number of passengers using services towards London Paddington which will be operated by Crossrail is articularly
3 Except the forecasts for the London Overground orbital routes which apply to annual passenger demand, see Section 6.5.2.
high, with almost 200 per cent growth anticipated. This is expected to be as a result of both an abstraction of passengers from other rail and London Underground services, and a stimulation of new journeys.
A high level of passenger growth (over 50 per cent) is also forecast on the current services to/from the east of London which would transfer to operation by Crossrail. Again, this is partly as a result of newly generated journeys and partly through abstraction of passengers from London Underground and National Rail, such as the services which currently terminate at London Fenchurch Street.
Modelled growth on services terminating at London Fenchurch Street is low, possibly because of anticipated abstraction to Crossrail services. Should exogenous growth on the eastern corridor to/from London be shared more evenly between the services, then peak demand on services terminating at London Fenchurch Street could be higher. The short term forecast for these services is therefore shown as a range in Figure 6.5, the higher end of which represents a scenario with similar background growth to the Great Eastern Main Line.
The impact on passenger numbers of the Thameslink upgrade programme is projected to be sizeable, with, for example, 64 per cent growth in journeys forecast on the ‘Thameslink and Sussex outers’ corridor. Similar to the above, this is a result of newly stimulated demand, and an abstraction of passengers from other corridors, including those into London Victoria and via Elephant and Castle.
In the corridors where no major service changes are planned, passenger numbers are typically forecast to grow at around 1–2 per cent per annum. This is largely as result of expected growth in central London employment.
The modelled growth on stopping services to London Waterloo on the South West Mainline (SWML) is unexpectedly low. As with any forecast, there is an inherent level of uncertainty, and an alternative scenario has therefore been developed to reflect the possibility that background growth on these services is similar to that forecast for the fast services on the SWML. The short term forecast for these services is shown as a range in Figure 6.5.

Network Rail London and South East Market Study 39October 201306: Long Term Demand Scenarios
Passengers from Kent have a choice of destinations in London, including London Bridge, London Charing Cross, London Cannon Street, London Victoria and London Blackfriars, as well as Thameslink services across London and high speed services to London St Pancras International. The eventual distribution of passengers from Kent will depend on a number of recent and upcoming service changes, including the deployment of rolling stock released by the new Thameslink carriages, the final routeing of Thameslink services within Kent, and the relative pricing of high speed and classic services. So these routes have been grouped together for forecasting purposes.
Transport for London have provided updated forecasts for the London Overground orbital routes which now includes the impact of lengthening services on these routes4. These forecasts, presented in Figure 6.6, are for all-day growth in annual passenger volume on the route. The orbital lines are busy along much of their routes, with frequent turnover of passengers undertaking short journeys.
As stated above, the forecasts presented in this chapter include only the modelled impact of schemes for which funding has been committed in CP4 and CP5. Any other schemes for which funding subsequently becomes committed will affect both the demand for rail travel and the distribution of trips to some degree. Where such changes are expected to be material, the forecast should be adapted to reflect the changes.
6.5.3 Long term demand projections
Figure 6.7 shows the level of growth expected by 2043 as a result of the factors considered in the methodology described above, plus the impact of the schemes for which funding has been committed in CP4 and CP5 (such as the Thameslink and Crossrail programmes).
4 The forecasts for the orbital routes have been produced with a later version of RailPlan and include:• 5-carservicesontheWestLondon,EastLondonandNorthLondonlines• Updatedeconomicassumptions• PopulationprojectionsfromtheLondonPlanappliedto2011Censusdata
The impact of other major schemes which could be implemented within the 30 year Market Study time horizon have not been included. This is because at this relatively early stage a number of uncertainties exist, for example relating to scope and eventual service specification of such schemes. An example of a major scheme of this nature is the proposal for a second North – South London rail crossing (Crossrail 2).
Similarly to the short term forecasts, the 30-year demand scenarios are most heavily influenced by the Crossrail and Thameslink programmes. Passenger growth is forecast to be very high in the corridors in which these services will operate, and lower than the average for the sector in the corridors where services and/or passengers will transfer to Crossrail or Thameslink (e.g. London Fenchurch Street and London Victoria).
The forecasts show some sensitivity to the exogenous factors which vary by long term scenario, such as central London employment. Leaving aside the long distance routes, the minimum projection in the forecast range is around 10 – 30 per cent lower by corridor than the maximum (this difference is accentuated for the corridors where high growth is expected from Crossrail or Thameslink), implying a difference of roughly 0.3 – 0.9 per cent per year.
This range is typically smaller than those projected in the concurrent studies relating to the Regional Urban and particularly the Long Distance passenger markets, segments of which are reported in this study. The modelled factors which drive most of this difference in this range for the London and South East market are central London employment and the London and South East population.

Network Rail London and South East Market Study 40October 201306: Long Term Demand Scenarios
The combination of this dominant impact of central London employment and the London and South East population in the projections, and the narrow forecast range relative to other sectors, suggests that the London and South East peak market is relatively more mature and less susceptible to risk in the longer term than the other sectors.
The impact of changes in the propensity of the catchment population to work in central London, and major changes in land usage such as a hub airport are forecast to have a relatively small impact on the total number of peak passengers.
Transport for London provided updated forecasts for the London Overground Orbital routes, including projections for high-growth and low-growth scenarios. These forecasts, presented in Figure 6.8, are for all-day growth in annual passenger volume on the route, and extend to 2031. As advised by Transport for London, the growth to 2043 is capped at the 2031 high-growth scenario. These figures reflect the impact of introducing five-car services on the West London, East London and North London lines and also include growth in travel outside of peak periods.

Network Rail London and South East Market Study 41October 201306: Long Term Demand Scenarios
Figure 6.5: London and South East peak hour passenger demand projections 2011 – 2023. (Background growth plus committed schemes in CP4 and CP5)
Route Service group 2011 total Forecast Passengers in 2023 Increase 2011 to 2023
London PaddingtonCrossrail & Relief line 4,100 12,200 198%
Main line + other fast trains * 8,500 9,500 – 11,000 11% – 29%
London Marylebone All services 6,500 7,900 22%
London EustonLong Distance* 3,300 3,700 – 4,800 10% – 43%
Suburban services 8,800 11,100 26%
London St Pancras International
Thameslink Midland Mainline (MML) 9,700 14,100 45%
MML Long Distance * 2,500 2,900 – 3,800 15% – 52%
London King’s Cross / Moorgate
Great Northern / Thameslink 16,700 20,100 20%
East Coast Mainline Long Distance * 2,600 2,900 – 3,700 11% – 41%
London Liverpool Street
West Anglia 15,700 18,500 18%
Great Eastern Main Line (GE) 19,500 25,800 32%
Inners & Crossrail GE route 13,600 20,700 52%
London Fenchurch Street All services 16,300 17,300 – 18,400 6% – 13%
London BridgeThameslink & Sussex fast 15,200 25,000 64%
Sussex stopping services 9,300 10,800 16%
London Blackfriars All services via Elephant & Castle 10,900 12,100 11%
London Victoria
Sussex routes - fast services 12,100 13,400 11%
Sussex routes - stopping services 12,900 14,800 15%
London Waterloo
South West Main Line 15,800 17,800 13%
Stopping trains via Wimbledon 23,600 25,500 – 27,800 8% – 18%
Windsor Lines 13,300 15,900 20%
Kent routes All services excluding via London Blackfriars
60,500 69,600 15%
*All day percentage projection from the Long Distance Passenger Market Study Draft for Consultation 2013, applied to peak passenger numbers
Figure 6.6: Short term growth forecasts for London Overground Routes (annual passenger journeys)
2011 total 2023 forecast Increase 2011 - 2023
West London Line & North London Line
42.4 million 84.2 million 100%
East London Line 32.3 million 89.9 million 178%
Gospel Oak - Barking Line 8.1 million 12.0 million 48%
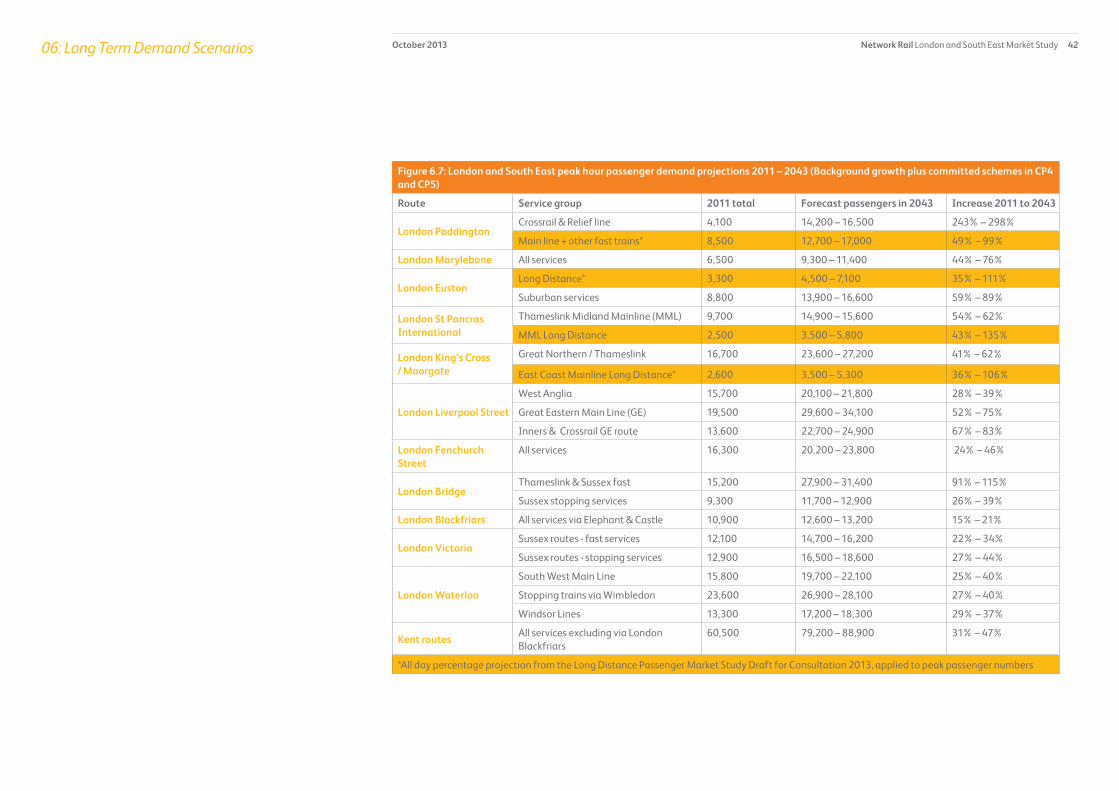
Network Rail London and South East Market Study 42October 201306: Long Term Demand Scenarios
Figure 6.7: London and South East peak hour passenger demand projections 2011 – 2043 (Background growth plus committed schemes in CP4 and CP5)
Route Service group 2011 total Forecast passengers in 2043 Increase 2011 to 2043
London PaddingtonCrossrail & Relief line 4,100 14,200 – 16,500 243% – 298%
Main line + other fast trains* 8,500 12,700 – 17,000 49% – 99%
London Marylebone All services 6,500 9,300 – 11,400 44% – 76%
London EustonLong Distance* 3,300 4,500 – 7,100 35% – 111%
Suburban services 8,800 13,900 – 16,600 59% – 89%
London St Pancras International
Thameslink Midland Mainline (MML) 9,700 14,900 – 15,600 54% – 62%
MML Long Distance 2,500 3,500 – 5,800 43% – 135%
London King’s Cross/ Moorgate
Great Northern / Thameslink 16,700 23,600 – 27,200 41% – 62%
East Coast Mainline Long Distance* 2,600 3,500 – 5,300 36% – 106%
London Liverpool Street
West Anglia 15,700 20,100 – 21,800 28% – 39%
Great Eastern Main Line (GE) 19,500 29,600 – 34,100 52% – 75%
Inners & Crossrail GE route 13,600 22,700 – 24,900 67% – 83%
London Fenchurch Street
All services 16,300 20,200 – 23,800 24% – 46%
London BridgeThameslink & Sussex fast 15,200 27,900 – 31,400 91% – 115%
Sussex stopping services 9,300 11,700 – 12,900 26% – 39%
London Blackfriars All services via Elephant & Castle 10,900 12,600 – 13,200 15% – 21%
London VictoriaSussex routes - fast services 12,100 14,700 – 16,200 22% – 34%
Sussex routes - stopping services 12,900 16,500 – 18,600 27% – 44%
London Waterloo
South West Main Line 15,800 19,700 – 22,100 25% – 40%
Stopping trains via Wimbledon 23,600 26,900 – 28,100 27% – 40%
Windsor Lines 13,300 17,200 – 18,300 29% – 37%
Kent routes All services excluding via London Blackfriars
60,500 79,200 – 88,900 31% – 47%
*All day percentage projection from the Long Distance Passenger Market Study Draft for Consultation 2013, applied to peak passenger numbers

Network Rail London and South East Market Study 43October 201306: Long Term Demand Scenarios
Figure 6.8 : Long term growth forecasts for London Overground Routes (annual passenger journeys)
2011 total 2031 forecast 2043 estimate Increase 2011 - 2043
West London Line & North London Line 42.4 million 90.5 – 118.4 million 118.4 million 279%
East London Line 32.3 million 100.7 – 131.7 million 131.7 million 407%
Gospel Oak - Barking Line 8.1 million 13.1 – 17.1 million 17.1 million 211%
As an example, the Greater London Authority (GLA) has recently increased its population projections for London boroughs, following results from the 2011 Census becoming available. The impact on the propensity for rail travel are complex. At peak times, the balance of commuting within London, and commuting from outside of London to Central London could change, depending on the proportion of London jobs taken up by resident Londoners.
Similarly, the demand modelling undertaken for the forecasts is sensitive to the service specification assumed for Thameslink services post-2018. This specification is still under review by the Department for Transport and stakeholders, and may be subject to further changes. Where new information becomes available, the forecasts should be adapted to reflect this.
As an example, immediately prior to publication of the London and South East Market Study Draft for Consultation, Transport for London announced its intention to lengthen services on the orbital London Overground services from four-car length to five-car length. The demand impact of this capacity increase has been incorporated into the forecasts presented above for the orbital routes, which have been revised since the draft document was published.
As other major schemes become committed over the 30-year timeframe, their impact on passenger capacity and travel behaviour will need to be reflected in forecasts when they are refreshed.
The impact of the HS2 Y-network has not been included in the forecasts presented in Figure 6.7. There is expected to be a large increase in rail demand between the cities connected by the HS2 network. Much of this demand will be accommodated on the new High Speed line. In London, this will mean an increase in the demand into Euston station via the High Speed line, which will in turn relieve some of the demand pressure on the existing West Coast Main Line, the East Coast Main Line and the Midland Main Line5.
The extent of the increase in demand into London Euston will depend on the proportion of passengers on HS2 who choose to alight at Old Oak Common, and the onward connectivity provided at both London Euston and Old Oak Common. Depending on the connections and interchange opportunities offered between the high speed line and other rail and tube services at Old Oak Common, it is likely to become a significant transport hub, with a resulting impact on demand on the Great Western Main Line, Overground services, Crossrail and other local public transport services.
6.5.4 Maintaining forecasts
The forecasts above represent the best available information at the time of modelling. They should be kept under review in light of emerging information, and revised or adapted as necessary.
5 There is insufficient clarity at this early stage about the post-HS2 service specification on commuter lines into King’s Cross and St Pancras stations, which will in turn influence the level of future demand at these stations.
Network Rail London and South East Market Study 44October 201307: Long term conditional outputs – aspirations for 2043This chapter presents the conditional outputs for the London and South East passenger market. They are a statement of the long term aspirations for the level of service provision required to inform future investment decisions.
7.1 Introduction
As discussed previously, the principal objective of the Long Term Planning Process (LTPP) is to inform investment decisions on the capability of the rail network and the train services which operate on it. The ramifications of these decisions are profound, as railway assets such as signalling systems and rolling stock are both expensive and long-lasting. A long term vision is therefore required to optimise the value of future investment and to avoid procurement of redundant assets.
This chapter presents the conditional outputs for the London and South East passenger market. They are a statement of the long term aspirations for the level of service provision required to inform future investment decisions. They are therefore the key deliverable of the Market Study and form the basis for the rest of the LTPP.
The requirement to look to the long term has changed the emphasis of industry planning, from consideration of ‘what can be achieved given existing constraints’, to ‘what should be achieved to deliver the desired outcome’.
The conditional outputs are the desired outcomes. They are therefore not currently constrained by considerations of cost and deliverability. These issues are addressed in the next stages of the LTPP, where Route Studies assess opportunities for improvement and their feasibility in more detail.
On this basis the conditional outputs have been developed using an assessment of how to deliver three of the four strategic goals from Chapter 5:
• Enabling economic growth.
• Reducing carbon and the transport sectors’ impact on the environment.
• Improving the quality of life for communities and individuals.
• However, they have not been based on an explicit assessment of the fourth goal (although supporting commentary is provided where appropriate):
• Improving affordability.
• This goal will be considered in the remainder of the LTPP, as explained in Chapter 1.
The conditional outputs are therefore conditional on a subsequent favourable assessment of value for money and affordability for current and potential future rail industry funders. They will also be subject to operational feasibility, and deliverability tests in the Route Studies. They should therefore be viewed as aspirations for the future rather than recommended investment decisions.
It is important to emphasise that improvements to rail services are only one of the conditions required to generate funders’ desired outcomes, and the conditional outputs should be viewed as a statement of rail’s role in a wider policy context.
7.2 How the conditional outputs were developed
The starting point for developing the conditional outputs was the list of themes developed through the first round of Local Group meetings discussed in Chapter 1. This list (repeated below) represents the potential means by which the supply of rail services to the London and South East passenger market can positively influence outcomes relating to the economy, environment and quality of life for communities and individuals:
1. Sufficient passenger capacity to accommodate demand.
2. Improved connectivity to central London.
3. Improved connectivity within the Market Study area, other than to central London.
4. Improved access to international gateways.
5. Improved connectivity to centres of service provision including retail, tourism and higher education.
6. Competitive services to abstract trips from congested roads.
7. Improved access to the rail network.
8. Improved passenger satisfaction.
9. Competitive prices compared with other modes and improved pricing and ticketing, in terms of both new rail ticket products and ease of purchase.

Network Rail London and South East Market Study 45October 201307: Long term conditional outputs – aspirations for 2043
These themes were investigated using a combination of discussions with stakeholders and a review of the literature summarised in Chapter 4.
Primary research was then undertaken to quantify the impact that the service improvements covered by these themes could have on the strategic goals. This research is summarised below, and has been used to develop the conditional outputs relating to connectivity/service levels detailed in Section 7.3.
Development of the demand scenarios detailed in Chapter 6 was used to produce the capacity based conditional outputs presented in Section 7.4.
7.2.1 Assessment of the economic impact of rail service levels
Improving business to business connectivity is critical in supporting economic growth. When cities and urban centres are well connected, people are more willing to travel for business purposes. Improved connectivity between economic centres helps to increase economic efficiency. Better connectivity increases competition and reduces costs in the supply chain through agglomeration and encourages trade and investment.
Improving the connectivity between employees and employers is also very important for the economy. A business with access to a large pool of labour is more able to employ people with the appropriate skills, thereby improving the productivity of its activities. Conversely, people with access to a large and diverse employment market are more able to maximise the value and productivity of their skills thereby benefiting from higher salaries.
The assessment of the economic impact of improvements to rail services in London and South East is based on the approach developed from a succession of publications on the subject such as the Eddington Transport Study 2006, Prioritising Investment to Support our Economy, Network Rail 2010, and the Department for Transport’s (DfT) WebTAG appraisal guidance. This approach estimates the relationship between:
• Economic output and business to business connectivity.
• Economic output and employee to employer connectivity.
The starting point for this analysis is the data illustrated in Figure 7.1
below. This is the proportion of travel undertaken in the London and South East area for both business and commuting purposes, versus the generalised cost of travel1.
On the assumption that people are averse to high cost and journey time, this relationship between the proportion of travel undertaken at increasing levels of generalised cost has been taken as a proxy for people’s willingness to travel. The analysis presented below has removed cost from the data to isolate the impact of total journey times (including time spent waiting for a train and changing trains).
The data suggests that when the time and cost of travel between businesses is very high (e.g. for journeys of three hours or more) most people do not travel to undertake business interactions. The demand impact of a small change in journey times on the level of business activity undertaken between urban centres of three or more hours apart is therefore relatively small. Whereas, when the time and cost of travel between businesses is moderate (e.g. for journeys of around 90 minutes) a significant number of people travel to undertake business interactions. Finally, when the time and cost of travel between businesses is low (e.g. for journeys of 30 minutes or less) most people travel to undertake business interactions. The impact of a change in journey times for journeys under 30 minutes on the level of business travel undertaken is therefore relatively low, although given the large numbers of people who travel over shorter distances, journey time savings can offer sizeable benefits against the quality of life goal in particular.
The data also suggests commuters are more sensitive to time and cost than business users, which makes intuitive sense as commuters travel more frequently. Further details of this analysis can be found in Appendix 1.
1 Generalised cost is the total cost of travel between the origin and destination stations including the price paid to travel, plus a monetised estimate of the total journey time including time spent waiting for a train and changing trains.

Network Rail London and South East Market Study 46October 201307: Long term conditional outputs – aspirations for 2043
A very small proportion of commuting occurs over journeys with a total journey time of greater than two hours, and a moderate improvement to a long journey time is likely to have a small impact on demand. A significant proportion of commuting occurs over journeys of between 30 and 90 minutes’ total journey time. Reductions in journey times over this range can therefore have a sizeable impact on demand particularly where realistic alternatives exist for some or all of the journey. Most people are willing to commute for less than 30 minutes which means that improvements to journey times for short journeys of this nature are unlikely to stimulate a large increase in demand.
Further analysis suggested a statistically significant link between economic output and:
• Business to business connectivity, defined as the number of employed people in two locations and the willingness of the employees to travel to the other for business purposes.
• Employee to employer connectivity, defined as the number of people willing to travel to the jobs in a location.
On this basis the following conclusions were drawn:
• Large urban centres, and particularly central London, have the highest concentration of businesses and employment opportunities.
• In the range of around one to two hours travel time, the impact of a small change in travel time on the level of business travel and hence economic output is relatively large.
• In the range of around 30 to 90 minutes travel time, the impact of a small change in travel time on the level of commuting and hence economic output is relatively large.
• Improvements to rail services are therefore likely to result in the greatest increases in economic output where it is possible to provide a step change in journey times between large urban areas with a current journey time of two hours or more, to substantially less than that. This is particularly the case for journeys to and from central London.
The analysis was unable to identify a statistically significant correlation between the provision of rail journey opportunities and
deprivation, as the lack of transport connectivity is not the only factor that affects deprivation. This is illustrated by some areas of inner London that are extremely well connected to employment opportunities but, for a number of reasons, are amongst the most deprived areas of the UK. However, outside of the larger conurbations, there is clearly a role for rail in mitigating deprivation as well as stimulating regeneration where a lack of transport connectivity limits access to employment. In such cases the provision of an improved rail service can affect land use planning, such as the provision of affordable housing.
7.2.2 Assessment of the environmental impact of rail service levels
Rail has a relatively low environmental impact per passenger mile compared to other modes of transport. Improving the attractiveness of rail service offerings between economic centres, such as service frequency, journey times and quality of rail products encourages modal shift from road to rail.
The assessment of the environmental impact of improvements to rail services is based on an application of the DfT’s WebTAG appraisal guidance. The approach taken estimates the modal shift from road to rail generated by an improvement in rail journey times (including time spent waiting for a train).
The results of this analysis suggested the following:
• The largest environmental benefit is likely to occur where rail has the potential to capture a large share of a large total market for travel.
• Rail already has a high share of the total market for travel to and from Central London, and hence little scope for encouraging further mode shift.
• Rail has the greatest potential to increase its market share where rail journey times (including time spent waiting for a train) are currently similar to or longer than by car. These circumstances are bespoke to each of the pairs of locations considered.

Network Rail London and South East Market Study 47October 201307: Long term conditional outputs – aspirations for 2043
7.2.3 Assessment of the impact of rail service levels on the quality of life for communities and individuals
Rail plays an important role in connecting centres of population within the South East, and connecting people with key social infrastructure.
The assessment of the impact on the quality of life for communities and individuals of improvements to rail services is based on WebTAG appraisal guidance. This approach estimates the value of time saved by the existing and potential new passengers who would benefit from service improvements.
The conclusion of this analysis is:
• The service improvements which are likely to offer the largest enhancement in quality of life, are those which affect travel between locations where large numbers of journeys are already made, and where existing rail journey times are slow.
7.3 The long term connectivity-based conditional outputs
7.3.1 Introduction
The rail industry can help create the conditions to improve economic growth, the environment, and the quality of life for communities and individuals by providing more and/or better opportunities to travel by rail.
Journey speeds and service frequencies implied by these descriptions are not intended to be absolute requirements, as it may be possible to provide an equivalent total journey time (time waiting for and on board a train) through a different combination of time and frequency. All improvements aim to deliver towards the strategic goals defined earlier.
The conditional outputs relating to connectivity have been expressed as aspirations for services of differing characteristics. This was done to express the outputs in straightforward language, and also to articulate the relative value of improvements to services between the locations considered.
The characteristics that define these service aspirations are the average journey time on the train and the number of opportunities to travel each hour by either direct rail services or by changing
trains.
When used in the Route Studies these characteristics should be treated as a desired “Generalised Speed” which is a means of converting passengers’ valuation of time spent travelling on a train, waiting for a train and changing train in the same unit, using evidence from the Passenger Demand Forecasting Handbook (PDFH) . Journey speed should therefore be treated as the distance travelled divided by the end-to-end journey time.
Service frequency (which has been expressed as the number of opportunities to travel per hour) should be treated as the time spent waiting for a train. Where one or more opportunities to travel per hour involve changing trains, the time spent changing trains should be included in the calculation of journey speed (ensuring double-counting does not occur). Any penalty associated with passengers’ aversion to interchange should also be included in this calculation. The “interchange penalties” in PDFH should be used as a starting point for this, however Route Studies should consider whether these penalties are appropriate as over the longer term it may be possible to significantly improve connectivity via reliable interchange connections to/from strategic interchange facilities.

Network Rail London and South East Market Study 48October 201307: Long term conditional outputs – aspirations for 2043
7.3.2 Market segmentation
The connectivity based conditional outputs have been presented separately by journey distance and whether or not the journey is to/from central London, as these characteristics define the appropriate level for the outputs. To do this, six market segments have been defined:
There is likely to be overlap between these markets and some journeys may share the characteristics of more than one market.
The conditional outputs relating to connectivity discussed in the previous section are detailed below. There are conditional outputs defined for all market segments other than the central London segment, as explained earlier.
Figure 7.1: Market segments
• Central London
This market comprises journeys entirely within Central London (zone 1). Rail has only a small share of this market which is dominated by London Underground and bus journeys. The Market Study has not developed connectivity based conditional outputs for this market.
• Shorter distance journeys to central London
This market is typically served by stopping services, up to 30 to 40 minutes journey time from a central London terminus and broadly bounded by the M25 orbital motorway.
• Longer distance journeys to central London
This market is served by fast/semi-fast services, with journey times of over 30 minutes from a central London terminus.
• Shorter distance journeys within the South East
This market is comprised of journeys of up to 30 miles that do not start or end in central London. It includes journeys to, across and within greater London, as well as journeys between other population centres close to each other.
• Longer distance journeys within the South East
This market is comprised of journeys of over 30 miles that do not start or end in central London. It includes journeys to and from Greater London, as well as journeys between other large population centres.
• Longer distance journeys beyond London and the South East
This market consists of journeys that begin or end in the London and South East region but extend beyond it into the wider UK rail network. This market is being examined as part of the Cross-Boundary analysis workstream.

Network Rail London and South East Market Study 49October 201307: Long term conditional outputs – aspirations for 2043
7.3.3 Conditional outputs
In the sections below, generic conditional outputs are described which apply to each of the market segments, and then a series of case studies have been presented to show how these outputs could apply to the services between pairs of locations.
Given that the assessment of the costs of delivering these outputs will be undertaken in the Route Studies it is clearly possible that some outputs may be either unaffordable or of low value for money when considered. Conversely, there may be a case to exceed the level of connectivity suggested by the conditional outputs. This illustrates a feature of the LTPP approach which aims to provide an evidence base for the development of future aspirations of the network, before considering options to meet these aspirations. It is therefore important to emphasise the conditional outputs provide the starting point for the LTPP intended to identify the relative benefits, versus funders’ desired long term outcomes, of improvements in the connectivity of locations in London and The South East. The connectivity based outputs should therefore be taken to mean ‘as fast and frequent as operationally possible given value for money and affordability’.
The outputs have been developed to articulate the role that improved connectivity can have in meeting the strategic goals given other favourable conditions (e.g. a sizeable highly-skilled workforce and a good stock of commercial property). Where stakeholders have evidence to suggest these other conditions are likely to occur in a location over the 30 year time horizon, further consideration should be given in the Route Studies to how the strategic goals can be met effectively. Again, taking the conditional outputs to mean as fast and frequent as operationally possible given value for money and affordability would be appropriate in these circumstances.
7.3.4 Conditional output - Shorter distance journeys to central London
This market is characterised by short distance journeys, services that stop frequently, and operate in a densely populated environment. Rail and public transport typically have a high mode share in this segment.
As described in Section 7.2.1 to 7.2.3, improving connectivity in this market can affect business productivity, the attractiveness of commuting, quality of life and environmental benefits.
The research undertaken shows that for short distance journeys (typically between 15 and 30 miles), any reduction in journey time improves business to business activity. This is because such journeys are typically of a duration in the range where the impact of a small change in travel time on the level of business and commuting travel, and hence economic output, is relatively large as discussed in Section 7.2.1. This leads to large benefits in the context of a market that already has a high rate of business interaction. The scope to improve connectivity through line speed changes is limited, as services need to stop at stations close to each other. The primary benefit therefore is from providing sufficiently frequent opportunities to travel such that time spent waiting for a train does not pose a barrier to travel.
This also holds true for commuting travel in this market, although the level of service provision is driven primarily by the need to provide adequate capacity at peak periods.
In such a densely populated market, any improvements in rail connectivity also lead to significant quality of life benefits.
Given the high mode share of public transport in this market, the incremental environmental benefit from enhanced rail services is relatively low. However, this still remains significant considering the volume of travel in this segment.

Network Rail London and South East Market Study 50October 201307: Long term conditional outputs – aspirations for 2043
The conditional outputs for this market are therefore:
1. To accommodate peak demand.
2. To provide a minimum of three to four trains2 per hour.
3. To provide incremental improvements in journey times.
Case Study - Chingford to Central London Chingford, in the outer London Borough of Waltham Forest, has a current total rail journey time of about 40 to 45 minutes to central London. This is made up of broadly 25 to 30 minutes of travel time and four opportunities to travel per hour.
The proximity of Chingford to central London (about 12 miles to Liverpool Street station) and dense population means it is well placed to benefit from increased interaction with the UK’s largest business and employment centre. Small improvements in rail connectivity will therefore support competition and trade between businesses in this area and London, and further encourage commuting.
Better access to employment in Central London is an important factor in furthering economic development. In the context of Chingford to Central London the conditional output should therefore be to provide adequate capacity for peak commuting and incremental journey time improvements.
Case Study - Potters Bar to Central London It takes about 20 minutes to cover the 20 miles between Potters Bar in Hertfordshire and Central London by train. Outside the peak, there are two opportunities each hour. During the peak, to provide sufficient capacity, there are four opportunities to travel although these are slower because the peak trains stop more frequently to pick up commuters at intermediate stations.
This illustrates the practical trade-offs between calling pattern, speed, frequency and passenger capacity common in this market.
2 In this context “trains” refers to opportunities to travel as defined earlier
The close proximity to London places the c.100,000 people in the Hertsmere area very near to the jobs and other opportunities in Central London. Small improvements in journey time will further develop economic interaction and development.
In the context of Potters Bar to Central London the conditional output should therefore be to deliver adequate peak capacity as well as a minimum frequency of three trains per hour throughout the day.
Case Study - Staines to Central London Staines in Surrey is about 20 miles from Central London. It currently takes about fifty minutes to travel to London Waterloo, including time spent waiting for a train. There are six opportunities to travel by rail each hour, all of which serve London directly on services which stop intermediately. Two of these are slow services that are overtaken by faster ones.
Although car journey time is only marginally longer, commuting by car is unattractive as the route is frequently congested. The cost of using a car in Central London is also a deterrent.
The area around Staines (the Borough of Spelthorne) is home to around 100,000 people. Small improvements to journey times will generate benefits from linking businesses and residents in Staines with trade, employment, retail and leisure opportunities in London.
In the context of Staines to Central London the conditional output should therefore be to provide adequate capacity for peak commuting and incremental journey time improvements.
Network Rail London and South East Market Study 51October 201307: Long term conditional outputs – aspirations for 2043
7.3.5 Conditional output - Longer distance journeys to central London
The longer distance journeys that characterise this market are served by trains that stop less frequently and connect towns and cities with central London at comparatively high train speeds. As with the previous market, improved connectivity yields benefits from improved business productivity, the ability to commute, better quality of life and reduced environmental impact.
Business travel is encouraged as total journey times are reduced below 110 minutes. Incremental improvements beyond this generate significant economic benefits from towns and cities trading more actively with London. Once journey times of about 40 minutes have been achieved, there is relatively less benefit from further small improvements.
Research indicates that people are willing to undertake longer commutes to work in London than elsewhere. This is a function of the high wage level in central London and the profile of house prices at a distance from London. The level of commuting becomes significant once the total journey time is under 100 minutes. Incremental benefits are generated until journey time is at around 40 minutes. Rail has a very high modal share of the total commuter market to central London. The service level at peak times is dictated by the need to provide adequate capacity for these commuters.
As a large market with a high volume of rail trips, any improvement in journey time yields significant improvements in quality of life.
Given the high mode share enjoyed by rail in this market, the incremental environmental benefit from enhanced rail services is relatively low. However, this still remains significant considering the volume of travel and distances involved in this segment.
The conditional outputs for this market are therefore:
1. To accommodate peak demand.
2. To provide a total journey time of significantly less than 100 minutes.
3. To a provide a total journey time of as close to 40 minutes (including waiting time) as possible.
In applying the above conditional outputs, each Route Study should develop a strategy geared towards achieving an average train speed of about 75 mph (or total journey speeds, allowing for waiting time, of 50-55 mph) between London and the major generators of demand on the route. In practice, on most routes, this is most likely to be achieved by a mix of 2-3 fast trains per hour, serving the major population centres on the trunk, radial route into London, and semi-fast services that capture demand from the other stations on the route and/or link into the direct services on the main line.
Where the existing service is faster or more frequent than the minimum suggested by the conditional output, it is not intended that the existing level of service be degraded.
Case Study - Portsmouth to London The current total rail journey time between Portsmouth and central London is around 120 minutes, based on broadly 100 minutes on train, and two to three3 opportunities to travel per hour. This is a barrier to significant competition and trade between the businesses in Portsmouth and businesses in London, and makes commuting between the two cities relatively unattractive for the majority of the potential workforce.
Despite this, the size of both Portsmouth’s employment centre (circa 56,000 jobs) and population (circa 200,000) suggests the potential for a significant business and labour market interaction with London, providing total rail journey times can be reduced to considerably less than 100 minutes.
The distance between Portsmouth and London is approximately 70 miles which, based on the best journey speeds currently achieved in this market segment, suggests a minimum potential total journey time of around 75 minutes.
3 Three fast trains per hour in the direction towards London, two fast trains per hour towards Portsmouth (the third service is overtaken at Haslemere by one of the fast services). There is also one further slow train each hour via Fareham.

Network Rail London and South East Market Study 52October 201307: Long term conditional outputs – aspirations for 2043
In the context of Portsmouth – London the conditional output should therefore be understood as an aspiration to achieve a journey time as close as possible to 75 minutes (e.g. 60 minutes of travel time and four trains per hour).
It is important to acknowledge that the development of significant additional interactions between the currently very different business clusters and employment markets of Portsmouth and London would be likely to take many years to achieve. Furthermore, it is important to emphasise that achieving an aspired 75 minute total journey time would not easily be brought about on the existing railway, taking into account the density of traffic, the train service mix and the nature of the route, which is steeply graded and sharply curved in places. As such, it might not be affordable as it would almost certainly entail provision of additional infrastructure at possibly very substantial cost and/or timetabling trade-offs such as a reduction in the number of stops, rescheduling of other services or additional services to cater for intermediate markets.
Case Study - Luton to London Located just over 30 miles north of London, Luton is one of the main towns in Bedfordshire. Luton Borough is also home to Luton Airport with its dedicated railway station Luton Airport Parkway. The total journey time from Luton to central London is about 45 minutes. This is comprised of about 30-35 minutes on a train, with generally 4-6 opportunities to travel each hour. At the busiest times of day, this frequency increases to 12-13 services an hour to cater for commuter demand.
People and businesses in Luton and its local area are well connected to central London. However, given the size of Luton’s population (c. 250,000) and job market (about 50,000), as well as proximity to the airport, there are still significant benefits to be gained from further increments to the rail service. These arise from improved access to jobs and social infrastructure, and increased quality of life from faster journey times.
The fastest journey at the moment takes 24 minutes non stop between Luton and London. This equates to a train speed of about 75 mph, which is similar to the best average speed achieved in this market. Most journey opportunities between London and Luton have an average train speed between 50 and 65 mph. In the
context of Luton to London, the conditional output should be:
1) Accommodate peak commuting demand
2) Total journey times as close to 35 minutes as possible (i.e., on-train time as close to 24 minutes as possible, with frequent opportunities to travel).
It is important to acknowledge that achieving a 35 minute total journey time would be very difficult without trade-offs with other services and/or additional infrastructure.
7.3.6 Conditional output – Shorter distance journeys within the South East
This market includes two types of journeys:
• Journeys to / from / within the Greater London area, which share some similarities with the ‘shorter distance to central London’ market segment discussed above:
• Journeys between large regional centres in close proximity to each other.
The research indicates that, in contrast to the London markets, the largest benefits are generated here for quality of life and environmental impact.
For journeys including Greater London, any reduction in the time spent travelling improves business to business activity and leads to large benefits. As with the market for shorter distance journeys to Central London, this applies within the context of a market that already has a high rate of business interaction. The scope to improve connectivity through line speed changes is limited within Greater London, as services typically need to stop at stations close to each other. The primary benefit therefore is from providing sufficiently frequent opportunities to travel such that time spent waiting for a train does not pose a barrier to travel.
For large regional centres, significant economic benefits arise from increased business interaction when total journey times are under 60 minutes. Where possible, further improvements to journey times can yield additional significant economic benefits.
Comparable to the London markets analysed earlier, adequate capacity for local commuting supports economic output.

Network Rail London and South East Market Study 53October 201307: Long term conditional outputs – aspirations for 2043
Benefits relating to quality of life and the environmental impact of travel are significant for this market and comparable to (or more than) the economic benefit of business activity and commuting.
For both of these, the biggest impact is from better connecting large population centres where the current service is slow, indirect or infrequent. In quality of life terms, this is where most people save a significant amount of time. In environmental terms, these are the conditions under which significant abstraction from car journeys is achieved.
The conditional outputs for this market are therefore:
1. To accommodate peak demand.
2. To provide incremental improvements to journey times.
3. To provide a total journey time of less than 60 minutes.
Case Study - Portsmouth and Southampton The cities of Portsmouth and Southampton are around 20 miles apart. The current total travel time by rail between them is between 75 and 90 minutes, comprising between 45 minutes and an hour on the train and two to three opportunities to travel per hour. This represents a slow and unattractive journey between cities in such close proximity. A car journey between these cities takes about 40 minutes but traffic congestion and bottlenecks on the M27 and A27 roads often increase this significantly.
Both cities are large population and employment centres, which suggests the potential for a significant increase in business and labour market interaction between them, given better connectivity. There is also therefore the potential for improved choice and access for residents of both cities to jobs, leisure and retail facilities, improving the quality of life for all residents in the area.
Rail has the opportunity to change significantly the mode share of travel between these cities by providing an attractive service and therefore can contribute to the environmental strategic goal.
The conditional output when applied to Portsmouth – Southampton should be taken to mean a total journey time of under 60 minutes, including waiting time. For example, this could mean a 40 minute train journey with three direct opportunities to travel per hour.
Case Study – Reading to Basingstoke and Reading to NewburyReading is a large urban centre of population and employment. Its Primary Urban Area4 has a population of 420,000 and over 220,000 jobs. It is a significant inward destination for employment, with at least as many people arriving by rail in the morning peak period as there are departing.
Basingstoke, 16 miles southwest of Reading, has a population of c. 160,000. The current rail service between Reading and Basingstoke offer four trains per hour, which are not evenly distributed through the hour. It takes 22 - 25 minutes to travel between the stations, which implies a total journey time including waiting time of about 40 minutes. Reading and Basingstoke are linked by road via the A33, which is often congested. The road journey takes 35 minutes.
Newbury, a major commercial centre in West Berkshire is 17 miles west of Reading. They are linked by the M4 motorway or the A4 (Bath Road). It takes between 35 – 45 minutes to travel between them by road. The total journey time by rail, including waiting time, is about 50 minutes, with one slow train and one faster train each hour.
This suggests there is significant potential to increase the interaction between Reading and Basingstoke, and Reading and Newbury, by improving the rail offer between them. By encouraging more people to travel by rail, it would also then relieve pressure on the A33 and A4 corridors.
The conditional output with regards to the connectivity of Reading with Basingstoke and Newbury is therefore to provide incremental improvements to journey times and, where possible, service pattern (for example, through journey opportunities that are more evenly distributed through the hour) to allow for improved choice and access between these locations for jobs, business opportunities and leisure and retail facilities.
4 A Primary Urban Area is a measure of the “built up” area of a city, sourced from the Cities Factbook 2013 published by Centre for Cities.

Network Rail London and South East Market Study 54October 201307: Long term conditional outputs – aspirations for 2043
Some other examples5 in this market segment where improvements to connectivity lead to significant economic, environmental and quality of life benefits include journeys between:
• Croydon and
– Guildford
– Lewisham
• Brighton and
– Eastbourne
– Chichester
– Gatwick Airport / Redhill
7.3.7 Conditional output – Longer distance journeys within the South East
The longer distance journeys that characterise this market are served by trains that stop less frequently and connect places outside, or across, central London at comparatively high train speeds. As with the previous market, improved connectivity has the potential to improve business productivity, the ability to commute, better quality of life and reduced environmental impact.
Comparable to ‘Longer distance journeys to central London’ business travel is encouraged where total journey times are reduced below 110 minutes. Incremental improvements deliver significant economic benefits from towns and cities trading more actively with each other. Once journey times of about 40 minutes have been achieved, there is relatively less benefit from further small improvements.
The level of commuting becomes significant once the total journey time is under 100 minutes, albeit at a smaller scale than commuting into Central London. Incremental benefits are generated until journey time is at around 40 minutes. For the peak, adequate capacity is required to accommodate commuter demand.
As a large market with a significant volume of rail trips (in particular to/from the Greater London area), any improvement in journey time
5 This list is not intended to be exhaustive.
yields significant improvements in quality of life. Given the high mode share enjoyed by rail in this market, the incremental environmental benefit from enhanced rail services is relatively low. However, this still remains significant considering the volume of travel and distances involved in this segment.
In summary, the conditional outputs for this market segment are therefore:
1. To accommodate peak demand.
2. To provide total journey times of significantly less than 100 minutes.
3. To provide as close to 40 minutes total journey time as possible 6.
Case Study - Oxford – Milton Keynes The absence of a railway line connecting Oxford and Milton Keynes means that travel by rail between the two locations is not currently feasible, and although the road journey time is nominally 75 minutes, traffic congestion increases this regularly. Commuting between Oxford and Milton Keynes is therefore an unattractive proposition, and the businesses in each location face a significant barrier to interacting with those in the other.
Despite this, Milton Keynes and Oxford have large employment centres of 120,000 jobs and 80,000 jobs, respectively. This suggests there is potential for a sizable level of interaction between the businesses in each location, providing that it is possible to reduce the regular journey time to significantly less than 90 minutes.
The distance by rail (currently via London) is around 90 miles. However, this will reduce to broadly 34 miles following completion of the East-West Rail link, with an estimated total journey time of 70 minutes, comprising 40 minutes travel time and two opportunities to travel per hour.
Given that these service characteristics represent the mechanism with which the Department for Transport is seeking to achieve a long term aspiration for Milton Keynes – Oxford, it is not necessary to further articulate a conditional output.
6 Where the total journey time is not already at or below 40 minutes.

Network Rail London and South East Market Study 55October 201307: Long term conditional outputs – aspirations for 2043
Knowledge intensive businesses and institutions account for a significant proportion of the economic structure of both locations, suggesting that there may be some natural opportunities for businesses in each place to interact significantly with each other. It is likely however, that these interactions will take a number of years to fully materialise.
Case Study - Windsor/Maidenhead and Croydon This case study has been chosen as an example of the step change in connectivity that can be achieved with new infrastructure and services: in this case, the Crossrail and Thameslink programmes.
The current total rail journey time between Windsor/Maidenhead (The Royal Borough of Windsor and Maidenhead) and Croydon is circa 110 to 120 minutes. Although opportunities to travel between these locations are frequent (about six an hour), most comprise of three or four journey legs including at least one by London Underground. This makes the connection relatively unattractive for two places that are within 40 miles of each other.
Croydon and Windsor/Maidenhead are large places, with populations of 370,000 and 145,000 respectively. Both are key centres of employment in the South East, outside central London. For example, Croydon is home to about 130,000 jobs, while Windsor and Maidenhead is a thriving economic centre close to Heathrow Airport and the town of Windsor is a major tourist destination.
This suggests that there is the potential to significantly improve the business and labour market interaction between them, as well as the quality of life for individuals, providing total rail journey times can be reduced to significantly less than 100 minutes. Any small improvements in journey time beyond this, especially through easier and faster interchange, will further support the strategic goals.
In addition, a car journey between Croydon and Maidenhead takes about 100 minutes along congested urban roads. There is significant scope to generate environmental benefits by shifting the balance of travel between car and rail, as rail has a lower carbon footprint.
The best journey speeds currently achieved in this market segment, suggests a minimum potential total journey time of around 60
minutes.
In the context of Windsor/Maidenhead and Croydon the conditional output should therefore be taken to mean as close to a total journey time of 60 minutes as possible (e.g. 30 minutes of travel time and two journey opportunities per hour or 45 minutes of travel time with four journey opportunities per hour).
It is important to acknowledge that the development of significant additional interactions between the currently different business clusters and employment markets of Windsor/Maidenhead and Croydon would be likely to take many years to achieve. Furthermore, it is important to emphasise that, as matters currently stand, achieving a 60-minute total journey time would be very difficult without either additional infrastructure and/or trade-offs with other services. Significant improvement can, however, be expected with completion of the Crossrail and Thameslink programmes which will allow a journey between East Croydon and Maidenhead with only a single change of trains at Farringdon.
Other examples7 in this market segment where improvements to connectivity lead to significant economic, environmental and quality of life benefits include journeys between
• Destinations in Greater London such as Croydon, Wimbledon/Clapham, Lewisham and Stratford, and some of the larger conurbations in the South East such as Reading, Watford, Luton, Stevenage, Colchester, Ashford, Brighton and Basingstoke.
• Cambridge, Ipswich, Norwich and Peterborough.
• Brighton and Portsmouth.
7.4 Long term conditional outputs related to capacity
Given the contribution that the provision of services to the London and South East passenger market makes to the economy, the environment and the quality of life for communities and individuals, accommodating future passenger demand is an important means of delivering the strategic goals.
7 This list is not intended to be exhaustive.

Network Rail London and South East Market Study 56October 201307: Long term conditional outputs – aspirations for 2043
The conditional output related to capacity is therefore to plan to accommodate the high end of the range of growth in passenger journeys forecast to occur by 2043 as a result of background factors, and future rail investments which have funding committed and are planned for implementation in CP4 and CP5.
Figure 7.1 shows the impact of the high end of the demand projections resulting from background growth and currently committed schemes (Figure 6.7 from the previous chapter) on the number of passengers travelling into central London in the busiest hour of the morning, in 2043. Similarly, Figure 7.2 shows the projected annual demand in 2043 for the London Overground orbital routes (Figure 6.8 from the previous chapter).The conditional output is therefore to plan to accommodate this level of demand.
Providing sufficient capacity to accommodate the demand for travel between other locations in the study area and at other times of the week are important considerations, however instances of current and likely future overcrowding are far less prevalent than in the corridors to/from London at peak times. Outside London and/or peak times overcrowding tends to be a result of location-specific factors, and it is therefore more appropriate to identify any future capacity problems of this nature as part of the Route Studies.
It is likely that further rail investment will be planned for Control Period 6 and beyond, with a commitment to funding occurring after the Market Studies have been published. When this is the case, the forecast resultant impact on demand should be added to the number of passengers to be accommodated.

Network Rail London and South East Market Study 57October 201307: Long term conditional outputs – aspirations for 2043
Table 7.1: Long term conditional output for capacity – capacity to accommodate, in the busiest hour of the day, by 2043
Route Service group Passengers in 2011 Passengers in 2043
London PaddingtonCrossrail & Relief line 4,100 14,200 – 16,500
Main line + other fast trains 8,500 12,700 –17,000
London Marylebone All services 6,500 9,300 – 11,400
London Euston
Long Distance 3,300 4,500 – 7,100
Suburban services 8,800 13,900 – 16,600
London St Pancras InternationalThameslink Midland Mainline (MML) 9,700 14,900 – 15,600
MML Long Distance 2,500 3,500 –5,800
London King’s Cross/ Moorgate
Great Northern / Thameslink ECML 16,700 23,600 – 27,200
East Coast Mainline Long Distance 2,600 3,500 – 5,300
London Liverpool StreetWest Anglia 15,700 20,100 –21,800
Great Eastern (GE) Main Line 19,500 29,600 – 34,100
Inners & Crossrail GE route 13,600 22,700 – 24,900
London Fenchurch Street All services 16,300 20,200 – 23,800
London BridgeThameslink & Sussex fast 15,200 27,900 – 31,400
Sussex stopping services 9,300 11,700 – 12,900
London Blackfriars All services via Elephant & Castle 10,900 12,600 – 13,200
London Victoria Sussex routes - fast trains 12,100 14,700– 16,200
Sussex routes - inner suburban trains 12,900 16,500 – 18,600
London Waterloo
South West Main Line 15,800 19,700 – 22,100
Stopping trains via Wimbledon 23,600 26,900 – 28,100
Windsor Lines 13,300 17,200 – 18,300
Kent routes All services excluding via London Blackfriars
60,500 79,200 – 88,900

Network Rail London and South East Market Study 58October 201307: Long term conditional outputs – aspirations for 2043
7.5 Other conditional outputs
As discussed above it is not appropriate to quantify all of the conditional outputs as they either do not relate directly to connectivity or are too bespoke to undertake a numerate analysis. It is, however, important to articulate these outputs as they will both enable the positive impact of the service level and capacity based outputs detailed above and contribute to a likely successful outcome against the strategic goals.
7.6 Conditional outputs related to improving access to airports and ports
7.6.1 Airports
London is served by several airports, the five largest of which are Heathrow, Gatwick, Luton, Stansted and London City. Heathrow is the UK’s hub airport, serving 70 million passengers a year. Gatwick Airport serves 34 million passengers a year, the majority of whom are originating or terminating passengers. UK air passenger numbers are expected to grow by between 1 per cent and 3 per cent a year to 20508.
Airport policy for London and the UK is currently under review by the Airports commission, chaired by Sir Howard Davies. Initial findings from this review are expected to be available at the end of 2013, with final findings due to be published in 2015. In particular, it is considering the various options for expanding airport capacity in order to maintain the UK’s position as Europe’s most important aviation hub. Likely scenarios to be considered could include
8 Source: Department for Transport UK Aviation Forecasts, January 2013
Table 7.2: Long term conditional output for capacity – capacity to accommodate, annually, by 2043
Passengers in 2011 Passengers in 2043
West London Line & North London Line 42.4 million 118.4 million
East London Line 32.3 million 131.7 million
Gospel Oak - Barking Line 8.1 million 17.1 million
potentially expanding Heathrow or other airports, moving away from a single-hub airport model or building a new airport.
Recommendations from the review may have a significant impact on rail capacity to/from airports.
Good rail connectivity to airports is important in supporting economic growth, productivity and social mobility. It can play a key role in providing better access to markets, national and international destinations, business and leisure opportunities, and to jobs. New and improved rail services and their integration with other transport modes at major airports are key to providing more sustainable travel opportunities and improving overall connectivity, acting as a transport hub both for air passengers and for other rail users. Rail is a vital ingredient in improving the travel experience and offering for air passengers, employees and freight and in helping airports meet current and future travel demand.
Rail service provisions should be able to meet growing demand of accessing the airports by rail. Fast, convenient and reliable rail access to central London is a priority for London’s airports but direct access to non-London core economic centres both long-distance and within the London and South East area are increasingly important.
Airport passenger and employee travel demand is also quite different to commuting and leisure flows with peaks occurring at different periods of the day and night. Earlier morning and later evening rail services should therefore also be considered, subject to value for money and affordability. As with other services in this study, key measurables are capacity, frequency, journey time and

Network Rail London and South East Market Study 59October 201307: Long term conditional outputs – aspirations for 2043
ease of transfer.
As a guide, the minimum long term service level aspiration for rail connectivity to airports is:
1) Frequent opportunities to travel (see table below).
2) Sufficient capacity for the needs of passengers (including non-air passengers that use the airport as a transport hub).
3) A minimum frequency of two trains per hour during airport peak operation (which may be at different times from the general commuting peaks).
4) High levels of reliability and punctuality.
5) Journey speed (including waiting time) of c. 50–60mph.
Example 1: high frequency, 30 minutes on train, 30 miles to London.
Example 2: 30 minutes, 35 miles to London, 4 trains per hour.
6) Direct services (i.e. minimal interchange).
7) A total journey time of less than 60 minutes to/from key airport catchments within London and the South East.
8) A total journey time of less than 100 minutes to/from key airport catchments within long distance airport catchments beyond London and South East.
It is expected that the UK will significantly increase its airport capacity at one or more airports serving London and the South East following the review by the airports commission. When the nature and scope of such changes become known, it may be necessary to review the above conditional outputs.
Similar to the more general connectivity outputs set out in Section 7.3, it is important to emphasise that these conditional outputs provide the starting point for the LTPP intended to identify the relative benefits, versus funder’s desired long term outcomes, of improvements in the connectivity of airports in London and the South East. The connectivity based outputs above should therefore be taken to mean ‘as fast and frequent as operationally possible given value for money and affordability’.
Table 7.3 Opportunities to travel
Opportunities to travel, per hour (tph) To/from London To/from key airport catchments within London & SE
To/from key long distance airport catchments beyond London and SE
Large Airport serving > 30 million passengers a year, of which at least 20 million are surface access passengers
6 4 Direct service/ minimal interchange
Medium Airport serving between 5 and 30 million passengers a year 4 2 Direct service/ minimal interchange

Network Rail London and South East Market Study 60October 201307: Long term conditional outputs – aspirations for 2043
7.6.2 Ports
Rail access to ports is primarily driven by freight requirements. However, ports are also large employers. Rail is not usually an attractive mode of access for port workers, as the sheer scale of the site often requires vehicular access within it.
Southampton port has a thriving cruise operation, with passenger volumes of circa 1.5 million per annum. Southampton Central is served by three direct trains per hour from London Waterloo. Cruise ship capacities are typically between 2,000 and 4,000 passengers, so even with a small rail modal share, cruise passengers with luggage can present a significant use of capacity on a seasonal basis.
Capacity and connectivity for any rail passenger traffic to ports should be considered on a case by case basis where necessary, either within the relevant Route Study or as a standalone scheme.
7.6.3 High Speed Rail
Ease of interchange between the local rail system and the emerging high speed network will become an increasingly significant part of the total rail travel offer. Already, very substantial interchange takes place with HS1 at London St Pancras International and to a lesser extent by use of the opportunities offered via HS1 domestic services together with Ashford International station.
With the advent of HS2, such interchange will form a vital part of the attractiveness of travel opportunities between many places in the London and South East region, the Midlands and the north. In particular, development of capacity and connectivity at the proposed HS2 interchanges at London Euston and Old Oak Common will need to form a major feature of future rail planning and service development.
7.7 Better capacity for the leisure market at weekends and weekday evenings
The busiest times for travel to/from urban retail and tourism centres are often at weekends and during weekday evenings. This is in contrast to the typical weekday peak for commuting and business travel, when the highest current levels of train service frequency and capacity are provided. The increase in leisure use of rail in recent
years is improving the financial case of rail lines which previously served predominantly commuter flows, because it allows better utilisation of resources that are required to deliver the peak timetable. This evolving leisure market is also of importance to the economy of the South East. Therefore a conditional output is to provide sufficient capacity to avoid demand suppression and to reduce potential on-train crowding.
This will involve consideration in the Route Studies of the potential trade-offs resulting from alternative engineering regimes, including and assessment of the value for money and affordability implications.
7.8 Appropriate connectivity and capacity for tourist attractions outside of the region’s urban centres
The potential for rail to provide good connectivity between large numbers of people and tourist attractions is more limited where these locations are outside of the region’s urban centres. This is because these attractions tend to exhibit a number of the following characteristics:
• They are a significant distance from a rail line.
• They are geographically dispersed such that rail can only serve a limited proportion of the attraction.
• The nearby population catchments are geographically dispersed, limiting the number of people with easy access to the rail line(s) which serve the relevant attraction.
There are circumstances, however, where rail can play a significant role in connecting people with tourist attractions of this nature, in particular where a large tourist attraction, or a sizeable part of a wider tourist attraction is connected to a large centre of population by rail.
Data supplied by the South Downs National Park Authority (the busiest national park by visitor numbers) illustrates this point. – Overall only two per cent of all domestic visitors to the South Downs travel by rail, whereas nine per cent of visitors from Greater London travel by rail.
Discussions with the representatives of the tourism industry and other stakeholders suggest that the key to maintaining and

Network Rail London and South East Market Study 61October 201307: Long term conditional outputs – aspirations for 2043
improving the attractiveness of these locations as rail destinations, is to provide a frequent regular service interval throughout the week and at weekends, as well as services which operate sufficiently early and late in the day to enable a full day trip to a location.
These requirements are similar to those for travel to urban tourism locations, albeit with more limited circumstances where rail can be an attractive mode of access. The conditional output is therefore to provide an attractive frequency of services to out of town tourist attractions, where the characteristics of these attractions, their visitor catchment areas, and the existing rail network enables a level of service of this nature. This frequency should be provided at the busiest times for tourism travel.
7.9 Conditional outputs related to improved access to higher education establishments and other social infrastructure
The potential for services to improve accessibility to higher education establishments such as universities and colleges should be considered in the next stage of the LTPP. This will contribute to the strategic goal of improving the quality of life of communities and individuals. Demand scenarios presented in Chapter 6 show that an increase in demand for longer distance travel is predicted in some circumstances and more students are willing to travel for longer distances to gain access to education. Rail is increasingly becoming the mode of choice for students.
7.10 Conditional outputs related to improved passenger satisfaction
Passengers’ travel experiences are also important and affect mode choice, and demand for rail. The industry will continue to seek to improve station environments, the quality of rolling stock, the availability of information to passengers and where appropriate train punctuality. Rolling stock needs to meet the requirements and expectation of passengers and enable efficient provision of rail services. A starting point will be the view set out in the Customer Experience section of the Rail Technical Strategy (Rail Safety and Standards Board Ltd, 2012).
7.11 Conditional outputs related to improving access to the rail network to cater for demand
In many cases, improving access to the rail network is the equivalent of improvements to rail journey times.
Good connectivity and accessibility of rail stations are important in attracting passengers to travel by rail. Rail stations and rolling stock accessible by less mobile passengers play a significant role in improving the quality of life of such passengers by enabling access to a wider range of employment and leisure opportunities. More generally, continuing improvement in the facilities and general ambience at stations can be expected to play an important role in retaining and developing the use of rail, taking into account rising consumer expectations.
High quality car parking provision at or close to stations will need to keep pace with growing rail demand, as will highway access to stations. Good integration and co-ordination with local transport such as London Underground, bus and tram/light rail services are equally required if rail travel is to achieve its maximum potential.
7.12 Conditional outputs related to competitive rail prices compared to other modes and better ticketing
We have not reached a consensus amongst stakeholders around the role of pricing except to recognise that there is a balance between using pricing to support the other conditional outputs and industry affordability. The split of rail industry funding between passengers and taxpayers is an important consideration for other industry planning activities such as the DfT’s ongoing rail fares and ticketing review.
Whilst it is beyond the scope of this document, clearly the overall retail strategy for rail will have a vital part to play both in terms of the attractiveness of the total rail travel offer and its affordability.
Network Rail London and South East Market Study 62October 20138: London and South East Market Study Consultation ChapterThe Long Term Planning Process has been designed so that it allows an opportunity for all stakeholders to contribute if they are interested in influencing the rail industry’s plans for the future.
8.1 Introduction
The Long Term Planning Process has adopted an open and inclusive approach from the outset. It has been designed so that it allows an opportunity for all stakeholders to contribute if they are interested in influencing the rail industry’s plans for the future. This chapter sets out how that has been done, and outlines the key themes emerging from the responses that have been received to the London and South East Market Study Draft for Consultation which was published on 24th April 2013.
8.2 Development of the process
The Long Term Planning Process has been designed to build on the strengths of the preceding Route Utilisation Strategy process, whilst taking into account the recommendations of the ‘Rail Value for Money Study (the McNulty Report)’. The process is led by the Rail Industry Planning Group consisting of key representatives from the rail industry. These representatives include:
• Association of Train Operating Companies (ATOC).
• Department for Transport.
• Freight Operators.
• Network Rail.
• Office of Rail Regulation (as an observer).
• Passenger Focus.
• Passenger Transport Executive Group (PTEG).
• Rail Freight Group.
• Railway Industry Association.
• Rail Freight Operators Association.
• Rolling Stock Leasing Companies.
• Transport for London.
• Transport Scotland.
• Welsh Government.
As such, the development of the process prior to the launch of the Market Studies was led by a cross-industry group enabling views from across passenger, freight, government and regulatory bodies to be taken into account and incorporated into the Long Term Planning Process at a high level.
8.3 London & South East Market Study – Study Development
Consultation and guidance of the work during the development of the London & South East Market Study has been extensive and at a number of levels. There have been three key groups guiding the development of the work:
• Rail Industry Planning Group.
• London & South East Market Study Working Group.
• ‘Local group’ meetings.
The role of Rail Industry Planning Group has been set out above and in relation to the London & South East Market Study, it has provided a strategic overview of the work and a link between the LTPP and other industry planning processes. The Rail Industry Planning Group has met on a quarterly basis during the development of the London & South East Market Study.
The London & South East Market Study Working Group was established to steer, challenge and monitor progress of the work as well as to agree the publication of the Draft for Consultation and the final study.
‘Local group’ meetings have been held throughout the development of the London & South East Market Study to ensure that local stakeholders were aware of the process and could contribute to the formulation of the strategic goals and conditionals outputs as they were developed.
In addition to all the meetings above, a large number of one to one meetings with interested parties, both within and outside the rail industry have been held to guide and develop the work.
8.4 Consultation Process
The London & South East Market Study Draft for Consultation was published on the Network Rail website on 24th April 2013, and was open to responses for a three month consultation period which
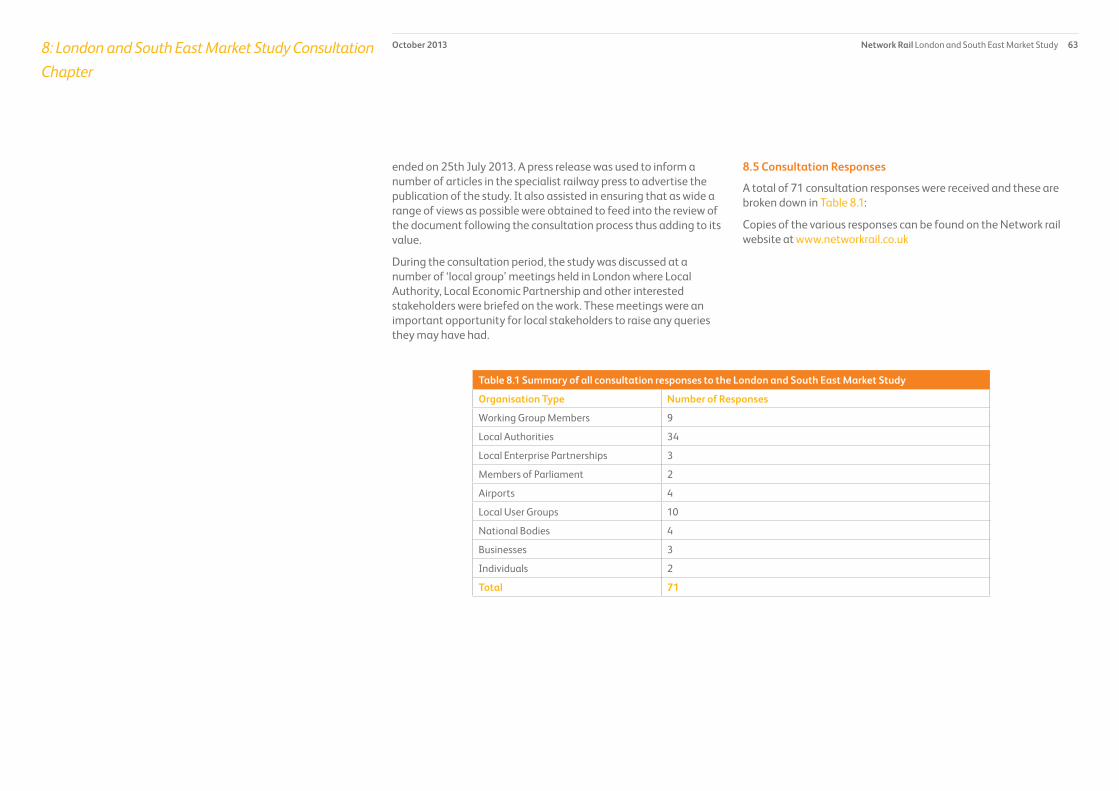
Network Rail London and South East Market Study 63October 20138: London and South East Market Study Consultation Chapter
ended on 25th July 2013. A press release was used to inform a number of articles in the specialist railway press to advertise the publication of the study. It also assisted in ensuring that as wide a range of views as possible were obtained to feed into the review of the document following the consultation process thus adding to its value.
During the consultation period, the study was discussed at a number of ‘local group’ meetings held in London where Local Authority, Local Economic Partnership and other interested stakeholders were briefed on the work. These meetings were an important opportunity for local stakeholders to raise any queries they may have had.
8.5 Consultation Responses
A total of 71 consultation responses were received and these are broken down in Table 8.1:
Copies of the various responses can be found on the Network rail website at www.networkrail.co.uk
Table 8.1 Summary of all consultation responses to the London and South East Market Study
Organisation Type Number of Responses
Working Group Members 9
Local Authorities 34
Local Enterprise Partnerships 3
Members of Parliament 2
Airports 4
Local User Groups 10
National Bodies 4
Businesses 3
Individuals 2
Total 71

Network Rail London and South East Market Study 64October 20138: London and South East Market Study Consultation Chapter
8.6 Key themes in the consultation responses
The responses received were varied and in many cases comprehensive. Therefore, only the key and recurring themes are summarised within this chapter.
8.6.1 Transparency
A number of consultees queried how the four Market Studies interact with each other and clarification was sought on how the Market Studies would be used in the rest of the Long term Planning Process. The document has been revised as a result.
8.6.2 Market Description
Chapter 2 of the Market Study set out to explain the characteristics that define the London and South East Market. Some of those consulted requested better recognition of the leisure and tourism markets within the London and South East region, as well as the market for weekend travel.
8.6.3 Strategic Goals
The strategic goals for the London and South East rail market are identified in Chapter 5. As a result of consultation responses, this chapter has been restructured for greater clarity. The ‘improving affordability’ goal has a reference to ‘value for money’ added to it as well as an explanation as to why these factors have not been considered at the Market Study stage. There is also an explanation of why the strategic goals have not been prioritised and why other potential goals have been omitted.
8.6.4 Long term demand scenarios
Chapter 6 gives an explanation of factors that affect the demand for travel and sets out long term demand scenarios, together with the demand modelling approach. A notable theme across many responses related to the long term demand scenarios and the underlying demand modelling.
As a result of these requests, Chapter 6 has been expanded to include a more detailed introduction to the factors that affect rail demand and the body of industry research into these factors. There is also more information provided on why a scenario planning approach was used in modelling long term demand projections, and
how this approach was developed.
Transport for London provided a revision of the demand projections for the London Overground orbital routes, which are now included in Chapter 6. The chapter also discusses the need to review and maintain forecasts over time, and how the forecasts mentioned within the chapter may be adapted in the Route Studies where new information has been made available.
8.6.5 Long term conditional outputs
Presented in Chapter 7 are the conditional outputs for the London and South East market. The consultation responses received in relation to this set out many examples of where the conditional outputs could usefully be applied. They also requested better recognition of the weekend, leisure and tourism markets, and the conditional outputs relating to these have been strengthened as a result.
An extra case study and a few more illustrative examples of the connectivity based conditional outputs have also been provided. The term ‘central London’ used here has been clarified to mean zone 1.
In discussing access and connectivity to airports, changes have been made with regards to the language used to describe large airports (in contrast to a ‘hub’ airport), the inclusion of long distance catchments beyond London and the South East and further connectivity based conditional outputs.
8.7 Planning for control period 6 and beyond
As detailed in Chapter 1 the output from both this and the other Market Studies will be brought together under the auspices of the Route Studies which will present the case for continuing investment in the rail sector to funders. The Route Studies will inform plans for Control Period 6, the period from 2019 onwards.

Network Rail London and South East Market Study 65October 20138: London and South East Market Study Consultation Chapter
8.8 Summary and next steps
Network Rail would like to thank all those who contributed to the consultation on the London & South East Market Study Draft for Consultation. The collaborative approach that the Long Term Planning Process has chosen to follow has resulted in invaluable assistance with the creation of the suite of Market Studies. The responses of stakeholders and their input at local groups / working groups are recognised as particularly vital to the development of this study.
All of the consultation responses that have been received are published on Network Rail’s website www.networkrail.co.uk.
The London & South East Market Study will become established 60 days after publication unless the Office of Rail Regulation issues a notice of objection within this period.

Network Rail London and South East Market Study 66October 20139: Appendices
Appendix A: Methodology for developing connectivity based conditional outputs
In all three passenger market studies, analysis was undertaken to assess the impact of rail services on three identified strategic goals that are common across the three markets:
• Enabling economic growth.
• Reducing carbon and the transport sectors’ impact on the
environment.
• Improving the quality of life for communities and individuals.
The assessment of the fourth strategic goal, affordability and value for money, has not been undertaken as it will be considered in the subsequent Route Studies.
The following sections detail the assessment undertaken for the London and South East Market Study. The approach outlined in this appendix is only one way to quantify the impact of connectivity improvements and there are other ways to develop the conditional outputs. The approach uses data such as mode share information from the Planet Strategic Model that is commonly used by the rail industry and the Department for Transport. The principles and methodology are compliant with the transport appraisal guidance set out by the Department for Transport.
Analysis of the impact of rail services on strategic goals was undertaken to help to develop the conditional outputs for each of the market segments described in Chapter 7 of the London and South East market study.
Sections A1 to A4 summarise the methodology used.
A1 Assessment of the economic impact of rail service levels
The assessment of the economic impact of improvements to rail services in the London and South East is based on the approach developed from a succession of publications on the subject. These include the Eddington Transport Study 2006, the ongoing Network Rail Northern Hub programme, Prioritising Investment to Support our Economy1, the Department for Transport’s (DfT) WebTAG appraisal guidance and Transport Scotland’s (TS) STAG appraisal 1 Network Rail 2010
guidance. The assessment of economic impact of rail service levels estimates the relationship between economic output and business to business connectivity, and between economic output and employer to employee connectivity. As the cost of travel between conurbations reduces, businesses are more likely to engage with each other. This increases business opportunities between regions and leads to increased economic activity. Similarly, it opens up access to a wider pool of labour for businesses, which are then more able to employ people with appropriate skills, thereby improving productivity. It also enables better access for people to a large and diverse employment market, with more scope to maximise the value of their skills.
Defining Connectivity
In order to understand how well connected an area is, this study defines a measure that takes account of the monetised time and cost (generalised cost2) of travel between each economic area in the study area, and the value of connecting these places.
Decay CurveThe starting point for this analysis is the data illustrated in Figure A. This is the proportion of travel undertaken in the London and South East market study area for business and commuting purposes, versus the generalised cost of travel. It assumes that people are do not want to incur a high travel cost, and long journey time. Therefore the proportion of travel undertaken decreases as generalised cost increases. This is then taken as a proxy for people’s willingness to travel.
The data suggests that when the time and cost of travel between businesses is very high (e.g. for journeys of three hours or more) most people do not travel to undertake business interactions. The demand impact of a small change in journey times on the level of business activity undertaken between urban centres of three or more hours apart is therefore relatively small. Whereas, when the
2 Generalised cost is the total cost of travel including the price paid to travel, plus a monetised estimate of the total journey time including time spent waiting for a train and changing trains.

Network Rail London and South East Market Study 67October 2013Appendix A
3
time and cost of travel between businesses is moderate (e.g. for journeys of around 90 minutes) a significant number of people travel to undertake business interactions and activities such as business meetings and trading.
Finally, when the time and cost of travel between businesses is low (e.g. for journeys of 30 minutes or less) more people are likely to travel to undertake business interactions. The impact of a change in journey times on the level of business travel undertaken is therefore relatively low, though given the large numbers of people who travel over shorter distances, journey time savings can offer sizeable benefits against the quality of life goal in particular as discussed in Section A2.
3 Source: Network Rail analysis of data from PLANET Strategic model
The data illustrated in Figure A also suggests commuters are more sensitive to time and cost than business users. This makes intuitive sense as, generally, commuters tend to travel more frequently than business travellers who may travel on the rail network more infrequently.
A very small proportion of commuters travel with a total journey time of greater than two hours, and a moderate improvement to a long journey time is likely to have a small impact on demand. A significant proportion of commuting occurs over journeys of between 30 and 90 minutes’ total journey time. Reductions in journey times over the 30 to 90 minute range can therefore have a sizeable impact on demand particularly where realistic alternatives to rail exist for some or all of the rail journey. Evidence suggests that a large proportion of people are willing to commute for less than 30 minutes which means that improvements to journey times for short journeys of this nature are unlikely to stimulate a large increase in
Figure A – Decay of willingness to travel3
0%
10%
20%
30%
40%
50%
60%
70%
80%
90%
100%
0 25 50 75 100 125 150 175 200 225 250
Generalised cost of travel (£, 2007 prices)Pr
opor
tion
of L
SE tr
avel
und
erta
ken
Business Commuting

Network Rail London and South East Market Study 68October 2013Appendix A
demand.
The decay curve shown in Figure A helps to define business to business connectivity. This is measured by the “effective density” of places, i.e. the employment accessibility of a location. Effective density measures the number of employees in two locations and the willingness of the employees to travel from one location to the other for business purposes.
The number of employees is therefore a proxy for the volume of business activity and trading undertaken between two places. The formula for effective density is:
Effective density of zone A = sum of (willingness to travel from zone A to zone B * employees in zone B) for all zones.
The formula implies that a business with access to a large pool of labour is more able to employ people with the appropriate skills, and is likely to undertake a higher level of business interaction. Businesses are also more likely to engage in business activities with these employment areas when the generalised cost of travel reduces, as defined by the decay curve in Figure A.
The decay curve for commuting shown in figure A helps to define employee to employer connectivity, defined as the number of people willing to travel to the jobs in a particular location. This willingness is gauged by a measure of the “effective jobs” attractive to the population at a particular location.
The formula for effective jobs is:
Effective jobs for zone A = Sum of (jobs in zone B * willingness to travel from zone A to those jobs in Zone B) for all zones.
The formula implies that individuals with access to a large and diverse employment market are more able to maximise the value and productivity of their skills thereby benefiting from higher salaries.
Relationship between connectivity and economic growthFurther analysis was undertaken to establish the relationship between economic output and business to business connectivity. Econometric analysis4 was undertaken and showed that, at a national level, there is a statistically significant positive link between effective density (a proxy for business to business connectivity) and economic outputs, which is measured in Gross Domestic Product (GDP) per worker.
A t-statistic test5 was undertaken and showed that the co-efficient of the independent variable (effective density) is statistically significant at 95 per cent confidence level, and can explain the variation in GDP per worker. The results are presented in Figure B.
It was not possible to replicate this relationship for London and the South East only, as the data sample became too small. Therefore it is the national relationship between effective density and GDP per worker that has been used to calculate the impact of business to business connectivity on economic growth.
4 Statistical analysis used in Economics5 A statistical test that assesses the likelihood that a relationship between two variables occurs by chance

Network Rail London and South East Market Study 69October 2013Appendix A
£0
£10,000
£20,000
£30,000
£40,000
£50,000
£60,000
£70,000
£80,000
£90,000
0.0
m
0.5
m
1.0
m
1.5
m
2.0
m
2.5
m
3.0
m
3.5
m
4.0
m
4.5
m
5.0
m
5.5
m
6.0
m
6.5
m
7.0
m
7.5
m
8.0
m
8.5
m
E �ective density
GD
P p
er w
ork
er
G D P per w orker L inear (G D P per w orker)
T test indicator on co-e�cient of x = 3 .758898383
Ind ica to r requ ired fo r 95% confidence =
1.97
S tandard error of co-e�cient of x =0.000451998
C o-e�cient of x =0.001699014
Figure B –Effective density versus GDP per worker for all zones in the Planet Strategic Model

Network Rail London and South East Market Study 70October 2013Appendix A
It was possible to find a statistically significant positive link between effective jobs (a proxy for employer to employee connectivity) in London and the South East and economic outputs, measured in GDP per worker. A further t-statistic test was undertaken and showed that the co-efficient of the independent variable (effective jobs) is statistically significant at 95 per cent confidence level, and can explain the variation in GDP per worker. Central and inner-London zones were excluded from this test as these places are also well connected by the bus and underground network. The results are presented in Figure C.
£30,000
£35,000
£40,000
£45,000
£50,000
£55,000
£60,000
£65,000
£70,000
0.0m0.2m0.4m0.6m0.8m1.0m1.2m1.4m1.6m1.8m2.0m2.2m2.4m2.6m2.8m3.0m3.2m3.4m3.6m3.8m4.0m4.2m4.4m4.6m4.8m5.0m
E ffective jobs
GD
P pe
r wor
ker
T test indicator on co-e�cient of x = 4.9028
Indicator required for 95% confidence = 2.0117
Standard error of co-e�cient of x =
Co-e�cient of x =0.0028
NB: Excludes Central and Inner London zones
0.0006
GDP per worker Linear (GDP per worker)
Figure C –Effective jobs versus GDP per worker for London Outer & South East
This analysis suggests that improvement in rail services can help to increase economic growth. By reducing the generalised cost of travel by rail, it helps to improve willingness to travel, and subsequently increases effective density and improves GDP per worker.

Network Rail London and South East Market Study 71October 2013Appendix A
Calculation of the impact of rail service improvement on economic growthTo estimate the impact of service improvement on Gross Domestic Product, a new generalised cost of travel is calculated. This takes account of changes in rail journey time, rail service frequency and interchange penalty. The proportion of people willing to travel is estimated from the Decay Curve which shows that the proportion of people prepared to travel changes with movement along the decay curve.
Generalised cost foreach pair of “zones” in Planet Strategic Model,
by all modes of transport
Number of trips made Proportion of people willing to travel,
by all modes of transport
Decay curve for business travel
(as shown in Figure A)
New generalised cost(as a result of rail
service improvement)and new mode share
New willingness to travel (move alongthe Decay curve
in Figure A)
Change inwillingness to travel
Number of employees New e�ective densityCoe�cient from the relationship
between GDP and e�ective density as shown in Figure B
Impact of rail improvementon GDP per worker
The next step is to calculate the change in effective density and effective jobs as a result of the changes in generalised cost. The coefficient estimated from the relationship between GDP and effective density, and between GDP and effective jobs, is applied to calculate the impact of rail improvement on GDP. Figures D and E set out in a flow diagram how the economic impact is calculated.
Figure D – Method to calculate the impact of rail service levels on economic growth: business interaction

Network Rail London and South East Market Study 72October 2013Appendix A
Generalised cost foreach pair of “zones” in Planet Strategic Model,
by all modes of transport
Number of trips made Proportion of people willing to travel,
by all modes of transport
Decay curve for commuting
(as shown in Figure A)
New generalised cost(as a result of rail
service improvement)and new mode share
New willingness to travel (move alongthe Decay curve
in Figure A)
Change inwillingness to travel
Number of employees New e�ective jobsCoe�cient from the relationship
between GDP and e�ective jobs as shown in Figure C
Impact of rail improvementon GDP per worker
Figure E – Method to calculate the impact of rail service levels on economic growth: accessibility of jobs

Network Rail London and South East Market Study 73October 2013Appendix A
A.2 Assessment of the impact of rail service levels on the quality of life for communities and individuals
The impact of rail service improvements on quality of life for individuals and communities are assessed to determine the service level conditional outputs. The assessment quantifies the impact of service improvements on the value of time spent on travelling to existing and new rail passengers.
Improvement in rail service provision is reflected through changes in the generalised journey time6 (GJT) for travel between places in London and the South East. The GJT takes into account time spent in a vehicle, service frequency and interchange. The assessment compares the current GJT experienced by rail passengers with the GJT associated with different levels of generalised speed (distance divided by GJT).
The number of existing rail journeys between each place and their corresponding GJT is sourced from MOIRA7. Values of time were sourced from the Department for Transport’s transport appraisal guidance8 and were then applied to calculate the benefits in time saving, which then represents the quality of life improvement to rail passengers.
6 Generalised journey time (GJT) represents journey time, frequency of service and interchange in a single term and is expressed in equivalent (minutes or hours) of journey time.7 A rail demand forecasting model that contains rail ticket sales data and train timetables.8 DfT’s WebTAG (Transport Appraisal Guidance on the web)
A.3 Assessment of the environmental impact of rail service levels
The impact of improving rail services on the environment is assessed by estimating the volume of modal shift to rail. This helps to relieve road congestion and benefits the environment through a reduction in noise and greenhouse gas emissions. The environmental benefits associated with improvements in GJT are monetised by multiplying the amount of road mileage removed (as a result of modal shift) by the marginal external cost9 of road vehicle use. The amount of road mileage removed is estimated by multiplying the number of new rail journeys by the average mileage of the new trips induced, and by a factor10 of 0.26, which reflects the occupancy rate of road vehicles. Analysis shows that places which benefit most in terms of environmental impact are likely to be where rail has the potential to capture a large share of a large total market for travel. Rail also has the greatest potential to increase its market share where rail journey times are currently similar or longer than by car. Conversely, in markets where rail already has a dominant mode share, there is less scope to deliver environmental benefits through further marginal increases in market share e.g. travel to/from Central London at peak times.
9 Sourced from DfT’s WebTAG10 In accordance with DfT’s WebTAG

Network Rail London and South East Market Study 74October 2013Appendix A
A.4 How the connectivity based conditional outputs are determined
Journeys made within the London and South East area have been segmented by distance and whether they were to or from Central London, as shown in Figure F.
There is likely to be overlap between these markets and some journeys may share the characteristics of more than one market.
The marginal benefits of rail service improvements under each quantitative assessment described in sections A.1 - A.3 were interpreted separately for each of the four market segments for which connectivity based conditional outputs were developed. By examining the nature of journeys within individual market segments, a series of conditional outputs were developed, which are
specific to each market segment. These outputs are based on identifying the service levels (expressed as GJT, or total journey time including waiting time) where changes to the rail connectivity offered stimulate significant changes in the amount of rail travel undertaken, or time saved. These conditional outputs are illustrated by a series of case studies presented in Chapter 7.
Figure F – Market Segments
Central London
This market comprises journeys entirely within Central London (zone 1). Rail has only a small share of this market which is dominated by London Underground and bus journeys. The Market Study has not developed connectivity based conditional outputs for this market.
Shorter distance journeys to central London
This market is typically served by stopping services, up to 30 to 40 minutes journey time from a central London terminus and broadly bounded by the M25 orbital motorway.
Longer distance journeys to central London
This market is served by fast/semi-fast services, with journey times of over 30 minutes from a central London terminus.
Shorter distance journeys within the South East
This market is comprised of journeys of up to 30 miles that do not start or end in central London. It includes journeys to, across and within greater London, as well as journeys between other population centres close to each other.
Longer distance journeys within the South East
This market is comprised of journeys of over 30 miles that do not start or end in central London. It includes journeys to and from Greater London, as well as journeys between other large population centres.

Network Rail London and South East Market Study 75October 2013Appendix B
• Stage three. A short list of factors from stage one was compiled for each market study, intended to cover the factors which are likely to have a dominant impact on passenger demand in each market. (One of the factors on the London and South East Market Study short list, for example, is the projected future change in central and inner London employment).
The future level of each factor in each shortlist was set at a level that is commensurate with the circumstances articulated by each scenario from stage two. For example, central and inner London employment is highest in the Prospering in Global Stability Scenario, next highest in the Prospering in Isolation, Struggling in Global Turmoil and Struggling in Isolation Scenarios.
The selected levels for each factor under each scenario were discussed with the Working Groups.
A demand model or modelling suite was then developed separately for each market study, as the characteristics of each market, and hence the short list of factors, vary.
The Long Distance Market Study uses two models:
• The first model uses estimates of people’s propensity to travel over long distances given the characteristics of their household (e.g. household income). The number of each type of household in each location (zone1) in the model is varied in accordance with the level of the factors from the shortlist which affect household composition (e.g. National Income). The output of this model is an estimate of the total market for travel between all zones in the model, by all modes of transport
• The second model allocates this demand to the available modes of long distance transport. This mode split is estimated using a number of factors from the shortlist, including the cost of travel by each mode. Again, these factors vary by scenario.
The Regional Urban Market Study also uses a market size model and a market share model as the basis for the long term demand
1 The model comprises 235 zones based around the functioning economic
areas in Great Britain
Appendix B: Summary of demand forecasting methodology
Each of the passenger market studies contains a detailed explanation of the forecasting methodology undertaken to produce their respective long term demand scenarios. The purpose of this appendix is therefore to provide a brief summary of the methodologies from all three studies, so that the reader can understand the similarities and differences between them.
The aim of the market studies is to develop an understanding of how rail can make a successful long term contribution to the key priorities of current and potential future rail industry funders. Identifying the appropriate role of rail in the context of these long term priorities requires extension of Network Rail’s previous demand projections to a 30-year time horizon. This is because many common major railway infrastructure components, such as track systems, have an asset life of around 30 years. Decisions to change the capability of the network therefore require an understanding of the likely usage of it over this time period to maximise the value and useful life of the investment, and to capitalise on the significant opportunity for improved outputs available at the point where infrastructure systems fall due for renewal.
Demand forecasting over such a long term period represents a considerable challenge and a three-stage approach has been undertaken to develop these long term demand projections:
• Stage one. The extensive body of industry research on rail demand was reviewed to identify and group the likely factors that determine the number of people who travel by rail. Over 20 sub-categories of factor were identified, (for example the population of Great Britain and its regions, and the cost of travel by rail)
• Stage two. A series of potential alternative futures for Great Britain was postulated which would result in differences in these factors. These futures were articulated as four scenarios, (Prospering in Global Stability, Struggling in Global Turmoil, Prospering in Isolation, Struggling in Isolation).
Stages one and two are common to all three passenger market studies.

Network Rail London and South East Market Study 76October 2013Appendix B
the end of Control Period 5 (March 2019). These changes are assumed as committed, in that rail industry funders have committed to make the necessary funding available.
The impact of other potential schemes has not been included in the projections, although the Long Distance Market Study presents an assessment of the potential demand impact if all of the conditional outputs were delivered.
Demand forecasts are often a contentious subject, particularly given their impact on a number of high-value industry financial transactions such as passenger franchise agreements, and the forecasts produced in the three market studies have generated significant debate amongst the various study Working Groups, and amongst stakeholders generally.
Every endeavour has been made to achieve a consensus amongst the study Working Groups, but ultimately, the figures presented represent Network Rail’s professional opinion based upon the best available evidence. The Market Study documents are careful to explain the assumptions used where any limitations occur within the available data or selected modelling approach.
The documents also provide guidance as to how the figures should be interpreted, and how they should be used in subsequent stages of the Long Term Planning Process. Since the forecasts do not include the impact of rail service changes which are yet to be committed, they should not be viewed as the maximum potential for growth over the 30 year period considered. Further improvements to service changes will almost certainly result in additional growth in passenger journeys. It is recommended that readers of the market study documents consider this when comparing the demand projections with historic demand growth.
projections. These models, which cover the functioning economic area around Leeds, use a similar approach to the Long Distance modelling, albeit with more disaggregate data and model zoning.Data limitations made it impossible to repeat this modelling exercise for the other city regions covered by the Regional Urban Market Study in the time available. Instead, the range of demand projections from the Leeds model were fitted around the central demand forecasts from the most recent Route Utilisation Strategies (RUSs) for the other city regions. This process was based on both a comparison of the characteristics of these locations with Leeds, and extensive discussions with the stakeholders who represent these places.
The London and South East Market Study used a spreadsheet model to apply the factors from the shortlist to the external factors forecasting framework detailed in the Passenger Demand Forecasting Handbook (PDFH). The resultant, corridor-by-corridor2, demand projections were fitted around the central demand forecasts from the London and South East Route Utilisation Strategy.
This approach was taken as the London and South East RUS projections were produced using the London Transport Study and Railplan transport modelling suite, which includes all forms of public transport, such as the London Underground and Docklands Light Railway, as well as national rail services. This is the most appropriate software to estimate the London-wide impact of major impending service changes such as Thameslink Key Output Two, and Crossrail.
A review and update of the modelling assumptions used in the RUS forecasts was undertaken in preference to a re-run of the LTS/Railplan, as the train service specifications for both projects are still in the planning stage.
The ensuing long term demand projections for the three passenger markets are an estimate of the demand for rail travel as a result of background growth (the factors from stage one) plus the impact of changes to services that are scheduled for implementation before
2 Rail corridors into each central London terminus station

Network Rail London and South East Market Study 77October 2013Glossary
Term Meaning
ATOC Association of Train Operating Companies
BML Brighton Main Line
Conditional Outputs Statement of aspirations for the level of service provided
Control Period 5 (CP5) The 2014 – 2019 period
Control Period 6 (CP6) The 2019 – 2024 period
DfT Department for Transport
ECML East Coast Main Line
ERTMS European Rail Traffic Management System
Generalised journey timeA measure of the rail service offer that takes account of in vehicle time, service frequency and interchange penalty
GB Great Britain
GDP Gross Domestic Product
GLA Greater London Authority
GEML Great Eastern Main Line
GWML Great Western Main Line
HLOS High Level Output Specification
HS1 High Speed 1 – the high speed link between St Pancras International and the channel tunnel
HS2 Proposed high speed link between London and Birmingham beyond to Leeds and Manchester
ITA Integrated Transport Authority
ITC Integrated Transport Commission
LDHS Long Distance High Speed
LEP Local Enterprise Partnership
LSE London and South East
LTPP Long Term Planning Process
MML Midland Main Line
MTS Mayor’s Transport Strategy
NTS National Travel Survey
ONS Office for National Statistics
ORR Office of Rail Regulation (the regulator for the rail industry in Great Britain)
PDFC Passenger Demand Forecasting Council
PDFH Passenger Demand Forecasting Handbook
PGS Prospering in global stability

Network Rail London and South East Market Study 78October 2013Glossary
Term Meaning
PII Prospering in isolation
PSM Planet Strategic Model
RAC Royal Automobile Club
RDG Rail Delivery Group
RFOA Rail Freight Operators Association
RIA Rail Industry Association
RIPG Rail Industry Planning Group
RUS Route Utilisation Strategy
SGT Struggling in global turmoil
SII Struggling in isolation
STAG Transport Scotland’s appraisal guidance
Strategic Goals Statement of priorities
SWML South West Main Line
TEMPro Trip End Model Presentation Program
TfL Transport for London
TOC Train Operating Company
WCML West Coast Main Line
WebTAG Web-based Transport Appraisal Guidance

Network RailKings Place 90 York Way London N1 9AG
www.networkrail.co.uk
Network RailKings Place 90 York Way London N1 9AG
www.networkrail.co.uk