long lake solar project 9. references ... (measured in accordance with the ieee c57.12.90-2010...
TRANSCRIPT
Long Lake Solar Project Noise Assessment Study Report August 8, 2013

Disclaimer This report has been prepared by or on behalf of Northland Power Inc. for submission to the Ontario Ministry of the Environment as part of the Renewable Energy Approval process. The content of this report is not intended for the use of, nor is it intended to be relied upon by, any other person. Neither Northland Power Inc. nor any of its directors, officers, employees, agents or consultants has any liability whatsoever for any loss, damage or injury suffered by any third party arising out of, or in connection with, their use of this report.
Northland Power Inc.
on behalf of Northland Power Solar
Long Lake L.P. Toronto, Ontario
Noise Assessment Study Report
Long Lake Solar Project
H334844-0000-07-124-0301 Rev. 1
August 8, 2013

Long Lake Solar Project Noise Assessment Study Report
H334844-0000-07-124-0301, Rev.1, Page i
© Hatch 2013/08
Executive Summary
This report presents the results of the Noise Assessment Study required for Solar Facilities under Ontario Regulation 359/09 and 521/10, as part of the Renewable Energy Approval (REA) Process. Northland Power Solar Long Lake L.P. (“Northland”) is proposing to develop a 10-megawatt (MW) solar photovoltaic (PV) project titled Long Lake Solar Project (the “Project”). The Project will be located on approximately 46 hectares (ha) of land within the unorganized township of Calder, District of Cochrane.
This Noise Assessment Study Report has been prepared based on the document entitled “Basic Comprehensive Certificates of Approval (Air) – User Guide” by the Ontario Ministry of the Environment (MOE, 2004). The sound pressure levels at the points of reception (POR) have been estimated using ISO 9613-2, implemented in the CADNA-A computer code. The performance limits used for verification of compliance correspond to the values for rural areas of 40 dBA. The results presented in this report are based on the best available information at this time. It is the intention that, in the detailed engineering phase of the project, certified noise data based on final plans and designs will confirm the conclusions of this noise impact assessment study.
The results obtained in this study show that the sound pressure levels at POR, resulting from the Project operation, will not exceed MOE requirements for rural areas of 40 dBA.

Long Lake Solar Project Noise Assessment Study Report
H334844-0000-07-124-0301, Rev.1, Page ii
© Hatch 2013/08
Project Report
August 8, 2013
Northland Power Inc.
Long Lake Solar Project
Noise Assessment Study Report
Table of Contents Executive Summary
1. Introduction ............................................................................................................................................ 1
1.1 Project Description ........................................................................................................................ 1 1.2 Renewable Energy Approval Legislative Requirements ................................................................... 1
2. Facility Description ................................................................................................................................. 1
2.1 Project Location ............................................................................................................................. 2 2.2 Acoustical Environment ................................................................................................................. 2 2.3 Life of Project ................................................................................................................................. 2 2.4 Operating Hours ............................................................................................................................ 2 2.5 Approach to the Study .................................................................................................................... 2
3. Noise Sources .......................................................................................................................................... 3
3.1 Substation Transformer ................................................................................................................... 3 3.2 Inverter Clusters ............................................................................................................................. 4 3.3 Noise Summary Table .................................................................................................................... 6 3.4 Adjacent Solar Projects................................................................................................................... 7
4. Noise Receptors and Points of Reception ................................................................................................ 7
5. Mitigation Measures ................................................................................................................................ 8
6. Impact Assessment .................................................................................................................................. 8
6.1 Compliance with Performance Limits ............................................................................................. 9
7. Conclusions and Recommendations ...................................................................................................... 11
8. Signatures .............................................................................................................................................. 12
9. References ............................................................................................................................................. 13
Appendix A Land Use Zoning Designation Plan and Area Location Plan
Appendix B Noise Sources Appendix C Noise Maps from CADNA-A Appendix D CADNA-A Sample Calculations

Long Lake Solar Project Noise Assessment Study Report
H334844-0000-07-124-0301, Rev.1, Page iii
© Hatch 2013/08
List of Tables
Table 2.1 General Project Description ................................................................................................. 2
Table 3.1 Noise Source Summary for Long Lake Solar Project ............................................................. 6
Table 4.1 Point of Reception at 4.5 m Noise Impact from Individual Noise Sources of Long Lake Solar Project ............................................................................ 8
Table 6.1 Performance Limits (One-Hour Leq) by Time of Day for Class 3 Areas ................................... 9
Table 6.2 Calculated Sound Pressure Levels at POR within 1 km of Long Lake Solar Project. ............ 10
List of Figures
Figure 2.1 CADNA-A Configurations..................................................................................................... 3
Figure 3.1 Schematic Inverter Cluster Layout ........................................................................................ 5
Figure 3.2 Inverter Cluster CADNA-A Acoustical Model ....................................................................... 5
.

Long Lake Solar Project Noise Assessment Study Report
H334844-0000-07-124-0301, Rev.1, Page 1
© Hatch 2013/08
1. Introduction 1.1 Project Description
Northland Power Solar Long Lake L.P. (“Northland”) is proposing to develop a 10-megawatt (MW) solar photovoltaic (PV) project titled Long Lake Solar Project (the “Project”). The Project will be located on approximately 46 ha of land within the unorganized township of Calder, District of Cochrane.
The proposed Project is a renewable energy generation facility which will use solar photovoltaic technology to generate electricity. Electricity generated by solar photovoltaic panels will be converted from Direct Current (DC) to Alternating Current (AC) by inverter clusters which will also step up the voltage to 27.6 kV. A main transformer, located in the substation, will step up the voltage from the clusters to 115 kV prior to being transmitted to the existing local distribution line. In order to meet the Ontario Power Authority (OPA)’s Feed-In-Tariff (FIT) Program requirements, a specific percentage of equipment will be manufactured in Ontario.
The construction of the Project will begin once the Renewable Energy Approval (REA) has been obtained and a power purchase agreement is finalized with the OPA. The anticipated operational lifespan of the Project is 30 years.
1.2 Renewable Energy Approval Legislative Requirements Ontario Regulation 359/09 and 521/10, made under the Environmental Protection Act identify the Renewable Energy Approval (REA) requirements for green energy projects in Ontario. As per Section 4 of these regulations, ground mounted solar facilities with a name plate capacity greater than 12 kilowatts (kW) are classified as a Class 3 solar facility and, therefore, require an REA.
Section 13 of the Ontario Regulation 359/09 requires proponents of Class 3 solar facilities to complete a Noise Study Report in accordance with Appendix A of the publication; “Basic Comprehensive Certificates of Approval (Air) – User Guide, 2004” by the Ministry of the Environment (MOE, 2004).
The Noise Study Report is to include a general description of the facility, sources and points of reception (POR), Assessment of compliance, as well as all the supporting information relevant to the Project. A draft of the Noise Study Report must be made available to the public, the local municipality and identified Aboriginal communities, at least 60 days prior to the final public consultation meeting in accordance with Ontario Regulation 359/09 and 521/10.
2. Facility Description The Project will utilize photovoltaic (PV) panels installed on fixed racking structures mounted on the ground. The PV panels generate DC electricity which will be converted to AC electricity by inverters. The Project layout is based on seven inverter clusters each one containing two inverters and one medium-voltage (360-V /27.6-kV/1.6-MVA) transformer, and one 27.6-kV/115-kV/10-MVA substation transformer. The 27.6-kV power, collected from the inverter clusters, will be stepped up to 115 kV by the substation transformer prior to being transmitted to the existing local distribution line.

Long Lake Solar Project Noise Assessment Study Report
H334844-0000-07-124-0301, Rev.1, Page 2
© Hatch 2013/08
Since the panels will be ground-mounted and the total nameplate capacity is over 12 kW, the Project is considered to be a Class 3 Solar Facility according to the classification presented in Ontario Regulation 521/10.
Table 2.1 General Project Description
Project Description Ground-mounted Solar PV, Class 3 System Nameplate Capacity 10 MW AC Local Distribution Company N/A
2.1 Project Location The Project Location1
Figure A.1 will be on privately owned land, zoned rural, totalling approximately 46 ha.
in Appendix A shows the zoning designation plan. Also, Figure A.2 presents the Project Area Location Plan.
2.2 Acoustical Environment The Project will be surrounded by heavily forested areas to the west, east and south. The background noise levels are expected to be typical of rural areas, classified as a Class 3 based on Publication NPC-232 by the MOE. Major high voltage transmission lines pass within 0.5 km to the east of the site. The Trans-Canada Highway passes both to the south and to the west at a minimum distance of 6.5 km. The Town of Cochrane is situated approximately 19 km to the southeast. There are no airports within 5 km of the Project Location.
2.3 Life of Project The expected life of the Project is 30 years. The manufacturer’s warranty on the PV modules is 25 years and the expected life of solar power plants of this type is typically 35 to 40 years. At that time (or earlier if the 20-yr power purchase agreement is not extended), the Project will be decommissioned or refurbished depending on market conditions and/or technological changes.
2.4 Operating Hours Solar PV facilities produce electricity during the day hours, when the sun rays are collected by the panels. After sunset the facility will not receive solar radiation to generate any electricity. Under these conditions the inverters will not produce any noise and the transformers will be energized, but not in operation (no fans in operation).
2.5 Approach to the Study The sound pressure levels at the POR were predicted using procedures from ISO 9613-2, which is a widely used and generally accepted standard for the evaluation of noise impact in environmental Assessments. The sound power level for the inverters was provided by the manufacturer while the sound power level for the transformers was estimated. The software package CADNA-A, which implements ISO-9613-2, was used to predict the noise levels at the POR. This numerical modeling software is able to simulate sound sources as well as sound mitigation measures taking into account atmospheric and ground attenuation. Some of the CADNA-A configurations used in the modeling are shown in Figure 2.1.
1 “Project Location” in the context of this study is an area occupied by the Project infrastructure.

Long Lake Solar Project Noise Assessment Study Report
H334844-0000-07-124-0301, Rev.1, Page 3
© Hatch 2013/08
Elevation contours were not included in the CADNA-A model. This conservative approach was applied in order to avoid including any barrier effects of ground surface obstacles.
For modeling purposes, the vegetation that blocks some of the POR from the sources has not been incorporated.
Figure 2.1 CADNA-A Configurations
3. Noise Sources The main sources of noise from the Project will be seven inverter clusters, each one containing two inverters and one medium-voltage transformer, and a substation containing the main step-up transformer. The Project layout is provided in Figure A.2. The coordinates of each noise source are presented in Table B.1 of Appendix B.
All noise sources were modeled as non-directional point sources.
Switchgear and a small step-down transformer used for lighting, located at the substation, do not emit any significant noise and consequently have not been considered as sources of noise.
For the purpose of this study it is assumed that all inverters and transformers will be operating 24 hours at full capacity.
3.1 Substation Transformer A 10-MVA step-up transformer that will step up the 27.6-kV power to 115 kV, required by the local distribution company, will be located in the substation. The transformer manufacturer provided an expected overall sound pressure level of 66 dB (measured in accordance with the IEEE C57.12.90-2010 standard). The transformer will be of ONAF (oil natural air forced) type and will look similar

Long Lake Solar Project Noise Assessment Study Report
H334844-0000-07-124-0301, Rev.1, Page 4
© Hatch 2013/08
to the one shown in Figure B.2. The sound power spectrum was determined using the provided overall sound pressure level (66 dB), a characteristic area of 100-m2 over which the sound pressure acts (using 125% of the encompassing vertical surface area), and empirical correlations for transformer noise (Crocker, 2007). This calculation is available in Figure B.3 of Appendix B. Noise source height representing the transformer was assumed at 3.6 m above grade.
Power transformers are considered by the MOE to be tonal noise sources. A 5-dB penalty was added to the sound power spectrum, as recommended by Publication NPC-104, “Sound Level Adjustments” for tonality.
Table B.2 in Appendix B shows the frequency spectrum used to model the substation transformer.
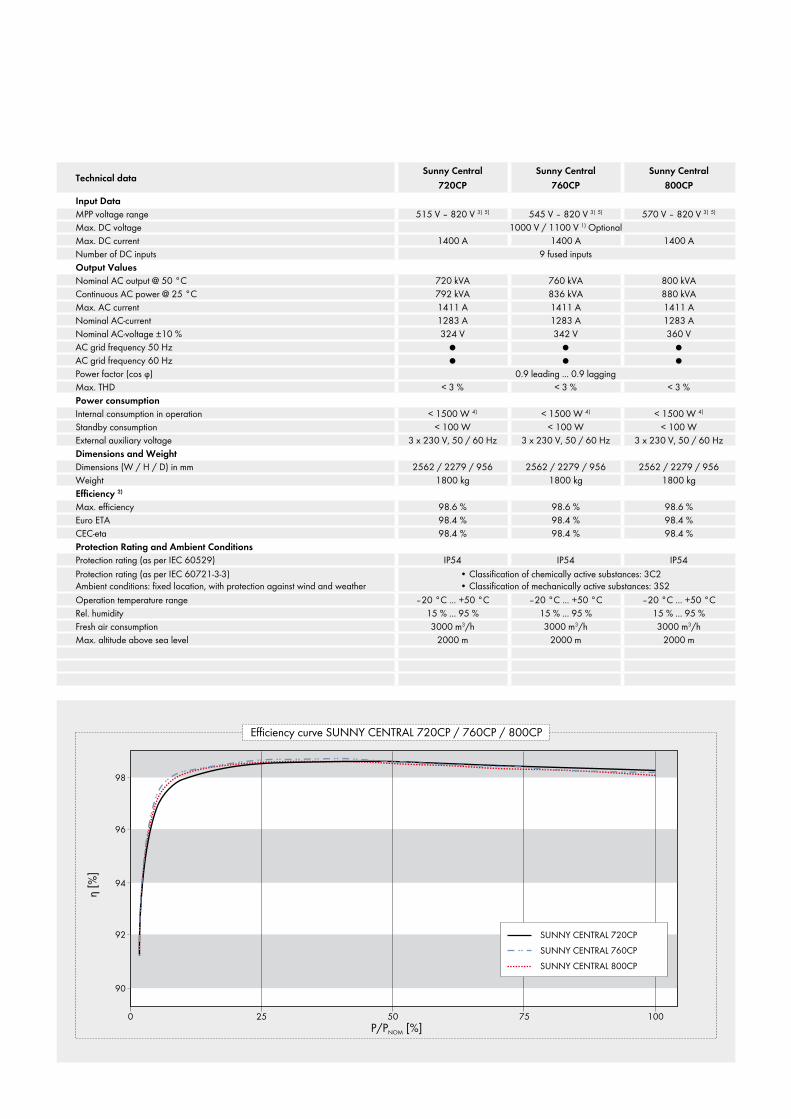
3.2 Inverter Clusters Northland is planning to use inverters manufactured by SMA. Seven inverter clusters will be installed as part of the Project. Each cluster comprises of two SMA Sunny Central 800CP inverters and one medium voltage transformer. A schematic layout with approximate dimensions of such cluster is available in Figure 3.1, additional information regarding details of the inverter cluster can be found in Appendix B). The cluster components listed above were modeled as point sources shown in Figure 3.2. Note that the planned enclosure over the inverters was not taken into account as a mitigation measure in the noise model.
The installed capacity of each Sunny Central 800CP inverter is 800 kW. SMA provided third-octave noise data for the Sunny Central 800CP inverter (Figure B.1 of Appendix B). The provided third octave spectrum was converted to a full octave spectrum and the contribution from two inverters was combined into a single sound power spectrum for use with CADNA-A model (calculations are available in Figure B.4 of Appendix B). A 5-dBA penalty was added to the frequency spectrum, as stipulated in Publication NPC-104, “Sound Level Adjustments,” to allow for tonality. The frequency spectrum used to model combined noise emission from the two inverters located next to each other within the same cluster is shown in Table B.2 of Appendix B.
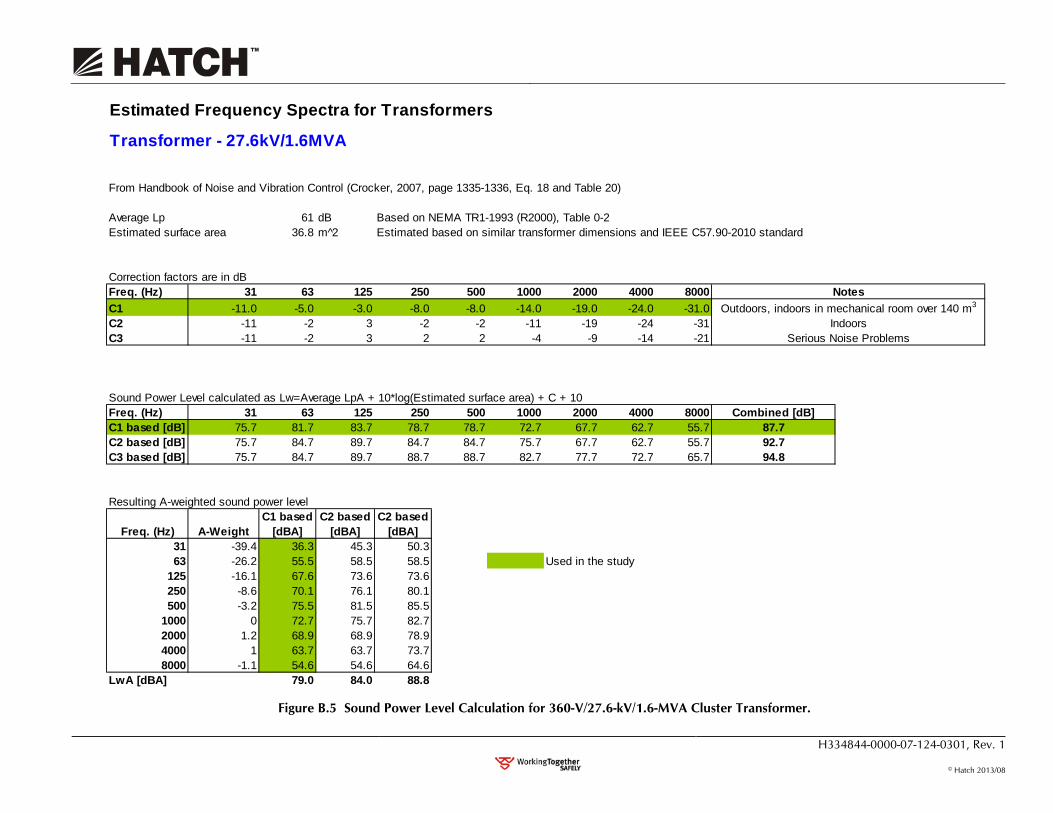
A 1.6-MVA transformer used to step up the 360-V power from the inverters to 27.6 kV will be located in close proximity to the inverters. Since the transformer make and model have not been selected at this point (although it is known that the transformer will be of ONAN (oil natural air natural) type, the sound power levels resulting from the operation of the transformer were evaluated using data from NEMA TR 1-1993 (R2000) and a surface area of 36.8-m2 over which the overall sound pressure acts (evaluated in accordance with IEEE C57.12.90-2010). The NEMA levels were then converted into frequency spectrum using empirical correlations for transformer noise (Crocker, 2007). This calculation is available in Figure B.5 of Appendix B. Power transformers are considered by the MOE to be tonal noise sources. A 5-dB penalty was added to the sound power spectrum, as recommended by Publication NPC-104, “Sound Level Adjustments” for tonality.
Table B.2 in Appendix B shows the frequency spectrum used to model the transformers located in the clusters.
Although for the modeling purposes it was assumed that the facility will operate 24 h at full capacity, in reality at night the facility will be idle. Under these conditions the inverters do not produce noise. The transformers (at the substation and clusters) are energized and make some magnetostrictive noise at a reduced level, but no cooling fans are in operation.

Long Lake Solar Project Noise Assessment Study Report
H334844-0000-07-124-0301, Rev.1, Page 5
© Hatch 2013/08
Figure 3.1 Schematic Inverter Cluster Layout (all dimensions in metres)
Figure 3.2 Inverter Cluster CADNA-A Acoustical Model
where: Inv=Noise Source Representing Two Sunny Central 800CP Inverters; and Trans=Noise Source Representing 360-V/27.6-kV/1.6-MVA Cluster Transformer (all dimensions in metres).
Inv Trans
Ground
5.50
2.60 2.58
Trans
Inv 0.50
Side view
Plan View
2.56
0.96
1.68 1.70
8.84
3.50
0.46
2.13 2.14
Inverter
Inverter
Transformer
Mounting pad

Long Lake Solar Project Noise Assessment Study Report
H334844-0000-07-124-0301, Rev.1, Page 6
© Hatch 2013/08
3.3 Noise Summary Table A summary of the sound sources described above, including sound power level, characteristics and proposed noise control measures, is presented in Table 3.1.
Table 3.1 Noise Source Summary for Long Lake Solar Project
Source ID
Description
Total Sound Power Level (dBA)
Source Location
Sound Characteristics
Noise
Control Measures
Sub 27.6-kV/115-kV/10-MVA substation transformer 93.4 O S-T U
Inv1 Two Sunny Central 800CP inverters at Cluster 1 91.3 O S-T U
Inv2 Two Sunny Central 800CP inverters at Cluster 2 91.3 O S-T U
Inv3 Two Sunny Central 800CP inverters at Cluster 3 91.3 O S-T U
Inv4 Two Sunny Central 800CP inverters at Cluster 4 91.3 O S-T U
Inv5 Two Sunny Central 800CP inverters at Cluster 5 91.3 O S-T U
Inv6 Two Sunny Central 800CP inverters at Cluster 6 91.3 O S-T U
Inv7 Two Sunny Central 800CP inverters at Cluster 7 91.3 O S-T U
Trans1 360-V/27.6-kV/1.6-MVA cluster transformer at Cluster 1 84.1 O S-T U
Trans2 360-V/27.6-kV/1.6-MVA cluster transformer at Cluster 2 84.1 O S-T U
Trans3 27.6-kV/1.6-MVA cluster transformer at Cluster 3 84.1 O S-T U
Trans4 360-V/27.6-kV/1.6-MVA cluster transformer at Cluster 4 84.1 O S-T U
Trans5 360-V/27.6-kV/1.6-MVA cluster transformer at Cluster 5 84.1 O S-T U
Trans6 360-V/27.6-kV/1.6-MVA cluster transformer at Cluster 6 84.1 O S-T U
Trans7 360-V/27.6-kV/1.6-MVA cluster transformer at Cluster 7 84.1 O S-T U
Notes: 1. A 5-dBA penalty is included in this table. 2. Location: Inside building (I), Outside building (O). 3. Sound Characteristics: Steady (S), Tonal (T), Impulsive (I), Quasi-Steady Impulsive (QSI). 4. Noise Control: Silencer (S), Acoustic lining (A), Barrier (B), Lagging (L), Enclosure (E), Other (O),
Uncontrolled (U).

Long Lake Solar Project Noise Assessment Study Report
H334844-0000-07-124-0301, Rev.1, Page 7
© Hatch 2013/08
3.4 Adjacent Solar Projects To identify the adjacent solar projects Hatch’s internal database of solar projects and MOE records available in http://www.ene.gov.on.ca/environment/en/subject/renewable_energy/projects/index.htm were searched (August 13, 2012).
There are no Noise Receptors that are within 1 km of equipment in the Project and any adjacent project. As a result, there are no adjacent projects included in this study.
4. Noise Receptors and Points of Reception The Noise Receptors used in this study were identified from the OBM and Google Earth Pro aerial imagery (July 2004) within 1 km distance from the Project Site2
The Noise Receptors corresponding to the vacant lots were added based on parcel information provided by First Base Solutions (Teranet Data) and located according to the requirements outlined in Ontario Regulation 359/09, and its amendment (Ontario Regulation 521/10).
boundary, and also from visual observations of the Project Site surroundings conducted in Summer 2010.
The total number of Noise Receptors within a 1 km distance from the Long Lake Solar Project, Project Site boundary is 17, including the vacant lots. Points of reception (POR) representing the noise receptors were located at the center of house footprint (Noise Receptor center ) elevated 4.5 m above ground. Also, noise compliance was verified within 30-m distance from the Noise Receptor centers at 1.5 m above the ground.
Three POR, identified in Table 4.1, were chosen as representative for evaluating the noise contribution from each individual source. These three POR were chosen in order to represent sound pressure level contributions on different areas around the Project Location. The complete set of results for all considered POR is provided in Table 6.2.
2 “Project Site” in the context of this study is the complete area designated for the Project but not necessary occupied with the project
infrastructure. Project Location is always contained within Project Site.

Long Lake Solar Project Noise Assessment Study Report
H334844-0000-07-124-0301, Rev.1, Page 8
© Hatch 2013/08
Table 4.1 Point of Reception at 4.5 m Noise Impact from Individual Noise Sources of Long Lake Solar Project
Source ID
Noise Receptor ID 7 8 9
Distance (m)
Leq Sound Level (dBA)
Distance (m)
Leq Sound Level (dBA)
Distance (m)
Leq Sound Level (dBA)
Sub 889.5 21.9 285.6 32.8 277.6 33.1
Inv1 864.5 19.6 205.5 33.0 425.9 26.6
Inv2 969.7 18.4 358.3 28.2 624.3 22.9
Inv3 717.4 21.5 239.3 31.7 552.0 24.1
Inv4 867.6 19.6 434.3 26.4 747.1 21.1
Inv5 691.4 21.9 498.3 25.1 790.0 20.5
Inv6 512.4 24.8 373.5 27.8 627.0 22.9
Inv7 358.2 28.2 334.7 28.8 493.5 25.2
Trans1 859.8 12.6 201.2 26.4 425.2 19.7
Trans2 965.6 11.4 356.2 21.3 624.0 15.9
Trans3 713.7 14.6 241.7 24.8 554.1 17.1
Trans4 864.7 12.6 435.9 19.4 748.8 14.1
Trans5 694.1 14.8 495.0 18.2 787.5 13.5
Trans6 515.8 17.8 368.9 21.0 623.8 15.9
Trans7 362.8 21.1 329.2 22.0 489.2 18.3
5. Mitigation Measures The analysis indicates that no mitigation measures are necessary to meet the MOE requirement of 40 dBA for all POR.
6. Impact Assessment The purpose of the acoustic Assessment report is to demonstrate that the facility is in compliance with the noise performance limits. The Project will be located in a Class 3 Area, based on the classification defined in Publication NPC-232 by the MOE. Class 3 area means a rural area with an acoustical environment that is dominated by natural sounds, with little or no traffic noise, such as an agricultural area.
Table 6.1 shows the performance limits set by the MOE for Class 3 Areas, according to Publication NPC-232.

Long Lake Solar Project Noise Assessment Study Report
H334844-0000-07-124-0301, Rev.1, Page 9
© Hatch 2013/08
Table 6.1 Performance Limits (One-Hour Leq) by Time of Day for Class 3 Areas
Time of Day One Hour Leq (dBA) Class 3 Area
07:00 to 19:00 45.0
19:00 to 23:00 40.0
23:00 to 07:00 40.0
The solar facility will be operating during the daylight hours, that is, between 07:00 and 19:00 during most days of the year. However, in the summer months the sun may shine before 07:00 or until past 19:00. As such, during the summer the facility will be operating at the time when the applicable performance limit changes from 45 dBA to 40 dBA. Also, the transformers remain energized at night. In order to account for this, the study assumes that the facility will be operating 24 hours and compares the impact from the facility with the 40-dBA limit. In reality, the cooling fans will not be in operation at night.
For this study, the overall ground attenuation coefficient was estimated to be 0.7. Appendix D includes a list of all the parameters used in the CADNA-A model to predict the sound pressure levels at the POR.
The modelling does not consider the effect of the solar panels on the predicted sound pressure levels at the points of reception. The solar panels may act as barriers to further reduce noise at the POR.
6.1 Compliance with Performance Limits Table 6.2 presents the predicted sound pressure levels for the POR located within 1 km from the Project Site. Sound pressure contours at 4.5-m and 1.5-m are available in Figure C.1 and Figure C.2. Appendix D includes a detailed calculation log of the representative POR with the highest sound pressure level.
Effect of the noise emissions at the Noise Receptors was also accessed by intersecting the 40-dBA sound pressure contours calculated at 1.5-m above ground with 30-m radius circles placed around the Noise Receptor centers (Figure C.2). The results show that none of the 30-m radius zones are affected by the noise emissions.

Long Lake Solar Project Noise Assessment Study Report
H334844-0000-07-124-0301, Rev.1, Page 10
© Hatch 2013/08
Table 6.2 Calculated Sound Pressure Levels at POR within 1 km of Long Lake Solar Project (Shaded rows correspond to representative POR) Existing = Existing dwelling, Vacant = Vacant Lot. The performance limit is 40.0-dBA.
Noi
se R
ecep
tor
ID
Des
crip
tion
Soun
d Pr
essu
re
Leve
l (dB
A)
Perf
orm
ance
Li
mit
(dBA
)
POR
Hei
ght (
m)
Min
dis
tanc
e to
So
urce
(m)
POR UTM Coordinates NAD 83 Zone 17 (m)
X Y
1 Vacant 23.8 40.0 4.5 1203 477811.8 5443763.9
2 Vacant 25.6 40.0 4.5 1008 477980.0 5443593.6
3 Existing 28.8 40.0 4.5 679 478319.8 5443635.5
4 Existing 28.3 40.0 4.5 704 478324.8 5443739.5
5 Existing 28.3 40.0 4.5 697 478339.8 5443757.5
6 Vacant 30.1 40.0 4.5 566 478433.2 5443623.4
7 Vacant 32.9 40.0 4.5 358 478709.6 5443720.3
8 Existing 39.8 40.0 4.5 201 479315.6 5443455.5
9 Vacant 36.1 40.0 4.5 278 479395.3 5443758.5
10 Vacant 34.4 40.0 4.5 304 479825.0 5443738.7
11 Vacant 30.4 40.0 4.5 532 480081.5 5443740.3
12 Existing 27.0 40.0 4.5 872 480085.8 5442506.5
13 Existing 23.4 40.0 4.5 1207 480110.8 5444640.5
14 Existing 23.7 40.0 4.5 1267 480156.7 5442064.9
15 Existing 23.0 40.0 4.5 1245 480205.8 5444632.5
16 Existing 25.7 40.0 4.5 1006 480222.5 5442454.5
17 Existing 22.9 40.0 4.5 1361 480419.8 5442149.5
The results of this study show that all POR are compliant with MOE guidelines based on the performance limit of 40 dBA.

Long Lake Solar Project Noise Assessment Study Report
H334844-0000-07-124-0301, Rev.1, Page 11
© Hatch 2013/08
7. Conclusions and Recommendations For the Long Lake Solar Project, the sound pressure levels at the POR have been estimated using the CADNA-A model, based on ISO 9613-2. No mitigations are required for the Project operation.
Based on the results obtained in this study, it is concluded that the sound pressure levels at the POR, resulting from the Long Lake Solar Project operation, will be below MOE requirements for Class 3 areas of 40 dBA at all times.


Long Lake Solar Project Noise Assessment Study Report
H334844-0000-07-124-0301, Rev.1, Page 13
© Hatch 2013/08
9. References Ontario Regulation 359/09. Environmental Protection Act. Renewable Energy Approvals Under Part V.0.1 of the Act.
Ontario Regulation 521/10 made under Environmental Protection Act amending O.Reg. 359/09.
Ministry of the Environment (MOE). 2004. Basic Comprehensive Certificates of Approval (Air) – User Guide (Appendix A). Environmental Assessment and Approvals Branch.
Handbook of Noise and Vibration Control; Malcolm J. Crocker, 2007.
Ministry of the Environment (MOE). 1997. Noise Assessment Criteria in Land Use Planning. Publication LU-131. Ontario Ministry of the Environment. 12 pp + Annex.
MOE. 1995. Sound Level Limits for Stationary Sources in Class 1 & 2 Areas (Urban). Publication NPC-205. Ontario Ministry of the Environment. 6 pp + Annex.
MOE. 1995. Sound Level Limits for Stationary Sources in Class 3 Areas (Rural). Publication NPC-232. Ontario Ministry of the Environment. 8 pp + Annex.
NEMA. 2000. Standards Publication No. TR 1-1993 (R2000): Transformers, Regulators and Reactors. National Electrical Manufacturers Association.
International Organization for Standardization (ISO). Standard 1996-1: Description, Measurement and Assessment of Environmental Noise – Part 1: Basic Quantities and Assessment Procedures.
International Organization for Standardization (ISO). Standard 1913-2: Acoustics – Attenuation of sound during propagation outdoors – Part 2: General Method of Calculation.

H334844-0000-07-124-0301, Rev. 1
© Hatch 2013/08
Appendix A
Land Use Zoning Designation Plan and Area Location Plan

!.
!.
!.
G
G
G
G
G
G
G
G
Syndicate Lake
Fow
lerLake
Fowler Cre
ek
Kennedy Lake
Cluster 7
Cluster 6
Cluster 5
Cluster 4
Cluster 3
Cluster 2
Cluster 1
Sub
5
4
3
17
16
15
14
13
12
62
11110
9
8
7
27
0
280
260
270
27
0
26
0
270
280
27
0
27
0
280
270
270
26
0
260
HW
Y 6
68
CONC 8 & 9 CLUTE
477500 478000 478500 479000 479500 480000 480500 481000
54
41
50
05
44
20
00
54
42
50
05
44
30
00
54
43
50
05
44
40
00
54
44
50
0
0 300 600150Meters N
!
!
!
!(
Timmins
Cochrane
Iroquois Falls
Smooth Rock Falls
Lake Abitibi
Night Hawk Lake
Kenogamissi Lake
Ivanhoe Lake ��101
��11
��144
��101
��101
��11
Project Site
Path: P:\NORTHLAND\333751\DATABASES\334844\GIS\LongLake\LongLake_Noise_A1.mxd Date Saved: 8/8/2013 8:57:02 AM
Zoning Designation Plan
Northland Power Solar Long Lake L.P.
Long Lake Solar Project
Figure A.1
Notes:1. Produced by Hatch under licence from Ontario Ministry of Natural Resources, Copyright (c) Queens Printer 2011.2. Spatial referencing UTM NAD 83.3. Due to scale limitations, the three-part inverter unit isrepresented as a single point and referred to as 'cluster'.4. The project is within Cochrane - Unorganized North Part.
1:14,000
Legend
G Inverter Cluster
G Substation Transformer
Noise Receptor - Existing
Noise Receptor - Vacant
!. Representative Noise Receptor
Road
Topographic Contour (5m interval)
Watercourse
Parcel
Project Site
1000 m from Project Site
Waterbody
Cluster #
SUB
#
#
#
Zoning
RU Rural
RURU
RU
RU
RU
RU
RU
RU
RU

G
G
G
G
G
G
G
G
!.
!.
!.
Syndicate Lake
Fow
lerLake
Fowler Cre
ek
Kennedy Lake
Cluster 7
Cluster 6
Cluster 5
Cluster 4
Cluster 3
Cluster 2
Cluster 1
Sub
5
4
3
17
16
15
14
13
12
62
11110
9
8
7
27
0
280
260
270
27
0
26
0
270
280
27
0
27
0
280
270
270
26
0
260
HW
Y 6
68
CONC 8 & 9 CLUTE
477500 478000 478500 479000 479500 480000 480500 481000
54
41
50
05
44
20
00
54
42
50
05
44
30
00
54
43
50
05
44
40
00
54
44
50
0
0 300 600150Meters N
!
!
!
!(
Timmins
Cochrane
Iroquois Falls
Smooth Rock Falls
Lake Abitibi
Night Hawk Lake
Kenogamissi Lake
Ivanhoe Lake ��101
��11
��144
��101
��101
��11
Project Site
Path: P:\NORTHLAND\333751\DATABASES\334844\GIS\LongLake\LongLake_Noise_A2.mxd Date Saved: 8/8/2013 11:08:37 AM
Scaled Area Location Plan
Northland Power Solar Long Lake L.P.
Long Lake Solar Project
Figure A.2
Notes:1. Produced by Hatch under licence from Ontario Ministry of Natural Resources, Copyright (c) Queens Printer 2011.2. Spatial referencing UTM NAD 83.3. Due to scale limitations, the three-part inverter unit isrepresented as a single point and referred to as 'cluster'.
1:14,000
Legend
G Inverter Cluster
G Substation Transformer
Noise Receptor - Existing
Noise Receptor - Vacant
!. Representative Noise Receptor
Road
Topographic Contour (5m interval)
Watercourse
Parcel
Project Site
1000 m from Project Site
Waterbody
Wooded Area
Cluster #
SUB
#
#
#

H334844-0000-07-124-0301, Rev. 1
© Hatch 2013/08
Appendix B Noise Sources

H334844-0000-07-124-0301, Rev. 1
© Hatch 2013/08
Table B.1 Point Sources from Long Lake Solar Project Used in CADNA-A, Includes Tonality Penalty of 5.0-dBA
Sour
ce ID
Des
crip
tion
Spec
tra
ID
Tota
l sou
nd p
ower
le
vel (
dBA
)
Cor
rect
ion
(dBA
)
Hei
ght (
m)
Coordinates, UTM NAD 83 Zone 17
(m)
X Y Z
Sub 27.6-kV/115-kV/10-MVA substation transformer T115kV_10MVA 93.4 5.0 3.60 479583.5 5443554.4 3.60
Inv1 Two Sunny Central 800CP inverters at Cluster 1 SMA_SC800CPX2 91.3 5.0 2.60 479487.2 5443342.6 2.60
Inv2 Two Sunny Central 800CP inverters at Cluster 2 SMA_SC800CPX2 91.3 5.0 2.60 479487.2 5443141.0 2.60
Inv3 Two Sunny Central 800CP inverters at Cluster 3 SMA_SC800CPX2 91.3 5.0 2.60 479233.8 5443230.6 2.60
Inv4 Two Sunny Central 800CP inverters at Cluster 4 SMA_SC800CPX2 91.3 5.0 2.60 479233.8 5443029.0 2.60
Inv5 Two Sunny Central 800CP inverters at Cluster 5 SMA_SC800CPX2 91.3 5.0 2.60 478982.5 5443085.0 2.60
Inv6 Two Sunny Central 800CP inverters at Cluster 6 SMA_SC800CPX2 91.3 5.0 2.60 478982.5 5443286.6 2.60
Inv7 Two Sunny Central 800CP inverters at Cluster 7 SMA_SC800CPX2 91.3 5.0 2.60 478982.5 5443488.2 2.60
Trans1 360-V/27.6-kV/1.6-MVA cluster transformer at Cluster 1
T27.6kV_1.6MVA 84.1 5.0 2.58 479481.7 5443342.1 2.58
Trans2 360-V/27.6-kV/1.6-MVA cluster transformer at Cluster 2
T27.6kV_1.6MVA 84.1 5.0 2.58 479481.7 5443140.5 2.58
Trans3 360-V/27.6-kV/1.6-MVA cluster transformer at Cluster 3
T27.6kV_1.6MVA 84.1 5.0 2.58 479228.3 5443230.1 2.58
Trans4 360-V/27.6-kV/1.6-MVA cluster transformer at Cluster 4
T27.6kV_1.6MVA 84.1 5.0 2.58 479228.3 5443028.5 2.58
Trans5 360-V/27.6-kV/1.6-MVA cluster transformer at Cluster 5
T27.6kV_1.6MVA 84.1 5.0 2.58 478988.0 5443084.5 2.58
Trans6 360-V/27.6-kV/1.6-MVA cluster transformer at Cluster 6
T27.6kV_1.6MVA 84.1 5.0 2.58 478988.0 5443286.1 2.58
Trans7 360-V/27.6-kV/1.6-MVA cluster transformer at Cluster 7
T27.6kV_1.6MVA 84.1 5.0 2.58 478988.0 5443487.7 2.58

H334844-0000-07-124-0301, Rev. 1
© Hatch 2013/08
Table B.2 Frequency Spectra Used for Modelling the Noise Sources, Not Including Tonality Penalty
Spectra ID Octave Spectrum (dBA)
31.5 63 125 250 500 1000 2000 4000 8000 A lin SMA_SC800CPX2 63.1 73.9 80.5 82.3 78.7 74.1 65.0 72.7 86.3 95.0 T27.6kV_1.6MVA 36.3 55.5 67.6 70.1 75.5 72.7 68.9 63.7 54.6 79.1 87.7 T115kV_10MVA 45.6 64.8 76.9 79.4 84.8 82 78.2 73 63.9 88.4 97

Efficient•Fullnominalpowerat
ambienttemperaturesupto50°C•10%additionalpowerfor
constantoperationatambienttemperaturesupto25°C
Sunny CEntral 720CP / 760CP / 800CP High performance as standard
ThecompletelynewdesignoftheSunnyCentralCPseriessavesyourealmoney.Thecompactandweatherproofenclosureiseasytoloadandtransportandcanbeinstalledalmostanywhere–thereisnoneedforheavyprotectiveconcretesubstationsanylonger.TheinnovativecoolingconceptOptiCoolallowsittooperateatfullnominalpowerwithambienttemperaturesupto50°C.Withthepowerfulgridmanagementfunctionsyouareperfectlypreparedfortoday’sutilityrequirementsaswellasthosestilltocome.Theintelligentpowermanagementisthemostimportantfeature:incontinuousoperation,theSunnyCentral800CPcanfeed880kVAtothegridatambienttemperaturesofupto25°C–that’s10%morethantheratednominalpower.
Flexible•Powerfulgridmanagement
functions(includingLVRT)•DCvoltagerangeconfigurable
reliable•Easyandsafeinstallationduetoa
separateconnectionarea•Optional:extendedinputvoltage
rangeupto1,100V
Economic•Directdeploymentinthefielddue
tooutdoorenclosure•Simplifiedshippingwithout
concretesubstation
Sunny CEntral 720CP / 760CP / 800CPSC
720
CP-1
0 / S
C 76
0CP-
10 /
SC 8
00CP
-10
technical dataSunny Central
720CPSunny Central
760CPSunny Central
800CPInput DataMPPvoltagerange 515V–820V3)5) 545V–820V3)5) 570V–820V3)5)Max.DCvoltage 1000V/1100V1)OptionalMax.DCcurrent 1400A 1400A 1400ANumberofDCinputs 9fusedinputsOutput ValuesNominalACoutput@50°C 720kVA 760kVA 800kVAContinuousACpower@25°C 792kVA 836kVA 880kVAMax.ACcurrent 1411A 1411A 1411ANominalAC-current 1283A 1283A 1283ANominalAC-voltage±10% 324V 342V 360VACgridfrequency50Hz ● ● ●ACgridfrequency60Hz ● ● ●Powerfactor(cosϕ) 0.9leading...0.9laggingMax.THD <3% <3% <3%Power consumptionInternalconsumptioninoperation <1500W4) <1500W4) <1500W4)Standbyconsumption <100W <100W <100WExternalauxiliaryvoltage 3x230V,50/60Hz 3x230V,50/60Hz 3x230V,50/60HzDimensions and Weight Dimensions(W/H/D)inmm 2562/2279/956 2562/2279/956 2562/2279/956Weight 1800kg 1800kg 1800kgEfficiency 2)
Max.efficiency 98.6% 98.6% 98.6%EuroETA 98.4% 98.4% 98.4%CEC-eta 98.4% 98.4% 98.4%Protection rating and ambient ConditionsProtectionrating(asperIEC60529) IP54 IP54 IP54Protectionrating(asperIEC60721-3-3)Ambientconditions:fixedlocation,withprotectionagainstwindandweather
•Classificationofchemicallyactivesubstances:3C2•Classificationofmechanicallyactivesubstances:3S2
Operationtemperaturerange –20°C...+50°C –20°C...+50°C –20°C...+50°CRel.humidity 15%...95% 15%...95% 15%...95%Freshairconsumption 3000m3/h 3000m3/h 3000m3/hMax.altitudeabovesealevel 2000m 2000m 2000m

Sunny Central 720CP
Sunny Central 760CP
Sunny Central 800CP
1)StartupatDCvoltage<1000V2)Efficiencymeasuredwithoutinternalpowersupply3)FurtherACvoltages,DCvoltagesandpowerclassescanbeconfigured(FordetailedinformationseeTechnicalInformation„Innovations_CP“atwww.SMA.de)4) Internalconsumptionatnominalpower5)At1.05UAC,nomandcosϕ=16)Withcompletedynamicgridsupport
FeaturesSunnyWebBox ● ● ●Communication Ethernet
(opticalfiberoptional)Ethernet
(opticalfiberoptional)Ethernet
(opticalfiberoptional)CommunicationwithSunnyString-Monitor RS485 RS485 RS485LCDgraphicdisplay ● ● ●Enclosurecolor RAL9016 RAL9016 RAL9016Colorofbase RAL7005 RAL7005 RAL7005Colorofroof RAL7004 RAL7004 RAL7004Groundfaultmonitoring/insulationmonitoring ● ● ●CircuitbreakerACside ● ● ●MotordrivenloaddisconnectionswitchonDCside ● ● ●ACovervoltageprotector ● ● ●DCovervoltageprotector ● ● ●Overvoltageprotectorsforauxiliarysupply ● ● ●Certificates / ListingsEMC EN61000-6-2EN61000-6-4CEconformity ● ● ●BDEW-MSRL/FGW/TR86) ● ● ●RD1633/2000 ● ● ●Arrêtédu23/04/08 ● ● ●
●Standardfeatures❍Optionalfeatures—NotavailableTypename SC720CP-10 SC760CP-10 SC800CP-10

SMa Solar technology aGwww.SMa-Solar.com
limited Dynamic Grid SupportTheinvertercontinuestofeedtothegridaftershorttermvoltagedrops–aslongasthegridvoltageiswithinadefinedvoltagewindow.
Dynamic Grid SupportLVRT(Low-VoltageRideThrough):Theinverterstaysconnectedtothegridduringvoltagedropsandsupportsthegridbyfeedingreactivepower.
remote controlled power reduction in case of grid overloadInordertoavoidshort-termgridoverload,thegridoperatorpresetsanominalactivepowervaluewhichtheinverterwillimplementwithin60seconds.ThenominalvalueistransmittedtotheinvertersviaaripplecontrolreceiverincombinationwiththeSMAPowerReducerBox.Typicallimitvaluesare100,60,30or0percentofthenominalpower.
Frequency-dependent control of active powerAsofagridfrequencyof50.2Hz,theinverterautomaticallyreducesthefed-inofactivepoweraccordingtoadefinablecharacteristiccurvewhichtherebycontributestothestabilizationofthegridfrequency.
Static voltage support based on reactive powerTostabilizethegridvoltage,SMAinvertersfeedreactivepower(leadingorlagging)intothegrid.Threedifferentmodesareavailable:
a) Fixed definition of the reactive power by the grid operatorThegridoperatordefinesafixedreactivepowervalueorafixeddisplacementfactorbetweencos(ϕ)leading=0.90andcos(ϕ)lagging=0.90.
b) Definition of a dynamic setpoint of the reactive power by the utility operatorThegridoperatordefinesadynamicdisplacementfactor-anyvaluebetweencos(ϕ)leading=0.90undcos(ϕ)lagging=0.90.Itistransmittedeitherthroughacommunicationunit theevaluationcane.g.beevaluatedandprocessedbytheSMAPowerReducerBox.
c) Control of the reactive power over a characteristic curveThereactivepoweror thephaseshift iscontrolledbyapre-definedcharacteristiccurve–dependingontheactivepowerfedintothegridorthegridvoltage.
POWErFul GrID ManaGEMEnt FunCtIOnS
SC80
0CP-D
EN10
2020
SM
Aan
dSu
nnyC
entra
larere
gister
edtrad
emarksofS
MA
Solar
Tech
nolog
yAG.T
exta
ndill
ustra
tionsre
flect
thecu
rrent
state
ofth
etec
hnolo
gyatth
etim
eofpub
lication
.Tec
hnica
lmod
ification
sreserve
d.N
olia
bilityfo
rprin
tingerrors.Pr
inted
onch
lorine
-freepa
per.

3505,2
11'6,00"
8839,229'0,00"
6141,720'1,80"
Layout enclosure
1 2
J
I
H
G
F
53 4 6 7
E
D
C
B
A
1 2 53 4 6 7
128 9 10 11 13 14
J
I
H
G
F
128 9 10 11
E
D
C
13 14
B
A
Erstellt mit SolidWorks
A2Freigabe
Bl. / o.P.
BlattPage
EDV-Nr.:
Z-Nr.:D.-No.:
NameDatum / Date
Verwendbar für: / To be used for:
NormGepr.
NameDatumRev. Urspr.: / Origin.:
Bearb.
SMA SKIDMihelic25.02.2011
11
SMA Solar Technology AGSonnenallee 1
34266 NiestetalTel.: +49 561 9522-0
Wei
terg
abe
sow
ie V
ervi
elfä
ltigu
ng d
iese
r Unt
erla
ge,
Verw
ertu
ng u
nd M
ittei
lung
ihre
s Inh
alte
s nic
ht g
esta
ttet
, so
wei
t nic
ht a
usdr
ückl
ich
zuge
stan
den.
Zuw
ider
hand
lung
en v
erpf
licht
et zu
Sch
aden
ersa
tz.
Alle
Rec
hte
für d
en F
all d
er P
aten
tert
eilu
ng o
der G
ebra
uchs
mus
tere
intr
agun
g vo
rbeh
alte
n.
This
docu
men
t may
not
be
copi
ed,
dist
ribut
ed n
or co
pies
and
its c
onte
nts m
ay n
ot b
e ut
ilize
d no
r disc
lose
d an
yone
unl
ess e
xpre
ssly
per
mitt
ed.
Anyo
ne v
iola
ting
this
regu
latio
n w
ill b
e lia
ble
for a
ny d
amag
es.
All r
ight
s res
erve
d in
cas
e of
gra
nt o
f pat
ent o
r pat
ent r
egist
ratio
n.
all dimensions and tolerances are in millimeters [feet / inches]alle Maß- und Toleranzangaben sind in mm [feet / inches]
Name :

1066
,83'
6,0"
1066,83'6,0"
min
. 4'
min. 4 '
min 3'
956
3'1,
6"2557,58'4,7"
1457,64'9,4"
10083'3,7"
606,
51'
11,9
"
1704,15'7,1"
1683
,95'
6,3"
1911,56'3,3"
76,23
114,
34,
5
304,81'0,0"
8839,229'0,0"
3505
,211
'6,0
"
114,
34,
5
304,81'0,0"
114,
34,
5
Body Inverter
Clearance
1 2
J
I
H
G
F
53 4 6 7
E
D
C
B
A
1 2 53 4 6 7
128 9 10 11 13 14
J
I
H
G
F
128 9 10 11
E
D
C
13 14
B
A
Erstellt mit SolidWorks
A2Freigabe
Bl. / o.P.
BlattPage
EDV-Nr.:
Z-Nr.:D.-No.:
NameDatum / Date
Verwendbar für: / To be used for:
NormGepr.
NameDatumRev. Urspr.: / Origin.:
Bearb.
SMA SKIDMihelic25.02.2011
11
SMA Solar Technology AGSonnenallee 1
34266 NiestetalTel.: +49 561 9522-0
Wei
terg
abe
sow
ie V
ervi
elfä
ltigu
ng d
iese
r Unt
erla
ge,
Verw
ertu
ng u
nd M
ittei
lung
ihre
s Inh
alte
s nic
ht g
esta
ttet
, so
wei
t nic
ht a
usdr
ückl
ich
zuge
stan
den.
Zuw
ider
hand
lung
en v
erpf
licht
et zu
Sch
aden
ersa
tz.
Alle
Rec
hte
für d
en F
all d
er P
aten
tert
eilu
ng o
der G
ebra
uchs
mus
tere
intr
agun
g vo
rbeh
alte
n.
This
docu
men
t may
not
be
copi
ed,
dist
ribut
ed n
or co
pies
and
its c
onte
nts m
ay n
ot b
e ut
ilize
d no
r disc
lose
d an
yone
unl
ess e
xpre
ssly
per
mitt
ed.
Anyo
ne v
iola
ting
this
regu
latio
n w
ill b
e lia
ble
for a
ny d
amag
es.
All r
ight
s res
erve
d in
cas
e of
gra
nt o
f pat
ent o
r pat
ent r
egist
ratio
n.
all dimensions and tolerances are in millimeters [feet / inches]alle Maß- und Toleranzangaben sind in mm [feet / inches]
Name :

H334844-0000-07-124-0301, Rev. 1
© Hatch 2013/08
Figure B.1 SC800CP Inverter Sound Power Level as Provided by SMA. Note that the Header in the Table above Represents Various Inverter Models of CS###CP Series.


H334844-0000-07-124-0301, Rev. 1
© Hatch 2013/08
Figure B.3 Sound Power Level Calculation for 27.6-kV/115-kV/10-MVA Substation Transformer.
Estimated Frequency Spectra for Transformers
Transformer - 115kV/10MVA
From Handbook of Noise and Vibration Control (Crocker, 2007, page 1335-1336, Eq. 18 and Table 20)
Average Lp 66 dB Guaranteed sound pressure level provided by transformer manufacturerEstimated surface area 100.0 m 2̂ Estimated based on similar transformer dimensions and IEEE C57.90-2010 standard
Correction factors are in dBFreq. (Hz) 31 63 125 250 500 1000 2000 4000 8000C1 -11.0 -5.0 -3.0 -8.0 -8.0 -14.0 -19.0 -24.0 -31.0C2 -11 -2 3 -2 -2 -11 -19 -24 -31C3 -11 -2 3 2 2 -4 -9 -14 -21
Sound Power Level calculated as Lw=Average LpA + 10*log(Estimated surface area) + C + 10Freq. (Hz) 31 63 125 250 500 1000 2000 4000 8000 Combined [dB]C1 based [dB] 85.0 91.0 93.0 88.0 88.0 82.0 77.0 72.0 65.0 97.0C2 based [dB] 85.0 94.0 99.0 94.0 94.0 85.0 77.0 72.0 65.0 102.1C3 based [dB] 85.0 94.0 99.0 98.0 98.0 92.0 87.0 82.0 75.0 104.1
Resulting A-weighted sound power level
Freq. (Hz) A-WeightC1 based
[dBA]C2 based
[dBA]C2 based
[dBA]31 -39.4 45.6 54.6 59.663 -26.2 64.8 67.8 67.8 Used in the study
125 -16.1 76.9 82.9 82.9250 -8.6 79.4 85.4 89.4500 -3.2 84.8 90.8 94.8
1000 0 82.0 85.0 92.02000 1.2 78.2 78.2 88.24000 1 73.0 73.0 83.08000 -1.1 63.9 63.9 73.9
LwA [dBA] 88.4 93.3 98.2
NotesOutdoors, indoors in mechanical room over 140 m3
IndoorsSerious Noise Problems

H334844-0000-07-124-0301, Rev. 1
© Hatch 2013/08
Figure B.4 Sound Power Level Calculation for SMA Sunny Central 800CP, 100% LOAD.
H334844-0000-07-124-0301, Rev. 1
© Hatch 2013/08
Figure B.5 Sound Power Level Calculation for 360-V/27.6-kV/1.6-MVA Cluster Transformer.
Estimated Frequency Spectra for Transformers
Transformer - 27.6kV/1.6MVA
From Handbook of Noise and Vibration Control (Crocker, 2007, page 1335-1336, Eq. 18 and Table 20)
Average Lp 61 dB Based on NEMA TR1-1993 (R2000), Table 0-2Estimated surface area 36.8 m 2̂ Estimated based on similar transformer dimensions and IEEE C57.90-2010 standard
Correction factors are in dBFreq. (Hz) 31 63 125 250 500 1000 2000 4000 8000C1 -11.0 -5.0 -3.0 -8.0 -8.0 -14.0 -19.0 -24.0 -31.0C2 -11 -2 3 -2 -2 -11 -19 -24 -31C3 -11 -2 3 2 2 -4 -9 -14 -21
Sound Power Level calculated as Lw=Average LpA + 10*log(Estimated surface area) + C + 10Freq. (Hz) 31 63 125 250 500 1000 2000 4000 8000 Combined [dB]C1 based [dB] 75.7 81.7 83.7 78.7 78.7 72.7 67.7 62.7 55.7 87.7C2 based [dB] 75.7 84.7 89.7 84.7 84.7 75.7 67.7 62.7 55.7 92.7C3 based [dB] 75.7 84.7 89.7 88.7 88.7 82.7 77.7 72.7 65.7 94.8
Resulting A-weighted sound power level
Freq. (Hz) A-WeightC1 based
[dBA]C2 based
[dBA]C2 based
[dBA]31 -39.4 36.3 45.3 50.363 -26.2 55.5 58.5 58.5 Used in the study
125 -16.1 67.6 73.6 73.6250 -8.6 70.1 76.1 80.1500 -3.2 75.5 81.5 85.5
1000 0 72.7 75.7 82.72000 1.2 68.9 68.9 78.94000 1 63.7 63.7 73.78000 -1.1 54.6 54.6 64.6
LwA [dBA] 79.0 84.0 88.8
NotesOutdoors, indoors in mechanical room over 140 m3
IndoorsSerious Noise Problems

H334844-0000-07-124-0301, Rev. 1
© Hatch 2013/08
Appendix C
Noise Maps from CADNA-A

G
G
G
G
G
G
G
G
!.
!.
!.
Syndicate Lake
Fow
lerLake
Fowler Cre
ek
Kennedy Lake
Cluster 7
Cluster 6
Cluster 5
Cluster 4
Cluster 3
Cluster 2
Cluster 1
Sub
5
4
3
17
16
15
14
13
12
62
11110
9
8
7
HW
Y 6
68
CONC 8 & 9 CLUTE
477500 478000 478500 479000 479500 480000 480500 481000
54
41
50
05
44
20
00
54
42
50
05
44
30
00
54
43
50
05
44
40
00
54
44
50
0
0 300 600150Meters N
!
!
!
!(
Timmins
Cochrane
Iroquois Falls
Smooth Rock Falls
Lake Abitibi
Night Hawk Lake
Kenogamissi Lake
Ivanhoe Lake ��101
��11
��144
��101
��101
��11
Project Site
Path: P:\NORTHLAND\333751\DATABASES\334844\GIS\LongLake\LongLake_Noise_C1.mxd Date Saved: 8/8/2013 11:10:09 AM
Noise Contours at 4.5 m
Northland Power Solar Long Lake L.P.
Long Lake Solar Project
Figure C.1
Notes:1. Produced by Hatch under licence from Ontario Ministry of Natural Resources, Copyright (c) Queens Printer 2011.2. Spatial referencing UTM NAD 83.3. Due to scale limitations, the three-part inverter unit isrepresented as a single point and referred to as 'cluster'.
1:14,000
Legend
G Inverter Cluster
G Substation Transformer
Noise Receptor - Existing
Noise Receptor - Vacant
!. Representative Noise Receptor
Road
Watercourse
Parcel
Project Site
1000 m from Project Site
Wetland
Waterbody
Wooded Area
Cluster #
SUB
#
#
#
Sound Pressure Level (dBA)
40.0
- 41
.041
.1 -
44.0
44.1
- 47
.047
.1 -
49.0
49.1
- 52
.0>
52.1

G
G
G
G
G
G
G
G
!.
!.
!.
Cluster 7
Cluster 6
Cluster 5
Cluster 4
Cluster 3
Cluster 2
Cluster 1
Sub
5
4
36
10
9
8
7
478500 478750 479000 479250 479500 479750 480000
54
42
50
05
44
27
50
54
43
00
05
44
32
50
54
43
50
05
44
37
50
54
44
00
0
0 150 30075Meters N
!
!
!
!(
Timmins
Cochrane
Iroquois Falls
Smooth Rock Falls
Lake Abitibi
Night Hawk Lake
Kenogamissi Lake
Ivanhoe Lake ��101
��11
��144
��101
��101
��11
Project Site
Path: P:\NORTHLAND\333751\DATABASES\334844\GIS\LongLake\LongLake_Noise_C2.mxd Date Saved: 8/8/2013 11:12:26 AM
Noise Contours at 1.5 m
Northland Power Solar Long Lake L.P.
Long Lake Solar Project
Figure C.2
Notes:1. Produced by Hatch under licence from Ontario Ministry of Natural Resources, Copyright (c) Queens Printer 2011.2. Spatial referencing UTM NAD 83.3. Due to scale limitations, the three-part inverter unit isrepresented as a single point and referred to as 'cluster'.
1:6,000
Legend
G Inverter Cluster
G Substation Transformer
Noise Receptor - Existing
Noise Receptor - Vacant
!. Representative Noise Receptor
Road
Watercourse
Parcel
Project Site
30 m from Noise Receptor
Waterbody
Wooded Area
Cluster #
SUB
#
#
#
Sound Pressure Level (dBA)
40.0
- 41
.041
.1 -
44.0
44.1
- 47
.047
.1 -
49.0
49.1
- 52
.0>
52.1

H334844-0000-07-124-0301, Rev. 1
© Hatch 2013/08
Appendix D
CADNA-A Sample Calculations

Configuration
Parameter Value
General
Country (user defined)
Max. Error (dB) 0.00
Max. Search Radius (m) 3000.00
Min. Dist Src to Rcvr 0.00
Partition
Raster Factor 0.50
Max. Length of Section (m) 1000.00
Min. Length of Section (m) 1.00
Min. Length of Section (%) 0.00
Proj. Line Sources On
Proj. Area Sources On
Ref. Time
Reference Time Day (min) 960.00
Reference Time Night (min) 480.00
Daytime Penalty (dB) 0.00
Recr. Time Penalty (dB) 0.00
Night-time Penalty (dB) 0.00
DTM
Standard Height (m) 0.00
Model of Terrain Triangulation
Reflection
max. Order of Reflection 1
Search Radius Src 100.00
Search Radius Rcvr 100.00
Max. Distance Source - Rcvr 1000.00 1000.00
Min. Distance Rvcr - Reflector 1.00 1.00
Min. Distance Source - Reflector 0.10
Industrial (ISO 9613)
Lateral Diffraction some Obj
Obst. within Area Src do not shield On
Screening Excl. Ground Att. over Barrier
Dz with limit (20/25)
Barrier Coefficients C1,2,3 3.0 20.0 0.0
Temperature (°C) 10
rel. Humidity (%) 70
Ground Absorption G 0.70
Wind Speed for Dir. (m/s) 3.0
Roads (RLS-90)
Strictly acc. to RLS-90
Railways (Schall 03)
Strictly acc. to Schall 03 / Schall-Transrapid
Aircraft (???)
Strictly acc. to AzB

Receiver Name: Existing ID: 8.0 X: 479315.61 Y: 5443455.54 Z: 4.50
Point Source, ISO 9613, Name: ''Sub'', ID: ''Sub''
Nr. X Y Z Refl. Freq. LxT LxN K0 Dc Adiv Aatm Agr Afol Ahous Abar Cmet RL LrT LrN
(m) (m) (m) (Hz) dB(A) dB(A) (dB) (dB) (dB) (dB) (dB) (dB) (dB) (dB) (dB) (dB) dB(A) dB(A)
1 479583.51 5443554.44 3.60 0 32 50.6 50.6 0.0 0.0 60.1 0.0 -3.4 0.0 0.0 0.0 0.0 -0.0 -6.1 -6.1
2 479583.51 5443554.44 3.60 0 63 69.8 69.8 0.0 0.0 60.1 0.0 -3.4 0.0 0.0 0.0 0.0 -0.0 13.1 13.1
3 479583.51 5443554.44 3.60 0 125 81.9 81.9 0.0 0.0 60.1 0.1 3.0 0.0 0.0 0.0 0.0 -0.0 18.6 18.6
4 479583.51 5443554.44 3.60 0 250 84.4 84.4 0.0 0.0 60.1 0.3 1.8 0.0 0.0 0.0 0.0 -0.0 22.2 22.2
5 479583.51 5443554.44 3.60 0 500 89.8 89.8 0.0 0.0 60.1 0.6 -1.0 0.0 0.0 0.0 0.0 -0.0 30.1 30.1
6 479583.51 5443554.44 3.60 0 1000 87.0 87.0 0.0 0.0 60.1 1.0 -1.0 0.0 0.0 0.0 0.0 -0.0 26.9 26.9
7 479583.51 5443554.44 3.60 0 2000 83.2 83.2 0.0 0.0 60.1 2.8 -1.0 0.0 0.0 0.0 0.0 -0.0 21.4 21.4
8 479583.51 5443554.44 3.60 0 4000 78.0 78.0 0.0 0.0 60.1 9.4 -1.0 0.0 0.0 0.0 0.0 -0.0 9.6 9.6
9 479583.51 5443554.44 3.60 0 8000 68.9 68.9 0.0 0.0 60.1 33.4 -1.0 0.0 0.0 0.0 0.0 -0.0 -23.6 -23.6
Point Source, ISO 9613, Name: ''Inv1'', ID: ''Inv1''
Nr. X Y Z Refl. Freq. LxT LxN K0 Dc Adiv Aatm Agr Afol Ahous Abar Cmet RL LrT LrN
(m) (m) (m) (Hz) dB(A) dB(A) (dB) (dB) (dB) (dB) (dB) (dB) (dB) (dB) (dB) (dB) dB(A) dB(A)
1 479487.24 5443342.60 2.60 0 63 68.1 68.1 0.0 0.0 57.3 0.0 -3.0 0.0 0.0 0.0 0.0 -0.0 13.8 13.8
2 479487.24 5443342.60 2.60 0 125 78.9 78.9 0.0 0.0 57.3 0.1 2.4 0.0 0.0 0.0 0.0 -0.0 19.1 19.1
3 479487.24 5443342.60 2.60 0 250 85.5 85.5 0.0 0.0 57.3 0.2 3.3 0.0 0.0 0.0 0.0 -0.0 24.8 24.8
4 479487.24 5443342.60 2.60 0 500 87.3 87.3 0.0 0.0 57.3 0.4 -0.5 0.0 0.0 0.0 0.0 -0.0 30.1 30.1
5 479487.24 5443342.60 2.60 0 1000 83.7 83.7 0.0 0.0 57.3 0.8 -0.9 0.0 0.0 0.0 0.0 -0.0 26.6 26.6
6 479487.24 5443342.60 2.60 0 2000 79.1 79.1 0.0 0.0 57.3 2.0 -0.9 0.0 0.0 0.0 0.0 -0.0 20.8 20.8
7 479487.24 5443342.60 2.60 0 4000 70.0 70.0 0.0 0.0 57.3 6.7 -0.9 0.0 0.0 0.0 0.0 -0.0 6.9 6.9
8 479487.24 5443342.60 2.60 0 8000 77.7 77.7 0.0 0.0 57.3 24.0 -0.9 0.0 0.0 0.0 0.0 -0.0 -2.7 -2.7
Point Source, ISO 9613, Name: ''Inv2'', ID: ''Inv2''
Nr. X Y Z Refl. Freq. LxT LxN K0 Dc Adiv Aatm Agr Afol Ahous Abar Cmet RL LrT LrN
(m) (m) (m) (Hz) dB(A) dB(A) (dB) (dB) (dB) (dB) (dB) (dB) (dB) (dB) (dB) (dB) dB(A) dB(A)
1 479487.24 5443141.00 2.60 0 63 68.1 68.1 0.0 0.0 62.1 0.0 -4.2 0.0 0.0 0.0 0.0 -0.0 10.2 10.2
2 479487.24 5443141.00 2.60 0 125 78.9 78.9 0.0 0.0 62.1 0.2 2.7 0.0 0.0 0.0 0.0 -0.0 14.0 14.0
3 479487.24 5443141.00 2.60 0 250 85.5 85.5 0.0 0.0 62.1 0.4 3.0 0.0 0.0 0.0 0.0 -0.0 20.1 20.1
4 479487.24 5443141.00 2.60 0 500 87.3 87.3 0.0 0.0 62.1 0.7 -0.8 0.0 0.0 0.0 0.0 -0.0 25.4 25.4
5 479487.24 5443141.00 2.60 0 1000 83.7 83.7 0.0 0.0 62.1 1.3 -1.3 0.0 0.0 0.0 0.0 -0.0 21.6 21.6
6 479487.24 5443141.00 2.60 0 2000 79.1 79.1 0.0 0.0 62.1 3.5 -1.3 0.0 0.0 0.0 0.0 -0.0 14.8 14.8
7 479487.24 5443141.00 2.60 0 4000 70.0 70.0 0.0 0.0 62.1 11.7 -1.3 0.0 0.0 0.0 0.0 -0.0 -2.6 -2.6
8 479487.24 5443141.00 2.60 0 8000 77.7 77.7 0.0 0.0 62.1 41.9 -1.3 0.0 0.0 0.0 0.0 -0.0 -25.0 -25.0
Point Source, ISO 9613, Name: ''Inv3'', ID: ''Inv3''
Nr. X Y Z Refl. Freq. LxT LxN K0 Dc Adiv Aatm Agr Afol Ahous Abar Cmet RL LrT LrN
(m) (m) (m) (Hz) dB(A) dB(A) (dB) (dB) (dB) (dB) (dB) (dB) (dB) (dB) (dB) (dB) dB(A) dB(A)
1 479233.84 5443230.60 2.60 0 63 68.1 68.1 0.0 0.0 58.6 0.0 -3.3 0.0 0.0 0.0 0.0 -0.0 12.8 12.8
2 479233.84 5443230.60 2.60 0 125 78.9 78.9 0.0 0.0 58.6 0.1 2.5 0.0 0.0 0.0 0.0 -0.0 17.7 17.7
3 479233.84 5443230.60 2.60 0 250 85.5 85.5 0.0 0.0 58.6 0.3 3.2 0.0 0.0 0.0 0.0 -0.0 23.4 23.4
4 479233.84 5443230.60 2.60 0 500 87.3 87.3 0.0 0.0 58.6 0.5 -0.6 0.0 0.0 0.0 0.0 -0.0 28.8 28.8
5 479233.84 5443230.60 2.60 0 1000 83.7 83.7 0.0 0.0 58.6 0.9 -1.0 0.0 0.0 0.0 0.0 -0.0 25.2 25.2
6 479233.84 5443230.60 2.60 0 2000 79.1 79.1 0.0 0.0 58.6 2.3 -1.0 0.0 0.0 0.0 0.0 -0.0 19.2 19.2
7 479233.84 5443230.60 2.60 0 4000 70.0 70.0 0.0 0.0 58.6 7.8 -1.0 0.0 0.0 0.0 0.0 -0.0 4.6 4.6
8 479233.84 5443230.60 2.60 0 8000 77.7 77.7 0.0 0.0 58.6 28.0 -1.0 0.0 0.0 0.0 0.0 -0.0 -7.9 -7.9
Point Source, ISO 9613, Name: ''Inv4'', ID: ''Inv4''
Nr. X Y Z Refl. Freq. LxT LxN K0 Dc Adiv Aatm Agr Afol Ahous Abar Cmet RL LrT LrN
(m) (m) (m) (Hz) dB(A) dB(A) (dB) (dB) (dB) (dB) (dB) (dB) (dB) (dB) (dB) (dB) dB(A) dB(A)
1 479233.84 5443029.00 2.60 0 63 68.1 68.1 0.0 0.0 63.8 0.1 -4.5 0.0 0.0 0.0 0.0 -0.0 8.8 8.8
2 479233.84 5443029.00 2.60 0 125 78.9 78.9 0.0 0.0 63.8 0.2 2.9 0.0 0.0 0.0 0.0 -0.0 12.1 12.1
3 479233.84 5443029.00 2.60 0 250 85.5 85.5 0.0 0.0 63.8 0.5 2.9 0.0 0.0 0.0 0.0 -0.0 18.4 18.4
4 479233.84 5443029.00 2.60 0 500 87.3 87.3 0.0 0.0 63.8 0.8 -0.9 0.0 0.0 0.0 0.0 -0.0 23.6 23.6

Point Source, ISO 9613, Name: ''Inv4'', ID: ''Inv4''
Nr. X Y Z Refl. Freq. LxT LxN K0 Dc Adiv Aatm Agr Afol Ahous Abar Cmet RL LrT LrN
(m) (m) (m) (Hz) dB(A) dB(A) (dB) (dB) (dB) (dB) (dB) (dB) (dB) (dB) (dB) (dB) dB(A) dB(A)
5 479233.84 5443029.00 2.60 0 1000 83.7 83.7 0.0 0.0 63.8 1.6 -1.4 0.0 0.0 0.0 0.0 -0.0 19.7 19.7
6 479233.84 5443029.00 2.60 0 2000 79.1 79.1 0.0 0.0 63.8 4.2 -1.4 0.0 0.0 0.0 0.0 -0.0 12.5 12.5
7 479233.84 5443029.00 2.60 0 4000 70.0 70.0 0.0 0.0 63.8 14.2 -1.4 0.0 0.0 0.0 0.0 -0.0 -6.6 -6.6
8 479233.84 5443029.00 2.60 0 8000 77.7 77.7 0.0 0.0 63.8 50.8 -1.4 0.0 0.0 0.0 0.0 -0.0 -35.5 -35.5
Point Source, ISO 9613, Name: ''Inv5'', ID: ''Inv5''
Nr. X Y Z Refl. Freq. LxT LxN K0 Dc Adiv Aatm Agr Afol Ahous Abar Cmet RL LrT LrN
(m) (m) (m) (Hz) dB(A) dB(A) (dB) (dB) (dB) (dB) (dB) (dB) (dB) (dB) (dB) (dB) dB(A) dB(A)
1 478982.46 5443085.00 2.60 0 63 68.1 68.1 0.0 0.0 65.0 0.1 -4.7 0.0 0.0 0.0 0.0 -0.0 7.8 7.8
2 478982.46 5443085.00 2.60 0 125 78.9 78.9 0.0 0.0 65.0 0.2 3.1 0.0 0.0 0.0 0.0 -0.0 10.7 10.7
3 478982.46 5443085.00 2.60 0 250 85.5 85.5 0.0 0.0 65.0 0.5 2.8 0.0 0.0 0.0 0.0 -0.0 17.2 17.2
4 478982.46 5443085.00 2.60 0 500 87.3 87.3 0.0 0.0 65.0 1.0 -1.0 0.0 0.0 0.0 0.0 -0.0 22.4 22.4
5 478982.46 5443085.00 2.60 0 1000 83.7 83.7 0.0 0.0 65.0 1.8 -1.4 0.0 0.0 0.0 0.0 -0.0 18.3 18.3
6 478982.46 5443085.00 2.60 0 2000 79.1 79.1 0.0 0.0 65.0 4.8 -1.4 0.0 0.0 0.0 0.0 -0.0 10.8 10.8
7 478982.46 5443085.00 2.60 0 4000 70.0 70.0 0.0 0.0 65.0 16.3 -1.4 0.0 0.0 0.0 0.0 -0.0 -9.9 -9.9
8 478982.46 5443085.00 2.60 0 8000 77.7 77.7 0.0 0.0 65.0 58.2 -1.4 0.0 0.0 0.0 0.0 -0.0 -44.1 -44.1
Point Source, ISO 9613, Name: ''Inv6'', ID: ''Inv6''
Nr. X Y Z Refl. Freq. LxT LxN K0 Dc Adiv Aatm Agr Afol Ahous Abar Cmet RL LrT LrN
(m) (m) (m) (Hz) dB(A) dB(A) (dB) (dB) (dB) (dB) (dB) (dB) (dB) (dB) (dB) (dB) dB(A) dB(A)
1 478982.46 5443286.60 2.60 0 63 68.1 68.1 0.0 0.0 62.4 0.1 -4.3 0.0 0.0 0.0 0.0 -0.0 9.9 9.9
2 478982.46 5443286.60 2.60 0 125 78.9 78.9 0.0 0.0 62.4 0.2 2.7 0.0 0.0 0.0 0.0 -0.0 13.6 13.6
3 478982.46 5443286.60 2.60 0 250 85.5 85.5 0.0 0.0 62.4 0.4 3.0 0.0 0.0 0.0 0.0 -0.0 19.7 19.7
4 478982.46 5443286.60 2.60 0 500 87.3 87.3 0.0 0.0 62.4 0.7 -0.9 0.0 0.0 0.0 0.0 -0.0 25.0 25.0
5 478982.46 5443286.60 2.60 0 1000 83.7 83.7 0.0 0.0 62.4 1.4 -1.3 0.0 0.0 0.0 0.0 -0.0 21.2 21.2
6 478982.46 5443286.60 2.60 0 2000 79.1 79.1 0.0 0.0 62.4 3.6 -1.3 0.0 0.0 0.0 0.0 -0.0 14.3 14.3
7 478982.46 5443286.60 2.60 0 4000 70.0 70.0 0.0 0.0 62.4 12.2 -1.3 0.0 0.0 0.0 0.0 -0.0 -3.4 -3.4
8 478982.46 5443286.60 2.60 0 8000 77.7 77.7 0.0 0.0 62.4 43.7 -1.3 0.0 0.0 0.0 0.0 -0.0 -27.1 -27.1
Point Source, ISO 9613, Name: ''Inv7'', ID: ''Inv7''
Nr. X Y Z Refl. Freq. LxT LxN K0 Dc Adiv Aatm Agr Afol Ahous Abar Cmet RL LrT LrN
(m) (m) (m) (Hz) dB(A) dB(A) (dB) (dB) (dB) (dB) (dB) (dB) (dB) (dB) (dB) (dB) dB(A) dB(A)
1 478982.46 5443488.20 2.60 0 63 68.1 68.1 0.0 0.0 61.5 0.0 -4.1 0.0 0.0 0.0 0.0 -0.0 10.7 10.7
2 478982.46 5443488.20 2.60 0 125 78.9 78.9 0.0 0.0 61.5 0.1 2.6 0.0 0.0 0.0 0.0 -0.0 14.7 14.7
3 478982.46 5443488.20 2.60 0 250 85.5 85.5 0.0 0.0 61.5 0.4 3.0 0.0 0.0 0.0 0.0 -0.0 20.6 20.6
4 478982.46 5443488.20 2.60 0 500 87.3 87.3 0.0 0.0 61.5 0.7 -0.8 0.0 0.0 0.0 0.0 -0.0 25.9 25.9
5 478982.46 5443488.20 2.60 0 1000 83.7 83.7 0.0 0.0 61.5 1.2 -1.2 0.0 0.0 0.0 0.0 -0.0 22.2 22.2
6 478982.46 5443488.20 2.60 0 2000 79.1 79.1 0.0 0.0 61.5 3.2 -1.2 0.0 0.0 0.0 0.0 -0.0 15.6 15.6
7 478982.46 5443488.20 2.60 0 4000 70.0 70.0 0.0 0.0 61.5 11.0 -1.2 0.0 0.0 0.0 0.0 -0.0 -1.2 -1.2
8 478982.46 5443488.20 2.60 0 8000 77.7 77.7 0.0 0.0 61.5 39.1 -1.2 0.0 0.0 0.0 0.0 -0.0 -21.7 -21.7
Point Source, ISO 9613, Name: ''Trans1'', ID: ''Trans1''
Nr. X Y Z Refl. Freq. LxT LxN K0 Dc Adiv Aatm Agr Afol Ahous Abar Cmet RL LrT LrN
(m) (m) (m) (Hz) dB(A) dB(A) (dB) (dB) (dB) (dB) (dB) (dB) (dB) (dB) (dB) (dB) dB(A) dB(A)
1 479481.74 5443342.10 2.58 0 32 41.3 41.3 0.0 0.0 57.1 0.0 -3.0 0.0 0.0 0.0 0.0 -0.0 -12.8 -12.8
2 479481.74 5443342.10 2.58 0 63 60.5 60.5 0.0 0.0 57.1 0.0 -3.0 0.0 0.0 0.0 0.0 -0.0 6.4 6.4
3 479481.74 5443342.10 2.58 0 125 72.6 72.6 0.0 0.0 57.1 0.1 2.4 0.0 0.0 0.0 0.0 -0.0 13.0 13.0
4 479481.74 5443342.10 2.58 0 250 75.1 75.1 0.0 0.0 57.1 0.2 3.3 0.0 0.0 0.0 0.0 -0.0 14.5 14.5
5 479481.74 5443342.10 2.58 0 500 80.5 80.5 0.0 0.0 57.1 0.4 -0.5 0.0 0.0 0.0 0.0 -0.0 23.5 23.5
6 479481.74 5443342.10 2.58 0 1000 77.7 77.7 0.0 0.0 57.1 0.7 -0.9 0.0 0.0 0.0 0.0 -0.0 20.8 20.8
7 479481.74 5443342.10 2.58 0 2000 73.9 73.9 0.0 0.0 57.1 1.9 -0.9 0.0 0.0 0.0 0.0 -0.0 15.8 15.8
8 479481.74 5443342.10 2.58 0 4000 68.7 68.7 0.0 0.0 57.1 6.6 -0.9 0.0 0.0 0.0 0.0 -0.0 5.9 5.9
9 479481.74 5443342.10 2.58 0 8000 59.6 59.6 0.0 0.0 57.1 23.5 -0.9 0.0 0.0 0.0 0.0 -0.0 -20.1 -20.1
Point Source, ISO 9613, Name: ''Trans2'', ID: ''Trans2''
Nr. X Y Z Refl. Freq. LxT LxN K0 Dc Adiv Aatm Agr Afol Ahous Abar Cmet RL LrT LrN
(m) (m) (m) (Hz) dB(A) dB(A) (dB) (dB) (dB) (dB) (dB) (dB) (dB) (dB) (dB) (dB) dB(A) dB(A)
1 479481.74 5443140.50 2.58 0 32 41.3 41.3 0.0 0.0 62.0 0.0 -4.2 0.0 0.0 0.0 0.0 -0.0 -16.5 -16.5
2 479481.74 5443140.50 2.58 0 63 60.5 60.5 0.0 0.0 62.0 0.0 -4.2 0.0 0.0 0.0 0.0 -0.0 2.6 2.6
3 479481.74 5443140.50 2.58 0 125 72.6 72.6 0.0 0.0 62.0 0.2 2.7 0.0 0.0 0.0 0.0 -0.0 7.8 7.8
4 479481.74 5443140.50 2.58 0 250 75.1 75.1 0.0 0.0 62.0 0.4 3.0 0.0 0.0 0.0 0.0 -0.0 9.7 9.7
5 479481.74 5443140.50 2.58 0 500 80.5 80.5 0.0 0.0 62.0 0.7 -0.8 0.0 0.0 0.0 0.0 -0.0 18.6 18.6
6 479481.74 5443140.50 2.58 0 1000 77.7 77.7 0.0 0.0 62.0 1.3 -1.3 0.0 0.0 0.0 0.0 -0.0 15.6 15.6

Point Source, ISO 9613, Name: ''Trans2'', ID: ''Trans2''
Nr. X Y Z Refl. Freq. LxT LxN K0 Dc Adiv Aatm Agr Afol Ahous Abar Cmet RL LrT LrN
(m) (m) (m) (Hz) dB(A) dB(A) (dB) (dB) (dB) (dB) (dB) (dB) (dB) (dB) (dB) (dB) dB(A) dB(A)
7 479481.74 5443140.50 2.58 0 2000 73.9 73.9 0.0 0.0 62.0 3.4 -1.3 0.0 0.0 0.0 0.0 -0.0 9.7 9.7
8 479481.74 5443140.50 2.58 0 4000 68.7 68.7 0.0 0.0 62.0 11.7 -1.3 0.0 0.0 0.0 0.0 -0.0 -3.7 -3.7
9 479481.74 5443140.50 2.58 0 8000 59.6 59.6 0.0 0.0 62.0 41.6 -1.3 0.0 0.0 0.0 0.0 -0.0 -42.8 -42.8
Point Source, ISO 9613, Name: ''Trans3'', ID: ''Trans3''
Nr. X Y Z Refl. Freq. LxT LxN K0 Dc Adiv Aatm Agr Afol Ahous Abar Cmet RL LrT LrN
(m) (m) (m) (Hz) dB(A) dB(A) (dB) (dB) (dB) (dB) (dB) (dB) (dB) (dB) (dB) (dB) dB(A) dB(A)
1 479228.34 5443230.10 2.58 0 32 41.3 41.3 0.0 0.0 58.7 0.0 -3.4 0.0 0.0 0.0 0.0 -0.0 -14.0 -14.0
2 479228.34 5443230.10 2.58 0 63 60.5 60.5 0.0 0.0 58.7 0.0 -3.4 0.0 0.0 0.0 0.0 -0.0 5.2 5.2
3 479228.34 5443230.10 2.58 0 125 72.6 72.6 0.0 0.0 58.7 0.1 2.5 0.0 0.0 0.0 0.0 -0.0 11.4 11.4
4 479228.34 5443230.10 2.58 0 250 75.1 75.1 0.0 0.0 58.7 0.3 3.2 0.0 0.0 0.0 0.0 -0.0 12.9 12.9
5 479228.34 5443230.10 2.58 0 500 80.5 80.5 0.0 0.0 58.7 0.5 -0.6 0.0 0.0 0.0 0.0 -0.0 21.9 21.9
6 479228.34 5443230.10 2.58 0 1000 77.7 77.7 0.0 0.0 58.7 0.9 -1.0 0.0 0.0 0.0 0.0 -0.0 19.2 19.2
7 479228.34 5443230.10 2.58 0 2000 73.9 73.9 0.0 0.0 58.7 2.3 -1.0 0.0 0.0 0.0 0.0 -0.0 13.9 13.9
8 479228.34 5443230.10 2.58 0 4000 68.7 68.7 0.0 0.0 58.7 7.9 -1.0 0.0 0.0 0.0 0.0 -0.0 3.1 3.1
9 479228.34 5443230.10 2.58 0 8000 59.6 59.6 0.0 0.0 58.7 28.3 -1.0 0.0 0.0 0.0 0.0 -0.0 -26.3 -26.3
Point Source, ISO 9613, Name: ''Trans4'', ID: ''Trans4''
Nr. X Y Z Refl. Freq. LxT LxN K0 Dc Adiv Aatm Agr Afol Ahous Abar Cmet RL LrT LrN
(m) (m) (m) (Hz) dB(A) dB(A) (dB) (dB) (dB) (dB) (dB) (dB) (dB) (dB) (dB) (dB) dB(A) dB(A)
1 479228.34 5443028.50 2.58 0 32 41.3 41.3 0.0 0.0 63.8 0.0 -4.5 0.0 0.0 0.0 0.0 -0.0 -18.0 -18.0
2 479228.34 5443028.50 2.58 0 63 60.5 60.5 0.0 0.0 63.8 0.1 -4.5 0.0 0.0 0.0 0.0 -0.0 1.2 1.2
3 479228.34 5443028.50 2.58 0 125 72.6 72.6 0.0 0.0 63.8 0.2 2.9 0.0 0.0 0.0 0.0 -0.0 5.8 5.8
4 479228.34 5443028.50 2.58 0 250 75.1 75.1 0.0 0.0 63.8 0.5 2.9 0.0 0.0 0.0 0.0 -0.0 7.9 7.9
5 479228.34 5443028.50 2.58 0 500 80.5 80.5 0.0 0.0 63.8 0.8 -0.9 0.0 0.0 0.0 0.0 -0.0 16.8 16.8
6 479228.34 5443028.50 2.58 0 1000 77.7 77.7 0.0 0.0 63.8 1.6 -1.4 0.0 0.0 0.0 0.0 -0.0 13.7 13.7
7 479228.34 5443028.50 2.58 0 2000 73.9 73.9 0.0 0.0 63.8 4.2 -1.4 0.0 0.0 0.0 0.0 -0.0 7.3 7.3
8 479228.34 5443028.50 2.58 0 4000 68.7 68.7 0.0 0.0 63.8 14.3 -1.4 0.0 0.0 0.0 0.0 -0.0 -8.0 -8.0
9 479228.34 5443028.50 2.58 0 8000 59.6 59.6 0.0 0.0 63.8 50.9 -1.4 0.0 0.0 0.0 0.0 -0.0 -53.8 -53.8
Point Source, ISO 9613, Name: ''Trans5'', ID: ''Trans5''
Nr. X Y Z Refl. Freq. LxT LxN K0 Dc Adiv Aatm Agr Afol Ahous Abar Cmet RL LrT LrN
(m) (m) (m) (Hz) dB(A) dB(A) (dB) (dB) (dB) (dB) (dB) (dB) (dB) (dB) (dB) (dB) dB(A) dB(A)
1 478987.96 5443084.50 2.58 0 32 41.3 41.3 0.0 0.0 64.9 0.0 -4.7 0.0 0.0 0.0 0.0 -0.0 -18.9 -18.9
2 478987.96 5443084.50 2.58 0 63 60.5 60.5 0.0 0.0 64.9 0.1 -4.7 0.0 0.0 0.0 0.0 -0.0 0.3 0.3
3 478987.96 5443084.50 2.58 0 125 72.6 72.6 0.0 0.0 64.9 0.2 3.1 0.0 0.0 0.0 0.0 -0.0 4.4 4.4
4 478987.96 5443084.50 2.58 0 250 75.1 75.1 0.0 0.0 64.9 0.5 2.9 0.0 0.0 0.0 0.0 -0.0 6.8 6.8
5 478987.96 5443084.50 2.58 0 500 80.5 80.5 0.0 0.0 64.9 1.0 -1.0 0.0 0.0 0.0 0.0 -0.0 15.6 15.6
6 478987.96 5443084.50 2.58 0 1000 77.7 77.7 0.0 0.0 64.9 1.8 -1.4 0.0 0.0 0.0 0.0 -0.0 12.4 12.4
7 478987.96 5443084.50 2.58 0 2000 73.9 73.9 0.0 0.0 64.9 4.8 -1.4 0.0 0.0 0.0 0.0 -0.0 5.6 5.6
8 478987.96 5443084.50 2.58 0 4000 68.7 68.7 0.0 0.0 64.9 16.2 -1.4 0.0 0.0 0.0 0.0 -0.0 -11.0 -11.0
9 478987.96 5443084.50 2.58 0 8000 59.6 59.6 0.0 0.0 64.9 57.9 -1.4 0.0 0.0 0.0 0.0 -0.0 -61.7 -61.7
Point Source, ISO 9613, Name: ''Trans6'', ID: ''Trans6''
Nr. X Y Z Refl. Freq. LxT LxN K0 Dc Adiv Aatm Agr Afol Ahous Abar Cmet RL LrT LrN
(m) (m) (m) (Hz) dB(A) dB(A) (dB) (dB) (dB) (dB) (dB) (dB) (dB) (dB) (dB) (dB) dB(A) dB(A)
1 478987.96 5443286.10 2.58 0 32 41.3 41.3 0.0 0.0 62.3 0.0 -4.3 0.0 0.0 0.0 0.0 -0.0 -16.8 -16.8
2 478987.96 5443286.10 2.58 0 63 60.5 60.5 0.0 0.0 62.3 0.0 -4.3 0.0 0.0 0.0 0.0 -0.0 2.4 2.4
3 478987.96 5443286.10 2.58 0 125 72.6 72.6 0.0 0.0 62.3 0.2 2.7 0.0 0.0 0.0 0.0 -0.0 7.4 7.4
4 478987.96 5443286.10 2.58 0 250 75.1 75.1 0.0 0.0 62.3 0.4 3.0 0.0 0.0 0.0 0.0 -0.0 9.4 9.4
5 478987.96 5443286.10 2.58 0 500 80.5 80.5 0.0 0.0 62.3 0.7 -0.8 0.0 0.0 0.0 0.0 -0.0 18.3 18.3
6 478987.96 5443286.10 2.58 0 1000 77.7 77.7 0.0 0.0 62.3 1.4 -1.3 0.0 0.0 0.0 0.0 -0.0 15.3 15.3
7 478987.96 5443286.10 2.58 0 2000 73.9 73.9 0.0 0.0 62.3 3.6 -1.3 0.0 0.0 0.0 0.0 -0.0 9.3 9.3
8 478987.96 5443286.10 2.58 0 4000 68.7 68.7 0.0 0.0 62.3 12.1 -1.3 0.0 0.0 0.0 0.0 -0.0 -4.4 -4.4
9 478987.96 5443286.10 2.58 0 8000 59.6 59.6 0.0 0.0 62.3 43.1 -1.3 0.0 0.0 0.0 0.0 -0.0 -44.6 -44.6
Point Source, ISO 9613, Name: ''Trans7'', ID: ''Trans7''
Nr. X Y Z Refl. Freq. LxT LxN K0 Dc Adiv Aatm Agr Afol Ahous Abar Cmet RL LrT LrN
(m) (m) (m) (Hz) dB(A) dB(A) (dB) (dB) (dB) (dB) (dB) (dB) (dB) (dB) (dB) (dB) dB(A) dB(A)
1 478987.96 5443487.70 2.58 0 32 41.3 41.3 0.0 0.0 61.3 0.0 -4.1 0.0 0.0 0.0 0.0 -0.0 -16.0 -16.0
2 478987.96 5443487.70 2.58 0 63 60.5 60.5 0.0 0.0 61.3 0.0 -4.1 0.0 0.0 0.0 0.0 -0.0 3.2 3.2
3 478987.96 5443487.70 2.58 0 125 72.6 72.6 0.0 0.0 61.3 0.1 2.6 0.0 0.0 0.0 0.0 -0.0 8.5 8.5
4 478987.96 5443487.70 2.58 0 250 75.1 75.1 0.0 0.0 61.3 0.3 3.0 0.0 0.0 0.0 0.0 -0.0 10.4 10.4

Point Source, ISO 9613, Name: ''Trans7'', ID: ''Trans7''
Nr. X Y Z Refl. Freq. LxT LxN K0 Dc Adiv Aatm Agr Afol Ahous Abar Cmet RL LrT LrN
(m) (m) (m) (Hz) dB(A) dB(A) (dB) (dB) (dB) (dB) (dB) (dB) (dB) (dB) (dB) (dB) dB(A) dB(A)
5 478987.96 5443487.70 2.58 0 500 80.5 80.5 0.0 0.0 61.3 0.6 -0.8 0.0 0.0 0.0 0.0 -0.0 19.3 19.3
6 478987.96 5443487.70 2.58 0 1000 77.7 77.7 0.0 0.0 61.3 1.2 -1.2 0.0 0.0 0.0 0.0 -0.0 16.4 16.4
7 478987.96 5443487.70 2.58 0 2000 73.9 73.9 0.0 0.0 61.3 3.2 -1.2 0.0 0.0 0.0 0.0 -0.0 10.6 10.6
8 478987.96 5443487.70 2.58 0 4000 68.7 68.7 0.0 0.0 61.3 10.8 -1.2 0.0 0.0 0.0 0.0 -0.0 -2.2 -2.2
9 478987.96 5443487.70 2.58 0 8000 59.6 59.6 0.0 0.0 61.3 38.5 -1.2 0.0 0.0 0.0 0.0 -0.0 -39.0 -39.0