long-range transport of giant particles in asian dust ... · properties of mineral dust considers...
TRANSCRIPT
Atmos. Chem. Phys., 14, 505–521, 2014www.atmos-chem-phys.net/14/505/2014/doi:10.5194/acp-14-505-2014© Author(s) 2014. CC Attribution 3.0 License.
Atmospheric Chemistry
and PhysicsO
pen Access
Long-range transport of giant particles in Asian dust identified byphysical, mineralogical, and meteorological analysis
G. Y. Jeong1, J. Y. Kim 2, J. Seo2,3, G. M. Kim 1, H. C. Jin2, and Y. Chun4
1Department of Earth and Environmental Sciences, Andong National University, Andong 760-749, Republic of Korea2Korea Institute of Science and Technology (KIST), Seoul 136-791, Republic of Korea3School of Earth and Environmental Sciences, Seoul National University, Seoul 151-742, Republic of Korea4Asian Dust Research Division, National Institute of Meteorological Research, Seoul 156-720, Republic of Korea
Correspondence to:G. Y. Jeong ([email protected])
Received: 28 May 2013 – Published in Atmos. Chem. Phys. Discuss.: 13 August 2013Revised: 8 November 2013 – Accepted: 3 December 2013 – Published: 15 January 2014
Abstract. Giant particles transported over long distances aregenerally of limited concern in atmospheric studies due totheir low number concentrations in mineral dust and possi-ble local origin. However, they can play an important role inregional circulation of earth materials due to their enormousvolume concentration. Asian dust laden with giant particleswas observed in Korea on 31 March 2012, after a migra-tion of about 2000 km across the Yellow Sea from the GobiDesert. Scanning electron microscopy (SEM) revealed that20 % of the particles exceeded 10 µm in equivalent spherediameter, with a maximum of 60 µm. The median diameterfrom the number distribution was 5.7 µm, which was largerthan the diameters recorded of 2.5 and 2.9 µm in Asian duststorms in 2010 and 2011, respectively, and was consistentwith independent optical particle counter data. Giant parti-cles (> 10 µm) contributed about 89 % of the volume of thedust in the 2012 storm. Illite–smectite series clay mineralswere the major mineral group followed by quartz, plagio-clase, K-feldspar, and calcite. The total phyllosilicate contentwas∼52 %. The direct long-range transport of giant parti-cles was confirmed by calcite nanofibers closely associatedwith clays in a submicron scale identified by high-resolutionSEM and transmission electron microscopy. Since giant par-ticles consisted of clay agglomerates and clay-coated quartz,feldspars, and micas, the mineral composition varied littlethroughout the fine (< 5 µm), coarse (5–10 µm), giant-S (10–20 µm), and giant-L (> 20 µm) size bins. Analysis of the syn-optic conditions of the 2012 dust event and its migration in-dicated that the mid-tropospheric strong wind belt directlystretching to Korea induced rapid transport of the dust, deliv-
ering giant particles. Giant dust particles with high settlingvelocity would be the major input into the terrestrial and ma-rine sedimentary and ecological systems of East Asia and thewestern Pacific. Analysis of ancient aeolian deposits in Ko-rea suggested the common deposition of giant particles fromAsian dust through the late Quaternary Period. The roles ofgiant particles should be reviewed with regard to regional cir-culation of mineral particles and nutrients.
1 Introduction
Asian dust is composed of soil particles from the surfaces ofwestern China and Mongolia. Asian dust is transported east-ward across China, Korea, Japan, and the North Pacific. Thesize, morphology, chemistry, and mineralogy of dust parti-cles are important for modeling their transport (Westphal etal., 1987; In and Park, 2002), radiative impacts (Tegen andLacis, 1996; Reid et al., 2003; Park et al., 2005; Kandler etal., 2007; Kim et al., 2008), and chemical reactions (Laskin etal., 2005; Jeong and Chun, 2006; Dentener et al., 1996; Sul-livan et al., 2009; Song et al., 2013). They supply inorganicnutrients to marine ecosystems (Meskhidze et al., 2005), andare eventually deposited on land and the ocean floor to formaeolian sediments, recording paleoclimatic changes throughthe Quaternary Period (Bradley, 1999). The Korean Penin-sula lies in the main path of the Asian dust transfer and issuitable for observation of its physical, optical, and chemicalcharacteristics (Seinfeld et al., 2004).
Published by Copernicus Publications on behalf of the European Geosciences Union.
506 G. Y. Jeong et al.: Long-range transport of giant particles in Asian dust
In studies of mineral dust, attention is often paid to fineparticles because they are more respirable, produce harmfuleffects (Dockery et al., 1993), react with gaseous pollutants(Dentener et al., 1996), and reflect light close to solar wave-lengths (Tegen and Lacis, 1996). Modeling of the radiativeproperties of mineral dust considers particles < 10 µm be-cause the atmospheric lifetime of particles > 10 µm is lessthan 1 day (Tegen and Lacis, 1996; Seinfeld and Pandis,2006). Chun et al. (2001) suggested that particles > 10 µmin Asian dust collected in Korea may be derived from localsources. Thus, real-time monitoring networks of Asian dustby governmental institutes of Korea (National Institute of En-vironmental Research and Korea Meteorological Adminis-tration) measure PM2.5 and PM10, but not total suspendedparticulate (TSP) matter.
Although particles > 10 µm have attracted little attention,they can be transported over long distances, and may playsignificant roles in regional circulation of materials. Long-range transport of coarse particles has been reported in Sa-haran dust across the Atlantic Ocean and the MediterraneanSea (Goudie and Middleton, 2001; Díaz-Hernández and Pár-raga, 2008). However, there are rarely reports dedicated tothe research of coarse mineral dusts providing systematicdata of particle size and mineralogy with a meteorologicalinterpretation about their outbreak and migration. Althoughnumber concentrations of relatively coarse particles are nor-mally low compared with fine particles, their mass/volumeconcentrations can be high (Seinfeld and Pandis, 2006). Themass flux of dust via dry deposition can be controlled by arelatively small fraction of aerodynamically large particles(Coude-Gaussen et al., 1987; Arimoto et al., 1997). They areabsorbers of light at thermal wavelengths (Tegen and Lacis,1996). On a regional scale near dust sources, the radiativeeffect of coarser particles is not negligible (Ginoux, 2003).The bulk geochemistry and isotopic composition of dust havelargely been determined for TSP, where the mass is domi-nated by coarse particles (Kanayama et al., 2002).
The modal particle diameters of volume–size distribu-tion of Asian dust have been reported to range from 2 to4 µm as measured with an optical particle counter in Seoul,Korea (Chun et al., 2001, 2003; Jeong, 2008), and BritishColumbia, Canada (McKendry et al., 2008), and using a cas-cade impactor in Japan (Mori et al., 2003; Mikami et al.,2006). However, size distribution curves of Asian dust oftenextend over 10 µm. Park and Kim (2006) reported a mean di-ameter of 9.12 µm on a mass basis using a cascade impactorin Seoul. In addition, there are probably interevent and in-event fluctuations of particle size distribution depending onsynoptic conditions, which have not been studied in detail.Giant particles were observed in the central North Pacific byBetzer et al. (1988), who traced them to Asian sources, in-dicating global circulation of giant particles. However, thereare almost no reports on the occurrence and characterizationof Asian dust heavily laden with giant particles despite nu-merous articles on Asian dust events.
Asian dust was observed in Korea on 31 March 2012. De-spite a low TSP concentration, it was laden with giant parti-cles compared to two previous events (2010 and 2011). The2012 dust provided a unique opportunity to observe the long-range transport of the giant particles. We report physical,mineralogical and meteorological characteristics of the 2012dust event, in comparison to previous events, and discuss theremote origin of giant particles as well as the implications forregional circulation of mineral particles and elements. Here,dust particles were classified as fine (< 5 µm in diameter),coarse (5–10 µm), giant-S (10–20 µm), and giant-L (> 20 µm)particles.
2 Dust outbreak and migration
In terms of spatiotemporal evolution of the dust storm, theinfrared measurements by geostationary satellites are fairlyuseful to trace the dust outbreak and migration in the short-term timescale. To detect dust aerosols from the satellite, thebrightness temperature difference (BTD) between 10.8 µmand 12.0 µm bands (T11µm–T12µm) has been widely used(Ackerman, 1997). BTD is positive over a thin ice cloudand negative over the dust storms (Chaboureau et al., 2007).However, since the BTD technique has low sensitivity on theocean and discontinuity between daytime and nighttime im-ages, other dust indices have been developed and providedby the Korea Meteorological Administration (KMA).
In this study, aerosol index derived from the Communi-cation, Ocean, and Meteorological Satellite (COMS) of theKMA launched on 27 June 2010 is used for the dust eventsin 2011 and 2012 (Fig. 1). The COMS aerosol index isbased on the BTD technique, but derived from the differencebetween BTD and the background threshold value (BTV),which is defined as a difference between the maximum ofT11µm for the past 10 day and observedT12µm at each pixel.Since BTV and BTD are same in the clear sky condition,the difference between BTD and BTV can be utilized forthe detection of the Asian dust (Hong et al., 2010). To re-veal the 2010 dust event, which occurred before the launch-ing of COMS, we also show (in Fig. 1) the infrared differ-ence dust index (IDDI) (Legrand et al., 2001) derived fromthe Multi-functional Transport Satellite-1R (MTSAT-1R) ofthe Japan Meteorological Agency launched on 26 February2005. MTSAT-1R IDDI is based on the brightness tempera-ture in the dust-sensitive 10.8 µm band (T11µm) and is derivedfrom the difference betweenT11µm in the clear sky conditionand observedT11µm.
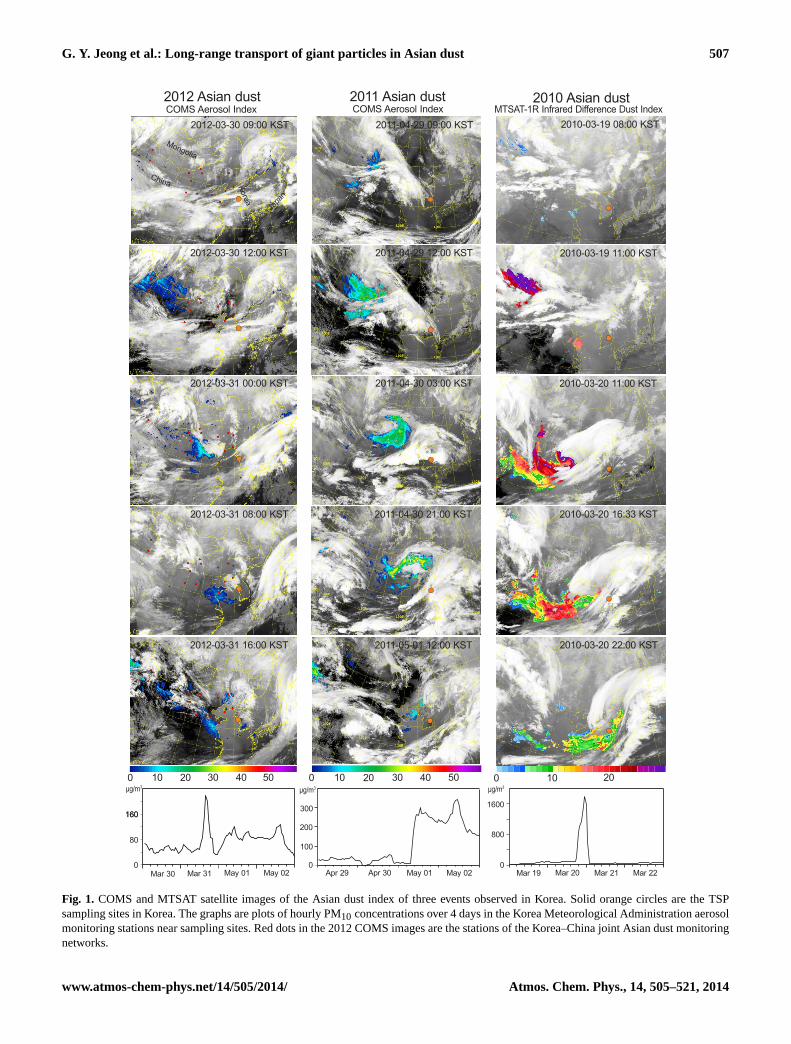
The images of COMS aerosol index during the 2012 dustevent (National Meteorological Satellite Center, 2013) revealthe dust outbreak in the Gobi Desert of southern Mongo-lia and northern China (40◦–45◦ N, 90◦–105◦ E) at around12:00 Korea Standard Time (KST) on 30 March 2012 and itsmigration to the east (Fig. 1). The dust arrived at the west-ern coast of Korea at around 16:00 KST on 31 March, based
Atmos. Chem. Phys., 14, 505–521, 2014 www.atmos-chem-phys.net/14/505/2014/
G. Y. Jeong et al.: Long-range transport of giant particles in Asian dust 507
COMS Aerosol Index COMS Aerosol Index MTSAT-1R Infrared Difference Dust Index
2012-03-30 12:00 KST
2012-03-31 16:00 KST
2012-03-31 08:00 KST
2012-03-31 00:00 KST
2011-04-29 12:00 KST
2011-04-30 21:00 KST
2011-04-30 03:00 KST
2010-03-19 11:00 KST
2010-03-20 22:00 KST
2010-03-20 16:33 KST
2010-03-20 11:00 KST
2012 Asian dust 2011 Asian dust 2010 Asian dust
160
80
0Mar 30 Mar 31 May 01 May 02
300
100
0
200800
0
1600
Mar 19 Mar 20 Mar 21 Mar 22Apr 29 Apr 30 May 01 May 02
3μg/m 3μg/m 3μg/m
160
2011-04-29 09:00 KST 2010-03-19 08:00 KST2012-03-30 09:00 KST
0 10 20 30 40 50 0 10 20 30 40 50 0 10 20
Mongolia
China Kore
a
Japa
n
2011-05-01 12:00 KST
Fig. 1. COMS and MTSAT satellite images of the Asian dust index of three events observed in Korea. Solid orange circles are the TSPsampling sites in Korea. The graphs are plots of hourly PM10 concentrations over 4 days in the Korea Meteorological Administration aerosolmonitoring stations near sampling sites. Red dots in the 2012 COMS images are the stations of the Korea–China joint Asian dust monitoringnetworks.
www.atmos-chem-phys.net/14/505/2014/ Atmos. Chem. Phys., 14, 505–521, 2014
508 G. Y. Jeong et al.: Long-range transport of giant particles in Asian dust
on the time series of PM10 concentrations in Seoul (KMA,2013). The time of flight was about 28 h for the migration ofabout 2000 km. The duration of the Asian dust event was 4 hwith a peak PM10 concentration of 220 µg m−3.
During the 2011 dust event, the images of COMS aerosolindex images show that the dust outbreak occurred in theGobi Desert (40◦–45◦ N, 95◦–105◦ E) at around 12:00 KSTon 29 April 2011 and the dust arrived at the sampling site(Andong) at 09:00 KST on 1 May 2011. The time of flightwas about 45 h and the event lasted for about 3 days (ca. 62 h)with a peak PM10 concentration of 344 µg m−3.
MTSTR-1R IDDI images during the 2010 dust event showthe dust outbreak in the Gobi Desert of southern Mongolia(43◦–46◦ N, 100◦–110◦ E) at 11:00 KST on 19 March 2010.The dust arrived at around 22:00 KST on March 20 with thetime of flight of about 35 h. Time series of PM10 concentra-tions indicated short duration (7 h) at the sampling site (An-dong, Korea) with a peak concentration of 1788 µg m−3. Al-though the sampling site used for the 2011 and 2010 dustevents (Andong) was different from that used for the 2012dust event, mineralogical and physical differences betweenKorean sites were not likely to be significant because Asiandust was a nationwide phenomenon over the Korean Penin-sula in both events.
3 Dust samples and methods
The TSP Asian dust in 2012 was collected using a high-volume sampler (Thermo Scientific) fitted with a Teflon-coated borosilicate glass-fiber filter (8 in.×10 in. PALLFLEXmembrane filters). The sampler was installed on a peakat Deokjeok Island (190 m above sea level, 37◦13′59′′ N,126◦08′57′′ E) off the western coast of Korea, 85 km fromSeoul. Sampling proceeded for 24 h from 09:00 on 31 Marchto 08:00 on 1 April 2012. The flow rate of the sampler wasadjusted to 250 L min−1 to avoid coagulation of particles onthe filter surface. The measured TSP concentration for 24 hwas 255 µg m−3. For comparison, we used TSP samples col-lected by the same procedure on 20 March 2010, and 1 May2011 in Andong (36◦32′34′′ N, 128◦47′56′′ E). The late Qua-ternary sediments of ancient Asian dust were sampled froma Paleolithic excavation site at Jeongok, Korea (Shin et al.,2004; Jeong et al., 2013). The exact ages of the sediments aredebated but certainly younger than ca. 500 000 yr (Jeong etal., 2013). The silty sediments were prepared as polished thinsections after epoxy impregnation for comparison to Asiandust particles.
The physical and mineralogical characterization of theAsian dust was carried out by the electron microscopic analy-sis of single particles. Mineralogical analysis of bulk dust us-ing X-ray powder diffraction was not possible due to the lowmass of samples. For scanning electron microscopy (SEM),three layers of conductive sticky carbon tape were attached toCu–Zn stubs. The filter surface was touched lightly with car-
bon tape. The filter surface was observed to change from lightyellow brown to white, indicating transfer of the dust parti-cles onto the carbon tape. Since our goal was to perform theentire morphological, chemical, and high-resolution electronmicroscopic analyses from one specimen, the particles weretransferred onto the stable substrate of conductive sticky car-bon tape. The dust particles collected on the filter were notsuitable for the high resolution SEM and focused ion-beam(FIB) work due to charging even after metal coating.
After platinum coating for electrical conductivity, the mor-phology and chemistry of particles were analyzed with aTESCAN LMU VEGA microscope equipped with an IXRFenergy dispersive X-ray spectrometer (EDXS) at 20 kV ac-celeration voltage and 15 mm working distance. The IXRFEDXS detects elements from carbon. Numbers of analyzedparticles were 3085, 1441, and 1689 in 2012, 2011, and 2010dusts, respectively. High-resolution imaging of the surfacemicrotextures of giant dust particles was performed with aJEOL JSM 6700F field emission gun microscope at 5 kV ac-celeration voltage and 8 mm working distance. SEM workwas performed at the Center for Scientific Instruments, An-dong National University. Then, ultrathin slices (ca. 50 nm inthickness) of about ca. 6 µm× 6 µm size were cut from dustparticles using a SMI3050TB FIB instrument. Submicronminerals in the slices were characterized on the basis of lat-tice fringe spacing, electron diffraction, and chemical com-position using a JEOL JEM3010 transmission electron mi-croscope (TEM) at the National Center for Inter-UniversityResearch Facilities, Seoul National University and an Ox-ford EDXS system of a JEOL JEM 2010 TEM. The polishedthin sections of the aeolian sediment from the Paleolithic sitewere examined in backscattered electron imaging mode us-ing a TESCAN SEM instrument.
Single particle analysis of mineral dust employing SEM–EDXS analysis is basically qualitative because of the irreg-ular shape and wide size range of dust particles (Blanco etal., 2003; Kandler et al., 2007; Fletcher et al., 2011). In ad-dition, the dust particles are mostly the agglomerates of sub-grains of wide-ranging mineralogy and size in varying ratios.Thus, quantitative mineralogical analysis of single dust par-ticle is practically impossible. However, the mineral typesdominating dust particles can be reliably estimated from theEDX spectral pattern, compared with those of reference min-eral particles. The mineralogical identification of the Asiandust particles was greatly facilitated by referring to quanti-tative mineralogical and microscopic data of the source soilsand the Chinese loess deposited from the Asian dust arounddesert sources (Jeong, 2008; Jeong et al., 2008, 2011). Addi-tionally, our SEM–EDXS identifications of Asian dust parti-cles were confirmed by the TEM and EDXS analysis of theFIB slices of individual dust particles.
Dust particles were classified depending on their predom-inant mineral using EDX spectra following the identifica-tion procedure of Jeong (2008). Quartz and feldspars (K-feldspar and plagioclase) were easily identified. However,
Atmos. Chem. Phys., 14, 505–521, 2014 www.atmos-chem-phys.net/14/505/2014/

G. Y. Jeong et al.: Long-range transport of giant particles in Asian dust 509
mineralogical classification of clay minerals was more dif-ficult due to their complex chemistry and structural diversity(Weaver, 1989). Fine-scale mixing of submicron platelets ofclay minerals made classification more difficult. Clay min-erals in dust and sediments include illite, smectite, illite–smectite mixed layers, kaolinite, vermiculite, and chlorite(Shi et al., 2005; Jeong and Chun, 2006; Jeong, 2008; Jeonget al., 2008, 2011). Kaolinite and chlorite were readily identi-fied from their EDX spectra; however, illite, smectite, illite–smectite mixed layers, and vermiculite could not be posi-tively identified because of their fine-scale mixing. There-fore, to avoid over-interpretation they were grouped intoillite–smectite series clay minerals (ISCMs). The EDX spec-tra of many biotite and chlorite particles show signatures ofpartial weathering. Weathered biotite and chlorite that havepartly lost of K, Mg, and Fe are often difficult to distinguishfrom ISCMs. Some muscovite grains with high Mg and Fecontents cannot be readily distinguished from illite. Thus,ISCMs, kaolinite, chlorite, muscovite, and biotite were fur-ther classed as total phyllosilicates. ISCM may be under-estimated by counting the quartz and feldspar grains withISCM coatings as quartz and feldspar particles, but overesti-mated by counting the ISCM agglomerates with quartz andfeldspar inclusions as ISCM particles. Thus, both the errorswill be partly canceled. Obviously, single-particle countingmethod is semiquantitative. Nevertheless, the results in Ta-bles 2–4 are internally consistent, showing the distributioncharacteristics of minerals through different dust sizes andevents. Jeong (2008) showed that mineral compositions ob-tained by the single-particle counting were consistent withthose determined by X-ray diffraction analysis.
Particle diameters equivalent to a sphere were derivedfrom 2-D images. The shape of particles in 2-D images ap-proximates an ellipse (Reid et al., 2003). The orthogonallong and short dimensions of particle ellipses were measuredusing Corel Draw®. The surface area and volume of thespheroids and the diameter of the equivalent spheres werecalculated assuming spheroidal 3-D morphology of the par-ticles (Reid et al., 2003). Large micaceous (muscovite, bi-otite, and weathered equivalents) flakes (> 20 µm) could notbe approximated by spheroidal morphology. Their volumeswere calculated by multiplying the 2-D area by thickness, as-suming a 7 : 1 ratio of area-equivalent diameter to depth, be-cause the ratios of micaceous flakes in Chinese loess rangedfrom 5 : 1 to 10 : 1 (Jeong et al., 2008, 2011; Jeong and Lee,2010). Particle sizes were divided into 12 size bins from 0.5to 60 µm. The number, surface area, and volume fractions ofthe bins divided by the width of each bin were plotted againstparticle diameter on a logarithmic scale (Reist, 1993). Vol-ume distribution is almost equivalent to mass distribution be-cause the densities of the major minerals fall into a narrowrange (2.6–2.9 g cm−3).
a March 31, 2012
50 µm
b cMay 1, 2011 March 20, 2010
50 µm 50 µm
d
50 µm50 µm
Fig. 2. Scanning electron micrographs of Asian dust particles.(a) Giant Asian dust particles, 31 March 2012, Deokjeok Island.Curved threads are contaminants from borosilicate glass-fiber fil-ter. (b) Asian dust, 1 May 2011, Andong.(c) Asian dust, 20 March2010, Andong.(d) Back-scattered electron image of the polished,thin section of aeolian sediment from the Jeongok Paleolithic site,showing quartz, K-feldspar, and plagioclase particles (bright graycontrast) in the fine clay matrix (dark gray contrast) with pores(black) impregnated with epoxy resin.
www.atmos-chem-phys.net/14/505/2014/ Atmos. Chem. Phys., 14, 505–521, 2014
510 G. Y. Jeong et al.: Long-range transport of giant particles in Asian dust
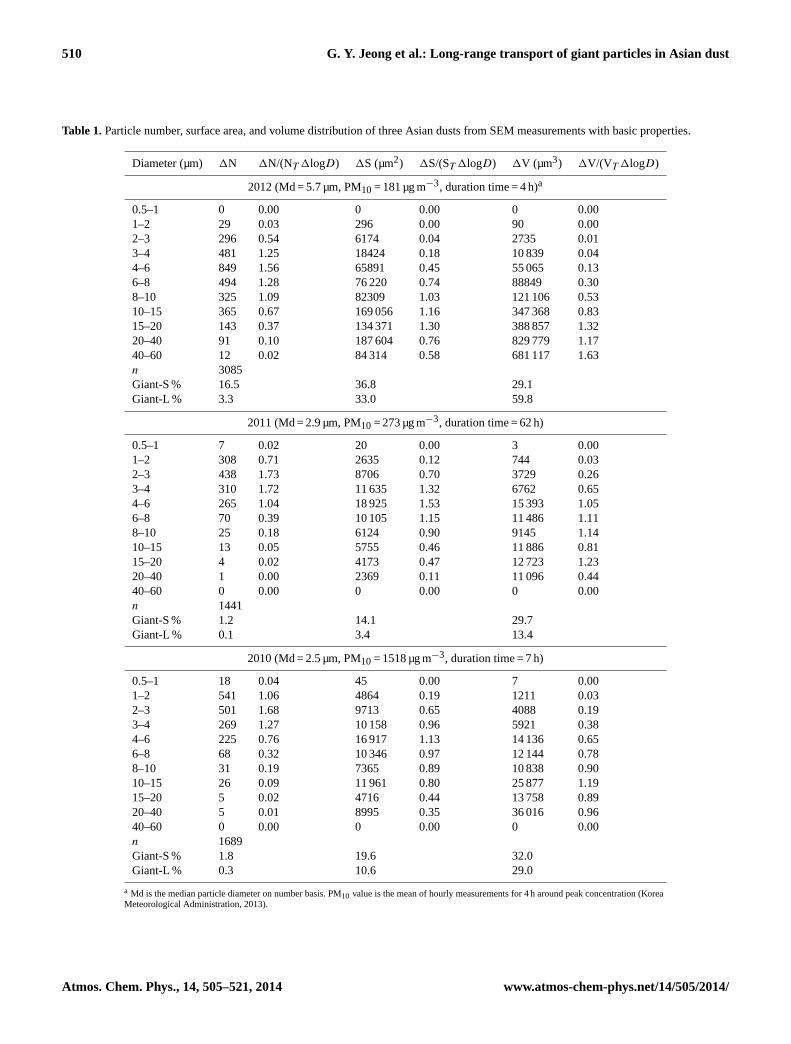
Table 1.Particle number, surface area, and volume distribution of three Asian dusts from SEM measurements with basic properties.
Diameter (µm) 1N 1N/(NT 1logD) 1S (µm2) 1S/(ST 1logD) 1V (µm3) 1V/(VT 1logD)
2012 (Md = 5.7 µm, PM10= 181 µg m−3, duration time = 4 h)a
0.5–1 0 0.00 0 0.00 0 0.001–2 29 0.03 296 0.00 90 0.002–3 296 0.54 6174 0.04 2735 0.013–4 481 1.25 18424 0.18 10 839 0.044–6 849 1.56 65891 0.45 55 065 0.136–8 494 1.28 76 220 0.74 88849 0.308–10 325 1.09 82309 1.03 121 106 0.5310–15 365 0.67 169 056 1.16 347 368 0.8315–20 143 0.37 134 371 1.30 388 857 1.3220–40 91 0.10 187 604 0.76 829 779 1.1740–60 12 0.02 84 314 0.58 681 117 1.63n 3085Giant-S % 16.5 36.8 29.1Giant-L % 3.3 33.0 59.8
2011 (Md = 2.9 µm, PM10= 273 µg m−3, duration time = 62 h)
0.5–1 7 0.02 20 0.00 3 0.001–2 308 0.71 2635 0.12 744 0.032–3 438 1.73 8706 0.70 3729 0.263–4 310 1.72 11 635 1.32 6762 0.654–6 265 1.04 18 925 1.53 15 393 1.056–8 70 0.39 10 105 1.15 11 486 1.118–10 25 0.18 6124 0.90 9145 1.1410–15 13 0.05 5755 0.46 11 886 0.8115–20 4 0.02 4173 0.47 12 723 1.2320–40 1 0.00 2369 0.11 11 096 0.4440–60 0 0.00 0 0.00 0 0.00n 1441Giant-S % 1.2 14.1 29.7Giant-L % 0.1 3.4 13.4
2010 (Md = 2.5 µm, PM10= 1518 µg m−3, duration time = 7 h)
0.5–1 18 0.04 45 0.00 7 0.001–2 541 1.06 4864 0.19 1211 0.032–3 501 1.68 9713 0.65 4088 0.193–4 269 1.27 10 158 0.96 5921 0.384–6 225 0.76 16 917 1.13 14 136 0.656–8 68 0.32 10 346 0.97 12 144 0.788–10 31 0.19 7365 0.89 10 838 0.9010–15 26 0.09 11 961 0.80 25 877 1.1915–20 5 0.02 4716 0.44 13 758 0.8920–40 5 0.01 8995 0.35 36 016 0.9640–60 0 0.00 0 0.00 0 0.00n 1689Giant-S % 1.8 19.6 32.0Giant-L % 0.3 10.6 29.0
a Md is the median particle diameter on number basis. PM10 value is the mean of hourly measurements for 4 h around peak concentration (KoreaMeteorological Administration, 2013).
Atmos. Chem. Phys., 14, 505–521, 2014 www.atmos-chem-phys.net/14/505/2014/

G. Y. Jeong et al.: Long-range transport of giant particles in Asian dust 511
Table 2.Mineral compositions of Asian dust TSP collected on 31 March 2012 (unit in %).
Mineral Total Fine (< 5 µm)1 Coarse (5–10 µm) Giant-S (10–20 µm) Giant-L (> 20 µm)Mineral (n = 2870) (n = 1555)2 (n = 1130) (n = 490) (n = 95)
No. Area Vol. No. Area Vol. No. Area Vol. No. Area Vol. No. Area Vol.
Phyllosilicate
Total 52.3 52.7 52.1 52.0 53.5 54.2 54.2 55.1 54.3 49.2 50.7 48.2 49.5 53.4 53.9ISCMs3 42.1 39.2 36.1 42.4 43.4 44.1 43.2 43.3 42.5 40.2 40.8 37.9 33.7 33.4 33.6Kaolinite 2.4 3.0 4.5 3.5 2.5 2.9 1.7 1.6 1.7 1.0 1.2 1.2 3.2 6.5 7.0Muscovite 1.5 2.6 3.5 0.7 0.8 0.7 1.9 2.5 2.5 1.8 1.4 1.3 3.2 4.4 5.1Chlorite 3.5 3.0 2.6 3.1 4.1 3.7 4.3 4.3 4.2 2.7 3.0 3.5 3.2 2.0 1.7Biotite 2.9 4.9 5.4 2.2 2.6 2.8 3.1 3.4 3.4 3.5 4.3 4.3 6.3 7.1 6.5Talc 0.0 0.0 0.0 0.1 0.1 0.1 0.0 0.0 0.0 0.0 0.0 0.0 0.0 0.0 0.0
Other silicates
Quartz 19.7 21.1 25.0 17.9 17.6 17.7 20.1 20.1 20.7 22.4 21.5 20.8 22.1 21.8 28.5Plagioclase 10.3 11.9 10.1 9.1 9.7 9.1 11.2 11.2 11.4 10.8 11.3 13.8 10.5 13.6 7.8K-feldspar 5.2 5.0 4.4 5.0 5.3 5.1 4.2 4.0 4.0 7.6 6.8 7.2 6.3 3.5 2.9Amphibole 0.9 0.9 0.8 0.8 1.1 0.8 0.8 0.8 0.9 1.0 0.7 0.7 2.1 1.1 0.8Pyroxene 0.1 0.2 0.3 0.0 0.0 0.0 0.1 0.1 0.1 0.0 0.0 0.0 1.1 0.6 0.5Titanite 0.2 0.2 0.3 0.3 0.4 0.3 0.1 0.1 0.1 0.0 0.0 0.0 1.1 0.7 0.6Zoisite 0.4 0.4 0.1 0.2 0.1 0.2 0.6 0.5 0.5 0.4 0.7 0.2 0.0 0.0 0.0
Non-silicates
Calcite 6.7 6.0 5.9 7.2 6.8 6.5 6.3 6.1 6.1 6.3 6.4 7.1 7.4 5.4 5.1Dolomite 1.2 0.5 0.4 2.0 1.5 1.7 0.8 0.7 0.7 0.6 0.7 0.8 0.0 0.0 0.0Iron oxides 1.6 0.6 0.4 2.7 2.0 2.0 0.8 0.7 0.6 1.0 0.8 0.8 0.0 0.0 0.0Fe–Ti oxides 0.4 0.2 0.1 0.4 0.5 0.4 0.4 0.4 0.4 0.4 0.3 0.2 0.0 0.0 0.0Ti oxides 0.1 0.0 0.0 0.3 0.4 0.3 0.1 0.1 0.1 0.0 0.0 0.0 0.0 0.0 0.0Gypsum 0.8 0.1 0.0 1.9 1.0 1.2 0.1 0.0 0.0 0.0 0.0 0.0 0.0 0.0 0.0Apatite 0.1 0.1 0.0 0.2 0.1 0.2 0.1 0.1 0.1 0.2 0.1 0.1 0.0 0.0 0.0Pyrite 0.0 0.0 0.0 0.1 0.2 0.2 0.0 0.0 0.0 0.0 0.0 0.0 0.0 0.0 0.0
1Particle diameter of equivalent sphere.2Number of analyzed particles.3Illite–smectite series clay minerals (illite, smectite, and their mixed layers).
4 Results
4.1 Particle size
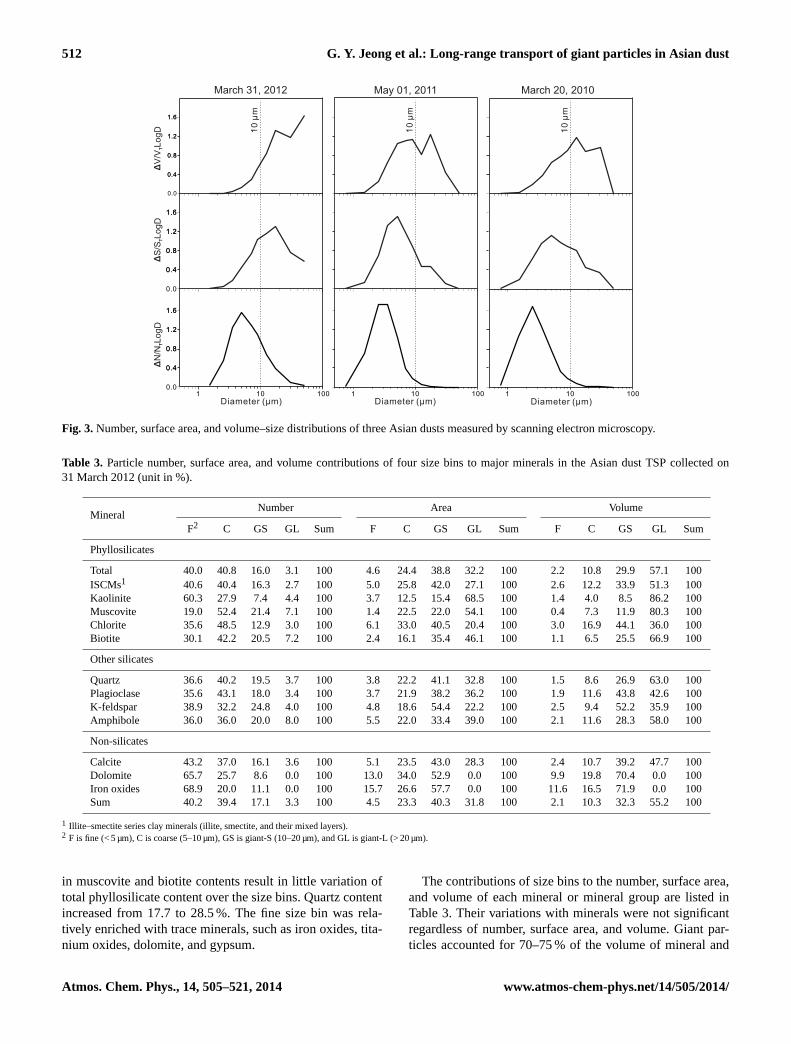
SEM images revealed that the particles of 2012 dust weremuch larger than those in 2010 and 2011 dusts. Giant par-ticles were common in the 2012 dust (Fig. 2a), while theywere rare in the 2010 and 2011 dusts (Fig. 2b, c). Numberdistributions of the three dusts showed roughly log-normaldistributions (Fig. 3, Table 1). The median equivalent-spherediameter of the 2012 dust was 5.7 µm and the maximum was60 µm. The proportion of giant particles (giant-S and giant-L)was 20 % on a number basis, but they contributed 89 % of thetotal volume. Giant-L particles occupied 60 % of the volume.In contrast, the median diameters of the 2010 and 2011 dustswere 2.5 and 2.9 µm, respectively. The number proportions ofthe giant particles were only 2 and 1 % in the 2010 and 2011dusts, respectively, while the respective volume proportionswere 61 and 43 %. The volume contributions of giant-L par-ticles were 29 and 13 % in both dusts. SEM backscatteredelectron images of thin sections of the sediment (Fig. 2d)
identified giant particles of quartz and feldspar enclosed inthe clay matrix.
4.2 Particle mineralogy
Phyllosilicates were the most common mineral group in 2012dust particles (Table 2). The number and volume abundanceof total phyllosilicates were 52.3 and 52.1 %, respectively.ISCMs were the major phyllosilicates (42.1 % of numberabundance and 36.1 % of volume abundance), followed bymuscovite, biotite, and chlorite. Biotite and chlorite werepartly weathered as shown in the loss of cations includingK, Mg, and Fe. The other silicates were quartz (19.7 and25.0 %), plagioclase (10.3 and 10.1 %), K-feldspar (5.2 and4.4 %), and amphibole (0.9 and 0.8 %). Calcite was the ma-jor carbonate (6.7 and 5.9 %) with a minor dolomite content(1.2 and 0.4 %). The number and volume ratios of dolomiteto calcite were about 0.18 and 0.06, respectively. Fe, Ti, andiron–titanium oxides were minor components in Asian dustwith total content of about 1 %.
Mineral composition varied little throughout the four sizebins (Table 2). The abundance of ISCMs decreased from thefine bin (44.1 %) to giant-L bin (33.6 %). However, increases
www.atmos-chem-phys.net/14/505/2014/ Atmos. Chem. Phys., 14, 505–521, 2014
512 G. Y. Jeong et al.: Long-range transport of giant particles in Asian dust
1 10 100Diameter (μm)
March 31, 2012
0.0
0.0
0.0
ΔS
/SL
og
DT
ΔN
/NL
og
DT
ΔV
/VL
og
DT
May 01, 2011 March 20, 2010
Diameter (μm) Diameter (μm)1 10 100 1 10 100
10
µm
10
µm
10
µm
0.4
0.8
1.2
1.6
0.4
0.8
1.2
1.6
0.4
0.8
1.2
1.6
0.4
0.8
1.2
1.6
0.4
0.8
1.2
1.6
0.4
0.8
1.2
1.6
Fig. 3.Number, surface area, and volume–size distributions of three Asian dusts measured by scanning electron microscopy.
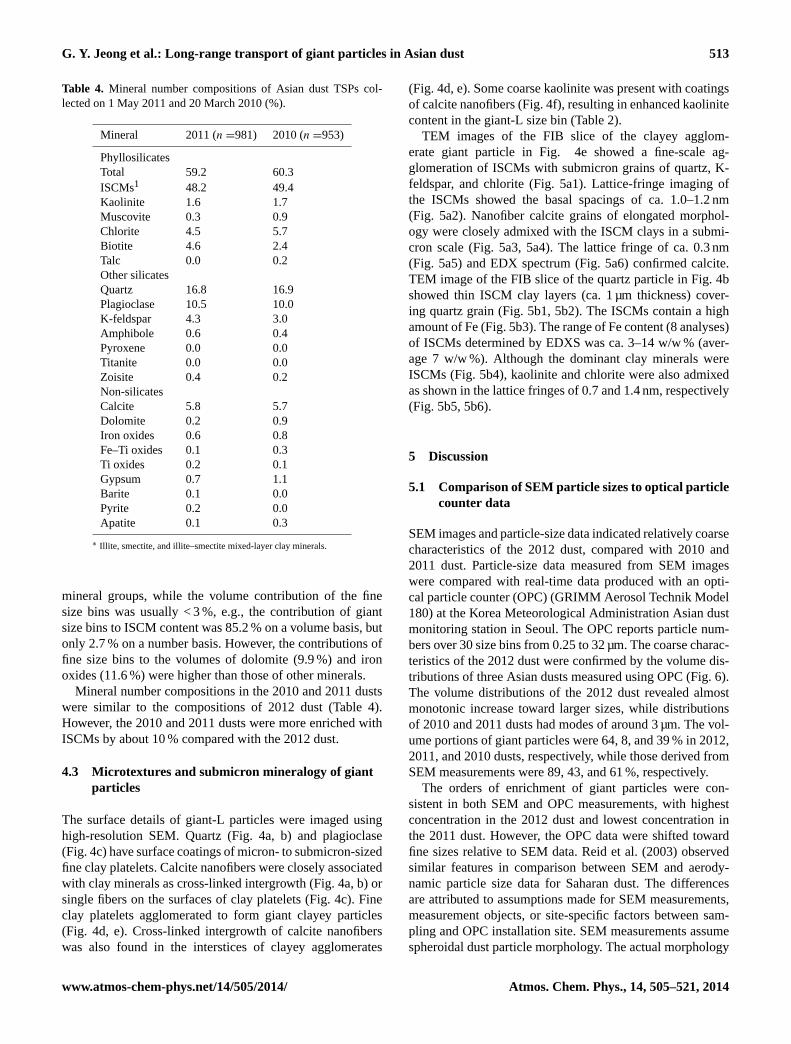
Table 3. Particle number, surface area, and volume contributions of four size bins to major minerals in the Asian dust TSP collected on31 March 2012 (unit in %).
MineralNumber Area Volume
F2 C GS GL Sum F C GS GL Sum F C GS GL Sum
Phyllosilicates
Total 40.0 40.8 16.0 3.1 100 4.6 24.4 38.8 32.2 100 2.2 10.8 29.9 57.1 100ISCMs1 40.6 40.4 16.3 2.7 100 5.0 25.8 42.0 27.1 100 2.6 12.2 33.9 51.3 100Kaolinite 60.3 27.9 7.4 4.4 100 3.7 12.5 15.4 68.5 100 1.4 4.0 8.5 86.2 100Muscovite 19.0 52.4 21.4 7.1 100 1.4 22.5 22.0 54.1 100 0.4 7.3 11.9 80.3 100Chlorite 35.6 48.5 12.9 3.0 100 6.1 33.0 40.5 20.4 100 3.0 16.9 44.1 36.0 100Biotite 30.1 42.2 20.5 7.2 100 2.4 16.1 35.4 46.1 100 1.1 6.5 25.5 66.9 100
Other silicates
Quartz 36.6 40.2 19.5 3.7 100 3.8 22.2 41.1 32.8 100 1.5 8.6 26.9 63.0 100Plagioclase 35.6 43.1 18.0 3.4 100 3.7 21.9 38.2 36.2 100 1.9 11.6 43.8 42.6 100K-feldspar 38.9 32.2 24.8 4.0 100 4.8 18.6 54.4 22.2 100 2.5 9.4 52.2 35.9 100Amphibole 36.0 36.0 20.0 8.0 100 5.5 22.0 33.4 39.0 100 2.1 11.6 28.3 58.0 100
Non-silicates
Calcite 43.2 37.0 16.1 3.6 100 5.1 23.5 43.0 28.3 100 2.4 10.7 39.2 47.7 100Dolomite 65.7 25.7 8.6 0.0 100 13.0 34.0 52.9 0.0 100 9.9 19.8 70.4 0.0 100Iron oxides 68.9 20.0 11.1 0.0 100 15.7 26.6 57.7 0.0 100 11.6 16.5 71.9 0.0 100Sum 40.2 39.4 17.1 3.3 100 4.5 23.3 40.3 31.8 100 2.1 10.3 32.3 55.2 100
1 Illite–smectite series clay minerals (illite, smectite, and their mixed layers).2 F is fine (< 5 µm), C is coarse (5–10 µm), GS is giant-S (10–20 µm), and GL is giant-L (> 20 µm).
in muscovite and biotite contents result in little variation oftotal phyllosilicate content over the size bins. Quartz contentincreased from 17.7 to 28.5 %. The fine size bin was rela-tively enriched with trace minerals, such as iron oxides, tita-nium oxides, dolomite, and gypsum.
The contributions of size bins to the number, surface area,and volume of each mineral or mineral group are listed inTable 3. Their variations with minerals were not significantregardless of number, surface area, and volume. Giant par-ticles accounted for 70–75 % of the volume of mineral and
Atmos. Chem. Phys., 14, 505–521, 2014 www.atmos-chem-phys.net/14/505/2014/
G. Y. Jeong et al.: Long-range transport of giant particles in Asian dust 513
Table 4. Mineral number compositions of Asian dust TSPs col-lected on 1 May 2011 and 20 March 2010 (%).
Mineral 2011 (n =981) 2010 (n =953)
PhyllosilicatesTotal 59.2 60.3ISCMs1 48.2 49.4Kaolinite 1.6 1.7Muscovite 0.3 0.9Chlorite 4.5 5.7Biotite 4.6 2.4Talc 0.0 0.2Other silicatesQuartz 16.8 16.9Plagioclase 10.5 10.0K-feldspar 4.3 3.0Amphibole 0.6 0.4Pyroxene 0.0 0.0Titanite 0.0 0.0Zoisite 0.4 0.2Non-silicatesCalcite 5.8 5.7Dolomite 0.2 0.9Iron oxides 0.6 0.8Fe–Ti oxides 0.1 0.3Ti oxides 0.2 0.1Gypsum 0.7 1.1Barite 0.1 0.0Pyrite 0.2 0.0Apatite 0.1 0.3
∗ Illite, smectite, and illite–smectite mixed-layer clay minerals.
mineral groups, while the volume contribution of the finesize bins was usually < 3 %, e.g., the contribution of giantsize bins to ISCM content was 85.2 % on a volume basis, butonly 2.7 % on a number basis. However, the contributions offine size bins to the volumes of dolomite (9.9 %) and ironoxides (11.6 %) were higher than those of other minerals.
Mineral number compositions in the 2010 and 2011 dustswere similar to the compositions of 2012 dust (Table 4).However, the 2010 and 2011 dusts were more enriched withISCMs by about 10 % compared with the 2012 dust.
4.3 Microtextures and submicron mineralogy of giantparticles
The surface details of giant-L particles were imaged usinghigh-resolution SEM. Quartz (Fig. 4a, b) and plagioclase(Fig. 4c) have surface coatings of micron- to submicron-sizedfine clay platelets. Calcite nanofibers were closely associatedwith clay minerals as cross-linked intergrowth (Fig. 4a, b) orsingle fibers on the surfaces of clay platelets (Fig. 4c). Fineclay platelets agglomerated to form giant clayey particles(Fig. 4d, e). Cross-linked intergrowth of calcite nanofiberswas also found in the interstices of clayey agglomerates
(Fig. 4d, e). Some coarse kaolinite was present with coatingsof calcite nanofibers (Fig. 4f), resulting in enhanced kaolinitecontent in the giant-L size bin (Table 2).
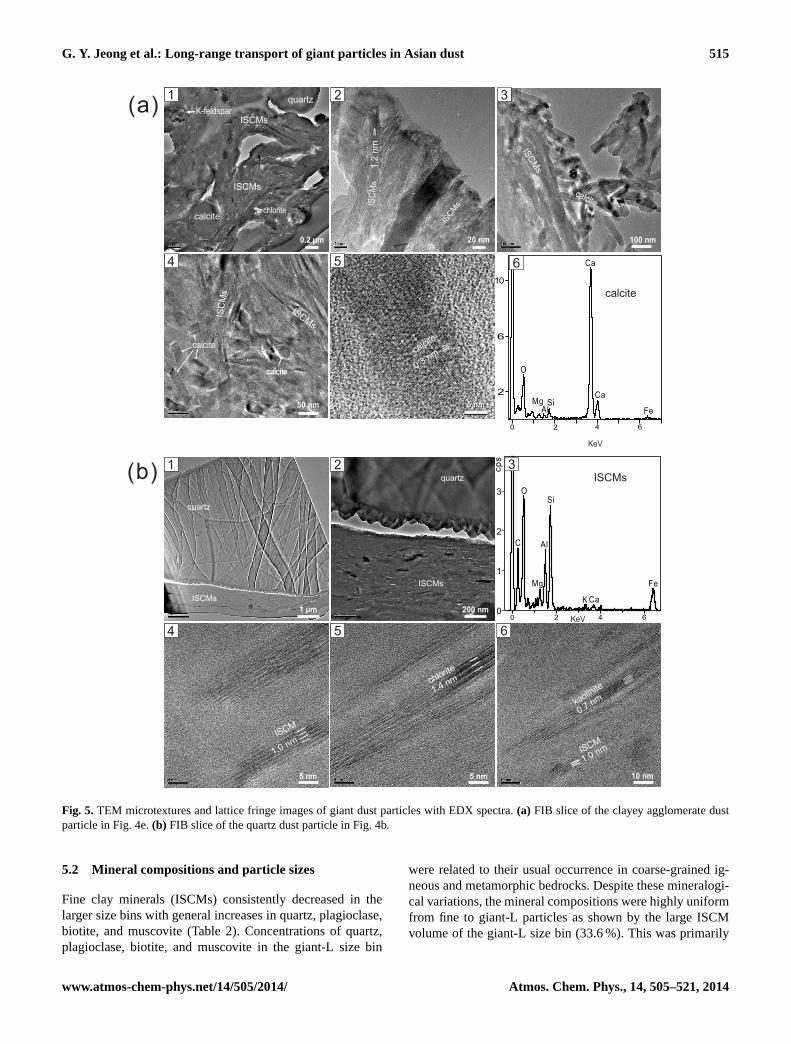
TEM images of the FIB slice of the clayey agglom-erate giant particle in Fig. 4e showed a fine-scale ag-glomeration of ISCMs with submicron grains of quartz, K-feldspar, and chlorite (Fig. 5a1). Lattice-fringe imaging ofthe ISCMs showed the basal spacings of ca. 1.0–1.2 nm(Fig. 5a2). Nanofiber calcite grains of elongated morphol-ogy were closely admixed with the ISCM clays in a submi-cron scale (Fig. 5a3, 5a4). The lattice fringe of ca. 0.3 nm(Fig. 5a5) and EDX spectrum (Fig. 5a6) confirmed calcite.TEM image of the FIB slice of the quartz particle in Fig. 4bshowed thin ISCM clay layers (ca. 1 µm thickness) cover-ing quartz grain (Fig. 5b1, 5b2). The ISCMs contain a highamount of Fe (Fig. 5b3). The range of Fe content (8 analyses)of ISCMs determined by EDXS was ca. 3–14 w/w % (aver-age 7 w/w %). Although the dominant clay minerals wereISCMs (Fig. 5b4), kaolinite and chlorite were also admixedas shown in the lattice fringes of 0.7 and 1.4 nm, respectively(Fig. 5b5, 5b6).
5 Discussion
5.1 Comparison of SEM particle sizes to optical particlecounter data
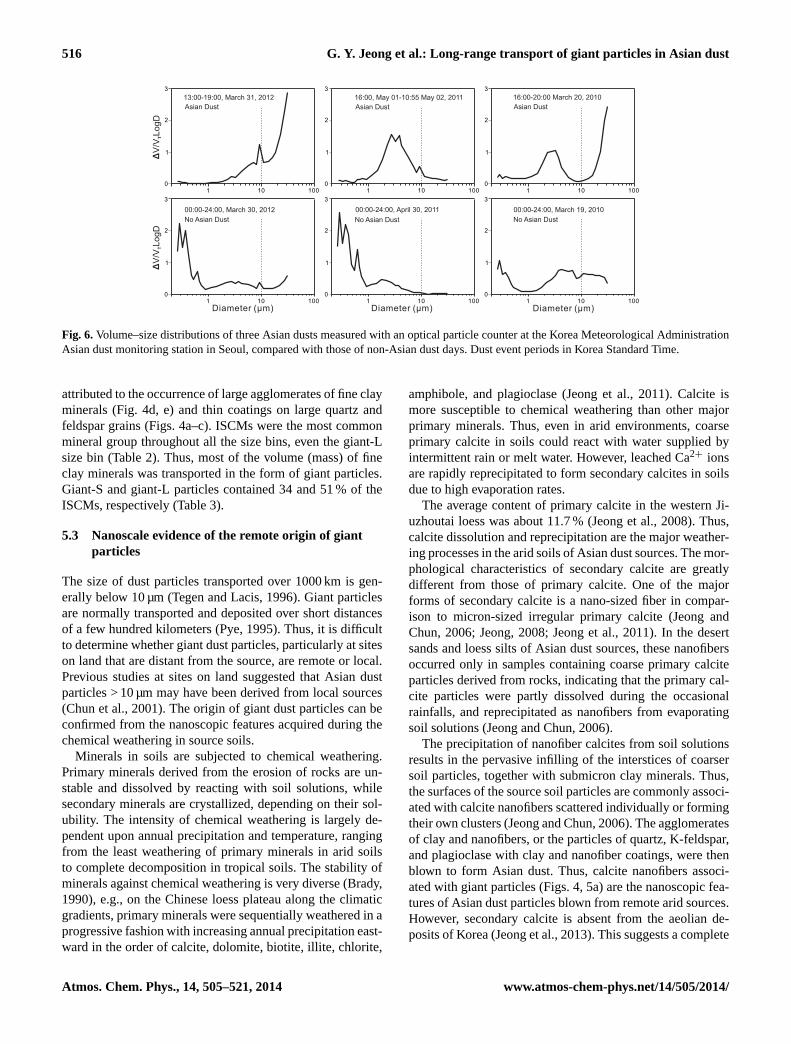
SEM images and particle-size data indicated relatively coarsecharacteristics of the 2012 dust, compared with 2010 and2011 dust. Particle-size data measured from SEM imageswere compared with real-time data produced with an opti-cal particle counter (OPC) (GRIMM Aerosol Technik Model180) at the Korea Meteorological Administration Asian dustmonitoring station in Seoul. The OPC reports particle num-bers over 30 size bins from 0.25 to 32 µm. The coarse charac-teristics of the 2012 dust were confirmed by the volume dis-tributions of three Asian dusts measured using OPC (Fig. 6).The volume distributions of the 2012 dust revealed almostmonotonic increase toward larger sizes, while distributionsof 2010 and 2011 dusts had modes of around 3 µm. The vol-ume portions of giant particles were 64, 8, and 39 % in 2012,2011, and 2010 dusts, respectively, while those derived fromSEM measurements were 89, 43, and 61 %, respectively.
The orders of enrichment of giant particles were con-sistent in both SEM and OPC measurements, with highestconcentration in the 2012 dust and lowest concentration inthe 2011 dust. However, the OPC data were shifted towardfine sizes relative to SEM data. Reid et al. (2003) observedsimilar features in comparison between SEM and aerody-namic particle size data for Saharan dust. The differencesare attributed to assumptions made for SEM measurements,measurement objects, or site-specific factors between sam-pling and OPC installation site. SEM measurements assumespheroidal dust particle morphology. The actual morphology
www.atmos-chem-phys.net/14/505/2014/ Atmos. Chem. Phys., 14, 505–521, 2014

514 G. Y. Jeong et al.: Long-range transport of giant particles in Asian dust
a b c
d e f
Calcite
Calcite
Clay minerals
Clay minerals
Calcite
Clay minerals
10 µm 10 µm 10 µm
10 µm 10 µm 10 µm
Calcite
Clay minerals Clay minerals
Calcite
Calcite1 µm 100 nm 1 µm1 µm
100 nm 1 µm 1 µm1 µm
Fig. 4.High-resolution SEM images of the surfaces of giant-L dust particles. Bottom image was magnified from the box in the upper image.(a, b) Quartz particles coated with thin layers of clay platelets and intergrowth of calcite nanofibers.(c) Plagioclase coated with thin layersof clay platelets and calcite nanofibers.(d, e)Agglomerates of clay platelets with intergrowths of calcite nanofibers.(f) Kaolinite with calcitenanofibers.
of many particles is not spheroidal but is better approximatedas an ellipsoid of which the longer axes are parallel to thefilter surface. We have no information regarding the thirdshortest dimension and therefore the actual diameters wouldbe smaller than those measured by SEM. The OPC cannotdistinguish mineral particles from biogenic, marine, and pol-lutant particles. However, our SEM measurements excludedsea salt and most submicron particles of organic/inorganicpollutants and soot. The volume of giant-L size particles in-creased markedly in the OPC data for 2010 dust (Fig. 6).This is possibly due to the presence of coarse non-mineralparticles, such as pollens, which cannot be distinguished byOPC. However, plants flowering in March are rare around thesampling site (Seoul). Thus, the OPC volume distribution in-
dicates the coarser characteristics of the 2010 dust in Seoul,compared with the SEM size distribution in Andong.
The population of giant particles in the 2012 dust waslarger than those in 2011 and 2010 dusts. SEM analysis ofsingle particles enabled determination of mineralogy, chem-istry, and size distribution of coarse mineral dust, distinguish-ing them from non-mineral particles. Combined applicationof SEM and the wide-ranging particle counter installed at thesame sampling site optimizes systematic characterization ofmineral dusts laden with large particles.
Atmos. Chem. Phys., 14, 505–521, 2014 www.atmos-chem-phys.net/14/505/2014/
G. Y. Jeong et al.: Long-range transport of giant particles in Asian dust 515
2
3 OSi
C
cp
s
Ca
Mg
Al
0
1
0 2 4
K
6
Fe
quartz
calcite
ISCMs
K-feldspar
chlorite
ISCMs
1.0 nmISCM
0.7 nmkaolin
ite
1.0 nmISCM
1.4 nmchlorite
ISCMs
quartz
ISCMs
quartz
ISCMs
ISC
Ms
ISCMs
calcite
calciteIS
CM
s
ISC
Ms
ISC
Ms
calcite
0.3 nmcalci
te
5 nm
calcite1.2
nm
(a)
(b)
1 2 3
4 5
1 2
4 5 6
3
20 nm 100 nm
50 nm
0.2 µm
1 µm 200 nm
5 nm 5 nm 10 nm
5 nm
KeV
2
6
10
0 2 4 6
KeV
O
SiCa
MgAl Fe
calcite
6 Ca
Fig. 5. TEM microtextures and lattice fringe images of giant dust particles with EDX spectra.(a) FIB slice of the clayey agglomerate dustparticle in Fig. 4e.(b) FIB slice of the quartz dust particle in Fig. 4b.
5.2 Mineral compositions and particle sizes
Fine clay minerals (ISCMs) consistently decreased in thelarger size bins with general increases in quartz, plagioclase,biotite, and muscovite (Table 2). Concentrations of quartz,plagioclase, biotite, and muscovite in the giant-L size bin
were related to their usual occurrence in coarse-grained ig-neous and metamorphic bedrocks. Despite these mineralogi-cal variations, the mineral compositions were highly uniformfrom fine to giant-L particles as shown by the large ISCMvolume of the giant-L size bin (33.6 %). This was primarily
www.atmos-chem-phys.net/14/505/2014/ Atmos. Chem. Phys., 14, 505–521, 2014
516 G. Y. Jeong et al.: Long-range transport of giant particles in Asian dust
1 10 1000
1
2
3
1 10 1000
1
2
3
1 10 1000
1
2
3
ΔV
/VLogD
T
13:00-19:00, March 31, 2012 16:00, May 01-10:55 May 02, 2011 16:00-20:00 March 20, 2010
1 10 1000
1
2
3
1 10 1000
1
2
3
1 10 1000
1
2
3
ΔV
/VLogD
T
Diameter (μm) Diameter (μm) Diameter (μm)
00:00-24:00, March 30, 2012 00:00-24:00, April 30, 2011 00:00-24:00, March 19, 2010
Asian Dust
No Asian Dust
Asian Dust Asian Dust
No Asian Dust No Asian Dust
Fig. 6.Volume–size distributions of three Asian dusts measured with an optical particle counter at the Korea Meteorological AdministrationAsian dust monitoring station in Seoul, compared with those of non-Asian dust days. Dust event periods in Korea Standard Time.
attributed to the occurrence of large agglomerates of fine clayminerals (Fig. 4d, e) and thin coatings on large quartz andfeldspar grains (Figs. 4a–c). ISCMs were the most commonmineral group throughout all the size bins, even the giant-Lsize bin (Table 2). Thus, most of the volume (mass) of fineclay minerals was transported in the form of giant particles.Giant-S and giant-L particles contained 34 and 51 % of theISCMs, respectively (Table 3).
5.3 Nanoscale evidence of the remote origin of giantparticles
The size of dust particles transported over 1000 km is gen-erally below 10 µm (Tegen and Lacis, 1996). Giant particlesare normally transported and deposited over short distancesof a few hundred kilometers (Pye, 1995). Thus, it is difficultto determine whether giant dust particles, particularly at siteson land that are distant from the source, are remote or local.Previous studies at sites on land suggested that Asian dustparticles > 10 µm may have been derived from local sources(Chun et al., 2001). The origin of giant dust particles can beconfirmed from the nanoscopic features acquired during thechemical weathering in source soils.
Minerals in soils are subjected to chemical weathering.Primary minerals derived from the erosion of rocks are un-stable and dissolved by reacting with soil solutions, whilesecondary minerals are crystallized, depending on their sol-ubility. The intensity of chemical weathering is largely de-pendent upon annual precipitation and temperature, rangingfrom the least weathering of primary minerals in arid soilsto complete decomposition in tropical soils. The stability ofminerals against chemical weathering is very diverse (Brady,1990), e.g., on the Chinese loess plateau along the climaticgradients, primary minerals were sequentially weathered in aprogressive fashion with increasing annual precipitation east-ward in the order of calcite, dolomite, biotite, illite, chlorite,
amphibole, and plagioclase (Jeong et al., 2011). Calcite ismore susceptible to chemical weathering than other majorprimary minerals. Thus, even in arid environments, coarseprimary calcite in soils could react with water supplied byintermittent rain or melt water. However, leached Ca2+ ionsare rapidly reprecipitated to form secondary calcites in soilsdue to high evaporation rates.
The average content of primary calcite in the western Ji-uzhoutai loess was about 11.7 % (Jeong et al., 2008). Thus,calcite dissolution and reprecipitation are the major weather-ing processes in the arid soils of Asian dust sources. The mor-phological characteristics of secondary calcite are greatlydifferent from those of primary calcite. One of the majorforms of secondary calcite is a nano-sized fiber in compar-ison to micron-sized irregular primary calcite (Jeong andChun, 2006; Jeong, 2008; Jeong et al., 2011). In the desertsands and loess silts of Asian dust sources, these nanofibersoccurred only in samples containing coarse primary calciteparticles derived from rocks, indicating that the primary cal-cite particles were partly dissolved during the occasionalrainfalls, and reprecipitated as nanofibers from evaporatingsoil solutions (Jeong and Chun, 2006).
The precipitation of nanofiber calcites from soil solutionsresults in the pervasive infilling of the interstices of coarsersoil particles, together with submicron clay minerals. Thus,the surfaces of the source soil particles are commonly associ-ated with calcite nanofibers scattered individually or formingtheir own clusters (Jeong and Chun, 2006). The agglomeratesof clay and nanofibers, or the particles of quartz, K-feldspar,and plagioclase with clay and nanofiber coatings, were thenblown to form Asian dust. Thus, calcite nanofibers associ-ated with giant particles (Figs. 4, 5a) are the nanoscopic fea-tures of Asian dust particles blown from remote arid sources.However, secondary calcite is absent from the aeolian de-posits of Korea (Jeong et al., 2013). This suggests a complete
Atmos. Chem. Phys., 14, 505–521, 2014 www.atmos-chem-phys.net/14/505/2014/
G. Y. Jeong et al.: Long-range transport of giant particles in Asian dust 517
leaching of calcite in the acidic soils of Korea under humidclimate conditions compared with the calcareous arid soils inthe Asian dust sources. Thus, the common presence of cal-cite nanofibers associated with giant dust particles (Fig. 4)provides the direct evidence of their long-range transport.
The mineral particles collected on the central North Pa-cific, north of Hawaii, by Betzer et al. (1988) were excep-tionally large (> 75 µm), and can be called ultragiant parti-cles. They suggested that the particles were transported over10,000 km from Asian sources using backward trajectory.However, the Asian desert origin of the ultragiant particles isrequired to be further confirmed by observing the nanoscopicfeatures such as nanofiber calcite.
Díaz-Hernández and Párraga (2008) reported pinkish min-eral microspherulites referred to as iberulites deposited onthe southern Iberian Peninsula. The microspherulites are gi-ant particles with a common size range of 60–80 µm. Theywere formed by the evaporation of cloud water droplets thatcollided with Saharan dust particles. Thus, the cloud process-ing is a possible mechanism of the formation of giant dustparticles. However, iberulite is characterized by high spheric-ity, high porosity (a bulk density of 0.65 g cm−3), vortex de-pression, and coarse internal agglomeration grading to fine,thin clay rinds. The irregular giant particles in this study lackthe microscopic features of iberulite. They were not the re-sults of cloud processing, but directly transported from theGobi Desert sources.
5.4 Synoptic conditions of Asian dust laden with giantparticles
Since it was revealed that the extraordinary high fraction ofgiant particles in 2012 Asian dust was the result of long-range transport from the source region rather than local ori-gin, we investigated the synoptic meteorological conditionscompared with 2011 and 2010 dust events.
Aerosol index images from the COMS satellite revealedthat the outbreak regions, migration routes, and transportdistances of the three dusts were almost identical: the GobiDesert of southern Mongolia and northern China (40◦–46◦ N,90◦–110◦ E) (Fig. 1). However, the flight time of the 2012dust was relatively short (28 h) while those of 2011 and 2010dusts were 45 and 35 h, respectively.
Asian dust incursions in Korea are closely associated withsynoptic conditions over dust source regions 2–3 days earlier(Chun et al., 2001; Kim et al., 2010). For example, Chun etal. (2001) showed that a strong pressure gradient with strongbaroclinic instability at 850 hPa (about 1.5 km level) over thedust source region is associated with outbreaks of Asian dustin spring. Such strong pressure gradients behind the develop-ing low-pressure system result in high surface wind speeds,which are necessary for dust uplift (Husar et al., 2001). In ad-dition, the strong wind belt in the mid-troposphere is closelyrelated to dust migration. Thus, the dust arrival is much faster
if the strong wind belt at 500 hPa (about 5 km) stretches di-rectly to Korea (Chun et al., 2001).
To examine the synoptic conditions related to the outbreakand migration of dust, we used daily mean of the geopotentialheight and temperature at 850 hPa, wind speed at 500 hPa,and 10 m wind speed (as a proxy for the surface wind condi-tions) derived from the European Centre for Medium-RangeWeather Forecasts Reanalysis Interim (ERA-Interim) data.We also used the ultraviolet (UV) aerosol index obtainedfrom the Ozone Monitoring Instrument (OMI) onboard theEOS Aura satellite to identify the intensity and locations ofthe dust. The OMI UV-aerosol index provides qualitative in-formation on the presence of UV-absorbing aerosols such asdesert dust or smoke, without interference by ice, snow, andclouds (Ahn et al., 2008).
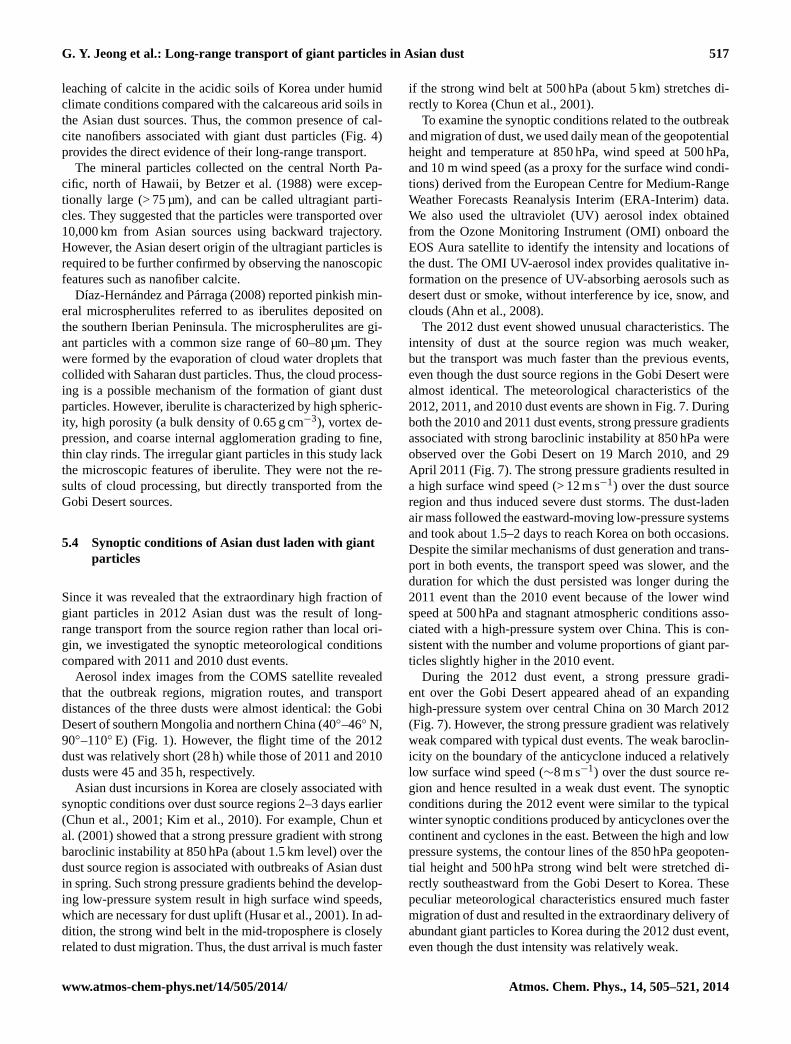
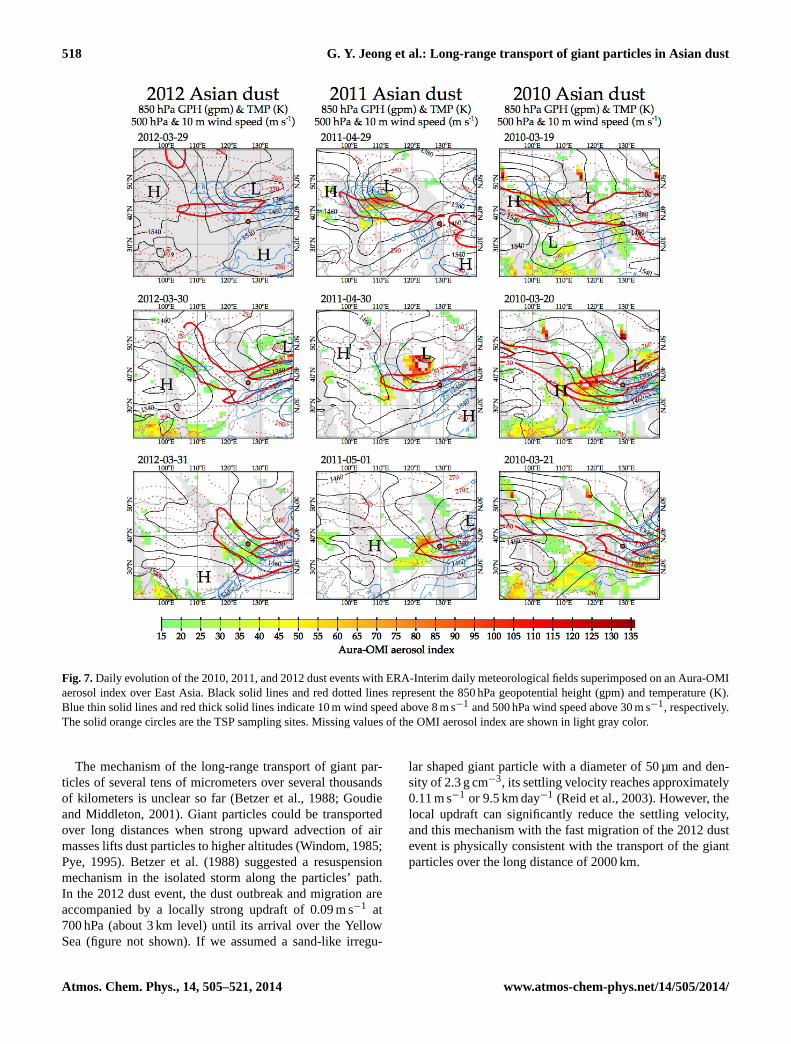
The 2012 dust event showed unusual characteristics. Theintensity of dust at the source region was much weaker,but the transport was much faster than the previous events,even though the dust source regions in the Gobi Desert werealmost identical. The meteorological characteristics of the2012, 2011, and 2010 dust events are shown in Fig. 7. Duringboth the 2010 and 2011 dust events, strong pressure gradientsassociated with strong baroclinic instability at 850 hPa wereobserved over the Gobi Desert on 19 March 2010, and 29April 2011 (Fig. 7). The strong pressure gradients resulted ina high surface wind speed (> 12 m s−1) over the dust sourceregion and thus induced severe dust storms. The dust-ladenair mass followed the eastward-moving low-pressure systemsand took about 1.5–2 days to reach Korea on both occasions.Despite the similar mechanisms of dust generation and trans-port in both events, the transport speed was slower, and theduration for which the dust persisted was longer during the2011 event than the 2010 event because of the lower windspeed at 500 hPa and stagnant atmospheric conditions asso-ciated with a high-pressure system over China. This is con-sistent with the number and volume proportions of giant par-ticles slightly higher in the 2010 event.
During the 2012 dust event, a strong pressure gradi-ent over the Gobi Desert appeared ahead of an expandinghigh-pressure system over central China on 30 March 2012(Fig. 7). However, the strong pressure gradient was relativelyweak compared with typical dust events. The weak baroclin-icity on the boundary of the anticyclone induced a relativelylow surface wind speed (∼8 m s−1) over the dust source re-gion and hence resulted in a weak dust event. The synopticconditions during the 2012 event were similar to the typicalwinter synoptic conditions produced by anticyclones over thecontinent and cyclones in the east. Between the high and lowpressure systems, the contour lines of the 850 hPa geopoten-tial height and 500 hPa strong wind belt were stretched di-rectly southeastward from the Gobi Desert to Korea. Thesepeculiar meteorological characteristics ensured much fastermigration of dust and resulted in the extraordinary delivery ofabundant giant particles to Korea during the 2012 dust event,even though the dust intensity was relatively weak.
www.atmos-chem-phys.net/14/505/2014/ Atmos. Chem. Phys., 14, 505–521, 2014
518 G. Y. Jeong et al.: Long-range transport of giant particles in Asian dust
Fig. 7.Daily evolution of the 2010, 2011, and 2012 dust events with ERA-Interim daily meteorological fields superimposed on an Aura-OMIaerosol index over East Asia. Black solid lines and red dotted lines represent the 850 hPa geopotential height (gpm) and temperature (K).Blue thin solid lines and red thick solid lines indicate 10 m wind speed above 8 m s−1 and 500 hPa wind speed above 30 m s−1, respectively.The solid orange circles are the TSP sampling sites. Missing values of the OMI aerosol index are shown in light gray color.
The mechanism of the long-range transport of giant par-ticles of several tens of micrometers over several thousandsof kilometers is unclear so far (Betzer et al., 1988; Goudieand Middleton, 2001). Giant particles could be transportedover long distances when strong upward advection of airmasses lifts dust particles to higher altitudes (Windom, 1985;Pye, 1995). Betzer et al. (1988) suggested a resuspensionmechanism in the isolated storm along the particles’ path.In the 2012 dust event, the dust outbreak and migration areaccompanied by a locally strong updraft of 0.09 m s−1 at700 hPa (about 3 km level) until its arrival over the YellowSea (figure not shown). If we assumed a sand-like irregu-
lar shaped giant particle with a diameter of 50 µm and den-sity of 2.3 g cm−3, its settling velocity reaches approximately0.11 m s−1 or 9.5 km day−1 (Reid et al., 2003). However, thelocal updraft can significantly reduce the settling velocity,and this mechanism with the fast migration of the 2012 dustevent is physically consistent with the transport of the giantparticles over the long distance of 2000 km.
Atmos. Chem. Phys., 14, 505–521, 2014 www.atmos-chem-phys.net/14/505/2014/
G. Y. Jeong et al.: Long-range transport of giant particles in Asian dust 519
5.5 Ancient records of giant Asian dust particles inKorea
The enormous volume of giant particles suggests that depo-sition of Asian dust would occur near the dust source like inthe Chinese Loess Plateau. However, they also contributedto the formation of an aeolian sedimentary body in remoteenvironments.
The particle size and morphology of quartz and feldsparsin ancient aeolian sediments (Fig. 2d) in the Paleolithic exca-vation sites of Korea (Shin et al., 2004; Jeong et al., 2013) aremarkedly similar to the 2012 dust (Fig. 2a). The origin of thefine clays forming the matrix enclosing quartz and feldsparparticles is unknown. However, the common occurrence ofgiant clay agglomerates in the 2012 dust (Table 2 and Fig. 4d,e) suggests that even the fine clays in the sediments (Fig. 2d)were also derived from giant clay agglomerates. The origi-nal morphology and size of clay agglomerates in Asian dustmay have been altered by post-depositional pedogenic activ-ity. Thus, the long-term deposition of giant particles throughthe late Quaternary likely represents major terrestrial input ofminerals from long-range transported dust to form an aeoliansedimentary body in East Asia.
The giant particles of ancient Asian dust contributed to thefar and remote sedimentary body out of the Asian region.Betzer et al. (1988) suggested the recent anthropogenic dis-turbance as the cause of the giant dust particles delivered tothe North Pacific because giant particles are rare in the deep-sea sediment core of the North Pacific. However, Beget etal. (1993) reported quartz particles as large as 40–60 µm inthe late Quaternary tephric loess deposits on the island ofHawaii. There is evidence supporting the long-range trans-port of large particles, as summarized in Goudie and Mid-dleton (2001), e.g., quartz grains of up to 90 µm in diameteron Sal Island (Cape Verde Islands) off West Africa (Glac-cum and Prospero, 1980) and particles > 20 µm in diametertransported 4000 km from their Saharan source (Prospero etal., 1970). Thus, mass contribution of giant particles to theterrestrial and ocean sediments may have been higher thanpreviously thought at least on a regional scale.
5.6 Transport of reactive minerals and nutrients
Iron dissolved from dust particles is important in Fe-deficientmarine ecosystems of high-nutrient, low-chlorophyll regions,such as the eastern subarctic North Pacific and the SouthernOcean (Boyd et al., 2004). Fine clay minerals and nanofibercalcite with a large surface area and cation exchange capac-ity are sensitive minerals that react with acidic gases/dropletsand organic/inorganic pollutants. The major form of clayminerals and nano-sized calcites transported are giant clayagglomerates, as revealed by SEM analyses, which showedthat giant particles accounted for 89 % of the total volumeof the 2012 dust. Mineral dusts supply inorganic nutrientsto remote sea locations. The settling rates of giant particles
are higher than fine particles. Important inorganic nutrients(e.g., Fe) are associated with fine particles such as Fe-bearingclay minerals and iron oxides. TEM imaging and EDX spec-troscopy of individual clay grains of the Asian dusts and theirdeposits (Chinese loess) showed that ISCMs contain ca. 5–7 % of Fe (Jeong, 2008; Jeong et al., 2008, 2011; this study).About 85 % (vol.) of ISCMs are included in the giant ag-glomerate particles (Table 3, Fig. 4d, e). Large clay agglom-erates are a major source of inorganic nutrients in some re-gions of the ocean, in comparison to fine particles with a slowsettling velocity and long residence time.
6 Summary and conclusions
Particle size, mineralogy, and meteorological characteristicsof the Asian dust event on 31 March 2012, were investigatedand compared with two previous events in 2010 and 2011.The median equivalent sphere diameters from the numbersize distributions were 5.7, 2.9, and 2.5 µm in the 2012, 2011,and 2010 dust events, respectively, and were consistent withindependent OPC data. Twenty percent of the particles in the2012 dust event were giant (giant-S and giant-L) particles,with a maximum size of 60 µm. They contributed 89 % ofthe total dust volume in the 2012 dust and were either ag-glomerates of submicron clay minerals, or large quartz andfeldspar grains with clay-mineral coatings. The occurrenceof calcite nanofibers associated with giant particles con-firmed their long-range transport from remote arid sources.Illite–smectite series clay minerals were the major mineralgroup followed by quartz, plagioclase, K-feldspar, and cal-cite. Mineral compositions showed little variation throughthe fine, coarse, giant-S, and giant-L size bins because thefine clay minerals formed larger agglomerates. Mineral com-positions varied little through the three dust events, but fineclay minerals were more common in the 2010 and 2011dusts. The particle-size characteristics of the mineral dustmay be dependent on the synoptic conditions of the dust out-break and migration. During the 2012 Asian dust event, amid-tropospheric strong wind belt stretched southeastwardfrom the Gobi Desert to Korea, making the rapid migra-tion of dust possible, and delivering abundant giant parti-cles. Atmospheric aerosol studies usually focus on particles< 10 µm. However, the role of giant particles should be re-viewed with regard to the regional circulation of earth materi-als through the lithosphere, pedosphere, and atmosphere. Forexample, analysis of ancient aeolian deposits in Korea sug-gested the common deposition of giant particles from Asiandust through the Quaternary Period.
www.atmos-chem-phys.net/14/505/2014/ Atmos. Chem. Phys., 14, 505–521, 2014
520 G. Y. Jeong et al.: Long-range transport of giant particles in Asian dust
Acknowledgements.This work was supported by the NationalResearch Foundation of Korea grant NRF–2011–0028597. Wethank Mihály Posfai and three anonymous referees for theirthoughtful comments.
Edited by: X. Querol
References
Ackerman, S. A.: Remote sensing aerosols using satellite in-frared observations, J. Geophys. Res.-Atmos., 102, 17069–17079, 1997.
Ahn, C., Torres, O., and Bhartia, P. K.: Comparison of ozone moni-toring instrument UV aerosol products with aqua/moderate reso-lution imaging spectroradiometer and multiangle imaging spec-troradiometer observations in 2006, J. Geophys. Res.-Atmos.,113, D16S27, doi:10.1029/2007JD008832, 2008.
Arimoto, R., Ray, B. J., Lewis, N. F., and Tomza, U.: Mass-particlesize distributions of atmospheric dust and the dry deposition ofdust to the remote ocean, J. Geophys. Res.-Atmos., 102, 15867–15874, 1997.
Beget, J. E., Keskinen, M., and Severin, K.: Mineral particles fromAsia found in volcanic loess on the island of Hawaii, Sediment.Geol., 84, 189–197, 1993.
Betzer, P. R., Carder, K. L., Duce, R. A., Merrill, J. T., Tindale, N.W., Uematsu, M., Costello, D. K., Young, R. W., Feely, R. A.,Breland, J. A., Bernstein, R. E., and Greco, A. M.: Long-rangetransport of giant mineral aerosol particles, Nature, 336, 568–571, 1988.
Blanco, A., De Tomasi, F., Filippo, E., Manno, D., Perrone, M.R., Serra, A., Tafuro, A. M., and Tepore, A.: Characterization ofAfrican dust over southern Italy, Atmos. Chem. Phys., 3, 2147–2159, doi:10.5194/acp-3-2147-2003, 2003.
Boyd, P. W., Law, C. S., Wong, C. S., Nojiri, Y., Tsuda, A., Lev-asseur, M., Takeda, S., Rivkin, R., Harrison, P. J., Strzepek, R.,Gower, J., McKay, R. M., Abraham, E., Arychuk, M., Barwell-Clarke, J., Crawford, W., Hale, M., Harada, K., Johnson, K.,Kiyosawa, H., Kudo, I., Marchetti, A., Miller, W., Needoba, J.,Nishioka, J., Ogawa, H., Page, J., Robert, M., Saito, H., Sastri,A., Sherry, N., Soutar, T., Sutherland, N., Taira, Y., Whitney, F.,Wong, S. -K. E., and Yoshimura, T.: The decline and fate of aniron-induced subarctic phytoplankton bloom, Nature, 428, 549–553, doi:10.1038/nature02437, 2004.
Bradley, R. S.: Paleoclimatology: Reconstructing Climates of theQuaternary, Academic Press, 1999.
Brady, N. C.: The Nature and Properties of Soils, Macmillan Pub-lishing Company, New York, 1990.
Chaboureau, J. -P., Tulet, P., and Mari, C.: Diurnal cycle of dust andcirrus over West Africa as seen from Meteosat Second Genera-tion satellite and a regional forecast model, Geophys. Res. Lett.,34, L02822, doi:10.1029/2006GL027771, 2007.
Chun, Y., Boo, K.-O., Kim, J., Park, S. -U., and Lee, M.: Synopsis,transport, and physical characteristics of Asian dust in Korea, J.Geophys. Res.-Atmos., 106, 18461–18469, 2001.
Chun, Y., Lim, J.-Y., and Choi, B. -C.: The features of aerosol inSeoul by Asian dust and haze during springtime from 1998 to2002, J. Korean Meteorol. Soc., 39, 459–474, 2003.
Coude-Gaussen, G., Rognon, P., Bergametti, G., Gomes, L.,Strauss, B., Gros, J. M., and Le Coustumer, M. N.: Saharan dust
on Fuerteventura Island (Canaries): Chemical and mineralogi-cal characteristics, air mass trajectories, and probable sources,J. Geophys. Res.-Atmos., 92, 9753–9771, 1987.
Dentener, F. J., Carmichael, G. R., Zhang, Y., Lelieveld, J., andCrutzen, P. J.: Role of mineral aerosol as a reactive surface inthe global troposphere, J. Geophys. Res.-Atmos., 101, 22869–22889, 1996.
Díaz-Hernández, J. L., and Párraga, J.: The nature and tro-pospheric formation of iberulites: Pinkish mineral micro-spherulites, Geochim. Cosmochim. Acta, 72, 3883–3906, 2008.
Dockery, D. W., Pope, C. A., Xu, X., Spengler, J. D., Ware, J. H.,Fay, M. E., Ferris Jr., B. G., and Speizer, F. E.: An associationbetween air pollution and mortality in six US cities, New Engl.J. Med., 329, 1753–1759, 1993.
Fletcher, R. A., Ritchie, N. W. M., Anderson, I. M., and Small, J. A.:Microscopy and microanalysis of individual collected particles,in: Aerosol Measurement, edited by: Kulkarni, P., Baron, P. A.,and Willeke, K., Wiley, printed in the USA, 179–232, 2011.
Ginoux, P.: Effects of nonsphericity on mineral dust modeling, J.Geophys. Res.-Atmos., 108, 4052, doi:10.1029/2002JD002516,2003.
Glaccum, R. A. and Prospero, J. M.: Saharan aerosols over the trop-ical north Atlantic – Mineralogy, Mar. Geol., 37, 295–321, 1980.
Goudie, A. S. and Middleton, N. J.: Saharan dust storms: nature andconsequences. Earth Sci. Rev., 56, 179–204, 2001.
Hong, S. J., Kim, J. H., and Ha, J. S.: Possibility of applying infraredbackground threshold values for detecting Asian dust in springfrom geostationary satellite, Korean J. Remote Sens., 26, 387–394 (in Korean), 2010.
Husar, R. B., Tratt, D. M., Schichtel, B. A., Falke, S. R., Li, F.,Jaffe, D., Gassó, S., Gill, T., Laulainen, N. S., Lu, F., Reheis, M.C., Chun, Y., Westphal, D., Holben, B. N., Gueymard, C., McK-endry, I., Kuring, N., Feldman, G. C., McClain, C., Frouin, R.J., Merrill, J., DuBois, D., Vignola, F., Murayama, T., Nickovic,S., Wilson, W. E., Sassen, K., Sugimoto, N., and Malm, W. C.:Asian dust events of April 1998, J. Geophys. Res.-Atmos., 106,18317–18330, 2001.
In, H. -J. and Park, S. -U.: A simulation of long-range transport ofYellow Sand observed in April 1998 in Korea, Atmos. Environ.,36, 4173–4187, 2002.
Jeong, G. Y.: Bulk and single-particle mineralogy of Asian dust anda comparison with its source soils, J. Geophys. Res.-Atmos., 113,D02208, doi:10.1029/2007JD008606, 2008.
Jeong, G. Y. and Chun, Y.: Nanofiber calcite in Asian dustand its atmospheric roles, Geophys. Res. Lett., 33, L24802,doi:10.1029/2006GL028280, 2006.
Jeong, G. Y. and Lee, K. -S: A mineral tracer toward high-resolutiondust provenance on the Chinese Loess Plateau: SEM, TEM, andsulfur isotopes of sulfate inclusions in biotite, Am. Mineral., 95,64–72, 2010.
Jeong, G. Y., Hillier, S., and Kemp, R. A.: Quantitative bulk andsingle-particle mineralogy of a thick Chinese loess–paleosol sec-tion: implications for loess provenance and weathering, Quater-nary Sci. Rev., 37, 1271–1287, 2008.
Jeong, G. Y., Hillier, S., and Kemp, R. A.: Changes in mineralogy ofloess–paleosol sections across the Chinese Loess Plateau, Quat.Res., 75, 245–255, 2011.
Atmos. Chem. Phys., 14, 505–521, 2014 www.atmos-chem-phys.net/14/505/2014/
G. Y. Jeong et al.: Long-range transport of giant particles in Asian dust 521
Jeong, G. Y., Choi, J. -H., Lim, H. S., Seong, C., and Yi, S. B.: De-position and weathering of Asian dust in Paleolithic sites, Korea,Quat. Sci. Rev., 78, 283–300, 2013.
Kanayama, S., Yabuki, S., Yanagisawa, F., and Motoyama, R.:The chemical and strontium isotope composition of atmosphericaerosols over Japan: the contribution of long-range-transportedAsian dust (Kosa), Atmos. Environ., 36, 5159–5175, 2002.
Kandler, K., Benker, N., Bundke, U., Cuevas, E., Ebert, M., Knip-pertz, P., Rodríguez, S., Schütz, L., and Weinbruch, S.: Chemicalcomposition and complex refractive index of Saharan MineralDust at Izaña, Tenerife (Spain) derived by electron microscopy,Atmos. Environ., 41, 8058–8074, 2007.
Kim, S.-W., Yoon, S.-C., and Kim, J.: Columnar Asian dust particleproperties observed by sun/sky radiometers from 2000 to 2006in Korea. Atmos. Environ., 42, 492–504, 2008.
Kim, S.-W., Yoon, S. -C., Kim, J., Kang, J.-Y., and Sugimoto, N.:Asian dust event observed in Seoul, Korea, during 29–31 May2008: Analysis of transport and vertical distribution of dust par-ticles from lidar and surface measurements, Sci. Total Environ.,408, 1707–1718, 2010.
Korea Meteorological Administration (KMA):http://web.kma.go.kr/eng/weather/asiandust/timeseries.jsp(last access: 7 November2013), 2013.
Laskin, A., Wietsma, T. W., Krueger, B. J., and Grassian, V.H.: Heterogeneous Chemistry of Individual Mineral Dust Par-ticles with Nitric Acid: A Combined CCSEM/EDX, ESEM,and ICP-MS Study, J. Geophys. Res.-Atmos., 110, D10208,doi:10.1029/2004JD005206, 2005.
Legrand, M., Plana-Fattori, A., and N’doumé, C.: Satellite detectionof dust using the IR imagery of Meteosat: 1. Infrared differencedust index, J. Geophys. Res.-Atmos., 106, 18251–18274, 2001.
McKendry, I. G., Macdonald, A. M., Leaitch, W. R., van Donkelaar,A., Zhang, Q., Duck, T., and Martin, R. V.: Trans-Pacific dustevents observed at Whistler, British Columbia during INTEX-B, Atmos. Chem. Phys., 8, 6297–6307, doi:10.5194/acp-8-6297-2008, 2008.
Meskhidze, N., Chameides, W. L., and Nenes, A.: Dust and pollu-tion: a recipe for enhanced ocean fertilization, J. Geophys. Res.-Atmos., 110, D03301, doi:10.1029/2004JD005082, 2005.
Mikami, M., Shi, G.Y., Uno, I., Yabuki, S., Iwasaka, Y., Yasui, M.,Aoki, T., Tanaka, T.Y., Kurosaki, Y., Masuda, K., Uchiyama,A., Matsuki, A., Sakai, T., Takemi, T., Nakawo, M., Seino, N.,Ishizuka, M., Satake, S., Fujita, K., Hara, Y., Kai, K., Kanayama,S., Hayashi, M., Du, M., Kanai, Y., Yamada, Y., Zhang, X. Y.,Shen, Z., Zhou, H., Abe, O., Nagai, T., Tsutsumi, Y., Chiba,M., and Suzuki, J.: Aeolian dust experiment on climate impact:An overview of Japan–China joint project ADEC, Global Planet.Change, 52, 142–172, 2006.
Mori, I., Nishikawa, M., Tanimura, T., and Quan, H.: Change insize distribution and chemical composition of kosa (Asian dust)aerosol during long-range transport, Atmos. Environ., 37, 4253–4263, 2003.
National Meteorological Satellite Center:http://nmsc.kma.go.kr/html/homepage/en/main.do(last access: 7 November 2013),2013.
Park, S.-U. and Kim, J. -W.: Aerosol size distributions observed atthe Seoul National University campus in Korea during the Asiandust and non-Asian dust periods, Atmos. Environ., 40, 1722–1730, 2006.
Park, S.-U., Chang, L.-S., and Lee, E.-H.: Direct radiative forcingdue to aerosols in East Asia during a Hwangsa (Asian dust) eventobserved on 19–23 March 2002 in Korea, Atmos. Environ., 39,2593–2606, 2005.
Prospero, J. M., Bonatti, E., Schuber, C., and Carlson, T. N.: Dustin the Caribbean traced to an African dust storm, Earth Planet.Sci. Lett., 9, 287–293, 1970.
Pye, K.: The nature, origin and accumulation of loess, QuaternarySci. Rev., 14, 653–667, 1995.
Reid, J. S., Jonsson, H. H., Maring, H. B., Smirnov, A., Savoie,D. L., Cliff, S. S., Reid, E. A., Livingston, J. M., Meier, M. M.,Dubovik, O., and Tsay, S. C.: Comparison of size and morpho-logical measurements of coarse mode dust particles from Africa,J. Geophys. Res., 108, doi:10.1029/2002JD002485, 2003.
Reist, P. C.: Aerosol Science and Technology, McGraw-Hill, NewYork, 1993.
Seinfeld, J. H. and Pandis, S. N.: Atmospheric Chemistry andPhysics, John Wiley, Hoboken, NJ, 2006.
Seinfeld, J. H., Carmichael, G. R., Arimoto, R., Conant, W. C.,Brechtel, F. J., Bates, T. S., Cahill, T. A., Clarke, A. D., Doherty,S. J., Flatau, P. J., Huebert, B. J., Kim, J., Markowicz, K. M.,Quinn, P. K., Russell, L. M., Russell, P. B., Shimizu, A., Shi-nozuka, Y., Song, C. H., Tang, Y., Uno, I., Vogelmann, A. M.,Weber, R. J., Woo, J. -H, and ZhanG, X. Y.: ACE-ASIA regionalclimatic and atmospheric chemical effects of Asian dust and pol-lution, B. Am. Meteorol. Soc., 85, 367–380, 2004.
Shi, Z., Shao, L., Jones, T. P., and Lu, S.: Microscopy and min-eralogy of airborne particles collected during severe dust stormepisodes in Beijing, China, J. Geophys. Res., 110, D01303,doi:10.1029/2004JD005073, 2005.
Shin, J.-B., Yu, K.-M., Naruse, T., and Hayashida, A.: Study onloess-paleosol stratigraphy of Quaternary unconsolidated sedi-ments at E55S20-IV pit of Chongokni Paleolithic site, Journal ofthe Geological Society of Korea, 41, 369–381 (in Korean withEnglish abstract), 2004.
Song, Y.-C., Eom, H. -J., Jung, H.-J., Malek, M. A., Kim,H. K., Geng, H., and Ro, C.-U.: Investigation of aged Asiandust particles by the combined use of quantitative ED-EPMAand ATR-FTIR imaging. Atmos. Chem. Phys., 13, 3463–3480,doi:10.5194/acp-13-3463-2013, 2013.
Sullivan, R. C., Moore, M. J. K., Petters, M. D., Kreidenweis, S. M.,Roberts, G. C., and Prather, K. A.: Effect of chemical mixingstate on the hygroscopicity and cloud nucleation properties ofcalcium mineral dust particles, Atmos. Chem. Phys., 9, 3303–3316, doi:10.5194/acp-9-3303-2009, 2009.
Tegen, I., and Lacis, A. A.: Modeling of particle size distribu-tion and its influence on the radiative properties of mineral dustaerosol, J. Geophys. Res., 101, 19237–19244, 1996.
Weaver, C. E.: Clays, Muds, and Shales, Elsevier, Amsterdam, TheNetherlands, 1989.
Westphal, D. L., Toon, O. B., and Carlson, T. N.: A two-dimensionalnumerical investigation of the dynamics and microphysics of Sa-haran dust storms, J. Geophys. Res., 92, 3027– 3049, 1987.
Windom, H. L.: Eolian contributions to marine sediments. J. Sedi-ment. Petrol., 45, 520–529, 1985.
www.atmos-chem-phys.net/14/505/2014/ Atmos. Chem. Phys., 14, 505–521, 2014