long term economic impact of the natural resources and
TRANSCRIPT
Southern Illinois University CarbondaleOpenSIUC
Research Papers Graduate School
2013
Long Term Economic Impact of the NaturalResources and Human Capital on the Growth RateIbrahima [email protected]
Follow this and additional works at: http://opensiuc.lib.siu.edu/gs_rp
This Article is brought to you for free and open access by the Graduate School at OpenSIUC. It has been accepted for inclusion in Research Papers byan authorized administrator of OpenSIUC. For more information, please contact [email protected].
Recommended CitationCoulibaly, Ibrahima, "Long Term Economic Impact of the Natural Resources and Human Capital on the Growth Rate" (2013).Research Papers. Paper 399.http://opensiuc.lib.siu.edu/gs_rp/399

LONG TERM ECONOMIC IMPACT OF THE NATURAL RESOURCES AND HUMAN
CAPITAL ON THE GROWTH RATE.
by
Ibrahima COULIBALY
BS, Southern Illinois University, 2006
MS, Southern Illinois University, 2010
A Research paper
Submitted in Partial Fulfillment of the Requirements for the
Master of Arts.
Department of Economics
in the Graduate School
Southern Illinois University Carbondale
May 2013
RESEARCH PAPER APPROVAL
LONG TERM ECONOMIC IMPACT OF THE NATURAL RESOURCES AND HUMAN
CAPITAL ON THE GROWTH RATE.
By
Ibrahima COULIBALY
A Research paper Submitted in Partial
Fulfillment of the Requirements
for the Degree of
Master of Arts
in the field of Economics
Approved by:
Dr. AKM Mahbub Morshed
Graduate School
Southern Illinois University Carbondale
May 2013

i
AN ABSTRACT OF THE RESEARCH PAPER OF
IBRAHIMA COULIBALY, for the MASTER OF ARTS degree in ECONOMICS, at Southern
Illinois University Carbondale.
TITLE: LONG TERM ECONOMIC IMPACT OF THE NATURAL RESOURCES AND
HUMAN CAPITAL ON THE GROWTH RATE.
MAJOR PROFESSOR: Dr. AKM Mahbub Morshed
They have been growing debate among economists and others social-scientists about the
relationship between natural resources and human capital and growth. Although most economists
agreed, in short run that natural resources do impact growth negatively through human capital.
But, the long term relationship seems to be unsettled, and they have not been too many studies
focus on the long term equilibrium between natural resources and human capital. Therefore, this
paper aims to contribute in growth literature, by studying at the long term relationship between
natural resources, human capital, and growth, using Mali as a case study. Natural resource seems
to exert positive effect on human capital over time, and the negative effect on growth decline in
the long horizon.

ii
ACKNOWLEDGMENTS
I would like to thank my research advisor Dr. AKM Mahbub Morshed for helping me get
through my research paper. My special thanks to my family (Wife, and kids) for support me get
through my master degree.

iii
TABLE OF CONTENTS
CHAPTER PAGE
ABSTRACT .................................................................................................................................... i
ACKNOWLEDGMENTS .............................................................................................................. ii
LIST OF TABLES ......................................................................................................................... iv
LIST OF FIGURES .........................................................................................................................v
CHAPTERS
CHAPTER I – Introduction .............................................................................................................1
CHAPTER II – Literature Review ..................................................................................................4
Section A-Resource curse ................................................................................................................4
Section B-Human capital and Resource curse .................................................................................6
CHAPTER III – Intuitive Economic Value .................................................................................... 9
CHAPTER IV-DATA....................................................................................................................11
CHAPTER V-Empirical Approach ................................................................................................12
Section A-Sub-Sahara Africa.........................................................................................................12
Section B-Mali……………...........................................................................................................13
CHAPTER VI-Empirical Results..................................................................................................14
Section A- Sub-Sahara Africa........................................................................................................14
SectionB-Mali's..............................................................................................................................17
CHAPTER VII-Conclusions and Recommendation......................................................................23
Data Appendix ..............................................................................................................................26

iv
LIST OF TABLES
TABLE PAGE
Table 1- The growth effects of human capital and natural resources ............................................16
Table 2- Long-run equilibrium between growth and Human capital and Natural resources .. ......19
Table 3- The Effect of natural resources rent and public spending on education over human
capital ............................................................................................................................................21

v
LIST OF FIGURES
FIGURE PAGE
Figure 1- Long run association between natural resource and human capital over time...............20

1
CHAPTER 1: INTRODUCTION
As natural resources curse debate continues among growth economists that the main
cause (transmission channels) remain unsettled. Natural resources endowment has been the main
catalysis for many developed countries such as United States, Canada, Australia, and
Scandinavia region. According to many growth economists, abundance of the natural resources
endowment should promote economic growth. According to Stevens, 2003, study, argued that
natural resources should produce revenues to enhance economic growth and development; the
revenues obtained from endowment should provide capital which can alleviate foreign exchange
fluctuation, an important barrier to economic growth. At the very minimum, the presence of
natural resources should not slow economic development growth (Stevens, 2003). Despite,
natural resources abundance in many countries, the general feeling about the resources
endowment seems to be mixed blessing (Gylfason, 2000). Many studies have shown that there is
a negative correlation between resource abundance and growth rate. These negative relationships
between natural resources abundance and growth rate is called „the resource curse, which studies
were conducted by Sachs and Warner (1985, 1997, &2007).
According to many economists that the presence of natural resources does not stop
economic growth, but natural resource abundance do encourages certain alterations in the
economy indices, which in turn affect economic growth. Previous literature, such as, Alexis
Manning, 2004, study attributes the resource curse to long-term declines in terms of trade,
primary export revenue volatility, Dutch Disease, crowding out effects, government
mismanagement, corruption, as well as low levels of human capital, which was associated with
mixed results. Despite overwhelming support among growth economists on the existence of
resource curse, the main cause remains an unsettled issue among researchers (Gylfason, 2000).

2
This study examines the relationships between natural resources abundance, human
capital, economic growth and level of income in sub-Saharan Africa. This study also examines
long term relationships between natural resources abundance, human capital, and level of
income, utilizing the context of Mali as a focal point. Gold production has brought revenues to
Mali but it has not induced dominant effects on other industries nor improved regular Malian
life. Developing countries, in general, have higher rates of child labor and higher repeater rates in
schools, according to the study done by Thorvaldur Gylfason in 2000. The same study, state, that
quantity and quality of education tends to move comparative advantage away from primary
production (such as agriculture, fisheries, and mining), and toward manufacturing and services,
the latter which accelerate learning by doing and economic growth (Gylfason, 2000). Other
studies ,such as, Barro and Lee's,2000, which study points out, that human capital obtained
through education have the greatest impact on economic growth progress. As previous studies
that found a positive relationship between human capital and growth seems to point out, that
increases in human capital accumulation will increase worker productivity, therefore induced
more growth.
This study hypothesizes that if natural resources can function as subsidies to increase the
stock of human capital by boosting quality and quantity of education in Mali (especially in rural
Mali), then the reduction of income inequality, a poverty reduction tool, will be realized, and the
growth rate will also become steady. This study seeks to examine the existence of the natural
resource curse at least in the short run among Sub-Saharan Africa countries.
In order to address these hypotheses, this study is organized in the following way: 2)
Section 2 focuses on the literature review, which has two parts. The first part, part A, is on the
resource curse literature, which explains different transmission channels at which natural

3
resources have negative impacts on growth. Part B of the literature review emphasizes the long
term relationship between human capital and growth, given that natural resources are controlling
in the model. 3) Section 3 of this study gives intuitive economic values. 4) Section 4 focuses on
the composition of the data. 5) Section 5 is about the methodology, which has two components.
Part A used OLS (Ordinary least square) techniques to get cross-sectional regression for Sub-
Saharan Africa. Part B of section 4 utilized Malian data collected over a 33 year period; this
study will seeks to confirm the existence of long term relationship between natural resources and
human capital accumulation. 6) Section 6 contains the results of the study. 7) Section 7 contains
the conclusions and the implications part of this study for the Sub-Saharan region in general, and
for Mali in particular.
4
CHAPTER II: LITERATURE REVIEW
Section A: Resource Curse
In recent decades, most of the empirical evidence from the resource curse literature
agrees that there is an inverse relationship between natural resource abundance and economic
growth in developing countries (Auty, 1997; Sachs, 1995). Sachs and Warner (1995, 1999, and
2000) analyze the relationship between natural resource abundance reliance and economic
growth. Sachs and Warner ,1995,&1997,2000,studies examine 95 developing countries, using
natural resource abundant countries that only achieve a slight, 2% annual GDP Growth rate from
1970-1989, as the threshold for a resource curse. Sachs and Warner, 1997, study, define natural
resource abundance as a ratio of primary products to exports over GDP to 1970, which used SXP
as a proxy for natural resources. Their empirical studies have shown a negative correlation
between resource abundance and growth rate, a phenomenon closely associated with the concept
of the resource curse (Sachs and Warner).
According to Sachs and Warner, natural resource abundance encourages rent-seeking,
corruption, and poor government management. It has also encouraged developing countries to
engage in protectionist paths through state-led projects of development, in fear to fight against
the “Dutch disease effects of the resource abundance” (Sachs and Warner). Countries with a lot
of natural endowments would encounter higher overall demand and higher relative prices of non-
traded commodities. Natural resource endowment leads to increase of overall demand, which
shifts labor far from learning by doing sectors and lowers growth in labor productivity.
Sachs and Warner's results showed that resource intensity is strongly correlated to
variable institutional quality and broad policy. The results of their studies also point out that
resource abundance impedes the manufacturing sector, as in the Dutch Disease. As

5
manufacturing gets hurt, countries respond with protectionist measures to promote
industrialization, which in turn hurts growth (Sachs and Warner, 1995, 1999, 2000). Sachs and
Warner's studies used different transmission channels, with variables such as SXP as a proxy for
variables natural resources, (SOPEN) as a proxy for rate of openness, (LINV), as a proxy for
variable investment, rule of law, investment deflator over GDP deflator in 1970 (logarithm GDP
of 1970), and regressions over average annual growth in real GDP, divided by the economically
active population between the years 1970 and 1990.
Sachs and Warner, 1997, results find that overall; natural resources still have negative
impacts on growth. Indeed, all the other variables claimed to be important by other studies were
still robust and remaining important to explain cross country growth. Despite different
econometrics techniques, utilizing different transmission channels, most results of these studies
still show that there is a negative correlation between natural resources and economic growth.
Furthermore, Alexis Manning's, 2004, study investigates the relationship(s) between
natural resource abundance, human capital, and economic growth. The results of his study show
that there is a negative correlation between human capital (measured as a literacy rate) and
resource abundance (arable land use as a proxy). According to Manning, this strongly supports
the presence of a “resource curse”.
Elissaios and Reyer, 2004, study examines the direct and indirect impacts of natural
resource abundance on economic growth. This study looks at the transmission channels through
which natural resources abundance impacts other economic indices (such as corruption,
openness, and terms of trade, schooling, and investment). Elissaios and Reyer's study used
Sachs and Warner's variable economic growth (based on average annual growth in real GDP per
person from 1975 to 1996) as a dependent variable, and run several regressions. The results of

6
Elissaios and Reyer's, 2004, results show that natural resources have negative effects on growth
in the absence of other economic indices, but there is a positive direct impact on growth in the
presence of each of several transmission channels, including corruption, investment, openness,
terms of trade, and schooling.
Other study focus on the positive relationship between growth and other transmission
channels, such as Paul Stevens‟, 2004, study, which study chooses countries that may be at risk
of experiencing the 'resource curse' or may benefit from resource endowment. Study selected 4
countries (Botswana, Chile, Indonesia, and Malaysia) based on their export revenues from fuel or
minerals, which exceeded 30 percent of their total merchandise exports. Stevens' ,2004, paper,
find that there is a positive impacts of natural resource endowment on the economies of these
four different countries ,which gives a different results than Sachs and Warner,1997, &2000,
studies . According to Stevens, 2004 study, which points out that the four suspect countries on
the verge of being cursed or blessed did quite well compared to other countries. These four
countries also did well in relation to the regional income benchmarks. The study pointed out that
Botswana did well compared to the Asian Tigers in the period 1965-2000, and in the meantime,
Chile did better than the rest of the Latin American region and the Upper Middle Income
countries (Stevens, 2004).
Elissaios and Reyer (2004)‟s study also points out ,that there is a strongly positive impact
of natural resources abundance on economic growth when including each of the transmission
channels; furthermore, the investment channel seems to be the most important.
Section B: Human Capital and Resource Curse
Barro and Lee, 2000, study, define human capital as set of skills, knowledge and
productivity of workers. Since, beginning of industrialization, human capital has been considered

7
as an engine of development because it foster productivity, learning by doing, which is obtained
through education . Human capital seems to have a greater impact in the economic development
than any other economic indices(Gylfason; Barro, Lee; Ortega and Gregorio;2000;2001;2002) .
According to Barro and Lee, 2000, study, a greater amount of education attainment indicates
more skilled and more productive labor, which in turn increases economic growth. As education
attainment seem to have a positive strong effect on social outcomes, such as child mortality,
fertility, education of children, and income distribution . In most of the developed countries that
human capital acquired through education seems to fulfill an important role for economic
development. According to Auty, 2001, study, human capital instead of natural resources or
physical capital has the greatest influence on economic growth. Other studies, such as, Gylfason,
2000, which study state that quantity and quality education tend to give comparative advantage
to manufacturing and services over primary production (such as agriculture, fisheries, and
mining). Also, Ortega and Gregorio, 2002, study asserts that the negative effect on growth rate
can be improved over time by accumulating a large level of human capital. Their study also
assumes that a resource-rich endowment country begins with high levels of income, increases its
human capital accumulations and then growth speeds up. The results of this study also indicate
that natural resources are harmful to economic growth in countries with low human capital
accumulation. This effect is due to the fact that natural resources attract resources from other
economic sectors capable of stimulating more economic growth. Nonetheless, as the process of
development continues, the presence of higher human capital accumulation may reduce this
effect. Therefore, according to Ortega and Gregorio, 2002, study, that the negative effects of
natural resources on growth could be offset through human capital accumulation.
8
In other hand, there are many other studies that find a negative relationship between
natural resources and human capital, which in turn reduces growth. For instance, Patrick K. Asea
and Amartya Lahiri, 1999, study examines the effects of natural resources and growth by using a
two sector, which is an endogenous growth model where human capital stimulates growth.
According to Asea, and Lahiri, 1999, study, in the presence of the increasing of economic
incentives for unskilled labor, natural resources have negative impacts on schooling.
This study states that as long there are complementary inputs in the production process
between factor labor and natural resources abundance, increases in natural resources raise the
labor wage. Asea and Lahiri, 1999, run several regressions. The results of this study suggest that
natural resources might have negative impacts on human capital accumulation if there is greater
complementarity between natural resources and unskilled labor than skilled labor (human capital
accumulation sector).

9
CHAPTER III: INTUITIVE ECONOMIC VALUE
Although many resources curse studies include Sub-Sahara Africa; fewer have look
impact of human capital accumulation on growth, given natural resources are in the model, in the
context of sub-Saharan Africa . This study examines the relationships between natural resources
abundance, human capital, economic growth and level of income in sub-Saharan Africa. This
study seeks to examine the existence of the natural resource curse at least in the short run among
Sub-Saharan Africa countries. This study also examines long term relationships between natural
resources abundance, human capital, and level of income, utilizing the context of Mali as a focal
point.
According to the IMF ranking, Mali is one of the poorest countries in the world, and it
also ranks 111th
out of 180 countries with a score of 2.8 out of 10 grade index establish by
Transparency International, which is based on perceptions of corruption by national and
international experts (risk agencies, country analysts) and business leaders (Manguy, 20011).
Mali gold production has brought revenues to the government but it has not induced
dominant effects on other industries nor improved regular Malian life. According to Manguy,
2011, study, state, that gold exploitation in Mali brought enormous revenues stream to the
government, but it also brought enormous environmental and social degradation to Mali that is
ignored by elect officials. Mali can be categorized as being natural resource abundant, since gold,
having become a key economic sector, represents 14.3% of its GDP and 72% of its exports in
2007 (IMF, 2006, 2007 ) . Mali also has one of the poorest human capital indicators among Sub-
Sahara countries, based on the World Bank database indicators.
Therefore, this study hypothesizes that if natural resources can function as subsidies to
increase the stock of human capital by boosting quality and quantity of education in Mali

10
(especially in rural Mali), then the reduction of income inequality, a poverty reduction tool, will
be realized, and the growth rate will also become steady.

11
CHAPTER IV: DATA
This study collected the secondary data from World Bank indicators database. The
timeframe of data was from 1980 to 2012.Variables chosen are based on the specification done
by Asea and Lahiri's, 2000. In this study, the dependent variable is GR8011, defined as average
annual growth rate in real GDP per midyear population between 1980 and 2011, according to
World Bank database indicators.
Due to the problem of missing data, the mean average was taken to replace the missing
data at each point of time for each Sub Saharan African country. Some countries were eliminated
due to inefficient data collected, including Somali, Eritrea, Mauritius, etc. For the sub-Saharan
table, this study defined the variables based on the specifications done by Asea and Lahiri, which
in turn have looked at Sachs and Warner's, and Barro and Lee's data set specification approach.
The dependent variable is real growth per capita annually, according to original computation
done by Sachs and Warner (1985).
For Mali, this paper is based on the idea that education is an engine of long term growth.
Therefore, the dependent variable is a difference of log of real GDP, PPP, adjusted (constant)
between current year and the previous year; which data were collected from the World Bank
database. According to Gylfason's (2000), study, “More and better education is a prerequisite for
rapid economic development around the world.”

12
CHAPTER V: EMPIRICAL APPROACH
Section A: Sub-Saharan Africa (Cross-Sectional Approach)
This study runs several regressions, based on the empirical approach of Asea and Lahiri,
but applying to Sub-Saharan Countries, this regression show as the following:
First regression:
Regress the growth rate between 1980 and 2011(GR8011) against the secondary
enrollment rate in 1980 and 2011(ENROLLS), as well as investment (INVSH), given that the
factor, initial income per economically active person in 1980 (LGDP), is in the model.
Second Regressions:
Regress the growth rate between 1980 and 2011 (GR8011) against the secondary
enrollment rate in 1980 (ENROLLS), investment (INVSH), term of trade 1980 and 2011 (TOT)
given the factor initial income per economically active person in 1980 (LGDP) is in the model.
Third Regressions:
Regress the growth rate between 1980 and 2011 (GR8011) against the secondary
enrollment rate in 1980 (ENROLLS), investment (INVSH), term of trade 1980 and 2011 (TOT)
and natural resources (SXP) based on Sachs and warner definition, also given the factor initial
income per economically active person in 1980 (LGDP) is in the model.
Fourth Regressions:
Regress the growth rate between 1980 and 2011 (GR8011) against the secondary
enrollment rate in 1980 (ENROLLS). Investment (INVSH), term of trade 1980 and 2011 (TOT)
and natural resources (SXP) and openness, also given the factor initial income per economically
active person in 1980 (LGDP) is in the model.
Robustness:

13
Regress the growth rate between 1980 and 2011 (GR8011) against the secondary
enrollment rate in 1980 (ENROLLS), investment (INVSH), term of trade 1980 and 2011 (TOT)
and natural resources (SXP) and openness, also given the factor initial income per economically
active person in 1980 (LGDP) is in the model.
Section B: Mali (Time-Series Approach)
This study also looks at the Mali case, to see if there is any long term relationship
between real GDP, PPP adjusted (constant), and SXP and ENROLS, given other economic
indices are in the model (such as INVSH, TOT, and SOPEN). Malian data collected over a 33
year period; this study ran the Dickey Fuller unit root test to see whether the series contains unit
root. This study assume the error terms are no correlated over time, since the log differential is
taking for the dependent variable real growth rate , given log of initial income is controlling in
the model. Then, this study run robustness test as a regression to see long term relationship
between growth rate and human capital given natural resources, investment, openness, and term
of trade are controlling in the model. In the Mali case, this study's hypothesis is that there are
long term relationships between real growth rates per capita adjusted to inflation and human
growth, given natural resources in the model.

14
CHAPTER VI: EMPIRICAL RESULTS
Section A: Empirical Results on Sub-Sahara Africa
In this model, human capital stock is the main transmission channel that affects growth in
the presence of natural resources. As natural resource curse theorists suggest, human capital will
lose is explanatory power to explain growth rates, given the level of natural resources in the
model. This seems to be the case in Sub-Saharan, rich resource economies. To test the prediction
about natural resources (SXP) having a curse to Sub-Saharan Africa countries, this study starts
with regression 1, in which investment variable (INVSH) and human capital variable (ENROLS)
enters in regression, respectively as positive signs and negative signs. Regression 1 results
suggest that variable INVSH changes signs to negative signs and it is almost significantly, while
ENROLS variables stays negative but has insignificant explanatory power. In the regression 2,
this study add variable SXP to the previous regression, the results shows that INVSH keeps
positive signs and has significant explanatory power. ENROLS still has a negative relationship
with growth rates when added to variable SXP. Because of the negative sign of variable SXP, and
ENROLS staying negative, these results seem to suggest the presence of the curse.
Natural resources are defined as the share of primary products in GNP in 1970, but in this
study we use natural resources as the share of primary products in GDP in 1980 (since the data
collected come from the World Bank database). Primary products are defined as fuels and non-
fuel products, according to Sachs and Warner's (1995) data definition. To test the robustness of
this theory, this study adds the variable openness (SOPEN), to control for the effects of trading
regimes and external policies, based on Asea and Lahiri,1999, empirical study approach.
Regression 3 results show that the INVSH variable is still positive and significant. Perhaps
domestic investment is still an important factor to explain growth. ENROLS keeps its negative

15
sign in the presence of openness. Perhaps openness creates private externality of school. SXP
keeps its negative sign and has significant explanatory power. For more robustness tests, this
study adds term of trade shock.
This results in the regression 4, which shows that the INVSH variable stays positive and
keeps significant power to explain growth. The ENROLS variable, surprisingly, becomes
positive but insignificant. According to Asea and Lahiri, 1999, the steady growth rate under
governments and policy makers is greater than the steady growth rate under competitive
solutions in the presence of externalities. Increases in capital to specific sectors induce the
government to reduce labor supply and increase schooling, therefore increasing the growth rate,
according to Asea and Lahiri‟s, 1999. Perhaps this is the case for sub-Saharan countries, where
the governments try to fight the Dutch disease theory, by increasing schooling, in order to induce
growth. In the regression 4, also, the variables, SXP, and INVSH keep their respective signs and
they‟re still significant. This indicates that natural resources (SXP) and domestic investment
(INVSH) are still dominant explanatory factors when it comes to explaining the growth rate.

16
Table1:The growth effects of human capital and natural resources
Dependent variables: GR8012
(1) (2) (3) (4)
LGDP 0.0012 0.0016 0.0017 0.0021
(-0.449) (-0.678) (-0.718) (-0.866)
ENROLS 0.00002 0.00003 0.00001 0.00006
(-0.170) (-0.293) (-0.129) (0.114)
INVSH 0.00036 0.00039 0.00038 0.00037
(1.595**) (1.833**) (1.836**) (1.795**)
SXP -0.00021 -0.0002 -0.00019
(-3.174**) (-2.947**) (-2.800**)
SOPEN 0.00013 0.00017
(0.548) (0.699)
TOT 0.00012
(1.253)
CONSTANT 0.059395 0.059395 0.066185 0.043807
(2.406) (2.887) (1.696) (1.397)
R-SQAURED 0.35 0.41 0.5 0.51
SE 0.01614 0.01482 0.01456 0.014660
F-TEST 7.290** 8.343** 7.622** 6.332**
OBSERVATION 43 43 43 43
Note: T-ratio appears on the brackets of each column
** (level of significant at 5% and 10%)

17
This result confirm the presence of natural resources curse theory, in the meantime,
regression 4, also shows that natural resources do not necessarily impede growth. As Sub-
Saharan countries' primary commodities exports get higher in relation to their GDP, they begin
to be more open to world trade, and therefore the production externality of human capital will get
higher since the returns to schools are lower compared to wage earnings by the natural resources
sector. So, the solution is that Sub-Saharan African governments should utilize their mineral
revenue in subsidies to promote education, which eventually induces growth.
Section B: Empirical Results on Mali
The results of this study in Table 2 below shows that there is a long–term relationship
between growth rates, natural resources and human capital accumulation, since there is no
presence of unit root. Perhaps, the externality of human capital will decrease over time when
natural resources are used to promote quality and quantity of schooling. As a country like Mali
accumulates higher human capital stocks, the negative effects of natural resources on growth
decline over time, which is shown in the Table 2.
In this table, the variable SXP enters with a negative sign, but loses the negative sign over
time. Perhaps the natural resources and labor are not complementary in Mali's case, but instead,
perhaps increases in the natural resources have little effect on attracting labor from other sectors.
This is the case for Mali, since mining sector only utilized 10% of total employment, according
to IMF, 2006, reports. Therefore, natural resources may be used as investment to increase income
levels in Mali, since the returns to schooling are higher when natural resources are utilized as
subsidies to promote quality education. The variable openness keeps its initial negative sign but
does not gain significant explanatory power over time. The variable term of trade shock keeps its

18
negative sign and still has significant negative explanatory power over growth in long periods. In
the long run, the variable investment becomes negative and insignificant.
Perhaps, poor countries like Mali that depend on foreign investment may need more
foreign and domestic investment to promote future industries that involve learning by doing.
The Variable ENROLS has a positive sign but statistically insignificant, perhaps if natural
resources and foreign investment used as subsidies to build quality and quantity education in
Mali, then future generation in Mali may see their livelihood improved. Although, the marginal
effect of each individual variable were insignificant, the overall test was significant. It could be
that there is other issue needs to be looking at econometrics wise, or the missing data effect,
which issue are beyond the scope of this study.
In this study, all the explanatory variables (ENROLS, SXP, INVSH, TOT) come out
positive except SOPEN, and 42 percent of variation on growth rate can be explained by these
five variables. The overall model is statistically significant given initial income is in model.
Perhaps, all these variables above needs to be including in the model, to see the long term
stability between growth rate, natural resources and human capital accumulation.

19
Table2: Long-run equilibrium between growth and Human capital and Natural
resources
INDEPENDENT
VARIABLES COEFFICIENT T-STATISTIC
LGDP 0.005 1.29
ENROLS 0.00008 0.85
INVSH 0.0002 1.68**
SXP 0.003 1.32
SOPEN -0.004 -0.07
TOT 0.00007 1.38
ADJUSTED
R-SQURED 0.42
OVERALL F-TEST 3.22**
TIME PERIOD (1980-2012
Note: F-test represents overall goodness of fit
** (level of significant at 5% and 10%)
R-squared (level of variation)
Also, the figure 1 gives indication , variables natural resources rent as represent by
SXP2, and variables human capital (such as ENROLS ) have positive slope.

20
Figure 1: Long run association between Natural resource and Human capital over time
This long run positive association between variable natural resources rent (express as SXP2) ,
and variables human capital may indicates, as natural rent increases that there needs to be
deliberated affords from the Malian governments to improve quality of schooling by utilized
natural resources rent money.
The results of table 4 below, shows that log of natural resources and log of public
spending on education have positively significant impact on long run enrollment.
0
5
10
15
20
25
30
35
40
45
0 5 10 15 20
ENR
OLS
SXP2
ENROLS
Linear (ENROLS)
21
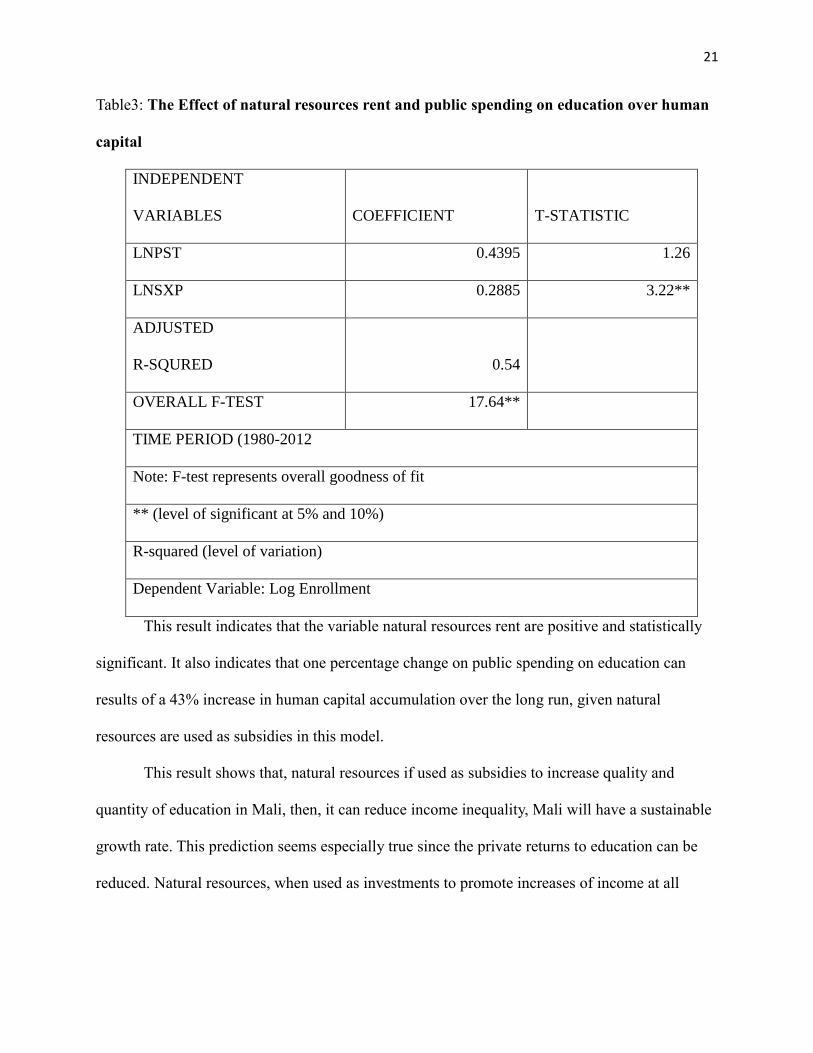
Table3: The Effect of natural resources rent and public spending on education over human
capital
INDEPENDENT
VARIABLES COEFFICIENT T-STATISTIC
LNPST 0.4395 1.26
LNSXP 0.2885 3.22**
ADJUSTED
R-SQURED 0.54
OVERALL F-TEST 17.64**
TIME PERIOD (1980-2012
Note: F-test represents overall goodness of fit
** (level of significant at 5% and 10%)
R-squared (level of variation)
Dependent Variable: Log Enrollment
This result indicates that the variable natural resources rent are positive and statistically
significant. It also indicates that one percentage change on public spending on education can
results of a 43% increase in human capital accumulation over the long run, given natural
resources are used as subsidies in this model.
This result shows that, natural resources if used as subsidies to increase quality and
quantity of education in Mali, then, it can reduce income inequality, Mali will have a sustainable
growth rate. This prediction seems especially true since the private returns to education can be
reduced. Natural resources, when used as investments to promote increases of income at all

22
levels, can be powerful poverty reduction tools as long as they are used to promote future
manufacturing.
23
CHAPTER VII: CONCLUSION AND RECOMMENDATION
This study confirms the presence of the resource curse in Sub-Saharan African countries
using human capital as the main transmission channel. This study also looks at time series
analysis to test long term equilibrium between growth rate, natural resources and human capital.
This study found there is a long-term, stable, positive relationship between growth, natural
resources and human capital. This finding confirms the needs for Sub-Saharan Africa, and Mali
in particular, to use natural resources as investment to promote human capital accumulation,
which seems exert the greatest impact on growth (Barro, .al., 2000, etc.).

24
REFERENCE:
Alexis, Manning, 2004.“Human Capital as a Transmission Mechanism of the Resource Curse” .
The park place Economist 12. http://digitalcommons.iwu.edu/parkplace/vol12/iss1/17
Auty, R., 2001. “Resource abundance and economic development.” Oxford University Press.
Claudio, Bravo., Ortega, Jose, De., Gregorio,2002. “The Relative Richness of the Poor: Natural
Resources, Human Capital and Economic Growth.” World Bank policy research Working
Paper series, P..3484.
Claire, Manguy, 2011. “Natural resources and development: The gold sector in Mali.” Resources
Policy 36, 123-131.
Jeffrey, D., Sachs, Andrew, M., Warner, 2001. Natural Resources and Economic Development:
The curse of natural resources. European Economic Review 45, 827-838.
Jeffrey, D., Andrew, M., Warner, 1997. Natural resource abundance and economic growth.
Working paper for center for International development and Harvard Institute.
Jeffrey, D., Sachs, Andrew, M., Warner, 1997. Sources of low growth in African Economics.
Journal of African Economies 6, 335-376
IMF, 2000, 2006, 2008.Country reports. http://www.imf.org/external/index.htm
Paul, Stevens, 2003. Resource Impact: A Curse OR A Blessing. Centre for Energy, Petroleum and
Mineral Law and Policy University of Dundee, Dundee UK.
http://www.dundee.ac.uk/cepmlp/journal/html/ Vol13/article13-14.pdf
Papyrakis, Elissaios., Gerlagh, Reyer.,2004.The resource curse hypothesis and its transmission
channels. Journal of Comparative Economics 32,181-193. www.elsevier.com/locate/jce
Patrick, K., Asea, Amartya , Lahiri.,1999. “The Precious Bane.” Journal of Economics dynamics
and Control 23, 823-849.
Thorvaldur, Gylfason., 2000. Natural resources, education and economic development.
European Economic Review. http://www.hi.is/~gylfason/pdf/dp2594.pdf
UNCTAD, 2009. Handbook of Statistics. Geneva.
Robert, J., Barro, Jong,Wha., Lee, 2000. “International Data on Educational Attainment: Updates
and Implications”. OXFORD JOURNALS.
http://oep.oxfordjournals.org/content/53/3/541.short
World Bank; 2012, Data set for a panel of 42 countries; database indicators
(http://www.worldbank.org/ida).

25
World Bank2009.Growth support Project. http://www.worldbank.org/ida).

APPENDICES

26
Appendix 1: Data Definition
All the variables used in the for Sub-Sahara Africa and Mali models are taking as proxies
from World Bank database; based on Sachs and Warner,1985, study formulation .
LGDP per capita is real GDP, PPP, adjusted Gross domestic Product divided by
economically active population (or midyear population). Natural log of GDP per capita based on
purchasing power parity (PPP); PPP GDP is gross domestic product converted to international
dollars using purchasing power parity rates. An international dollar has the same purchasing
power over GDP as the U.S. dollar has in the United States. GDP at purchaser's prices is the sum
of gross value added by all resident producers in the economy plus any product taxes and minus
any subsidies not included in the value of the products. It is calculated without making
deductions for depreciation of fabricated assets or for depletion and degradation of natural
resources. Data are in constant 2005 international dollars.
GR8012 represent average annual growth rate in real GDP per economically active
population between 1980 and 2012. Which is obtained, by taking (Log80-Log2012)/33;
according to Sachs and Warner, 1997; study; computation of GR8012. GR8012 is used as the
dependent variable in the Sub-Sahara Africa Model.
GR8012 represent average annual growth rate in real GDP per economically active
population between 1980 and 2012. Which is obtaining, from taking: Log80-Log20123; and
used as dependent variable in the Mali time series model.
INVSH (Gross capital formation (% of GDP): Gross capital formation (formerly gross
domestic investment) consists of outlays on additions to the fixed assets of the economy plus net
changes in the level of inventories. Fixed assets include land improvements (fences, ditches,
drains, and so on); plant, machinery, and equipment purchases; and the construction of roads,

27
railways, and the like, including schools, offices, hospitals, private residential dwellings, and
commercial and industrial buildings. Gross capital formation as a % of GDP represents the
domestic investment (Private public).
ENROLS represent human capital; which is Gross enrolment ratio of Secondary as a
percentage of the population of official secondary education age, include all programs. Total is
the total enrollment in secondary education, regardless of age, expressed as a percentage of the
population of official secondary education age. GER can exceed 100% due to the inclusion of
over-aged and under-aged students because of early or late school entrance and grade repetition.
PST represents variable public spending on education, total (% of GDP).
SXP represents natural resources; which define as Ores and metals exports as a % of
merchandise exports.
SXP2 represents natural resource rents as % of GDP, according to World Bank database
indicators.
TOT represent terms of trade shock; which is terms of trade adjustment (constant LCU).
SOPEN represent openness of country; which represent tariff rate, most favored nation,
weighted mean, primary products (%)(World bank database). According to Sachs and Warner
,1997,crireria of openness ; an economy is say to be open if average tariff rates are below 40%;
or average quota and licensing coverage of imports less than 40%.

28
VITA
Graduate School
Southern Illinois University
Mr. Ibrahima Coulibaly
Southern Illinois University of Carbondale
Bachelor, Finance/Mathematics, December 2006
Southern Illinois University of Carbondale
Master of Science in Applied Economics, Agro Business and Economics, May 2010
Research paper: LONG TERM ECONOMIC IMPACT OF THE NATURAL RESOURCES
AND HUMAN CAPITAL ON THE GROWTH RATE.
Major Professor: Dr. AKM Mahbub Morshed