long-term exposure to diesel engine exhaust induced lung ... · lung function and chromosomal...
TRANSCRIPT

DEE EXPOSURE AND LUNG FUNCTION 13
*To whom correspondence should be addressed.E-mail: [email protected]
©2017 National Institute of Occupational Safety and Health
Industrial Health 2017, 55, 13–26 Original Article
This is an open-access article distributed under the terms of the Creative Commons Attribution Non-Commercial No Derivatives (by-nc-nd) License.
Introduction
Diesel engine exhaust (DEE) is a common air pollut-ant resulting from incomplete combustion of diesel fuel. DEE is a complex mixture comprising of gases and par-ticulate matter absorbed with mutagenic and carcinogenic organic matters. Polycyclic aromatic hydrocarbons (PAHs)
Long-term exposure to diesel engine exhaust induced lung function decline in a cross sectional study
Li Ping ZHANG1, Xiao ZHANG1, Hua Wei DUAN1, Tao MENG1, Yong NIU1, Chuan Feng HUANG1, Wei Min GAO2, Shan Fa YU3 and Yu Xin ZHENG1*
1 Key Laboratory of Chemical Safety and Health, National Institute for Occupational Health and Poison Control, Chinese Center for Disease Control and Prevention, China
2Department of Environmental Toxicology, The Institute of Environmental and Human Health, Texas Tech University, USA3Henan Provincial Institute for Occupational Health, China
Received February 19, 2016 and accepted June 17, 2016 Published online in J-STAGE June 23, 2016
Abstract: To clarify the effects of lung function following exposure to diesel engine exhaust (DEE), we recruited 137 diesel engine testing workers exposed to DEE and 127 non-DEE-exposed workers as study subjects. We performed lung function tests and measured cytokinesis-block micronucleus (CBMN) cytome index and levels of urinary polycyclic aromatic hydrocarbons (PAHs) metabolites. There was a significant decrease of forced expiratory volume in 1 second (FEV1), ratio of forced expiratory volume in 1 second to forced vital capacity (FEV1/ FVC), maximal mid expiratory flow curve (MMF), forced expiratory flow at 50% of FVC (FEF50%), and forced expiratory flow at 75% of FVC (FEF75%) in the DEE-exposed workers than non-DEE-exposed workers (all p<0.05). Among all study subjects, the decreases of FEF75% were associated with the increasing levels of PAHs meta-bolites (p < 0.05), and there were negative correlations between FEV1, FEV1/FVC, MMF, FEF50%, and FEF75% with CBMN cytome index (all p < 0.05). Our results show that long-term exposure to DEE can induce lung function decline which shows mainly obstructive changes and influence of small airways function. The decreased lung function is associated with internal dosage of DEE expo-sure, and accompany with the increasing CBMN cytome index.
Key words: Diesel engine exhaust, Lung function, The cytokinesis-block micronucleus cytome index, Urinary mono-hydroxylated polycyclic aromatic hydrocarbons, Long-term exposure
and nitroarenes are presented within both gas and particle phases of DEE. Moreover, DEE is classified as a Group I carcinogen by the International Agency for Research on Cancer1) , and is a prominent source of particulate mat-ter <2.5 μm in aerodynamic diameter (PM2.5) in rural and urban areas. For the general population, traffic emission can be major sources of exposure to DEE. Occupational exposure to DEE through use of diesel-powered equip-ment predominantly occurred in industries including min-ing, construction, and transportation. The potential health effects of ambient DEE exposure are of great interest both

L ZHANG et al.14
Industrial Health 2017, 55, 13–26
for general and occupational population. Epidemiological studies have shown associations between DEE exposure and several respiratory disorders including airway inflam-mation2), allergic respiratory disease3), chronic obstruc-tive pulmonary disease (COPD)4, 5), and lung cancer6 – 8). One cross sectional investigation showed an increased risk for decline in FEV1 in tunnel workers exposed to DEE9). Miners of two salt mines were investigated to find that there were dose-response relationships between occupa-tional exposure to potash, DEE and nitrogen oxides and lung function10). Another cohort study has also reported that railroad workers exposed to DEE was associated with increased mortality from COPD4). Although DEE is ordi-nary in both urban and rural areas, it is usually very difficult to pick out the effects from other innumerous fuel combus-tion exposures which coexist in ambient air11). Therefore, the inadequate control of potential confounding expo-sures and lack of quantification of exposure assessment remains hindered the interpretation of occupational and environmental epidemiological studies of DEE12). Human controlled-exposure studies have reported mixed findings with respect to the effects of DEE on lung function, includ-ing non-significant effects on lung volumes and statisti-cally significant effects on specific airway resistance13–16). Although controlled exposure studies have the advan-tage of excluding the effects of confounding exposures, it also have some weaknesses, such as small sample size and inability to study the chronic effects of exposure compared with observational epidemiology12).
In the current study, all subjects in the DEE-exposed group had inspected heavy-duty diesel engines for at least one year in a diesel engine manufacturing plant, and there was no other major exposure source except DEE in the workplace. We performed the lung function tests and also evaluated the levels of the metabolites of PAHs in urine samples as internal dosage. In our previous study, we found that the micronucleus (MN), nucleoplasmic bridge (NPB), and nuclear bud (NBUD) frequencies in peripheral blood lymphocytes (PBLs) were higher in the DEE-exposed populations compared with unexposed populations17). The CBMN cytome assay is one of the most commonly used methods for measuring chromosomal damage18). Consider-ing that inflammation played a significant role in both driv-ing lung function decline and inducing DNA damage and chromosomal instability19, 20). The CBMN cytome index was calculated to further explore the correlation between lung function and chromosomal damage associated with inflammation. We found the effects on lung function of long-term exposure to pure DEE and the association of uri-
nary PAHs metabolites with lung function accompanying with increasing of chromosomal damage.
Subjects and Methods
Study population and sample collectionWe recruited 264 male workers had been employed for
at least one year. The DEE-exposed workers, who tested heavy-duty diesel engines in engine assemble workshop of diesel engine manufacturing plant, were recruited as the DEE-exposed group (n=137). The workers with no work-related exposure to DEE and other toxicants, who oper-ated and inspected the electric powered water pumps in the water supply plant, were recruited as the control group (n = 127). Standardized occupational questionnaires on demographic characteristics, smoking status, alcohol con-sumption, working years, recent personal medical events (previous 6 months), and personal medical history were administrated to the workers by an occupational physician. Subjects with a history of tuberculosis, thoracic or abdomi-nal surgery, cancer, recent fever and/or inflammation and those who had been exposed to X-ray within three months were excluded. Individuals who had smoked ≥ 100 ciga-rettes in their lifetime were considered smokers; those who still smoked at the time of the interview were defined as current smokers; others were treated as former smokers. Finally, 4 ml venous blood and 50 ml urine were obtained from each subject at the end of shift after at least 4 con-secutive working days.
The study was approved by the Research Ethics Com-mittee of National Institute for Occupational Health and Poison Control, Chinese Center for Disease Control and Prevention, and written informed consent was obtained from all study participants.
Lung function testsLung function tests were performed using a portable cal-
ibrated vitalograph spirometer (CHESTAC-8800, Japan) in accordance with the American Thoracic Society/European Respiratory Society (ATS/ERS) standards21). Technicians performing the lung function tests are certified and have completed the standardized spirometry training course of China and responsible for all lung function testing. Cali-bration was done with a 3-l calibration syringe at least twice a day before and after the spirometric measurements, according to the guidelines of the manufacturer. Subjects within 1 month of a myocardial infarction were excluded. Testing was performed in the sitting position. Height and weight were measured for each subject with a stadiometer

DEE EXPOSURE AND LUNG FUNCTION 15
and a digital scale. Lung function tests included vital capac-ity (VC, l), forced vital capacity (FVC, l), forced expira-tory volume in 1 second (FEV1, l), maximal mid expira-tory flow curve (MMF, l/s), peak expiratory flow (PEF, l/s), forced expiratory flow at 25% of FVC (FEF25%, l/s), forced expiratory flow at 50% of FVC (FEF50%, l/s) , and forced expiratory flow at 75% of FVC (FEF75%, l/s). In addition, FEV1 as a percentage of FVC was calculated. Lung func-tion values were also expressed as percent of predicted using appropriate equations as follows: (27.63 − 0.112 × age) × height/1,000 for FVC and VC, (34.4 × height − 33 × age − 1,000)/1,000 for FEV1, (51 × height/2.54 + 2,954 − 46 × age)/1,000 for MMF, 0.057 × height − 0.024 × age + 0.225 for PEF, 0.03555 × height − 0.01987 × age + 2.72554 for FEF25%, 0.02569 × height − 0.03049 × age + 2.40337 for FEF50%, and 0.01411×height−0.04142×age+1.98361 for FEF75%. Units are years for age and centimeter for height.
Exposure assessmentAirborne PM2.5, elemental carbon (EC), and PAHs moni-toring
Details of the airborne PM2.5, EC, and PAHs exposure have been described previously17). Briefly, the airborne samples were collected from the water supply plant and diesel engine manufacturing plant, respectively. We mea-sured PM2.5 in the working environment gravimetrically by a micro-balance. The concentrations of EC in collected PMs were analyzed by thermal optical analysis based on National Institute for Occupational Safety and Health (NIOSH) method 5,04022). Quantitative chemical analysis of 16 PAHs from collected PMs were performed by high performance liquid chromatography-mass spectrometry (HPLC) with fluorescence detectors according to the Occu-pational Safety and Health Administration method 5823).
Determination of urinary mono-hydroxylated PAHs (OH-PAHs)
The urine samples were tested for six OH-PAHs, includ-ing 1-hydroxynaphthalene (1-OHNa), 2-hydroxynaph-thalene (2-OHNa), 2-hydroxyfluorene (2-OHFlu), 2-hydroxyphenanthrene (2-OHPh), 9-hydroxyphenan-threne (9-OHPh), and 1-hydroxypyrene (1-OHP) using an HPLC-MS/MS method as described previously17, 24). The testing procedure involved enzymatic hydrolysis of urine, liquid-liquid extraction, evaporation under nitrogen to con-stant volume, and analysis using HPLC-MS /MS. The uri-nary OH-PAHs were quantified by internal standard cali-bration curve. Urinary creatinine-correction was applied to the data. Creatinine was determined in all urine samples
by Jaffe’s colorimetric method. The urinary OH-PAHs concentrations were expressed as micrograms per gram of creatinine (μg/g). Limits of detection (LOD) for six uri-nary OH-PAHs were in the range of 0.1–0.5 μg/l, and we replaced the results below the LOD with LOD/ 2.
Cytokinesis-block micronucleus (CBMN) cytome assay Detailed method of the CBMN assay has been reported
before17). Briefly, the CBMN assay was carried out with fresh heparin-anticoagulated whole blood according to the standardized protocol developed by Fenech et al.25). Two duplicative slides for each subject were prepared. A total of 2,000 binucleated cells with well-preserved cytoplasm were examined in each slide microscopically to determine MN, NPB, and NBUD frequencies according to the scor-ing criteria26).
Statistical analysisAll statistical analyses were performed using SPSS 11.0
software. Normal distribution test was examined using the one-sample K-S test. Natural logarithmic (ln) transforma-tion was applied to urinary OH-PAHs to satisfy the nor-mal distribution. Total OH-PAHs levels were calculated by summing urinary levels of six OH-PAHs. Student t-test was used to compare means of quantitative data (age, height, weight, BMI, urinary OH-PAHs concentrations, and lung function parameters), and chi-square test was used to compare the frequencies of qualitative data (cur-rent smokers and alcohol users) between the DEE-exposed and control groups. The associations of DEE exposure with lung function were further examined using the mul-tivariate linear regression with adjustment for age, height, weight, smoking status and alcohol use. Because smoking was an important confounding factor, we further repeated the analysis by smoking status. Next, the associations of lung function with categorized DEE exposure duration were examined using the multivariate linear regression. The urinary total OH-PAHs metabolites concentrations in all study subjects further stratified by exposure groups. We applied multivariate linear regression to examine the tendency of lung function with the urinary total OH-PAHs levels with adjustment for age, height, weight, smoking status and alcohol use. The statistically significant level was p < 0.05. Associations between lung function values and CBMN cytome index in all study subjects were ana-lyzed using Spearman’s rank correlation coefficient.
L ZHANG et al.16
Industrial Health 2017, 55, 13–26
Results
General characteristics of study subjectsCharacteristics of the study population are shown in
Table 1. The distribution according to age, height, weight, BMI, current smoking habits, and alcohol use were simi-lar between the DEE-exposed workers and non-DEE-exposed workers (all p > 0.05). The DEE-exposed years (median, Q1 – Q3) of DEE-exposed group were (8.50, 5.40–9.60) years. Participants in the DEE-exposed group had significantly higher exposures levels to PM2.5, EC, and total PAHs than those in the control group (all p<0.001). Results of measurements were described in detail by Zhang et al.17). The DEE-exposed group and control group were exposed to PM2.5 of 267.45 μg/m3 and 91.88 μg/m3, respectively. The geometric means of the EC level and total PAHs were 11.81 μg/m3, 0.03 μg/m3 for work-ers in the control group and 113.69 μg/m3, 4.76 μg/m3 for workers in the DEE-exposed group (all p <0.001), respec-tively. Compared with the control group, six urinary OH-PAHs (including 1-OHNa, 2-OHNa, 2-OHFlu, 2-OHPh, 9-OHPh, and 1-OHP) and total OH-PAHs were signifi-cantly higher in the DEE-exposed groups (all p < 0.001). The concentrations (μg/g creatinine, median, 5%–95%) of 1-OHNa, 2-OHNa, 2-OHFlu, 2-OHPh, 9-OHPh, 1-OHP, and total OH-PAHs were 0.85 (0.11 – 4.73), 1.28 (0.20 –7.48) , 0.61(0.12 – 1.79), 0.23 (0.09 – 1.37), 0.40 (0.08 –1.95), 0.75 (0.08–3.13), and 4.68 (0.96–16.75) in the con-trol group, and 1.67 (0.35–9.12), 3.20 (0.45–15.33), 1.61 (0.51 – 4.08), 1.45 (0.48 – 3.85), 1.13 (0.30 – 3.62), 2.30 (0.62–6.27), and 12.96 (4.47–32.33) in the DEE-exposed group.
DEE exposure induced decreased lung function of workersTable 2 presents the VC, FVC, FEV1, FEV1/FVC, MMF,
PEF, FEF25%, FEF50%, and FEF75% of the two groups. The FEV1, FEV1/FVC, MMF, FEF50%, and FEF75% observed in the DEE-exposed workers were significantly lower than in non-DEE-exposed workers (all p < 0.05). After adjust-ing for important confounders, including age, weight, height, smoking, and drinking habit, significant associa-tions were still present between reduction in most param-eters of lung function and DEE exposure (Table 2). Fur-ther analyses by controlling the false discovery rate using Benjamini-Hochberg method showed similar results (data not shown)27). Predicted percentages of VC, FVC, FEV1, MMF, PEF, FEF25%, FEF50%, and FEF75% are presented in Table s1. As shown, most parameters of pulmonary func-tion such as predicted percentages of FEV1, MMF, FEF50%,
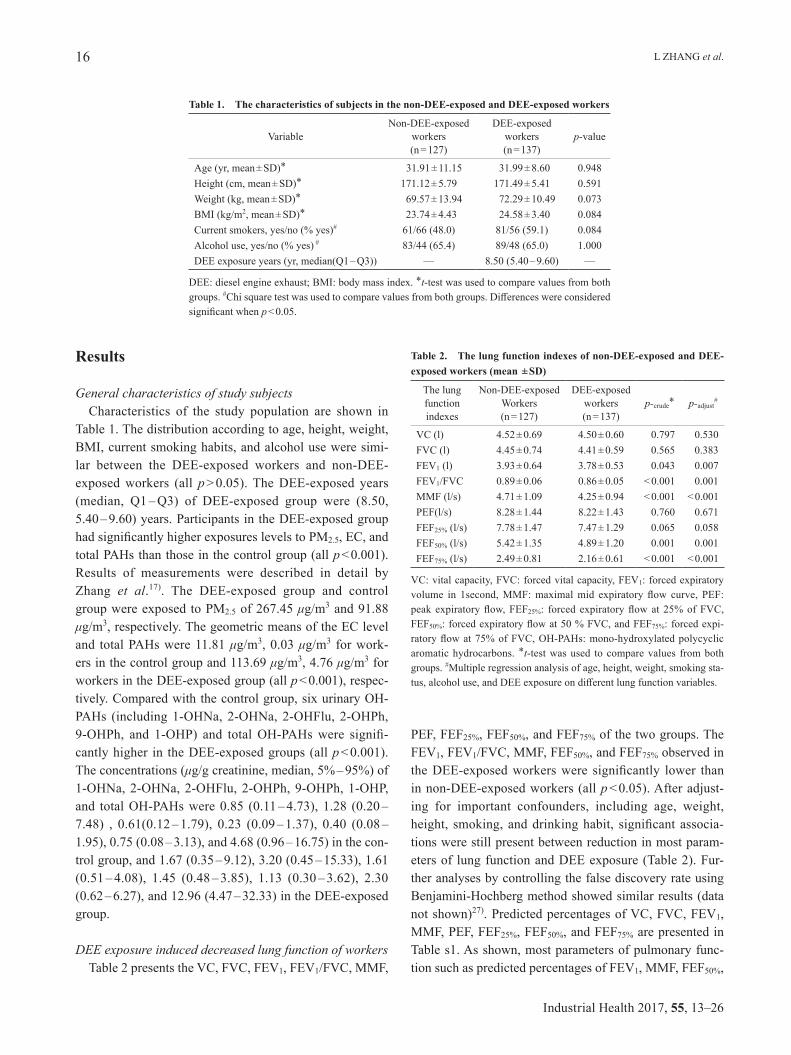
Table 1. The characteristics of subjects in the non-DEE-exposed and DEE-exposed workers
VariableNon-DEE-exposed
workers(n=127)
DEE-exposed workers(n=137)
p-value
Age (yr, mean±SD)* 31.91±11.15 31.99±8.60 0.948Height (cm, mean±SD)* 171.12±5.79 171.49±5.41 0.591
Weight (kg, mean±SD)* 69.57±13.94 72.29±10.49 0.073
BMI (kg/m2, mean±SD)* 23.74±4.43 24.58±3.40 0.084
Current smokers, yes/no (% yes)# 61/66 (48.0) 81/56 (59.1) 0.084
Alcohol use, yes/no (% yes) # 83/44 (65.4) 89/48 (65.0) 1.000DEE exposure years (yr, median(Q1–Q3)) — 8.50 (5.40–9.60) —
DEE: diesel engine exhaust; BMI: body mass index. *t-test was used to compare values from both groups. #Chi square test was used to compare values from both groups. Differences were considered significant when p<0.05.
Table 2. The lung function indexes of non-DEE-exposed and DEE-exposed workers (mean ±SD)
The lung function indexes
Non-DEE-exposed Workers(n=127)
DEE-exposed workers(n=137)
p-crude* p-adjust#
VC (l) 4.52±0.69 4.50±0.60 0.797 0.530FVC (l) 4.45±0.74 4.41±0.59 0.565 0.383FEV1 (l) 3.93±0.64 3.78±0.53 0.043 0.007FEV1/FVC 0.89±0.06 0.86±0.05 <0.001 0.001MMF (l/s) 4.71±1.09 4.25±0.94 <0.001 <0.001PEF(l/s) 8.28±1.44 8.22±1.43 0.760 0.671FEF25% (l/s) 7.78±1.47 7.47±1.29 0.065 0.058FEF50% (l/s) 5.42±1.35 4.89±1.20 0.001 0.001FEF75% (l/s) 2.49±0.81 2.16±0.61 <0.001 <0.001
VC: vital capacity, FVC: forced vital capacity, FEV1: forced expiratory volume in 1second, MMF: maximal mid expiratory flow curve, PEF: peak expiratory flow, FEF25%: forced expiratory flow at 25% of FVC, FEF50%: forced expiratory flow at 50 % FVC, and FEF75%: forced expi-ratory flow at 75% of FVC, OH-PAHs: mono-hydroxylated polycyclic aromatic hydrocarbons. *t-test was used to compare values from both groups. #Multiple regression analysis of age, height, weight, smoking sta-tus, alcohol use, and DEE exposure on different lung function variables.

DEE EXPOSURE AND LUNG FUNCTION 17
and FEF75%were significantly lower in the DEE-exposed workers than in non-DEE-exposed workers (all p < 0.05). Table 2 shows that the levels of FEV1 were lower in the DEE-exposed population relative to controls (3.93±0.64 l, 3.78±0.53 l, respectively). The levels of FEV1/FVC were 0.89±0.06 in the control group and 0.86±0.05 in the DEE-exposed group. The DEE-exposed workers had significant lower levels of MMF, FEF50%, and FEF75% (4.71 ± 1.09 l/s, 5.42 ± 1.35 l/s, and 2.49 ± 0.81 l/s, respectively) than the non-DEE-exposed workers (4.25±0.94 l/s, 4.89±1.20 l/s, and 2.16±0.61 l/s, respectively) . Similar decreases in the DEE-exposed workers compared to non-DEE-exposed workers were observed for the FVC, PEF, and FEF25%, but these results were not significant (p>0.05). The values of VC were similar in the two groups (p>0.05).
Furthermore, the association between duration of DEE exposure and lung function with adjustment for age, weight, height, smoking, and drinking habit were exam-ined. The values of FEV1, FEV1/FVC, MMF, FEF25%, FEF50%, and FEF75% were significantly lower in the DEE-exposed workers for 0 – 4, 4 – 8, and > 8 years compared with non-DEE-exposed workers, and these lung function decreases were DEE exposure duration dependent (Table s2).
Pulmonary function peaks at the age of 20 in human development. Therefore, we assessed the association between DEE exposure and lung function restricted in workers older than 20 years old. Similarly, the values of FEV1, FEV1/FVC, MMF, FEF50%, and FEF75% observed in the DEE-exposed workers were significantly lower than in non-DEE exposed workers when this analysis was restricted in workers older than 20 year old (all p < 0.05) (Table s3). In the DEE-exposed workers, we also observed that the decreased VC, FVC, FEV1, and FEF75% were
related with the increasing of age at start of DEE exposure (all p < 0.05), and the Spearman’s rank correlation coeffi-cient were −0.274 (p =0.001), −0.313 (p <0.001), −0.313 (p < 0.001), and − 0.226 (p = 0.008), respectively. Further-more, we have noticed that age was correlated with age at start of DEE exposure (r=0.716, p<0.001). Therefore, the observed association between age at start of DEE exposure and age could significantly contribute to the significant association between age at start of DEE exposure and lung function.
Decrease of lung function associated with increase of internal dosage of DEE exposure
To explore the relationship between DEE exposure lev-els and levels of lung function, we divided the study pop-ulation into three groups according to internal dosage of DEE exposure. The lung function indexes grouped accord-ing to urinary total OH-PAHs concentration are shown in Table 3. A relationship between lung function indexes and urinary total OH-PAHs levels was found among all study subjects. Multivariate linear regression analyses revealed that elevated urinary total OH-PAHs levels were signifi-cantly associated with a decrease of FEF75% (ptrend=0.048) in all study subjects after adjusting for age, height, weight, smoking status, and alcohol use. The relationship between elevated urinary total OH-PAHs and the decrease of FEV1, MMF, and FEF25% was borderline significant (ptrend=0.066, ptrend= 0.066, and ptrend= 0.062, respectively). There were no significant differences for VC, FVC, FEF50%, and PEF in three tertiles of urinary total OH-PAHs groups in all study subjects (all p>0.05). However, when analyzed sep-arately in the DEE-exposed group and the control group, the associations of elevated tertiles of urinary total OH-PAHs with the lung function indexes generally became
Table 3. The lung function indexes grouped by urinay total OH-PAHs level in all study subjects (mean±SD)
The lung functionindexes
Urinay total OH-PAHs (μg/g creatinine)
T1<5.90 (n=88) T2 5.90–12.44 (n=88) T3 > 12.44 (n=88) p-trend*
VC (l) 4.69±0.67 4.43±0.62 4.43±0.61 0.214FVC (l) 4.63±0.72 4.34±0.63 4.31±0.60 0.290FEV1 (l) 4.08±0.61 3.75±0.57 3.74±0.53 0.066FEV1/FVC 0.88±0.06 0.86±0.05 0.87±0.05 0.131MMF (l/s) 4.79±1.07 4.27±1.03 4.36±0.95 0.066PEF (l/s) 8.32±1.33 8.24±1.42 8.19±1.56 0.309FEF25% (l/s) 7.79±1.36 7.60±1.38 7.47±1.42 0.062FEF50% (l/s) 5.48±1.29 4.91±1.33 5.04±1.23 0.109FEF75% (l/s) 2.59±0.82 2.18±0.66 2.20±0.63 0.048
See table 2 for abbreviations. *Multiple regression analysis of age, height, weight, smoking status, alcohol use, and tertiles of urinay total OH-PAHs on different lung function variables.

L ZHANG et al.18
Industrial Health 2017, 55, 13–26
insignificant (Table s4).
Relations of smoking status with the lung function indexesWhen further stratified by smoking status, all of lung
function indexes (adjusted for age, height, weight, and alcohol use) did not differ significantly between current smokers and non-smokers among both DEE-exposed group and control group (Table 4).
Associations of CBMN cytome index with the lung functionThe results of the MN, NPB, and NBUD frequencies
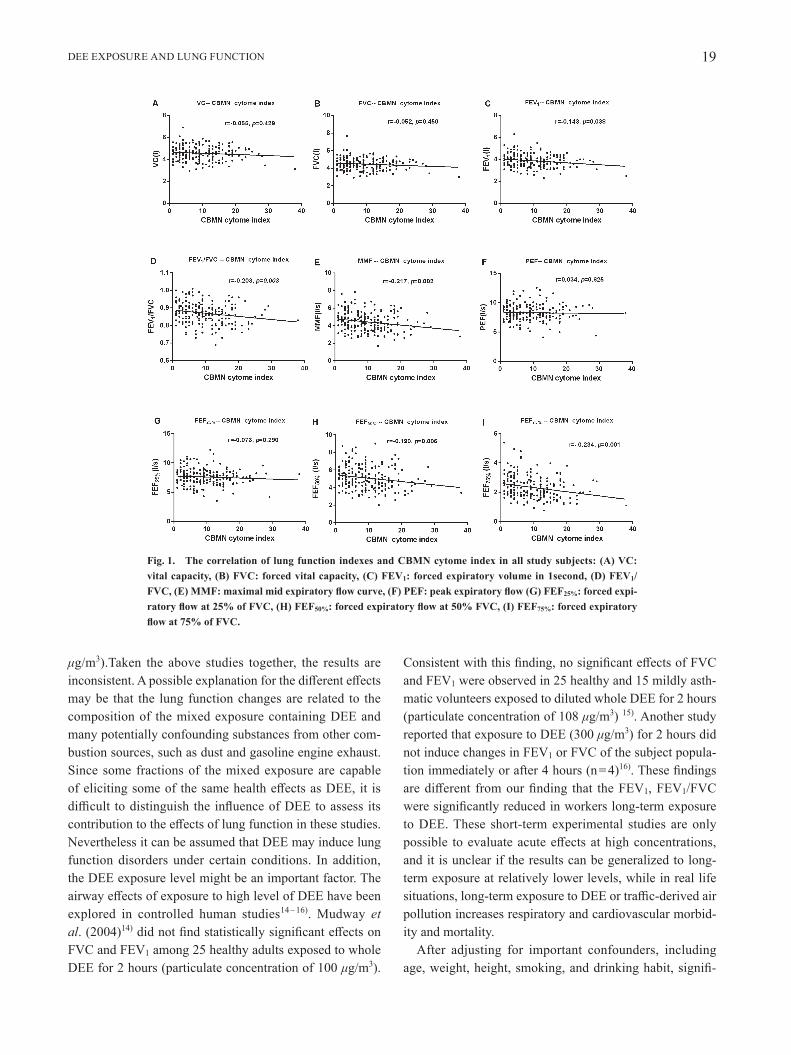
between DEE-exposed and control workers have been reported before17). The CBMN cytome index was calcu-lated by integrating MN, NPB, and NBUD frequencies, and subjects with missing data for any of MN, NPB, or NBUD frequencies were excluded from the analysis. The results of CBMN cytome index were described and we found that CBMN cytome index of the DEE-exposed workers was significantly higher than that in non-DEE-exposed workers (13.86‰ vs. 4.94‰, p < 0.001)17). We then analyzed whether there were associations between the lung function indexes and CBMN cytome index. In whole study subjects, there were negative correlations between lung function index (VC, FVC, FEV1, FEV1/FVC, MMF, FEF25%, FEF50%, and FEF75%) and CBMN cytome index. The decreased FEV1, FEV1/FVC, MMF, FEF50%, and FEF75% were related with increasing of CBMN cytome index (all p <0.05) (Fig. 1), and the Spearman’s rank cor-relation coefficient were − 0.143 (p = 0.038), − 0.203 (p = 0.003), − 0.217 (p = 0.002), − 0.190 (p = 0.006) , and − 0.234 (p = 0.001), respectively (Fig. 1). The VC, FVC and FEF25% were also decreased with increasing of CBMN cytome index, but these relations were not statistically sig-nificant (all p>0.05).
Dicussion
In this cross-sectional study, we investigated the effects of DEE on lung function of DEE-exposed workers. Two main findings of the study were presented among the chronic DEE purely exposed workers. First, decreases of lung function in workers were associated with long-term exposure to DEE. The decreases of FEV1/FVC and FEV1 may indicate airflow obstruction, the decreased levels of FEF50%, FEF75% and MEF may primarily reflect the impact of DEE exposure on function of small airways. Second, DEE induced decrease of lung function was associated with the internal dosage of DEE exposure, and accompany with the increasing CBMN cytome index which is used to assess the impact of DEE exposure on genomic instability.
In present study, we found FEV1 and FEV1/FVC were significantly lower in the DEE-exposed workers compared with the controls. Our results may indicate an association between long-term DEE exposure and airflow obstruc-tion, in terms of a reduction in the ratio of FEV1 to FVC or increased odds of FEV1/FVC<0.7, as the associations with the decreases of ratio of FEV1 to FVC and FEV1 were sta-tistically significant. This is also supported by the studies that diesel exhaust induced inflammatory in the airways, as well as airways obstruction28). Lotz et al.10) aslo reported a decrease of FEV1 in a longitudinal study of salt min-ers. In a case-control study, the railroad workers involved in DEE-exposed jobs had higher risk of COPD mortality compared with controls 4). But in another study, Ulvestad et al.9) observed a significant decrease of %FVC and %FEV1 in the tunnel workers compared with the reference subjects. Adelroth et al.2) found no significant differences in lung function of miners exposed to dust, diesel exhaust and NO2 compared with controls (EC concentration of 27
Table 4. The lung function indexes stratified by smoking status in all study subjects, as well as in the non-DEE-exposed and DEE-exposed workers (mean±SD)
The lung functionindexes
All study subjects (n=264) DEE-exposed workers (n=137) non-DEE-exposed workers (n=127)
Non-smokers(n=122)
Smokers(n=142)
p-adjust*Non-smokers
(n=56)Smokers(n=81)
p-adjust*Non-smokers
(n=66)Smokers(n=61)
p-adjust*
VC (l) 4.60±0.62 4.44±0.65 0.515 4.54±0.54 4.48±0.64 0.605 4.66±0.69 4.38±0.67 0.621FVC (l) 4.55±0.68 4.32±0.64 0.409 4.43±0.52 4.39±0.63 0.763 4.65±0.78 4.24±0.64 0.563FEV1 (l) 3.97±0.59 3.75±0.57 0.373 3.81±0.46 3.77±0.57 0.810 4.12±0.65 3.73±0.57 0.642FEV1/FVC 0.88±0.06 0.87±0.05 0.830 0.86±0.05 0.86±0.05 0.989 0.89±0.06 0.88±0.05 0.812MMF (l/s) 4.60±1.07 4.36±1.00 0.425 4.27±0.95 4.23±0.94 0.947 4.88±1.10 4.54±1.06 0.775PEF (l/s) 8.22±1.35 8.28±1.51 0.885 8.17±1.33 8.26±1.51 0.694 8.26±1.38 8.30±1.52 0.245FEF25% (l/s) 7.63±1.33 7.61±1.44 0.768 7.41±1.25 7.51±1.33 0.579 7.81±1.37 7.75±1.57 0.212FEF50% (l/s) 5.27±1.33 5.04±1.27 0.380 4.91±1.26 4.88±1.16 0.941 5.57±1.32 5.25±1.37 0.641FEF75% (l/s) 2.44±0.76 2.22±0.69 0.549 2.22±0.64 2.13±0.59 0.491 2.63±0.81 2.35±0.78 0.440
See table 2 for abbreviations. *Multiple regression analysis of age, height, weight, and alcohol use on different lung function variables.
DEE EXPOSURE AND LUNG FUNCTION 19
μg/m3).Taken the above studies together, the results are inconsistent. A possible explanation for the different effects may be that the lung function changes are related to the composition of the mixed exposure containing DEE and many potentially confounding substances from other com-bustion sources, such as dust and gasoline engine exhaust. Since some fractions of the mixed exposure are capable of eliciting some of the same health effects as DEE, it is difficult to distinguish the influence of DEE to assess its contribution to the effects of lung function in these studies. Nevertheless it can be assumed that DEE may induce lung function disorders under certain conditions. In addition, the DEE exposure level might be an important factor. The airway effects of exposure to high level of DEE have been explored in controlled human studies14 – 16). Mudway et al. (2004)14) did not find statistically significant effects on FVC and FEV1 among 25 healthy adults exposed to whole DEE for 2 hours (particulate concentration of 100 μg/m3).
Consistent with this finding, no significant effects of FVC and FEV1 were observed in 25 healthy and 15 mildly asth-matic volunteers exposed to diluted whole DEE for 2 hours (particulate concentration of 108 μg/m3) 15). Another study reported that exposure to DEE (300 μg/m3) for 2 hours did not induce changes in FEV1 or FVC of the subject popula-tion immediately or after 4 hours (n=4)16). These findings are different from our finding that the FEV1, FEV1/FVC were significantly reduced in workers long-term exposure to DEE. These short-term experimental studies are only possible to evaluate acute effects at high concentrations, and it is unclear if the results can be generalized to long-term exposure at relatively lower levels, while in real life situations, long-term exposure to DEE or traffic-derived air pollution increases respiratory and cardiovascular morbid-ity and mortality.
After adjusting for important confounders, including age, weight, height, smoking, and drinking habit, signifi-
Fig. 1. The correlation of lung function indexes and CBMN cytome index in all study subjects: (A) VC: vital capacity, (B) FVC: forced vital capacity, (C) FEV1: forced expiratory volume in 1second, (D) FEV1/FVC, (E) MMF: maximal mid expiratory flow curve, (F) PEF: peak expiratory flow (G) FEF25%: forced expi-ratory flow at 25% of FVC, (H) FEF50%: forced expiratory flow at 50% FVC, (I) FEF75%: forced expiratory flow at 75% of FVC.

L ZHANG et al.20
Industrial Health 2017, 55, 13–26
cant associations were still present between reduction in most parameters of lung function and DEE exposure. In present study, decline in FEV1 was paralleled by a decline in FEV1/ FVC in most subjects, suggesting an obstructive effect of long-term DEE exposure on lung function, as associations with the ratio of FEV1 to FVC were also statis-tically significant lower. Our results are similar to previous air pollution studies where exposure to PM was associated with deficits in lung function29–31). In Mexico City, reduced rates of lung function growth have been reported in chil-dren living in parts of the city with higher particle levels29). W James Gauderman et al.30) reported that children who lived within 500 m of a freeway had substantial deficits in 8-year growth of FEV1 and MEF, compared with children who lived at least 1,500 m from a freeway. But the findings from the limited investigations on long-term air pollution and lung function in adults have been mixed, with some studies observing obstructive patterns and others observing restrictive patterns of lung function decline. The longitudi-nal SAPALDIA study found that reductions in PM10 over an 11-year period were associated with a slower decline in FEV1 and the ratio of FEV1 to FVC, but not in FVC32), suggesting an obstructive pattern of the effect of par-ticulate pollution on lung function decline. However, the Framingham Heart Study33) found that long-term exposure to traffic and PM2.5 in healthy adults was associated with lower FEV1 and FVC, but associations with FEV1/FVC ratio were weak or absent, suggested that they did not find an association between long-term air pollution exposure and airflow obstruction. While the ESCAPE meta-analysis involving five cohorts found significant and similar-mag-nitude associations of NO2 and PM10 with both FEV1 and FVC, in a restrictive pattern34). In view of these differences between the reported results and our results, an important factor is that the subjects who participated in the present study were solely exposed to DEE. In the process of test-ing of diesel engine, there are no other major exposure sources except the diesel engines. While the subjects who participated in the air pollution studies were exposed to a complex mixture mainly consisting of PM2.5 or PM10 and other chemicals presented in the gaseous and/or particle phase. The DEE exposure level might be an another impor-tant factor. In our study, the PM2.5 level (267.45 μg/m3) in the DEE-exposed workers was significantly higher than in non-DEE-exposed workers (p<0.001), while it is often relatively low in the air pollution studies. In the studies of long-term effects of traffic and particulate air pollution on adult lung function is still emerging. We also found that long-term exposure to DEE was associated with decreased
levels of FEF50%, FEF75% and MEF which primarily reflect the impact of DEE exposure on function of small airways. The earliest change associated with airflow obstruction in small airways is reflected in a proportionally greater reduc-tion in the instantaneous flow measured after 75% of the FVC being exhaled (FEF75%) or in mean expiratory flow between 25% and 75% of FVC.
Another contribution of our study is the evaluation of lung function related to the internal exposure of DEE. Pre-vious studies of DEE mostly have often assessed individ-ual exposures by monitoring airborne PM2.5, EC, and PAHs other than internal markers. PAHs and particles which are thought to be of great environmental significance have been documented as major and important components of DEE. Particle phase of DEE is a complex mixture of organic and inorganic compounds including PAHs absorbed onto carbonaceous material. Internal exposure biomarkers rep-resent the absorbed dose of a chemical and integrate all microenvironments and routes of exposure. For now, there are no appropriate biomarkers of exposure for particles in DEE. Urinary OH-PAHs have been used as biomarkers to assess recent exposure to PAHs. Measurement of the uri-nary OH-PAHs, as internal markers, may be an important way of assessing exposure to DEE. 1-OHP, which is the most frequently measured OH-PAHs biomarker for human exposure to PAHs35), does not provide a complete assess-ment of human exposure to PAH mixtures because of the different molecular sizes, shapes, and rates of metabolism of different PAHs36). Ideally, multiple PAH metabolites should be used as biomarkers to better understand the extent of exposure to PAHs 37). Therefore, we measured six urinary OH-PAHs [pyrene metabolite: 1-OHP; naphtha-lene metabolites: 1-OHNa, 2-OHNa; fluorene metabolites: 2-OHFlu; phenanthrene metabolites: 2-OHPh, 9-OHPh] by HPLC-MS/MS and used the total OH-PAHs to assess exposure to DEE. In this study, multivariate linear regres-sion analyses revealed that elevated level of urinary total OH-PAHs was significantly associated with a decrease in FEF75% in all study subjects after adjusting for age, height, weight, smoking status, and alcohol use. The relationship between elevated urinary total OH-PAHs and the decrease of FEV1, MMF, and FEF25% was borderline significant. However, when analyzed separately in the DEE-exposed group and the contol group, the associations of elevated tertiles of urinary total OH-PAHs with the lung function indexes generally became insignificant. This finding sug-gests that the significant associations of urinary total OH-PAHs with lung function indexes among all the study sub-jects might result from the presence of consistently lower

DEE EXPOSURE AND LUNG FUNCTION 21
OH-PAHs levels and lung function indexes in non-DEE-exposed workers than in the DEE-exposed workers.
We observed an association between the CBMN cytome index and the lung function parameters in all study sub-jects. The CBMN cytome index was used to evaluate the impact of DEE exposure on genomic instability more comprehensively. And our previous study showed that the CBMN cytome index was significantly higher in the DEE-exposed workers, indicating increased genomic instability in the DEE-exposed workers compared to non-DEE-exposed workers17). In this study, we found that the CBMN cytome index was related with several lung func-tion parameters. On this basis, we inferred that the genetic damage detected in the PBLs could reflect, to some extent, the corresponding damage in the lung. Chronic inflamma-tion often results in tissue damage, an increased mutation rate and genomic instability. The inflammation played an important role in both DNA damage and chromosomal instability19). The biological mechanisms of the asso-ciation between DEE exposure and lung function are not fully elucidated. Lung inflammation has been shown after controlled exposure to DEE38). Oxidative stress, which induces the release of reactive oxygen species to cause tis-sue injury, is a key pathway for pulmonary diseases. And animal studies suggest that long-term DEE exposure result in pulmonary inflammation, oxidative stress, and pulmo-nary remodeling39). As lung function decline is also closely associated with inflammation, this may also explain at least part of the association between lung function and chromo-somal instability. Taken together, the findings strengthen the link between pulmonary function injury and cancer risk.
Inhaled cigarette smoke is the main confounder in lung function studies. To control the potential confound-ing effect of smoking on the associations of DEE expo-sure with lung function, we adjusted for smoking status in the multiple linear regression analyses. Besides, lung function parameters were compared between current and non-current smokers in the DEE-exposed workers and in non-DEE-exposed workers, respectively. Surprisingly, the non-significant trend was for a higher level of FEF25% and PMF of smokers than non-smokers in the DEE-exposed workers. One possible explanation is that the relative small effect of smoking on lung function was covered up by the fairly strong effect of caused by DEE. There were similar non-significant trend for a higher level of PMF of smokers than non-smokers in non-DEE-exposed work-ers. It is possible that the sample size of the control group became smaller after the subjects were stratified to smok-
ers and non-smokers, so that significant change could not be detected. Our results is not in line with that tobacco smoking increases the rate of lung function decline40, 41), and such a confounding effect of smoking needs further clarification.
Our study has some strength that deserve comments. First, in the present study, the subjects were exposed to DEE in testing workshop. In the testing workshop, there are no other particles and chemicals except for DEE, exist-ing in the occupational environment. Therefore, the sub-jects who participated in the present study were solely exposed to DEE. Second, the mortality risk of particle exposures is much larger for chronic than acute expo-sures. Hence, understanding how long-term DEE exposure impacts lung function in adults is critical in determining whether this is a possible pathway explaining the mortality and morbidity associated with air pollution.
However, several limitations should be noted for our study. First, due to relatively short half-lives of PAHs, the information provided by biomonitoring of urinary OH-PAHs is limited to recent exposure, monitoring of a single spot urine sample represents only short-term exposure esti-mate and the repeated urine metabolite measurements or definitive biomarkers reflecting chronic exposure is needed to fully elucidate this association. Second, this was a cross-sectional study, therefore longitudinal follow-up cohort research is required to provide further clarification about whether the lung function decline exist between the DEE-exposed workers and non-DEE-exposed workers, as well as in smokers and non-smokers. Third, we could not rule out residual and unmeasured confounders including other exposures, although we adjusted for a wide range of con-founding factors. Therefore, we recruited controls from the water plant were from the same city as the non-DEE-exposed workers, therefore, all the subjects were exposed to the same level of urban air pollution in their spare time.
ConclusionIn summary, our study finds that long-term exposure
to DEE could induce decrease in lung function which shows mainly obstructive changes of airways and influ-ences of small airways function, and the decreased lung function was negatively associated with internal dosage of DEE exposure. Additionally, our study suggests that the decreased lung function was accompanied with increas-ing of CBMN cytome index which is used to evaluate the impact of DEE exposure on genomic instability. However, further researches are needed to confirm these findings in prospective studies and elucidate the possible mechanisms

L ZHANG et al.22
Industrial Health 2017, 55, 13–26
of these associations.
Acknowledgements
This work was supported by the Key Program of National Natural Science Foundation of China (NSFC 81130050) and the National Key Technology Research and Development Program (2014BAI12B02). The authors would like to thank the members of Henan Institute of Occupational Medicine (Zhengzhou, China) for assistance with sample collection and instrumental support.
References
1) Benbrahim-Tallaa L, Baan RA, Grosse Y, Lauby-Secretan B, El Ghissassi F, Bouvard V, Guha N, Loomis D, Straif K; International Agency for Research on Cancer Monograph Working Group (2012) Carcinogenicity of diesel-engine and gasoline-engine exhausts and some nitroarenes. Lancet Oncol 13, 663–4.
2) Ädelroth E, Hedlund U, Blomberg A, Helleday R, Ledin MC, Levin JO, Pourazar J, Sandström T, Järvholm B (2006) Airway inflammation in iron ore miners exposed to dust and diesel exhaust. Eur Respir J 27, 714–9.
3) Riedl M, Diaz-Sanchez D (2005) Biology of diesel exhaust effects on respiratory function. J Allergy Clin Immunol 115, 221–8. quiz 229.
4) Hart JE, Laden F, Eisen EA, Smith TJ, Garshick E (2009) Chronic obstructive pulmonary disease mortality in railroad workers. Occup Environ Med 66, 221–6.
5) Hart JE, Eisen EA, Laden F (2012) Occupational diesel exhaust exposure as a risk factor for chronic obstructive pulmonary disease. Curr Opin Pulm Med 18, 151–4.
6) Pedeli X, Hoek G, Katsouyanni K (2011) Risk assessment of diesel exhaust and lung cancer: combining human and animal studies after adjustment for biases in epidemiologi-cal studies. Environ Health 10, 30.
7) Olsson AC, Gustavsson P, Kromhout H, Peters S, Vermeulen R, Brüske I, Pesch B, Siemiatycki J, Pintos J, Brüning T, Cassidy A, Wichmann HE, Consonni D, Landi MT, Caporaso N, Plato N, Merletti F, Mirabelli D, Richiardi L, Jöckel KH, Ahrens W, Pohlabeln H, Lissowska J, Szeszenia-Dabrowska N, Zaridze D, Stücker I, Benhamou S, Bencko V, Foretova L, Janout V, Rudnai P, Fabianova E, Dumitru RS, Gross IM, Kendzia B, Forastiere F, Bueno-de-Mesquita B, Brennan P, Boffetta P, Straif K (2011) Exposure to diesel motor exhaust and lung cancer risk in a pooled analysis from case-control studies in Europe and Canada. Am J Respir Crit Care Med 183, 941–8.
8) IARC Working Group on the Evaluation of Carcinogenic Risks to Humans (2014) Diesel and gasoline engine exhausts and some nitroarenes. IARC Monogr Eval Car-cinog Risks Hum 105, 9–699.
9) Ulvestad B, Bakke B, Melbostad E, Fuglerud P, Kongerud J, Lund MB (2000) Increased risk of obstructive pulmonary disease in tunnel workers. Thorax 55, 277–82.
10) Lotz G, Plitzko S, Gierke E, Tittelbach U, Kersten N, Schneider WD (2008) Dose-response relationships between occupational exposure to potash, diesel exhaust and nitro-gen oxides and lung function: cross-sectional and longitudi-nal study in two salt mines. Int Arch Occup Environ Health 81, 1003–19.
11) Morgott DA (2014) Factors and trends affecting the identifi-cation of a reliable biomarker for diesel exhaust exposure. Crit Rev Environ Sci Technol 44, 1795–864.
12) Hesterberg TW, Long CM, Bunn WB, Sax SN, Lapin CA, Valberg PA (2009) Non-cancer health effects of diesel exhaust: a critical assessment of recent human and animal toxicological literature. Crit Rev Toxicol 39, 195–227.
13) Nightingale JA, Maggs R, Cullinan P, Donnelly LE, Rogers DF, Kinnersley R, Chung KF, Barnes PJ, Ashmore M, Newman-Taylor A (2000) Airway inflammation after con-trolled exposure to diesel exhaust particulates. Am J Respir Crit Care Med 162, 161–6.
14) Mudway IS, Stenfors N, Duggan ST, Roxborough H, Zielinski H, Marklund SL, Blomberg A, Frew AJ, Sandström T, Kelly FJ (2004) An in vitro and in vivo inves-tigation of the effects of diesel exhaust on human airway lining fluid antioxidants. Arch Biochem Biophys 423, 200–12.
15) Stenfors N, Nordenhäll C, Salvi SS, Mudway I, Söderberg M, Blomberg A, Helleday R, Levin JO, Holgate ST, Kelly FJ, Frew AJ, Sandström T (2004) Different airway inflam-matory responses in asthmatic and healthy humans exposed to diesel. Eur Respir J 23, 82–6.
16) Madden MC, Stevens T, Case M, Schmitt M, Diaz-Sanchez D, Bassett M, Montilla TS, Berntsen J, Devlin RB (2014) Diesel exhaust modulates ozone-induced lung function dec-rements in healthy human volunteers. Part Fibre Toxicol 11, 37.
17) Zhang X, Duan H, Gao F, Li Y, Huang C, Niu Y, Gao W, Yu S, Zheng Y (2015) Increased micronucleus, nucleoplasmic bridge, and nuclear bud frequencies in the peripheral blood lymphocytes of diesel engine exhaust-exposed workers. Toxicol Sci 143, 408–17.
18) Fenech M (2002) Chromosomal biomarkers of genomic instability relevant to cancer. Drug Discov Today 7, 1128–37.
19) Grivennikov SI, Greten FR, Karin M (2010) Immunity, inflammation, and cancer. Cell 140, 883–99.
20) Scott HA, Gibson PG, Garg ML, Pretto JJ, Morgan PJ, Callister R, Wood LG (2012) Relationship between body composition, inflammation and lung function in overweight and obese asthma. Respir Res 13, 10.
21) Miller MR, Hankinson J, Brusasco V, Burgos F, Casaburi R, Coates A, Crapo R, Enright P, van der Grinten CP, Gustafsson P, Jensen R, Johnson DC, MacIntyre N, McKay R, Navajas D, Pedersen OF, Pellegrino R, Viegi G, Wanger

DEE EXPOSURE AND LUNG FUNCTION 23
J; ATS/ERS Task Force (2005) Standardisation of spirome-try. Eur Respir J 26, 319–38.
22) NIOSH (1999) Method 5040 Issue 3 (Interim): Elemental Carbon (Diesel Exhaust). In NIOSH Manual of Analytical Methods (NIOSH), 4th ed., National Institute of Occupa-tional Safety and Health, Atlanta, GA.
23) OSHA (1986) Coal tar pitch volatiles (CTPV), coke oven emissions (COE), and selected polynuclear aromatic hydro-carbons (PAHs). In OSHA Sampling & Analytical Methods (OSHA), Salt Lake City, UT.
24) Huang C, Yan H, Pan Z, Dai Y, Niu Y, Wang Y, Zheng Y (2010) Using HPLC-MS/MS method to analyze monohy-droxy metabolites of PAHs in urine. Wei Sheng Yan Jiu 39, 355–7, 60.
25) Fenech M (2007) Cytokinesis-block micronucleus cytome assay. Nat Protoc 2, 1084–104.
26) Fenech M, Chang WP, Kirsch-Volders M, Holland N, Bonassi S, Zeiger E; Human MicronNucleus project (2003) HUMN project: detailed description of the scoring criteria for the cytokinesis-block micronucleus assay using isolated human lymphocyte cultures. Mutat Res 534, 65–75.
27) Benjamini Y, Hochberg Y (1995) Controlling the false dis-covery rate: a practical and powerful approach to multiple testing. J R Stat Soc B 57, 289–300.
28) Ulfvarson U, Alexandersson R, Dahlqvist M, Ekholm U, Bergström B (1991) Pulmonary function in workers exposed to diesel exhausts: the effect of control measures. Am J Ind Med 19, 283–9.
29) Rojas-Martinez R, Perez-Padilla R, Olaiz-Fernandez G, Mendoza-Alvarado L, Moreno-Macias H, Fortoul T, McDonnell W, Loomis D, Romieu I (2007) Lung function growth in children with long-term exposure to air pollutants in Mexico City. Am J Respir Crit Care Med 176, 377–84.
30) Gauderman WJ, Vora H, McConnell R, Berhane K, Gilliland F, Thomas D, Lurmann F, Avol E, Kunzli N, Jerrett M, Peters J (2007) Effect of exposure to traffic on lung development from 10 to 18 years of age: a cohort study. Lancet 369, 571–7.
31) Gehring U, Gruzieva O, Agius RM, Beelen R, Custovic A, Cyrys J, Eeftens M, Flexeder C, Fuertes E, Heinrich J, Hoffmann B, de Jongste JC, Kerkhof M, Klümper C, Korek M, Mölter A, Schultz ES, Simpson A, Sugiri D, Svartengren M, von Berg A, Wijga AH, Pershagen G, Brunekreef B (2013) Air pollution exposure and lung function in children: the ESCAPE project. Environ Health Perspect 121, 1357–64.
32) Downs SH, Schindler C, Liu LJ, Keidel D, Bayer-Oglesby L, Brutsche MH, Gerbase MW, Keller R, Künzli N, Leuenberger P, Probst-Hensch NM, Tschopp JM, Zellweger JP, Rochat T, Schwartz J, Ackermann-Liebrich U; SAPAL-
DIA Team (2007) Reduced exposure to PM10 and attenuated age-related decline in lung function. N Engl J Med 357, 2338–47.
33) Rice MB, Ljungman PL, Wilker EH, Dorans KS, Gold DR, Schwartz J, Koutrakis P, Washko GR, O’Connor GT, Mittleman MA (2015) Long-term exposure to traffic emis-sions and fine particulate matter and lung function decline in the Framingham heart study. Am J Respir Crit Care Med 191, 656–64.
34) Adam M, Schikowski T, Carsin AE, Cai Y, Jacquemin B, Sanchez M, Vierkötter A, Marcon A, Keidel D, Sugiri D, Al Kanani Z, Nadif R, Siroux V, Hardy R, Kuh D, Rochat T, Bridevaux PO, Eeftens M, Tsai MY, Villani S, Phuleria HC, Birk M, Cyrys J, Cirach M, de Nazelle A, Nieuwenhuijsen MJ, Forsberg B, de Hoogh K, Declerq C, Bono R, Piccioni P, Quass U, Heinrich J, Jarvis D, Pin I, Beelen R, Hoek G, Brunekreef B, Schindler C, Sunyer J, Krämer U, Kauffmann F, Hansell AL, Künzli N, Probst-Hensch N (2015) Adult lung function and long-term air pollution exposure. ESCAPE: a multicentre cohort study and meta-analysis. Eur Respir J 45, 38–50.
35) Leroyer A, Jeandel F, Maitre A, Howsam M, Deplanque D, Mazzuca M, Nisse C (2010) 1-Hydroxypyrene and 3-hydroxybenzo[a]pyrene as biomarkers of exposure to PAH in various environmental exposure situations. Sci Total Environ 408, 1166–73.
36) Barbeau D, Marques M, Maitre A (2009) 3-Hydroxybenzo[a]pyrene as a new biomarker of exposure to carcinogenic polycyclic aromatic hydrocarbons. Toxicol Lett 189, S160.
37) Förster K, Preuss R, Rossbach B, Brüning T, Angerer J, Simon P (2008) 3-Hydroxybenzo[a]pyrene in the urine of workers with occupational exposure to polycyclic aromatic hydrocarbons in different industries. Occup Environ Med 65, 224–9.
38) Salvi S, Blomberg A, Rudell B, Kelly F, Sandström T, Holgate ST, Frew A (1999) Acute inflammatory responses in the airways and peripheral blood after short-term expo-sure to diesel exhaust in healthy human volunteers. Am J Respir Crit Care Med 159, 702–9.
39) Hatzis C, Godleski JJ, González-Flecha B, Wolfson JM, Koutrakis P (2006) Ambient particulate matter exhibits direct inhibitory effects on oxidative stress enzymes. Envi-ron Sci Technol 40, 2805–11.
40) Mannino DM, Reichert MM, Davis KJ (2006) Lung func-tion decline and outcomes in an adult population. Am J Respir Crit Care Med 173, 985–90.
41) Gold DR, Wang X, Wypij D, Speizer FE, Ware JH, Dockery DW (1996) Effects of cigarette smoking on lung function in adolescent boys and girls. N Engl J Med 335, 931–7.

L ZHANG et al.24
Industrial Health 2017, 55, 13–26
Supplement tables:
Table s1. Percentage predicted lung function indexes of non-DEE-exposed and DEE-exposed workers (mean±SD)
Percentage predictedlung function indexes
Non-DEE-exposed Workers(n=127)
DEE-exposed workers(n=137)
p-crude* p-adjust#
% VC (%) 109.50±12.89 109.01±11.97 0.749 0.791% FVC (%) 107.65±13.81 106.59±11.59 0.498 0.596% FEV1 (%) 102.33±11.69 98.63±11.94 0.012 0.012FEV1/FVC(%) 88.50±5.57 86.01±5.29 <0.001 <0.001% MMF (%) 98.60±23.03 87.00±20.34 <0.001 <0.001% PEF (%) 90.52±15.93 89.63±15.11 0.640 0.635% FEF25% (%) 95.27±18.13 91.24±15.61 0.053 0.061% FEF50% (%) 92.81±22.23 83.87±20.26 0.001 0.001% FEF75% (%) 80.84±23.51 70.86±20.55 <0.001 <0.001
%VC : percent predicted vital capacity, %FVC: percent predicted forced vital capacity, %FEV1: per-cent predicted forced expiratory volume in 1 second, %MMF: percent predicted maximal mid expi-ratory flow curve, %PEF: percent predicted peak expiratory flow, %FEF25%: percent predicted forced expiratory flow at 25% of FVC, %FEF50%: percent predicted forced expiratory flow at 50 % FVC, and %FEF75%: percent predicted forced expiratory flow at 75% of FVC. *t-test was used to compare values from both groups. #Multiple regression analysis of smoking status, alcohol use, and DEE exposure on different percentage predicted lung function variables.
Table s2. The lung function indexes grouped by DEE exposure duration in all study subjects (mean ±SD)
The lung functionindexes
DEE exposure duration (yr)
0 (n=127) 0–4 (n=23) 4–8 (n=42) >8 (n=72) p-trend*
VC (l) 4.52±0.69 4.81±0.60 4.61±0.60 4.34±0.56 0.510FVC (l) 4.45±0.74 4.75±0.58 4.50±0.58 4.24±0.53 0.427FEV1 (l) 3.93±0.64 4.12±0.51 3.83±0.54 3.65±0.47 0.015FEV1/FVC 0.89±0.06 0.87±0.06 0.85±0.05 0.86±0.05 0.002MMF (l/s) 4.71±1.09 4.54±0.94 4.18±0.93 4.20±0.94 0.001PEF (l/s) 8.28±1.44 8.78±1.67 8.22±1.25 8.05±1.42 0.272FEF25% (l/s) 7.78±1.47 7.83±1.70 7.50±1.23 7.33±1.17 0.024FEF50% (l/s) 5.42±1.35 5.19±1.13 4.78±1.14 4.86±1.26 0.004FEF75% (l/s) 2.49±0.81 2.42±0.62 2.15±0.63 2.09±0.59 0.001
See table 2 for abbreviations. *Multiple regression analysis of age, height, weight, smoking status, alcohol use, and DEE exposure duration on different lung function variables in all study subjects.

DEE EXPOSURE AND LUNG FUNCTION 25
Table s3. The lung function indexes in the non-DEE-exposed and DEE-exposed workers older than 20 years old (mean±SD)
The lung functionindexes
Non-DEE-exposed Workers(n= 111)
DEE-exposed workers(n=137)
p-crude* p-adjust#
VC (l) 4.49±0.71 4.50±0.60 0.865 0.276FVC (l) 4.38±0.74 4.41±0.59 0.750 0.408FEV1 (l) 3.86±0.64 3.78±0.53 0.287 0.012FEV1/FVC 0.88±0.06 0.86±0.05 0.001 0.001MMF (l/s) 4.65±1.09 4.25±0.94 0.002 0.001PEF(l/s) 8.29±1.41 8.22±1.43 0.730 0.616FEF25% (l/s) 7.77±1.45 7.47±1.29 0.086 0.075FEF50% (l/s) 5.37±1.36 4.89±1.20 0.004 0.002FEF75% (l/s) 2.44±0.82 2.16±0.61 0.003 <0.001
See table 2 for abbreviations. #Multiple regression analysis of age, height, weight, smoking sta-tus, alcohol use, and DEE exposure on different lung function variables in the non-DEE-exposed and DEE-exposed workers older than 20 years old.
Table s4. The lung function indexes grouped by tertiles of urinay total OH-PAHs level in the non-DEE-exposed and DEE-exposed workers (mean ±SD)
The lung function indexes Urinay total OH-PAHs (μg/g creatinine) p-trend*
DEE-exposed workers (n=137) T1<9.98 (n=45) T2 9.98–16.40 (n=47) T3 >16.40 (n=45)VC (l) 4.47±0.61 4.60±0.58 4.43±0.62 0.445FVC (l) 4.38±0.58 4.50±0.54 4.33±0.64 0.418FEV1 (l) 3.76±0.55 3.88±0.46 3.71±0.56 0.587FEV1/FVC 0.86±0.05 0.86±0.06 0.86±0.05 0.795MMF (l/s) 4.21±0.98 4.36±0.96 4.18±0.89 0.734PEF (l/s) 8.28±1.45 8.32±1.44 8.06±1.42 0.611FEF25% (l/s) 7.58±1.34 7.52±1.34 7.30±1.21 0.407FEF50% (l/s) 4.88±1.23 4.96±1.19 4.83±1.21 0.864FEF75% (l/s) 2.14±0.65 2.26±0.63 2.08±0.56 0.917
non-DEE-exposed workers (n=127) T1<2.96 (n=42) T2 2.96–7.60 (n=43) T3 > 7.60 (n=42)VC (l) 4.82±0.61 4.49±0.70 4.27±0.66 0.355FVC (l) 4.86±0.72 4.36±0.71 4.14±0.63 0.344FEV1 (l) 4.26±0.61 3.86±0.61 3.67±0.57 0.757FEV1/FVC 0.88±0.06 0.89±0.06 0.89±0.05 0.205MMF (l/s) 4.93±1.05 4.57±1.13 4.64±1.09 0.210PEF (l/s) 8.31±1.36 8.23±1.33 8.30±1.65 0.477FEF25% (l/s) 7.78±1.38 7.68±1.42 7.89±1.62 0.849FEF50% (l/s) 5.61±1.26 5.14±1.36 5.51±1.41 0.087FEF75% (l/s) 2.72±0.87 2.46±0.78 2.30±0.72 0.578
See table 2 for abbreviations. *Multiple regression analysis of age, height, weight, smoking status, alcohol use, and tertiles of urinay total OH-PAHs level on different lung function variables.
L ZHANG et al.26
Industrial Health 2017, 55, 13–26
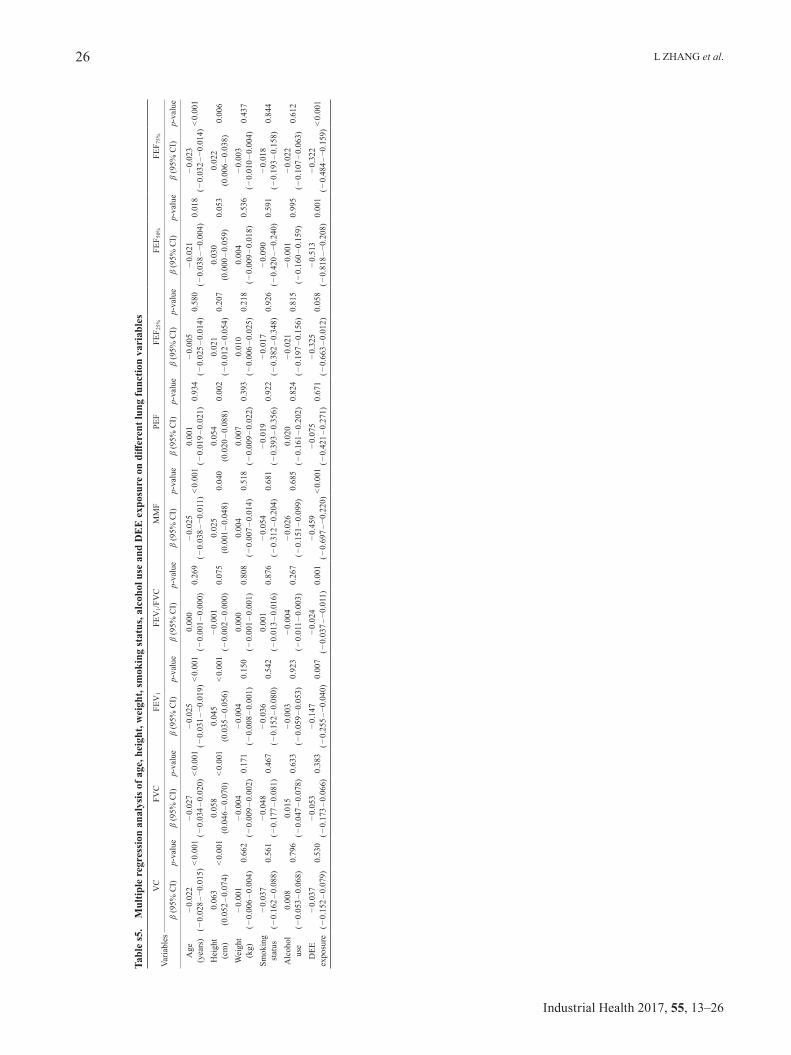
Tabl
e s5
. M
ultip
le r
egre
ssio
n an
alys
is o
f age
, hei
ght,
wei
ght,
smok
ing
stat
us, a
lcoh
ol u
se a
nd D
EE
exp
osur
e on
diff
eren
t lun
g fu
nctio
n va
riab
les
Varia
bles
VC
FVC
FEV
1FE
V1/F
VC
MM
FPE
FFE
F 25%
FEF 5
0%FE
F 75%
β (9
5% C
I)p-
valu
eβ
(95%
CI)
p-va
lue
β (9
5% C
I)p-
valu
eβ
(95%
CI)
p-va
lue
β (9
5% C
I)p-
valu
eβ
(95%
CI)
p-va
lue
β (9
5% C
I)p-
valu
eβ
(95%
CI)
p-va
lue
β (9
5% C
I)p-
valu
e
Age
(yea
rs)
−0.
022
(−0.
028–
−0.0
15)
<0.
001
−0.
027
(−0.
034–
0.02
0)<
0.00
1−
0.02
5 (−
0.03
1–−0
.019
)<
0.00
10.
000
(−0.
001–
0.00
0)0.
269
−0.
025
(−0.
038–
−0.0
11)
<0.
001
0.00
1 (−
0.01
9–0.
021)
0.93
4−
0.00
5 (−
0.02
5–0.
014)
0.58
0−
0.02
1 (−
0.03
8–−0
.004
)0.
018
−0.
023
(−0.
032–
−0.0
14)
<0.
001
Hei
ght
(cm
)0.
063
(0.0
52–0
.074
)<
0.00
10.
058
(0.0
46–0
.070
)<
0.00
10.
045
(0.0
35–0
.056
)<
0.00
1−
0.00
1 (−
0.00
2–0.
000)
0.07
50.
025
(0.0
01–0
.048
)0.
040
0.05
4 (0
.020
–0.0
88)
0.00
20.
021
(−0.
012–
0.05
4)0.
207
0.03
0 (0
.000
–0.0
59)
0.05
30.
022
(0.0
06–0
.038
)0.
006
Wei
ght
(kg)
−0.
001
(−0.
006–
0.00
4)0.
662
−0.
004
(−0.
009–
0.00
2)0.
171
−0.
004
(−0.
008–
0.00
1)0.
150
0.00
0 (−
0.00
1–0.
001)
0.80
80.
004
(−0.
007–
0.01
4)0.
518
0.00
7 (−
0.00
9–0.
022)
0.39
30.
010
(−0.
006–
0.02
5)0.
218
0.00
4 (−
0.00
9–0.
018)
0.53
6−
0.00
3 (−
0.01
0–0.
004)
0.43
7
Smok
ing
stat
us−
0.03
7 (−
0.16
2–0.
088)
0.56
1−
0.04
8 (−
0.17
7–0.
081)
0.46
7−
0.03
6 (−
0.15
2–0.
080)
0.54
20.
001
(−0.
013–
0.01
6)0.
876
−0.
054
(−0.
312–
0.20
4)0.
681
−0.
019
(−0.
393–
0.35
6)0.
922
−0.
017
(−0.
382–
0.34
8)0.
926
−0.
090
(−0.
420–
−0.2
40)
0.59
1−
0.01
8 (−
0.19
3–0.
158)
0.84
4
Alc
ohol
use
0.00
8 (−
0.05
3–0.
068)
0.79
60.
015
(−0.
047–
0.07
8)0.
633
−0.
003
(−0.
059–
0.05
3)0.
923
−0.
004
(−0.
011–
0.00
3)0.
267
−0.
026
(−0.
151–
0.09
9)0.
685
0.02
0 (−
0.16
1–0.
202)
0.82
4−
0.02
1 (−
0.19
7–0.
156)
0.81
5−
0.00
1 (−
0.16
0–0.
159)
0.99
5−
0.02
2 (−
0.10
7–0.
063)
0.61
2
DEE
expo
sure
−0.
037
(−0.
152–
0.07
9)0.
530
−0.
053
(−0.
173–
0.06
6)0.
383
−0.
147
(−0.
255–
−0.0
40)
0.00
7−
0.02
4 (−
0.03
7–−0
.011
)0.
001
−0.
459
(−0.
697–
−0.2
20)
<0.
001
−0.
075
(−0.
421–
0.27
1)0.
671
−0.
325
(−0.
663–
0.01
2)0.
058
−0.
513
(−0.
818–
−0.2
08)
0.00
1−
0.32
2 (−
0.48
4–−0
.159
)<
0.00
1