long term financial forecast - unified government€¦ · long-term challenges include achieving...
TRANSCRIPT

LONG TERM FINANCIAL FORECAST FISCAL YEARS
2018 TO 2027

for information contact: Chief Financial Officer
Kathleen VonAchen
701 N. 7th Street
Kansas City, Kansas
(913) 573-5186
finance department contributors Debbie Jonscher Reginald Lindsey Debbie Pack Michael Peterson Jud Knapp Alyse Villarreal Mike Grimm
image credits All artwork produced by youth and volunteers of the Community Housing of Wyandotte County (CHWC), Community Building and Engagement project, encouraging physical activity and creativity. The artwork is from the Arts Squad and the Community Alley Renovation program.
CHWC’s Community Building & Engagement

Executive Summary ……………………………………… 1 Economic Overview ……………………………………… 3 General Fund Long Term Financial Forecast ……. 9 Outstanding Debt Profile ……………………………. 16 SOAR Initiative …………………………………………..….. 19 Revenues …………………………………………………….. 23 Expenditures ………………………………………………… 39 Conclusion ……………………………………………………. 53 Endnotes ……………………………………………………… 54
Unified Government of Wyandotte County / Kansas City, Kansas 701 North 7th Street, Kansas City, KS 66101 P 913-573-5280 W wycokck.org
TABLE OF CONTENTS
I
II
III
IV
V
VI
VII

Community Building and Engagement (CB&E) – 2016 Projects
• A Cup on the Hill - 11,757 transactions equaling $57,711 gross sales, 48 Firehouse Friday community coffees with an
average attendance of 12 people equaling 576 individual engagements. Selected Business of the Month by Downtown Shareholders
• EPIC ARTS Clay Studio - 1,440 hours of individual instruction of youth with special needs, 620 individual hours of instruction with seniors, 1,080 hours of open studio format, no data on number of individual adult engagement.
• Splitlog Farm = 700 hours of individual instruction of preschoolers from MEP school. Over 1,600 of fresh produce distributed to the surrounding neighborhood, Taco El Tio restaurant, and over 60 pounds of greens for school lunch in the months of May and November.
• Art Classes - 154 hours of individual of Art instruction in summer Art classes at Waterway Park and Splitlog Farm. • Waterway Park - Arranged 2 soccer clinics for youth, 80 individual instructional hours. • Events planned - 7 events planned including 2 picnics, 2 neighborhood cleanups, and 3 neighborhood circle lunches with
total engagement of 168 people. • Murals painted - 11 new murals painted in alleyways. • Recycling Program - Worked with 11 students from MEP to encourage recycling in the Bethany neighborhood. Raised $800
to buy 50 recycling containers, purchased 15 t-shirts for students, and helped students present recycling projects to the PTA. • Volunteer service hours - Coordinated 2,000 volunteer hours to work on CB&E projects. Ninety percent of participates are
ages 13-19 years of age. • CB&E projects and programs employ - 1-75% time Director, 1- 75% café’ manager, 1-60% time barista, 1- 30%
community mobilizer, 1-10% time Farm manager, and 1 monthly stipend for ceramic tech at the EPIC Clay studio.
CHWC’s Community Building & Engagement

The Fiscal Year 2018 to 2027 General Fund Long Term Financial Forecast (LTFF), which marks the beginning of the FY 2018 budget planning process, projects the use of $5.76 million in General Fund reserves for FY 2018. Although economic indicators and rebounding tax revenues reveal that the Unified Government of Wyandotte County/ Kansas City, Kansas has reached a turning point from the Great Recession, this Forecast reflects financial obligations and one-time retirement payouts that diminish the positive outlook in the first three years of the ten-year forecast.
Despite improving revenue receipts as projected forward and the influx in 2017 of $12 million in sales and use tax revenue from the early payoff of the STAR bonds, the Unified Government continues to face challenges, both near-term and long-term. In the near-term years 2018 to 2023, an estimated $29 million in one-time costs are required to be paid to eligible retirees for accrued leave payouts and KP&R retirement special payments upon their separation from UG service. Another near-term uncertainty is the renewal of the 3/8th (0.375%) cent Dedicated Sales Tax for public safety and infrastructure operating and capital needs expiring April 2020. The table summarizes the Forecast and provides a quick view of the annual net margin between revenues and expenditures.
Baseline Long Term Financial Forecast Fiscal Year 2018 - 2027
($s in 000s) 2017(a) 2018 2019 2020 2021 2022 2023 2024(b) 2025 2026 2027
Total Revenue - $209,176 $213,285 $217,134 $221,072 $225,100 $229,221 $233,436 $237,746 $242,155 $246,664Total Expenditures - $212,752 $213,397 $218,141 $216,001 $220,527 $224,778 $221,837 $224,578 $227,115 $230,072Net Annual Surplus / (Shortfall) - ($3,575) ($113) ($1,007) $5,070 $4,573 $4,443 $11,599 $13,169 $15,040 $16,592
Net Operating Margin (Cummulative) $0 ($3,575) ($3,688) ($4,695) $376 $4,948 $9,391 $20,990 $34,158 $49,198 $65,790
(b) Assuming the estimated available fund balance of $24 million at the end of 2017, the recommended reserve of 2-mos of operating expenditrures (16%) is reached in 2024.(a) For the Forecast, the Net Operating Margin (Cummulative) approach is used which assumes that no beginning fund balance is available prior to the forecast period.
EXECUTIVE SUMMARY
1

More detailed information on all the major revenue and expenditure categories is provided in the subsequent sections, including discussions of past performance and assumptions of projected future performance. Various costs and long-term liabilities not included in the Forecast are also discussed. Long-term challenges include achieving the Commission’s goal to provide property tax relief to our citizens, while correspondingly identifying resources to invest in our aging public facilities and equipment. UG’s over 150 public facilities and buildings are aging, and these deferred maintenance and infrastructure costs are estimated to total over $500 million. Another challenge is that although statutorily precluded from augmenting employer contribution levels above the legal cap, the UG’s portion of the KPERS net pension liability is $147 million, which is expected to worsen with the recent change in the investment rate of return actuarial assumptions. While the UG is addressing these short-term and long-term issues, the UG need to continue reviewing its operations and service delivery options. During 2017, staff intends to bring forward a policy framework for Commission discussion and input, which will guide staff in setting appropriate fees for various services based on the values of our community. Additionally, staff is beginning the process this 2017 in planning the implementation of Priority-Based Budgeting as a process for identifying alternative resource allocation options.
Fiscal Sustainability Proposals The following is a list of fiscal sustainability proposals:
• Update the General Fund Reserve Policy to increase the target reserve to two-months of operating expenditures or 16 percent, and add direction for how use of the reserve funds is to authorized and the means by which the resources are to be replenished once used;
• Establish a Separation Pay Internal Service Fund to set aside resources for accrued leave balance pay-outs at the time employees separate from UG service;
• Seek renewal of the 0.375 cent Dedicated Sales Tax for Public Safety and Street Infrastructure; • Capital financing City Debt mill rate increase is forecasted in 2019 or 2020 to support annual GO bond issuances of
$12-$14 million; • One-time resource influx into the Health Benefit and Workers’ compensation internal service funds would repair
the negative cash positions and provide sufficient resources to cover future claims incurred yet not reported estimated costs; • Develop a plan to address funding public facility deferred maintenance costs which would provide a framework for
future policy discussions surrounding identifying new resources to fund this initiative; • Adjust budget policy to allow for accumulation of resources for future equipment replacement costs.
2

In preparing the 2018 to 2027 General Fund Long Term Financial Forecast, key economic indicators and measures available through various publications and reports were reviewed. Overall, the economic overview calls for continued measured optimism as national and local economic conditions continue to produce uneven economic growth across regions and sectors.
A National View In a time of Twitter and 24-hour cable news, economic and political conditions across the nation can have an impact on our local economy. American mathematician and meteorologist Dr. Edward Lornez engineered the strange attractor notion and coined the term, Butterfly Effect. According to Lorenz, on any given day a butterfly can flap its wings in New York and in Kansas City you get rain instead of sunshine. The following is a chart of gross domestic product quarterly growth rates since the Great Recession.
The national economy has been slow to recover from the Great Recession of 2008-2009. Since the fourth quarter of 2009, the gross domestic product growth rate exceeded 1.5 percent only twice, during mid-2014 when sudden declines in oil prices caused a shock that stalled one of the country’s best performing sectors and forced layoffs and appreciated dollar making exports more expense overseas. Over the past seven years since the recession, quarterly GDP has averaged at 0.95 percent. Since 2014, the economy has had sluggish growth with cyclical demand amongst quarters. Economists observe that consumers, instead of taking the money saved at the gasoline pump, have used it to pay back debt and rebuild savings.
ECONOMIC OVERVIEW
3

A Regional & Local View According to the KC Chamber’s 2017 Economic forecast, “The current recovery from the Great Recession has lasted longer than average…it’s stronger in terms of job growth, but weaker in terms of GDP growth. The KC Metro area has struggled compared to its peers in these areas, but is strong in median household income growth. In response, leaders are focused on improving key drivers of the economic prosperity: quality jobs, GDP and median household income”.
Wyandotte County’s population is 8 percent higher than it was ten years ago, or an annual average growth rate of 0.75 percent. While this is a very modest growth rate, many communities in the state are experiencing declines in population.
Wyandotte County’s unemployment rate has been declining, from 10.7 percent in 2009 to 5.8 percent in 2016. The rate for the County is still above the national level, but is decreasing at a rate consistent with the national rates. Since 2010, the County unemployment rate is an average of 0.6% higher than the national unemployment rate. The Forecast uses a 10-year annual average percentage change assumption with unemployment continuing to decline of the rate by a 1.8 percentage factor year-over-year.
4

Wyandotte County has seen an increase in jobs over the past five years due to several companies relocating to the area. The total number of estimated jobs in 2016 of over 90,000 at 11 percent higher than the number of jobs in 2011. The largest growth has been in the services sector, the top blue line. New developments underway, such as the Amazon Distribution Center, will bring 1,000 to 2,500 additional jobs in 2017 and 2018. The Forecast uses the average annual percentage increase in jobs over the past ten years of 1.4 percent, as a predictor of future job growth. Adjustments have been made in 2017 and 2018 to reflect know industries expansions.
Kansas City, Kansas and Wyandotte County’s median household income is approximately $42,000, and has grown at a level consistent with the State. Kansas City, Kansas has a slight increase over the growth of the County and State levels. Kansas City, Kansas median household income over the five year period grew 11.4 percent. Although 2015 saw a substantial increase in median household incomes for Kansas City, Kansas, that income level of $42,000 is still 27 percent below the national average for median household income.
5

From 2011 to 2015 Wyandotte County had the 3rd highest annual average wages in the State at $49,972. County wages are 12.3 percent higher than in 2011. The national average wage index for 2015 had wages at $48,000. Although still improving over the period, the Kansas City, Kansas wages were still only 91 percent of the national average.
Although mean household income and average annual wages have been growing at conservative levels over the past ten years, substantial growth has occurred in retail sales and food services and accommodations. Over the 13-year period, the average annual percentage growth was 4.6 percent. In 2015 the growth rate was 9 percent over the prior year, and in 2016 the growth was 11 percent. Considering County resident wage and income factors, this increase in retail sales can be attributed to retail transactions derived from people living outside the County.
6

7

8

The FY 2018-2027 General Fund LTFF projects the use of $5.76 million in General Fund reserves for FY 2018. During this forecast period, the net annual surpluses and shortfalls range between a negative $3.6 million in FY 2018 and a positive $16.6 million in FY 2027 with an approximate net operating margin (cumulative) of a positive $65.8 million.
The Unified Government Commission General Fund Reserve Policy seeks to maintain at least 10 percent of General Fund operating expenditures as a reserve fund balance available for economic and/or budgetary uncertainty. Although estimated to be achieved during 2017, projections for 2018 bring the reserves level slightly below the 10 percent target. During the Forecast period this goal is met during 2021 once significant one-time expenditures projected for accrued leave and KP&F retirement special payments for expected retirees are completed. In order to meet these retiree obligations, the UG is projected to use reserves of $4.7 million during 2018 through 2020 from the estimated 2017 ending fund balance of $24 million. This projected use of fund balance will decrease the General Fund reserves from 11.6 percent of total expenditures at the end of 2017 to 8.9% at the end of 2020. For the UG’s General Fund size, a recommended reserve level is two months of operating expenditures, or 16 percent. Given assumptions in the Forecast, this recommended 16 percent reserve is reached in 2024 by depositing $25.6 million to reserves (the sum of net annual surplus/shortfalls between 2021 and 2024). Surpluses during 2025 thru 2027 cumulatively total $45 million raise the reserve to 39% in 2027. For purposes of this Forecast, the net operating margin approach is used to single out transactions only occurring during the forecast year, in the absence of prior year fund balance reserves. The net annual surplus / shortfall reflects the variance between the projected General Fund revenues and expenditures for each year of the forecast. The net operating margin (cumulative) tallies each year’s performance cumulatively over the Forecast period, resulting in the estimated change to beginning fund balance at the end of the Forecast period. Over the Forecast period, $65.8 million would have been set aside towards the General Fund reserve by 2027.
GENERAL FUND LONG TERM FINANCIAL FORECAST
9

Base Long Term Financial Forecast Fiscal Year 2018 - 2027
During the Forecast period, the net annual surpluses / (shortfalls) fluctuate between a negative $3.6 million and $16.6 million. Although this Forecast projects moderate revenue growth, annual resources in 2018 through 2020 are insufficient to meet the large one-time payments required of the Unified Government in the first three years of the Forecast and moderately keeps pace with expenditure needs with small net annual surpluses of $4 million in 2021 through 2023. Although healthy surpluses are forecasted in 2024 through 2027, the Forecast does not include various potential risks and or long-term liabilities as discussed in the following pages of this section of the report. The graph below provides an illustration of the operating margins of the base forecast described above.
($s in 000s) 2017(a) 2018 2019 2020 2021 2022 2023 2024(b) 2025 2026 2027
Total Revenue - $209,176 $213,285 $217,134 $221,072 $225,100 $229,221 $233,436 $237,746 $242,155 $246,664Total Expenditures - $212,752 $213,397 $218,141 $216,001 $220,527 $224,778 $221,837 $224,578 $227,115 $230,072Net Annual Surplus / (Shortfall) - ($3,575) ($113) ($1,007) $5,070 $4,573 $4,443 $11,599 $13,169 $15,040 $16,592
Net Operating Margin (Cummulative) $0 ($3,575) ($3,688) ($4,695) $376 $4,948 $9,391 $20,990 $34,158 $49,198 $65,790
(b) Assuming the estimated available fund balance of $24 million at the end of 2017, the recommended reserve of 2-mos of operating expenditrures (16%) is reached in 2024.(a) For the Forecast, the Net Operating Margin (Cummulative) approach is used which assumes that no beginning fund balance is available prior to the forecast period.
10

Forecast Potential Risks and Long-Unfunded Term Liabilities It should be noted that this Forecast, as outlined in the following sections of this report, does not include the following potential impacts to the 2017 Projected Budget nor the out-years of the Forecast:
1. Labor Negotiations: The Unified Government has twelve of thirteen employee organization (labor) agreements expiring December 31, 2017. Although some funding has been included in the 2018 salary cost line for potential contract costs resulting from the re-negotiations of these labor agreements, any agreements reached between the UG’s employee organizations and the UG administration above the estimated costs will be incorporated into future budgets and forecasts, as applicable. As detailed in the expenditure section, beyond 2018 the Forecast assumes no cost of living adjustments for salaries and no additional employee positions to avoid signifying a future commitment and to provide a clear outlook of the affordability of future salary increases.
2. Future Retiree Payout Assumptions: As discussed in the expenditure section, nearly one-fourth of the UG-wide labor force is expected to retire in the next five or six years. Assumptions have been made in forecast to reasonably predict the timing of these retirements, the expected accrued vacation and sick leave balances, and contribution amounts to the pension funds for additions to these retiring employees actuarial pension liability resulting from the additional final compensation calculation incurred from the leave balance payouts at separation. These costs are one-time in nature, and the amounts and timing are subject to change depending on the decisions of retiring employees. Assumptions have also been made for the potential salary savings the UG might experience following the retirements. These required costs are significant, estimated to be $28 million over the next five years. Staff recommends the creation of a Separation Pay Internal Service Fund and that the associated annual cost estimates in this Forecast be deposited for each of the next five years to this new fund to reserve these resources for these required costs, and that all associated payments be made from the newly created fund.
Additionally, staff plans to research possible solution to diminish or smooth the pay-out timing of the one-time accrued leave balance pay-outs of expected retirees. One option being explored is to offer retirement-eligible employees the opportunity, on a voluntary basis, to begin liquidating a portion of their accrued leave payouts for deposit into their tax-deferred 457 deferred compensation plans. Discussions with KPERs are required to determine if this is a viable option.
3. Dedicated 0.375 cent Sales Tax for Public Safety and Street Infrastructure: The 3/8th cent Dedicated Sales Tax for public
11

safety and infrastructure operating and capital budgets of the Dedicated Sales Tax Fund is set to expire in April 2020. A voter revenue measure to renew of this sales tax measure is planned for the fall of 2018. If this tax is not renewed, the General Fund must assume an additional $9.6 million in operating and street improvement capital projects and operational costs without an additional resource.
4. Loss of State of Kansas Motor Fuels Tax or other state revenue sharing: Given the worsening financial outlook of the State of Kansas, any revenue sharing to local governments could potentially be at risk. The UG receives $6.8 million in state motor fuels tax revenue budgeted in the Street and Highway Fund. Any reduction of this revenue sharing source will need to be covered by the UG General Fund without an additional resource to offset these roadway development and maintenance costs.
5. Capital Debt Financing Policy: Given the anticipated capital financial plan of annually issuing $12 to $14 million in general obligation debt to meet our street infrastructure and other public facility needs, the Forecast anticipates a mill levy rate increase will be required for the City Debt mill levy rate sometime between 2019 or 2020.
6. Health Benefits Internal Service Fund Shortfalls: The UG Health Benefits Internal Service Fund is a self-funded plan with an excessive insurance policy for claims more than $325,000. Although substantial contributions, over $30 million, are made to cover annual costs, annual health care claims can exceed estimated costs resulting in the Fund’s deficit positon. Additional resources are then required to maintain the financial position of the fund. As of January 30, 2017, this fund as a negative cash balance of $2.3 million thru 12/31/2016 due to insufficient operating revenues to meet operating expenses. In addition, the reserves need to be augmented in this fund to cover the estimated liability of future costs of claims incurred but not yet reported totaling an additional $3 million. Total resources to bring this Fund to a sustainable position is $5.3 million.
7. Workers’ Compensation Internal Service Fund Shortfalls: The UG Workers’ Compensation Internal Service Fund is a self-
funded plan with an excessive insurance policy for claims more than $750,000. Although approximately $2 million in contributions are made to cover annual costs, annual worker injury health claims can exceed estimated costs resulting in the Fund’s deficit positon. Addition revenues are then required to maintain the financial position of the fund. As of January 30, 2017, this fund as a negative cash balance of $435,000 thru 12/31/2016 due to insufficient operating revenues to meet operating expenses. In addition, reserves need to be augmented in this fund to cover the estimated liability of future costs of claims incurred but not yet reported totaling $2 million. Total resources to bring this Fund to a sustainable position is $2.4 million.
12

8. Potential Litigation and Settlement Costs: The Unified Government is self-insured for liability claims with no premium paid to any insuring firm. All liability claims are reviewed, challenged if appropriate, and processed for payment at the agreed amount by the Legal Department. Kansas statutes limit the liability in tort cases to $500,000. Although $672,000 is budgeted to cover claims, judgements and settlements, unanticipated settlements may exceed this estimated cost. In additional, although necessary to take advantage of the opportunity to potentially mitigate legal settlement costs, the legal defense expenses for litigating lawsuits often exceeded budgeted estimates.
9. Deferred Facility Maintenance Costs: A compilation of the various condition assessment reports of the UG’s over 150 facilities and buildings will likely arrive at a very significant level of deferred maintenance costs; potentially totaling approximately over $500 million, given the size of UG organization and geographic service area. Due to the recent recession, on-going operating funding was unavailable to address these needs. Additionally, in the absence of a property tax mill rate increase or other identified resource, the UG’s current general obligation debt capacity is insufficient to finance this significant level of infrastructure investment. Funding these deferred maintenance costs will be challenging without additional resources. Staff will be working on meeting this challenge in future years.
10. Capital Equipment Replacement Costs: Many UG departments need the replacement of their aging capital equipment. Due
to the recent recession, funding was unavailable to address these needs. More funding has come available to provide for some replacements, however a dedicated fund for the replacement of capital equipment for into the future is a recommended practice and would contribute to smooth operations and better service delivery.
11. Unfunded Pension Liability: Based on the most recent July 2015 KPERS pension actuarial report, the UG-wide net pension liability (including the combined KPERS-Local and KP&F-Local group plans) totals $147 million, which represents a funding status of 65 percent (plan fiduciary net position as a percentage of the total pension liability).1 In other words, UG’s current proportion of the KPERS pension fund assets are 35 percent lower than the level of assets that would be sufficient to meet 100 percent of future retirement obligations of covered UG employees (of which those total obligations are based on actuarial assumptions). Although the Government Finance Officers Association (GFOA) recommends a policy of fully funding pension plans, credit rating agencies generally categorize pension plans with funding statuses between 80 percent and 90 percent as average or above average; and funding statuses between 60 percent and 70 percent as below average or weak.2 The KPERS assumptions are that should local governments annually contribute their contractually required contributions, their proportion of pension fund assets will attain the 100 percent funding status in 30 years. This assumption supports the rationale behind the required KP&F special retirement payments for retiring Police and Fire employees whose final
13

compensation calculations for future pension payment purposes are increased with the inclusion of accrued vacation and sick leave payouts at their separation from UG service. The UG is annually contributing 100 percent of its contractually required contributions, or $19.1 million in 2015.3 The UG is not legally required to contribute additional resources to reduce its net pension liability. State places a cap on the level of employer contributions, and the UG is contributing at this capped rate. Without a state law change, this unfunded net pension liability will remain on the UG balance sheet. Impact of the Change in Investment Rate Assumptions - At its November 2016 Board of Trustees meeting, KPERS (referring to both the KPERS-Local and KP&F-Local group plans) reduced their assumed investment rate of return from 8 percent to 7.75 percent, as part of its fiduciary duty to oversee the retirement system and make sure assets of the pension fund are sufficient to meet promised benefit obligations.4 KPERS had used the 8 percent investment rate since 1986. The decrease brings the assumption more in line with public pension industry assumptions. This change in the investment rate assumption will place an additional burden on municipal employer contributions to make up for the lower estimated investment returns over time. Beginning in 2019, employer contribution rates are estimated by KPERS to increase by 0.68 percent of the employees’ salary base (covered payroll).5 The statutory cap law, referenced earlier, also limits the level of annual rate increases KPERS can require of government entities, in such cases as due to changes in actuarial assumptions, up to 1.2 percent of covered payroll. This anticipated 2019 rate increase is 0.68 percent of covered payroll, below the annual capped increase. As of 2015, the UG employer contribution rates applied as a percentage of covered payroll were 9.48 percent for the KPERS-Local group plan and 21.36 percent for the KP&F-Local group plan.6 The distribution of covered payroll in 2015 was $37.4 million for KPERS-Local and $88.0 million for the KP&F-Local, for a total of $125.4 million in 2015. To simply the discussion of the change in the investment rate assumption rate, the average employer contribution rate for both KPERS and KP&F employees combined is 15.23 percent of 2015 covered payroll. For the UG, the investment rate assumption changes mean that employer contribution rates may increase from the average employer contribution rate of 15.23 percent of covered payroll to 15.91 percent of covered payroll, or an estimated 4.5 percent increase in total employer retirement contribution costs. In dollar terms, this translates to an estimated $853,000 in additional employer retirement contributions beginning in 2019 and every year thereafter, assuming covered payroll remains at 2015 levels. The Forecast includes this additional employer retirement contribution in the 2019 base; no other retirement assumptions changes are included in the Forecast.
14

The investment rate assumption change also means that the UG’s total net pension liability of $147 million will increase by approximately $16 million in 2016 or 2017. These estimates are based on the most recent 2015 KPERS valuation and will change after the 2016 valuation is released July 2017.
12. Changes in the local, regional and national economy: This Forecast assumes a steadily growing local economy. Any changes
may have positive or negative impacts on economically sensitive revenues, such as sales taxes constituting 23 percent of total General Fund revenues in 2018. National government policy changes could impact the business climate and job growth. The Forecast projection for job growth took the number of county jobs at the third quarter of 2016 and then applied the average annual growth in county jobs over a twelve-year period; an additional adjustment was made to reflect anticipated additions to the labor market because of the Amazon Distribution Center opening and other industry developments, adding 1,500 jobs to the 2017 calculated total and 1,000 more jobs in the 2018 calculated total.
At this time, staff projects the use of General Fund reserves of $4.3 million for 2017. This shortfall assumes the UG Commission Adopted General Fund Budget which programmed the use of $4.7 million in fund balance reserves, along with adjustments for lower municipal court fines revenues, lower franchise tax revenue estimates based on actual revenues in 2016, offset by an increase in the sales tax revenue estimate due to sales tax improved performance in the prior year 2016. These adjustments will be proposed as part of the 2017 Amended Budget mid-year review process.
Forecast Methodology The next sections of the report discuss the analysis and assumptions of major revenue and expenditures categories. The methodology for calculating changes for out-years of the Forecast (2018-2027) are based on historical analysis of increases with adjustments factored in for known items. Forecast assumptions vary per the respective revenue and cost category and, in most cases, are based on statistical correlation with the revenue or cost driver being statistical correlated to the revenue or cost category. Correlation is a statistical technique that can show whether and how strongly pairs of variables are related. A correlation is a single number that describes the degree of relationship between two variables, with the closer the correlation calculation approaches 1.0 the more correlated are the two variables. Staff also performed a reasonableness test of the results. This Forecast assumes that a recession and fall-off in economically sensitive revenues occurs once every seven to nine years. While it is not staff’s intent to predict the exact timing of the recession, its inclusion in the Forecast is to send a signal that a cyclical event, whereby revenues can drop dramatically, will inevitably occur. By using the historical average growth rate that incorporates the up
15

and down cycles over the past ten years, there is no single year in which a downturn is depicted. Instead, past downturns are factored into the average annual percentage growth rate used to forecast future revenue streams.
General Fund-Backed Debt Profile Kansas City, Kansas (City General) Debt Profile Although general obligation bonded debt service payments are accounted for in the City Bond and Interest Fund, not in the General Fund, this Forecast provides a profile of “General-Fund-backed” debt for future policy discussions. The outstanding general obligation debt is often referred to as “General Fund-backed” because of its general reliance on ad valorem property tax revenues as a repayment source. Misunderstandings appear to arise because references to the City General property tax mill levy rate include both the mill rate generating property tax revenues for the City General Fund operating needs and the mill rate generating property tax revenues pledged to the repayment of outstanding debt. For example, as part of the 2017 Budget the Commission adopted mill levy rate for the City General (total) amounted to 41.875 mills, but this total mill rate is separately recorded with the City General Fund (operating) receiving tax collections associated with a 25.093 mill rate, while the City Bond and Interest Fund dedicated mill levy rate is 16.782. Legally in accordance with the bond documents and for credit rating analyst review, the combined mill rate is considered, but for operational purposes these two mill levies are separately recorded and analyzed.
The chart displays the Kansas City, Kansas (City) debt service related property tax mill levy rate from 1982 to 2016. [As a note, mill levies are established in the year prior to the collection period; thus the 2016 levy associated revenues are budgeted in 2017.] Over the 33 years shown in the chart, the City Debt service mill levy increased from 11.495 in 1984 to 16.782 in 2016, or 32 percent. Over the past 20 years, a decrease of (3.8) percent occurred with the City Debt service mill levy from 17.449 in 1997 to 16.782 in 2016. The City Bond and Interest Fund expenditures, consisting of principal and interest debt service payments, are supported by a City debt service property tax mill rate of
16
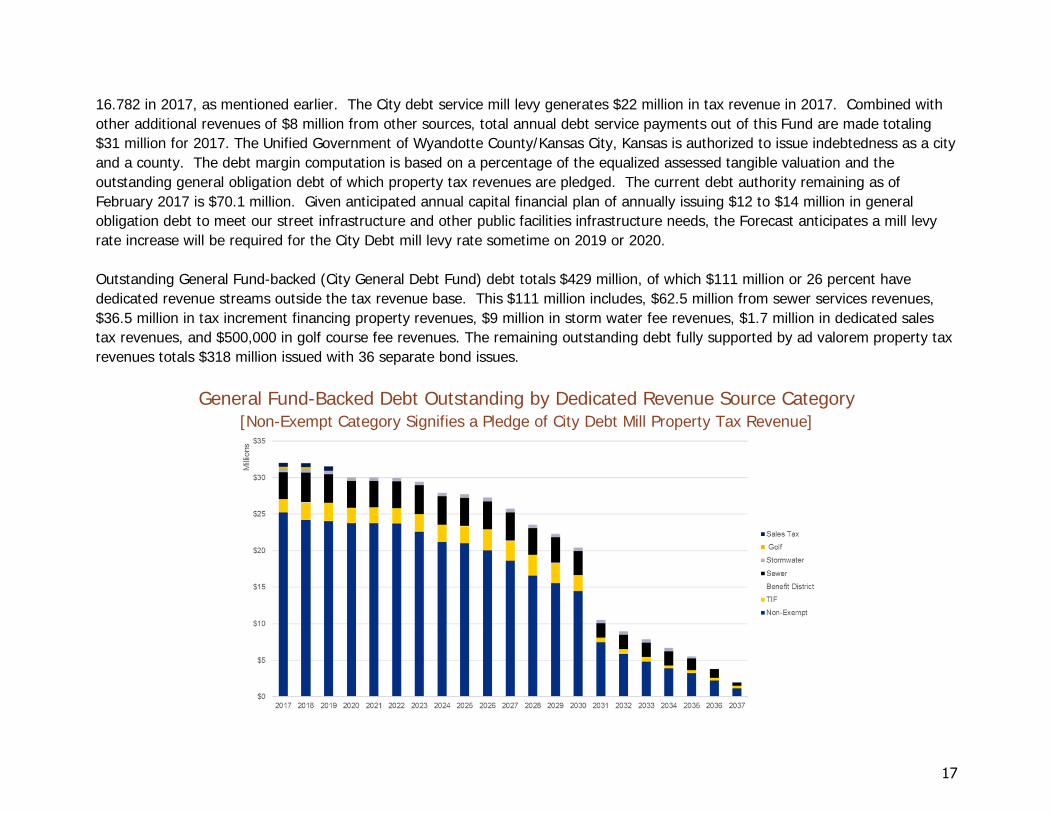
16.782 in 2017, as mentioned earlier. The City debt service mill levy generates $22 million in tax revenue in 2017. Combined with other additional revenues of $8 million from other sources, total annual debt service payments out of this Fund are made totaling $31 million for 2017. The Unified Government of Wyandotte County/Kansas City, Kansas is authorized to issue indebtedness as a city and a county. The debt margin computation is based on a percentage of the equalized assessed tangible valuation and the outstanding general obligation debt of which property tax revenues are pledged. The current debt authority remaining as of February 2017 is $70.1 million. Given anticipated annual capital financial plan of annually issuing $12 to $14 million in general obligation debt to meet our street infrastructure and other public facilities infrastructure needs, the Forecast anticipates a mill levy rate increase will be required for the City Debt mill levy rate sometime on 2019 or 2020. Outstanding General Fund-backed (City General Debt Fund) debt totals $429 million, of which $111 million or 26 percent have dedicated revenue streams outside the tax revenue base. This $111 million includes, $62.5 million from sewer services revenues, $36.5 million in tax increment financing property revenues, $9 million in storm water fee revenues, $1.7 million in dedicated sales tax revenues, and $500,000 in golf course fee revenues. The remaining outstanding debt fully supported by ad valorem property tax revenues totals $318 million issued with 36 separate bond issues.
General Fund-Backed Debt Outstanding by Dedicated Revenue Source Category [Non-Exempt Category Signifies a Pledge of City Debt Mill Property Tax Revenue]
17

The Unified Government is rated AA Stable by Standard & Poor’s credit rating agency and A1 Stable by Moody’s Investor Service. Both rating agencies in their recent reports affirmed they assessment that the UG had strong management practices, strong budgetary performance and flexibility, strong liquidity, yet weak economic factors and weak debt and contingent liability positions. Both also mentioned the ratings would improve if the level of outstanding debt diminished, maintained General Fund reserves at levels considered to be very strong (at between 10 percent and 15 percent of total expenditures) and if the County’s economic factors significantly improved.
General Fund-Backed Debt Outstanding by Bond Issuance Series
18

There is also a County Bond and Interest Fund for related debt financings with dedicated revenues consisting of lease payments derived from various sources. The only debt service payment made directly from the General Fund is the Soccer Stadium Parking General Obligation Bonds (Series 2010-H) with principal and interest payment amounting to $641,000 in 2018. The annual amounts included in the Forecast on based on the bond documents’ annual debt service schedule. This debt payment is 100 percent offset by Soccer Stadium Ticket Tax revenues received from the soccer facility. Annual Appropriation for Debt Included in the Operating Budget There are five debt obligations in which the bond documents require an appropriation be adopted annually to authorize the debt service payments from the General Fund should the primary dedicated revenue source pledged to debt repayment proves to be insufficient. These debt obligations, some of which the UG is not the obligor or issuer, include the 1999 Kansas Speedway International Corporation Taxable STAR Bonds, 1999 Kansas Speedway International Corporation Tax-Exempt STAR Bonds, the 2014 Kansas Speedway International Corporation Sales Tax Refunding Bonds, the 2015B Schlitterbahn Vacation Village STAR bonds, and the Prescott Plaza TDD Revenue bonds. The total of these annual appropriations in the 2017 budget is $9.6 million.
Stabilization, Occupation and Revitalization (SOAR)
In January of 2016 the Unified Government of Wyandotte County/Kansas City, Kansas established the SOAR program- Stabilization, Occupation, and Revitalization – to tackle the issues of housing rehabilitation and blight remediation within the county. The initiative focuses on breaking down the barriers and information silos within the organization and using its resources in a more strategic and effective manner. The premise involves using data to make strategic decisions on targeting, preventing, and remediating the problems that plague a community and cause property to fall into disrepair. This will involve reducing the amount of delinquent taxes, educating property owners about codes, and creating a database that can track and manage vacant properties and unfit structures.
The two overall goals of the initiative is to improve 10,000 properties by 2021 which should help both revitalize the housing stock, and improve the tax base, and to improve the perception of safety within the community which should both attract people in and stop the exodus out of the community.
19
The Unified Government has partnered with Bloomberg philanthropies and What Works Cities for the initial phase of this project. Two phases, the creation of an open data portal and the development of performance metrics, were addressed in this partnership. What Works Cities used its resources and aided the Unified Government in the implementation of an Open Data Policy and Open Data Portal to enable the sharing of data both internally and with the public. The performance management team came up with cascading goals and metrics that would analyze the progress for the 4-year period. More than a dozen departments are involved in aligning their missions with this effort. The next phases of the project include involving stakeholders in the implementation and partnering with a network of other cities to share ideas and progress toward improving the amount of healthy fabric within the community.
20

21

22

Unified Government General Fund Forecast for 2018-2027 projects a modest 2.4 percent increase in total revenues in 2018, and increases of between 1.8 percent and 2.0 percent in the remaining years. The fundamental economic drivers of lower unemployment, robust job growth and business activity, and improved assessed valuation are moving revenues upward.
Long Term Financial Forecast Fiscal Year 2018 - 2027
REVENUES
REVENUE & OTHER PROJECTED in 000s) 2017 2018 2019 2020 2021 2022 2023 2024 2025 2026 2027PROPERTY TAX $61,063 $62,184 $63,349 $64,535 $65,743 $66,974 $68,228 $69,505 $70,807 $72,133 $73,483SALES & USE TAX 48,992 49,814 50,596 51,285 51,985 52,697 53,422 54,158 54,907 55,668 56,442FRANCHISE TAX-ELECTRIC/WATER 31,171 32,488 33,145 33,815 34,499 35,197 35,910 36,637 37,379 38,136 38,910FRANCHISE TAX-OTHER SERVICES 8,315 8,454 8,594 8,735 8,879 9,028 9,182 9,341 9,504 9,672 9,845PERSONAL PROPERTY TAX 6,724 6,911 7,064 7,146 7,229 7,313 7,398 7,484 7,571 7,659 7,748OTHER TAXES 6,605 6,815 6,992 7,100 7,210 7,322 7,436 7,551 7,668 7,787 7,907DELINQUENT TAXES 3,454 3,590 3,732 3,879 4,031 4,190 4,355 4,526 4,704 4,890 5,082OCCUPATIONAL TAX 2,000 2,098 2,189 2,261 2,335 2,411 2,490 2,571 2,656 2,742 2,832IRB / TAX ABATEMENT FEES 1,298 1,323 1,347 1,372 1,398 1,424 1,451 1,478 1,506 1,534 1,562MORTGAGE REGISTRATION TAX 1,150 1,104 1,060 1,017 977 938 900 864 830 796 765SUBTOTAL: TAXES $170,772 $174,782 $178,068 $181,145 $184,287 $187,495 $190,771 $194,116 $197,530 $201,017 $204,576CHARGES FOR SERVICES 12,743 13,000 13,268 13,549 13,842 14,148 14,467 14,798 15,144 15,503 15,875FINES, FORFEITS, FEES 5,725 5,949 6,148 6,289 6,433 6,580 6,731 6,885 7,042 7,203 7,368INTERGVTAL REVENUES 4,464 4,569 4,678 4,788 4,902 5,018 5,137 5,259 5,384 5,512 5,642MISC. & INTEREST 3,546 3,620 3,696 3,774 3,853 3,934 4,016 4,101 4,187 4,275 4,365REIMBURSEMENTS 2,708 2,758 2,810 2,862 2,916 2,970 3,026 3,082 3,140 3,199 3,258PERMITS AND LICENSES 2,120 2,200 2,276 2,342 2,410 2,480 2,552 2,627 2,703 2,782 2,863SUBTOTAL: NON-TAXES $31,305 $32,096 $32,875 $33,604 $34,355 $35,130 $35,929 $36,752 $37,600 $38,473 $39,373TRANSFERS 2,256 2,298 2,341 2,385 2,429 2,475 2,521 2,568 2,616 2,665 2,715
TOTAL SOURCE OF FUNDS $204,334 $209,176 $213,285 $217,134 $221,072 $225,100 $229,221 $233,436 $237,746 $242,155 $246,664
23

The first table above provides revenue estimates which include year-over-year increases for this Forecast from 2018 to 2027. The second table above displays the steady growth projected for the General Fund’s revenue streams, by percentage. Fiscal year 2018 revenues are estimated to increase by $4.8 million or 2.4 percent. The STAR bonds early pay-off in December 2016 began bringing in an additional $12 million in sales and use tax revenue in 2017 to the City and County General funds ($9 million), the Dedicated
24
Sales Tax Fund ($1.8 million) and the Emergency Management Services Fund ($1.2 million). The General Funds $9 million portion of the STAR revenue increase the total sales and use revenue line by 24 percent, and increased UG’s reliance on sales tax from 19 percent of 2018 total revenues without the STAR revenue to 24 percent of total 2018 revenues with the $12 million STAR revenue. Based on the economic analysis presented in the previous section of this report, revenue estimates, which are primarily linked to the performance of the regional and local economy, are reflective of increased consumer spending, continued moderate increases in home prices, and strong job growth. The modest upward trend of the City’s tax revenue is expected to continue over the next 10 years. These tax revenues have significantly improved since the beginning of the Great Recession. This Forecast assumes that a recession and fall-off in economically sensitive revenues occurs once every seven to nine years. While it is not staff’s intent to predict the exact timing of the recession, its inclusion in the Forecast is to send a signal that a cyclical event, whereby revenues can drop dramatically, will inevitably occur. By using the historical average growth rate that incorporates the up and down cycles over the past ten years, there is no single year in which a downturn is depicted. Instead, past downturns are factored into the average annual percentage growth rate used to forecast future revenue streams.
25

The graph above depicts a historical and projected view of the top four major General Fund revenues, constituting 80 percent of total General Fund revenues. It includes 10 years of actual revenue history; the projections for 2017; as well as the projections for 2018 and subsequent years of the Forecast, based on current available data and application of annual average growth rates and economic factors. The following section is a detailed discussion of these General Fund tax revenue sources by category, as well as a discussion of delinquent property tax fees and interest income.
26

Property Tax Since the end of the Great Recession, property values and revenues have modestly increased at an annual average rate since 2013 of 1.4 percent. Since 2013, collections rose by an average of $845,000 per year. Contributing factors include tepid changes in single family home sale values, commercial property market activity, and incremental assessed value growth. The chart below illustrates county-wide assessed valuation since 2006, with 2017 value slightly over the same level ten years ago.
Property taxes are a focus of policy discussion since they comprise 30 percent of the total General Fund revenue base. Although this revenue category historically performs in a steady and predictable pattern, the recent near collapse of the housing market in many parts of the nation were a reminder of how sensitive some revenues sources are to broader economic indicators. This knowledge informs policy makers in developing sound fiscal policies that seek to mitigate sudden disruptions of UG operations resulting from
27

revenue losses. The previous page’s assessed value chart illustrates the 15.8 percent drop in assessed value between 2010 and 2012. The table below displays the impact of the Great Recession, with a property tax revenue decline of 9.4 percent in 2010 or a revenue loss of over $5 million; and 2011 was still $3 million below the 2009 levels. The total impact on property tax revenue loss during this two-year recessionary period was $8 million. The steep decline in the assessed value prompted the Commission to increase the mill rate (City and County combined) by 5.9 mills in 2012 to diminish the negative impact to service delivery.
Property Tax Mill Levy Rates – Historic Overview
The chart to the left illustrates property tax mill levy levels since 1984. The top two lines are the mill levies supporting property tax revenues deposited to the City and County General Funds to meet operational demands of the Unified Government. The bottom line is the mill levy supporting general obligation debt service payments in the City Bond & Interest Fund. Today’s 25.093 City General Fund mill levy rate (green line) is at its lowest point over this 33-year period, except in 2010 when it was a slight 0.2 lower than today. Conversely, the County General Fund mill levy rate (orange line) is at its highest point historically.
Discussions often reference the City General property tax mill levy rate to include both the mill rate generating property tax revenues for the City General Fund operating needs and the mill rate generating property tax revenues pledged to the repayment of outstanding debt. For example, as part of the 2017 Budget the Commission adopted mill levy rate for the City General (total)
Fiscal Year 2008 2009 2010 2011 2012 2013 2014 2015 2016 2017Revenue 52,730,005 54,848,571 49,678,709 51,639,599 56,837,214 57,493,825 58,487,765 58,605,683 60,118,941 61,063,442 Percent Change % 4.0% -9.4% 3.9% 10.1% 1.2% 1.7% 0.2% 2.6% 1.6%
28

amounted to 41.875 mills, but this “total” mill rate is separately recorded - with the City General Fund (operating) receiving tax collections associated with a 25.093 mill rate, while the City Bond and Interest Fund dedicated mill levy rate is 16.782. It is helpful to consider that these two mill levies are separately recorded and analyzed. [Refer to the Outstanding Debt Profile segment of the Long Term Financial Forecast Section in this report.] The policy question for discussion is whether the mill levy should be reduced. The following graph may provide additional information for this policy discussion. Displayed is the year-over-year percentage change in county assessed value since 2006 compared with the percentage change in the combined mill levies set for the County and City General Funds (which does not include the City Debt Service mill levy). The data shows that these two data sets have an inverse relationship. As assessed value grows, property tax mill rates are reduced; as assessed value growth diminishes, mill levy rates increase. Mill levy rates over the past ten years were adjusted generally when assessed valuation percentage change was greater than -5 /+5 percent. For 2018, one mill rate
equals $1,081,000 in General Fund property tax revenue. Several forecast years have been added to the graph for illustrative purposes. In the Forecast period, property tax revenue is projected to increase moderately by 1.9 percent over the Forecast period, which corresponds exactly to the projected 1.9 percent increase in assessed valuation. The assessed value projection of 1.9 percent is based on its historic annual average percentage increases during the five-year period between 2013 and 2017. Additionally, the average annual growth in property tax revenue over the past ten years was a modest 1.9 percent, which captured the peaks and valleys of this revenue source over the past decade. The Forecast assumes the property tax mill levies will remain flat during the Forecast period.
29

Sales Tax Sales tax revenue is the second largest General Fund revenue source constituting 24 percent of total 2018 revenues. The STAR bonds early pay-off in December 2016 began bringing in an additional $12 million in sales and use tax revenue in 2017 to the City and County General funds ($9 million), the Dedicated Sales Tax Fund ($1.8 million) and the Emergency Management Services Fund ($1.2 million). The General Funds $9 million portion of the STAR revenue influx increase the total sales and use revenue line in 2017 by 25 percent, and increased UG’s reliance on sales tax from 19 percent of 2008 revenues without the STAR revenue to 24 percent of total 2018 revenues. The table below displays the historic sales and use tax receipts over the past ten years. The average annual percentage growth of sales and use tax revenue over the period between 2008 and 2017 was 4.6%; but, excluding the influx of STAR revenue in the last month of 2016 and all months of 2017 results in an average annual increase in revenue is only 2.2 percent.
As part of the 2017 budget, the Commission reduced the property tax mill levy rate by two mills largely because of the significant influx of sales tax revenues during 2017 once the STAR bonds were paid off in December 2016. This policy decision shifted the burden of the Government’s dependency on tax revenue to sustain its operation from Kansas City, Kansas property owners to retail shoppers, some studies of which have 35 percent of retail shoppers in the Village West Shopping District are from outside Wyandotte County. In the future ten years, the Forecast projects an average annual growth rate of 1.4 percent for this revenue. This 1.4 percent is the combined average growth rates for inflation, housing price index, county job growth and growth in school enrollment, of which these four economic factors strongly correlated with the UG’s past ten years of sales tax revenue data.
Fiscal Year 2008 2009 2010 2011 2012 2013 2014 2015 2016 2017Revenue 33,256,316 29,861,968 29,590,523 32,033,764 32,763,449 34,639,631 36,024,497 37,877,475 41,833,947 48,991,572 Percent Change % -10.2% -0.9% 8.3% 2.3% 5.7% 4.0% 5.1% 10.4% 17.1%
Percent Change % without STAR revenues in 2016 & 2017 -10.2% -0.9% 8.3% 2.3% 5.7% 4.0% 5.1% 2.5% 3.0%
30

Franchise Taxes Franchise tax revenue is the third largest General Fund revenue source at $40 million constituting 19.7 percent of total 2018 revenues. A franchise tax is a tax levied by a local government against businesses and partnerships chartered within its boundaries. This is a privilege tax that gives the business the right to be chartered and/or operate within that entities boundaries. Local
government entities have the right to tax or “nexus” solely on the basis that a company has sales or otherwise derives an economic benefit from activities within their borders. Franchise taxes are determined based on either a flat fee or on the size of the business's total holdings or revenues.
The average annual percentage growth of franchise tax revenue over the period between 2010 and 2017 was 3.3%. Reliance on franchise taxes as a revenue source has dropped over the past eight years, at 20 percent in 2010 to a 19% reliance in 2017. This is due to authorized changes in the rate percentages used to calculate the franchise tax payments made by the Bureau of Public Utilities (BPU), of which many refer to as the “payment in lieu of tax” (PILOT). A 1% change in the franchise tax percentage represents approximately $3.0 million in revenue.
31

The tables below display the historic franchise tax collections by category over the past ten years, and the basis of the economic assumptions used to project the specific revenue source’s future performance. An increase in revenue from franchise tax for Electric/Water is anticipated because of the BPU service charge rate increases scheduled for 2017 and 2018. In 2017 the Board of Public Utilities has proposed rate increases of approximately 4% for 2017 and 2018 in electric services, which translates to additional franchise tax revenue to the UG. The reduction in the franchise rate in conjunction with electric and water rate increases kept the revenue constant from 2010 to 2012. The Forecast assumes electric franchise tax revenue will annually increase by an annual average growth rate of 2.1 percent over the ten-year period tied to BPU gross revenue growth, although an adjustment was made in 2018 to account for the anticipated rate increase. The water franchise revenue growth assumption is 1.4 percent tied to an average of annual average growth rates for inflation, population and school enrollment. Franchise Tax Revenue related to Electric Services
Franchise Tax Revenue related to Water Services
The increase in franchise tax revenue from the Sewer Fund is due to rate increase implemented over this same time. The Sewer Fund has increased rates by an average of 7% each year over the last several years. Rate increases are needed to offset expenses related to the consent decree from the US Environmental Protection Agency regarding combined sewer overflows. The sewer franchise revenue growth assumption is 2.5 percent tied to inflation plus population. Franchise Tax Revenue related to Sewer (Water Pollution) Services
Fiscal Year 2010 2011 2012 2013 2014 2015 2016 2017Revenue 23,362,404 23,644,884 23,118,675 22,515,613 26,150,783 25,328,564 25,192,764 25,971,200 Percent Change % 1.2% -2.2% -2.6% 16.1% -3.1% -0.5% 3.1%
Fiscal Year 2010 2011 2012 2013 2014 2015 2016 2017Revenue 4,341,784 4,465,455 4,554,209 4,600,293 5,100,917 5,171,500 5,210,196 5,200,000 Percent Change % 2.8% 2.0% 1.0% 10.9% 1.4% 0.7% -0.2%
Fiscal Year 2010 2011 2012 2013 2014 2015 2016 2017Revenue 3,051,356 3,252,713 3,652,698 3,716,327 4,023,392 4,360,174 4,719,704 4,750,000 Percent Change % 6.6% 12.3% 1.7% 8.3% 8.4% 8.2% 0.6%
32

Charges for Services Charges for services revenue is the fourth largest General Fund revenue source at $13 million constituting 6 percent of total 2018 revenues. User fees are charged to fund services that either the City provides or contracts with outside agencies to provide. Fees can be charged for services that are provided to all residents and businesses, or could be charged only to a specific user group. This also includes non-residents that are using the services. Charges and fees reduce the need for additional revenues and should be used to offset the cost of providing that service. For example, the city charges a monthly trash/recycling fee that is used to pay for trash pickup. Fees are also charged for recreational activities provided by the Parks Department. The table below displays the historic charges for services collections over the past ten years, and the basis of the economic assumptions used to project the specific revenue source’s future performance. The Forecast assumes different growth rates based on the individual service and its specific revenue performance history over the past ten years, coupled with the charge category’s statistically correlated economic factor.
Delinquent Property Tax Fees & Interest Income Delinquent property tax fees and interest income revenue totaling $3.5 million constituting 2 percent of total 2018 revenues is an important component to supporting the UG operations. With increased efforts to collect delinquent taxes, that revenue stream is expected to continue to grow.
With property taxes accounting for 30% of total General Fund revenues, the payment of delinquent property tax obligations is critical to providing basic public services, such as public safety and street maintenance. Public officials face deciding whether to cut or modify services, generate additional revenue, or borrow money to fund road improvements. Each of these solutions comes with a
Fiscal Year 2008 2009 2010 2011 2012 2013 2014 2015 2016 2017Revenue 9,428,580 10,824,893 13,431,859 13,090,914 13,589,865 12,551,377 13,159,108 12,852,583 13,122,899 12,743,300 Percent Change % 14.8% 24.1% -2.5% 3.8% -7.6% 4.8% -2.3% 2.1% -2.9%
Fiscal Year 2008 2009 2010 2011 2012 2013 2014 2015 2016 2017Revenue 2,064,125 2,667,533 2,436,801 2,949,893 3,092,393 3,917,842 3,986,157 3,287,334 2,839,393 3,454,424 Percent Change % 29.2% -8.6% 21.1% 4.8% 26.7% 1.7% -17.5% -13.6% 21.7%
33

tradeoff: cutting services can be politically infeasible, finding a new revenue source is difficult, and increasing the amount of debt creates an additional cost due in the bond interest. Delinquency Trends In estimating property tax revenue, Finance applies a discount factor for property tax payments not received based on the prior year delinquency percentage rate. In 2016 the delinquency rate was 6.9%, up from 5.9% the previous year. The cause of this recent increase is partially attributed to additional property tax appeals filed by corporations who are employers in our community. As the graph shows, the rate of property tax payment delinquency strongly correlates to the County’s unemployment rate. It rose during the recent economic downturn to a high of 11% in 2009, and has steadily improved since that time. The graph also shows that the UG delinquency rate far exceeds the national average of 2% to 5% during the past decade.1
Delinquency Rate Externalities Collection rates of 90% to 95% are viewed with satisfaction, but even these high rates frequently mask externalities. While maximizing this resource is challenging, there is a risk that the Governments’ financial needs are being exploited. In real terms, a 6.9% delinquency rate costs the Government $4.3 million in lost or delayed revenue, compared to the national average of 2% or $1.2 million. This net difference of $3.1 million could have been used to reduce the property tax rate, augment public safety services, engage in neighborhood enhancement efforts as part of the SOAR initiative, or assist in funding street improvements ranked as our resident’s highest priority in the recent community survey. Even given recent low municipal tax-exempt interest rates, financing $3.1
million with general obligations bonds for street infrastructure costs an estimated $1.2 million in interest payments over 20 years, or 40% of the borrowed principal. Delinquency rates of 2% to 10% impose disproportionate negative consequences on neighborhoods, communities, and local government fiscal solvency. Calculations approximate that the Unified Government has between $6 million and $8 million in past
34

due property tax revenues, after discounting for balances that are highly unlikely to be collected. Homeownership Inhibited Property tax delinquency is an important issue for mortgage lenders and may inhibit the availability of mortgage loans to Wyandotte County citizens seeking to purchase a new home. Since property tax payments are often correlated to mortgage payments, property tax delinquency may be associated with an increased risk of future mortgage delinquency. Property tax payment delinquency often proceeds mortgage delinquency.
Escrow vs. Non-Escrow Some of the challenge in collecting property taxes lies in the proportion of our taxpayers that own property free and clear without a mortgage and thus must make the semi-annual payment rather than having the tax payments collected monthly as part of their mortgage. The figure to the right shows the difference in delinquency rates between escrow and non-escrow accounts, based on national averages.2 This data is not available for Wyandotte County. The tax delinquency rate for non-escrow accounts is generally higher than escrow accounts, reflecting the fact that escrow
accounts help homeowners with budgeting and avoiding the payment shock that comes with a big lump sum tax bill. On the right axis is the national unemployment rate that shows that tax payments regardless of payment approach improves as the overall economy improves.
35

More attention can be given to the creation of an efficient, effective, and equitable system of property tax enforcement. Recent studies by property tax experts show that increasing the number of required tax payments for non-escrowed accounts from semi-annually to three per year decreased the delinquency rate by 1.2%.3 Further, as of 2012 at least 218 localities in 28 states are offering non-profits, especially education and health care institutions, to make payments in lieu of taxes (PILOTs) on a voluntary basis as a substitute for property taxes, with total collected amounting to $92 million per year.4 There a various reasons why non-profits offer PILOTs, and governments should weigh the pros and cons. After weighing the options of cutting services or finding new revenues, many local government elect to generate revenue through the sale of future receivables and property tax liens.5 A better understanding about the financial calculations of delayed enforcement, lack of enforcement, and the transfer of enforcement rights to a private third party will assist the Government in meeting its financial sustainability goal. The recent mortgage foreclosure crisis has renewed interest in implementing policies to help our County’s homeowners remain in their homes, while also ensuring the Government’s resources are made available to sustain safe and vibrant neighborhoods.
Forecast Methodology The methodology for calculating changes for out-years of the Forecast (2018-2027) are based on historical analysis of increases/decreases with adjustments factored in for known items. Forecast assumptions vary per the respective revenue and cost category and, in most cases, are based on statistical correlation with the revenue or cost driver being statistical correlated to the revenue or cost category. Correlation is a statistical technique that can show whether and how strongly pairs of variables are related. A correlation is a single number that describes the degree of relationship between two variables, with the closer the correlation calculation approaches 1.0 the more correlated are the two variables. Staff also performed a reasonableness test of the results.
36

37

38

In developing the Long Term Financial Forecast, the Adopted 2017 Budget General Fund expenditure categories were adjusted to reflect known changes. One-time 2017 cost items were removed from 2018, such as the new Fire contract 2017 retroactive pay adjustments. The tables below display a summary of the forecasted expenses and percentage changes. Over the ten-year period, total expenditure average annual growth is 1.0 percent. Compared to 2017 projected, the 2018 expenditures are estimated to increase by $4.1 million, or 2.0 percent, primarily due to a salary and benefit cost of living adjustment and one-time costs related to expected retirements.
Long Term Financial Forecast Fiscal Year 2018 - 2027
EXPENDITURES
EXPENDITURES & ProjectedOTHER USES ( $s in 000s) 2017 2018 2019 2020 2021 2022 2023 2024 2025 2026 2027SALARY $107,875 $108,936 $108,322 $108,093 $106,953 $106,229 $106,073 $106,128 $106,128 $106,128 $106,128BENEFITS 39,214 41,119 43,468 45,121 44,896 45,231 46,375 46,675 48,082 49,250 50,802LEAVE BENEFIT PAYOUTS 2,342 2,491 2,809 4,149 3,580 3,011 4,286 1,300 1,300 1,300 1,300 KP&F SPECIAL PAYMENTS 1,713 1,725 1,190 2,180 952 886 1,611 - - - - SUBTOTAL: SALARY & BENEFITS $151,145 $154,271 $155,788 $159,542 $156,381 $155,355 $158,345 $154,103 $155,510 $156,678 $158,230SERVICES 34,822 35,381 36,118 36,878 37,662 38,472 39,308 40,171 41,061 41,981 42,930SUPPLIES & MATERIALS 6,059 6,149 6,240 6,333 6,427 6,523 6,620 6,719 6,819 6,921 7,025GRANTS & CLAIMS 6,629 6,753 6,879 7,008 7,139 7,272 7,408 7,547 7,688 7,831 7,978CAPITAL OUTLAY 7,640 7,841 6,000 6,000 6,000 10,500 10,681 10,865 11,053 11,243 11,437DEBT SERVICE 642 641 644 639 639 640 639 641 643 643 641SUBTOTAL: OTHER OPERATING EXPENDITURES $55,791 $56,764 $55,880 $56,857 $57,867 $63,406 $64,656 $65,943 $67,263 $68,619 $70,011TRANSFERS / OTHER 1,705 1,717 1,729 1,741 1,753 1,765 1,778 1,791 1,804 1,818 1,831TOTAL USES OF FUNDS $208,641 $212,752 $213,397 $218,141 $216,001 $220,527 $224,778 $221,837 $224,578 $227,115 $230,072
39

Salary and Benefits The table above depicts the salaries and benefit costs for the next ten years. Total salary and benefits increase from $154 million in 2018 to $158 million in 2027. Over the Forecast period, salary and benefits costs gradually decrease in comparison to other operating expenditures. In 2018, salary and benefits costs represent 72.5 percent of the expenditure budget; while in 2027, the salary and benefits costs represent 69 percent. Due to the one-time nature of the leave benefit payouts and KP&F special payments associated with expected retirements, these costs are represented separately in the tables above. Over the ten-year Forecast period, the salary category has no average annual growth due to assumed salary savings following the departure of retiring employees, although a cost of living adjustment is included in the 2018 assumptions (no subsequent cost of living adjustment is assumed beyond 2018). Comparatively, the ten-year annual average growth of benefits costs is 2.6 percent reflecting expected increases in the employer contributions for pensions and health care benefits. The following sections describe the assumed adjustments in salary and benefit costs and depict the reasons for the increases amongst the various cost categories over the Forecast period.
EXPENDITURES &OTHER USES ( $s in 000s) 2018 2019 2020 2021 2022 2023 2024 2025 2026 2027SALARY 1.0% -0.6% -0.2% -1.1% -0.7% -0.1% 0.1% 0.0% 0.0% 0.0%BENEFITS 4.9% 5.7% 3.8% -0.5% 0.7% 2.5% 0.6% 3.0% 2.4% 3.2%LEAVE BENEFIT PAYOUTS 6.3% 12.8% 47.7% -13.7% -15.9% 42.4% - - - - KP&F SPECIAL PAYMENTS 0.7% -31.1% 83.3% -56.3% -7.0% 82.0% - - - - SUBTOTAL: SALARY & BENEFITS 2.1% 1.0% 2.4% -2.0% -0.7% 1.9% -2.7% 0.9% 0.8% 1.0%SERVICES 1.6% 2.1% 2.1% 2.1% 2.1% 2.2% 2.2% 2.2% 2.2% 2.3%SUPPLIES & MATERIALS 1.5% 1.5% 1.5% 1.5% 1.5% 1.5% 1.5% 1.5% 1.5% 1.5%GRANTS & CLAIMS 1.9% 1.9% 1.9% 1.9% 1.9% 1.9% 1.9% 1.9% 1.9% 1.9%CAPITAL OUTLAY 2.6% -23.5% 0.0% 0.0% 75.0% 1.7% 1.7% 1.7% 1.7% 1.7%DEBT SERVICE -0.2% 0.4% -0.7% 0.0% 0.0% -0.2% 0.4% 0.2% 0.0% -0.2%SUBTOTAL: OTHER OPERATING EXPENDITURES 1.7% -1.6% 1.7% 1.8% 9.6% 2.0% 2.0% 2.0% 2.0% 2.0%TRANSFERS / OTHER 0.7% 0.7% 0.7% 0.7% 0.7% 0.7% 0.7% 0.7% 0.7% 0.7%TOTAL USES OF FUNDS 2.0% 0.3% 2.2% -1.0% 2.1% 1.9% -1.3% 1.2% 1.1% 1.3%
40

Salary The Forecast is consistent with the City’s salary budget methodology used for the adopted budget. As such, positions are budgeted at actual rate of pay including benefits. Then, by position, salary costs are updated in accordance with the applicable labor contract between the UG and its labor groups. The 2018 salary forecast includes a 2 percent salary base cost of living increase per the labor contract with the International Association of Fire Fighters, Local 64 (IAFF) adopted in January 2017. Salary costs for all other (non-IAFF) employees are also forecasted to increase in 2018 to provide funding for the renegotiation of nearly all labor contracts up for renewal the end of 2017. Beyond 2018 the Forecast assumes no cost of living adjustments for salaries and no additional employee positions to avoid signifying a future Commission commitment and provide a clear outlook of the affordability of potential future salary increases. The Forecast includes annual one-time costs for accrued vacation and sick leave pay-outs for the expected retirements of a significant portion of the General Fund labor workforce. For clarity purposes, these one-time payments are presented separately in the above tables. The “Silver Tsunami” – Future Retirements Many articles in the popular press and public administration journals discuss the impending “silver tsunami” that will greatly impact local government’s financial statements. The “silver tsunami” is due to the retirement of the “baby boomers” – a demographic group born during the post-World War II baby boom approximately the years 1946 and 1964. This includes people who are between 53 and 71 years old in 2017, per the US Census Bureau.
United States Birth Rates (per 1,000 population)1 The graph illustrates the segment for the years 1946 to 1964 highlighted in red, with birth rates peaking in 1949 and dropping steadily around 1958 reaching pre-war depression era levels in 1963.1 Baby boomers grew up at a time of dramatic social change. In the United States, 76 million American children were born between 1946 and 1964. Early and mid-boomers were coming of age at the same time across the world, so they experienced events like Beatlemania and Woodstock, organized against the Vietnam War, or fought in the same war. The baby boomers found their music, notably rock and roll, as an expression of their generational identity.
41

Baby Boomer Retirements - UG Impact Between 2017 and 2023, there are an estimated 566 baby boomer employees across all UG departments that are currently or will be eligible to retire from the Kansas Public Employee Retirement System (KPERS) or the Kansas Police and Fire Retirement System (KP&F). These estimated 566 employees constitute one-fourth of the total UG-wide labor force, a significant majority of which are funded from the General Fund. Not only will the UG organization experience a loss of institutional knowledge and many years of experience with the departure of these retiring employees, but these retirements will place a significant financial impact on the UG organization upon their separation. The retirement separation cost impacts are one-time pay-outs of accrued vacation and sick leave balances categorized as salary costs, and one-time special payments to KP&F for public safety retirees categorized as benefit costs. For clarity purposes, these one-time payments are presented separately in the above tables. Special payments to KP&F are required to align the level of associated assets in the KP&F retirement fund with the final compensation calculation attributed to the respective retiring public safety employee. For public safety employees initially employed (or entering the KP&F retirement system) prior to 1993, the final compensation calculation includes accrued vacation and sick leave payouts received at separation from the UG. For many of the police and fire employees, these accrued leave balances are significant resulting in an increase in their final compensation calculation and a substantial increase in the future retirement payments to these employees during their respective actuarial determined retirement periods. Of the estimated 566 retirement-eligible employees across the UG organization, 208 employees are eligible to retire during 2017 and 2018, or 54 percent of the total. Given the estimated accrued leave payouts and special payments to KP&F for police and fire retiring personnel, these 208 future retirees could cost the UG a total of $18 million during 2017 and 2018, which would reduce the General Fund reserve to 3.5 percent of total expenditures and significantly impair the General Fund’s ability to meet obligations.
Fortunately, retirement-eligible and expected retirement dates are the key difference in the Forecast cost driver. In reviewing the data, it was apparent that many of the employees eligible to retire during 2017 and 2018 appeared likely to remain employed with the UG to due to their younger age and ability to earn additional service credit to
augment their future pensions. Thus, a review was performed of each of the 566 eligible retirees considering their age of retirement and years of service. The review was objectively conducted to select a fiscal year in which each retiree eligible employee’s
EXPECTED UG-WIDE RETIREMENTS BY CATEGORY2017 2018 2019 2020 2021 2022 2023 Total
CIVILIAN 22 30 76 64 66 46 23 327SHERIFF 2 2 2 2 3 2 4 17FIRE 21 21 14 24 3 3 3 89POLICE 5 3 4 16 25 25 55 133TOTALS: 50 56 96 106 97 76 85 566
42

respective retirement appeared more likely, or expected. The selection weighted those with fewer years of service but are older would likely postpone their retirement, while those with greater numbers of service credit and ages 55 to 65 years would likely retire sooner. This data review resulted in the table that displays the expected retirements of UG-wide employees by category and fiscal year. The results of the analysis estimates that instead of 54 percent, only 19 percent of the total 566 retirement-eligible employees during the Forecast period are expected to retire during 2017 and 2018, and postpones $10 million in these one-time costs to future years.
Generally, the review resulted in the expected retirements being in aggregate more evenly distributed annually amongst the Forecast period. Fire Department employee retirements are expected to occur between 2017 through 2020, while Police Department employee retirements are expected in 2020 through 2023, both a product of age and years of service. Civilian (non-Fire or Police) employees are distributed throughout the seven-year period with peaks between 2019 through 2021. The “Silver Tsunami” financial impact is significant. Recommended steps to plan for these costs is advised. These related costs for 2017 are included in the Adopted 2017 Budget. Over the six-year period (2018-2023), a projected total of $28.8 million is required by existing labor contracts and the KP&F retirement system. Of the $29.3 million total, a $20.3 million in accrued vacation and sick leave payouts and $8.5 million in KP&F special retirement actuarial true-up payments are required upon retiree separation.
SUMMARY TABLE - PROJECTED COSTS FOR ACCRUED LEAVE PAYOUTS AND RETIREMENT SPECIAL PAYMENTSASSUMPTION BASED ON EMPLOYEE RETIREMENT EXPECTATION
2017 2018 2019 2020 2021 2022 2023CIVILIAN - PAYOUTS @ 40% OF BASE PAY 424,287$ 657,332$ 1,448,681$ 1,379,164$ 1,498,034$ 1,091,045$ 488,208$ SHERIFF - PAYOUTS @ 35% OF BASE PAY 49,701 37,934 47,025 51,608 74,867 44,805 98,853 FIRE - PAYOUTS @ 90% OF BASE PAY 1,561,869 1,590,409 1,048,973 1,725,574 199,850 214,159 208,052 POLICE - PAYOUTS @ 80% OF BASE PAY 306,198 204,831 264,002 992,443 1,806,750 1,660,521 3,490,490 ESTIMATED ACCRUED LEAVE PAYOUTS: 2,342,054$ 2,490,505$ 2,808,682$ 4,148,789$ 3,579,500$ 3,010,529$ 4,285,604$ FIRE - SPECIAL PYMT @ 93% OF BASE PAY 1,613,931 1,643,423 1,083,939 1,783,093 206,511 221,297 214,987 POLICE - SPECIAL PYMTS @ 32% OF BASE PAY 99,468 81,932 105,601 396,977 745,710 664,208 1,396,196 ESTIMATED RETIREMENT SPECIAL PYMTS: 1,713,400$ 1,725,355$ 1,189,540$ 2,180,070$ 952,222$ 885,506$ 1,611,183$ TOTAL PAYOUTS & SPECIAL PYMTS 4,055,454$ 4,215,860$ 3,998,221$ 6,328,859$ 4,531,722$ 3,896,035$ 5,896,787$ TOTAL NUMBER OF RETIREES 50 56 96 106 97 76 85 Notes: Base Pay uses 2017 salary levels without CPI or step increases. % of Base Pay amounts based on historic levels.
43

With the loss of knowledge and experience of the retiring employees, the UG will also encounter an opportunity for salary and benefit savings through rehiring employees at lower salary levels and efficiencies encountered through business process improvements. These annual cost savings (reflected in the subsequent corresponding year) have been included in the Forecast, based on an estimated reduction of 10 percent from the 2017 base salary of the retired employees. The following table displays the personnel cost net of potential salary savings. Fiscal Year 2024 has been added to the following table to illustrate the cost reduction to the salary and benefit lines in 2024 through 2027. The net impact between the expected retirees’ accrued leave payouts and KP&F special retirements less the estimated base salary cost reduction of 10 percent of their respective 2017 base salary is displayed in the table below, and totals $15.7 million between 2018 and 2023. These net salary and benefit cost impacts are reflected in the General Fund Long Term Financial Forecast.
Benefits Employee benefits primarily include pensions, health insurance, workers’ compensation insurance, and unemployment insurance. Pension and health care benefits comprise of 95% of total benefit costs in 2018, amounting to $19 million for employer contributions to the retirement systems and $22 million in health benefit employer contributions. Over the Forecast period benefit costs vary greatly due to one-time KP&F special payments to the employees expected to retire, on-going increases in employer contributions to both KPERS and KP&F pensions attributed to expected changes in the actuarial investment rate assumption expected to be effective in 2019, and on-going estimated annual increases of 5 percent in general health care costs. Pension and health benefit employer contributions are based as a percentage of on-going salary costs; thus, as lower salaries replace retired employee positions, overall benefit costs also decline on a relative basis.
SUMMARY TABLE - NET FINANCIAL IMPACT OF EXPECTED RETIREMENTS[NEGATIVE VALUES REFLECT SAVINGS]
2017 2018 2019 2020 2021 2022 2023 2024CIVILIAN 424,287 512,013 1,078,227 512,537 159,043 (761,023) (1,737,543) (2,392,962) SHERIFF 49,701 37,934 47,025 51,608 64,095 34,032 64,550 (158,447) FIRE 3,175,800 2,996,080 1,653,066 2,831,655 (533,322) (534,648) (579,664) (1,034,374) POLICE 363,081 244,179 291,940 1,266,548 2,259,632 1,712,643 3,990,237 (1,494,196) TOTAL NET FINANCIAL IMPACT 4,012,869$ 3,790,206$ 3,070,258$ 4,662,347$ 1,949,447$ 451,005$ 1,737,580$ (5,079,980)$
44
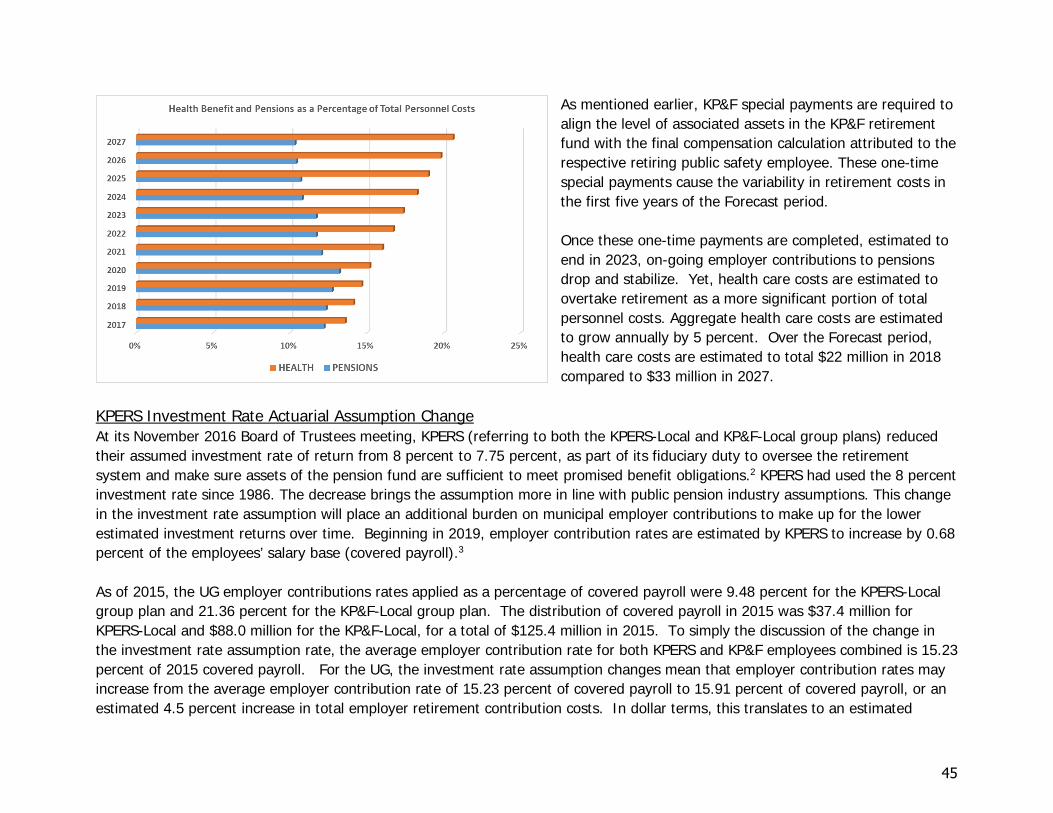
As mentioned earlier, KP&F special payments are required to align the level of associated assets in the KP&F retirement fund with the final compensation calculation attributed to the respective retiring public safety employee. These one-time special payments cause the variability in retirement costs in the first five years of the Forecast period. Once these one-time payments are completed, estimated to end in 2023, on-going employer contributions to pensions drop and stabilize. Yet, health care costs are estimated to overtake retirement as a more significant portion of total personnel costs. Aggregate health care costs are estimated to grow annually by 5 percent. Over the Forecast period, health care costs are estimated to total $22 million in 2018 compared to $33 million in 2027.
KPERS Investment Rate Actuarial Assumption Change At its November 2016 Board of Trustees meeting, KPERS (referring to both the KPERS-Local and KP&F-Local group plans) reduced their assumed investment rate of return from 8 percent to 7.75 percent, as part of its fiduciary duty to oversee the retirement system and make sure assets of the pension fund are sufficient to meet promised benefit obligations.2 KPERS had used the 8 percent investment rate since 1986. The decrease brings the assumption more in line with public pension industry assumptions. This change in the investment rate assumption will place an additional burden on municipal employer contributions to make up for the lower estimated investment returns over time. Beginning in 2019, employer contribution rates are estimated by KPERS to increase by 0.68 percent of the employees’ salary base (covered payroll).3 As of 2015, the UG employer contributions rates applied as a percentage of covered payroll were 9.48 percent for the KPERS-Local group plan and 21.36 percent for the KP&F-Local group plan. The distribution of covered payroll in 2015 was $37.4 million for KPERS-Local and $88.0 million for the KP&F-Local, for a total of $125.4 million in 2015. To simply the discussion of the change in the investment rate assumption rate, the average employer contribution rate for both KPERS and KP&F employees combined is 15.23 percent of 2015 covered payroll. For the UG, the investment rate assumption changes mean that employer contribution rates may increase from the average employer contribution rate of 15.23 percent of covered payroll to 15.91 percent of covered payroll, or an estimated 4.5 percent increase in total employer retirement contribution costs. In dollar terms, this translates to an estimated
45

$853,000 in additional employer retirement contributions beginning in 2019 and every year thereafter, assuming covered payroll remains at 2015 levels. The Forecast includes this additional employer retirement contribution in the 2019 base; no other retirement assumptions changes are included in the Forecast. The investment rate assumption change also means that the UG’s total net pension liability of $147 million will increase by approximately $16 million in 2016 or 2017. These estimates are based on the most recent 2015 KPERS valuation and will change after the 2016 valuation is released July 2017. Conclusions about Salary and Benefits Between 2008 and 2017, total salary and benefits had an annual average growth of 1.8 percent, totaling $129 million in 2008 compared to $151 million in 2017. Over the past decade, one-time costs for accrued leave payouts and special retirement payments to have contributed to variability in total salary and benefit costs. On-going health care costs increased from $16 million in 2008 to $20.5 million in 2017, or an annual average growth rate of 3 percent.
Changes in funded employee positions was another factor contributing to salary and benefit cost increases since 2008, as illustrated in the graph. Although total employee positions began and ended the past ten years with nearly the same number of positions, reductions in the budgeted employee positions between 2010 and 2012 contributed to reduced level of personnel growth rates over the ten-year prior period. For the future ten-year Forecast, the assumption was made to not include any additional employee positions above the 2017 Budget level. As mentioned earlier, the Forecast assumes a 15 percent salary savings attributed to retired employees which can either manifest in lower salary and benefit costs or potentially fewer budgeted employee positions through efficiencies encountered by business process improvements.
46

Total salary and benefit costs are estimated to total $154 million in 2018, climb to highs of $159.5 million in 2020 and $158.3 million in 2023 due to one-time payments associated with “baby boomer” retiring employees, drop sharply to $154.1 million in 2024 as the one-time payments are completed and salary and benefit savings is estimated, and end the forecast period at $158.2 million in 2027 reflecting on-going annual increases for health care benefit costs.
Services Services expenditures is the second largest cost category of the General Fund totaling $35 million in 2018 or 17 percent of total expenditures. Services costs increase to $43 million in 2027 or 19 percent of the total. This category includes residential waste (trash), the Kansas City Area Transportation Authority (ATA) contract, inmate medical contract, inmate housing, jail food and transportation, demolition, rents and leases, repair and maintenance, property and general liability insurance premiums, telephone, outside legal costs, counsel/guardian ad litem, and other professional and contractual services. Forecast assumptions vary per the respective cost category and, in most cases, are based on statistical correlation with the cost driver being statistical correlated to the cost category. Correlation is a statistical technique that can show whether and how strongly pairs of variables are related. A correlation is a single number that describes the degree of relationship between two variables, with the closer the correlation calculation approaches 1.0 the more correlated are the two variables. Residential waste (trash) 2018 contract costs of $6.6 million (along with $1.5 million of related costs in other cost categories) are offset by trash services revenues of $8.1 million. Residential waste (trash) contract costs strongly correlates to population and inflationary growth rates combined of 2.5 percent. ATA contract costs in 2018 of $3.5 million are slightly offset by transit revenues of $95,000. The ATA contract cost assumption is 3 percent annually. Due to their strong correlation, rental, leasing, repair and maintenance cost assumptions are based on the historic percentage changes in assessed valuation, or 1.9 percent annually. The other professional services cost assumption is 1 percent annually. The other services cost category strongly correlates to inflation, estimated at an annual growth rate of 1.7 percent. Demolition and clearance costs increased by $300,000 in 2016 actuals and another budgeted $400,000 in 2017 to total $1.1 million in the 2017 budget, due to Commission support of the SOAR initiative. This funding level is retained at the $1.1 million level during the forecast period, inflated by 1.8 percent which is the six-year Housing Price Index growth rate of which it strongly correlates. Inmate housing, medical and related jail contract costs of $6.1 million are partially offset by jail fees of $1.14 million. Inmate
47
housing and food services cost assumptions are a combination of factors, as the UG transitions away from paying for private sector jail beds to housing inmates in existing adult jail and proposed juvenile detention facilities. The assumption includes increases for food costs while reducing the amounts paid out in contracted private sector inmate beds. Associated personnel cost increases related to increased jail security needs in existing facilities are reflected in the salary and cost category. Medical inmate contracted costs are forecasted to increase annually over the forecast period by 5.3 percent, a five-year average percentage increase.
Supplies and Materials Supplies and materials expenditures is the fifth largest cost category of the General Fund totaling $6.1 million in 2018 or 2.9 percent of total expenditures. Supplies and materials costs increase to $7 million in 2027 remaining at 3 percent of the total. This category includes gasoline and fuel, utilities, clothing, maintenance and construction materials (not included in capital outlay), vehicle parts, office equipment, custodial materials, ammunition and other supplies. Gasoline and fuel costs have decreased over the past few years due to declining market rates, from $1.7 million in 2014 down to $1.1 million in 2016. The Forecast retains a $1.5 million funding level for this cost category as a contingency for an economic rebound in fuel prices. Gasoline and fuel closely correlated to Fire calls for services as additional fuel is required as this service increases. The 10-year average growth rate for Fire calls for service is 0.8 percent and this assumption is used for this cost category. All other supplies and materials cost categories have been increased by an annual average inflation rate of 1.7 percent.
Grants & Claims Grants and claims expenditures is the fourth largest cost category of the General Fund totaling $6.7 million in 2018 or 3.2 percent of total expenditures. Grants and claims costs increase to $8 million in 2027 or 3.5 percent of the total. In 2018, this category includes a City General Fund intra-fund contribution to the Consolidated Parks and Recreation (General) Fund of $3.7 million, grants totaling $1.7 million, claims and judgments estimate of $672,000, and taxes that are remitted, rebated and/or refunded totaling $634,000. Grant costs of $1.7 million are supported by intergovernmental revenues $760,000, the difference attributed to timing of grant revenue receipt and expenses incurred. The grants and claims costs correlate to historic growth in assessed value, or 1.9 percent annually. The City General Fund intra-fund contribution (cost) to the Consolidated Parks and Recreation (General) Fund of $3.7 million is offset by a corresponding revenue in the Consolidated Parks and Recreation (General) Fund.
48

Capital Outlay Capital outlay expenditures is the third largest cost category of the General Fund totaling $7.8 million in 2018 or 3.7 percent of total expenditures. Capital outlay expenditures are those projects paid from the General Fund “cash” category in the Capital and Maintenance Improvement Program (CMIP). Capital outlay expenditures in the Forecast for 2017 and 2018 are based on the planned CMIP projects as reflected in the Adopted 2017 Budget. Of the total in 2018, $3 million is dedicated to equipment and machinery, $1.4 million for telecommunications and computer equipment, $1.4 million for public building improvements, with the remainder dedicated to design and engineering, bridge and park improvements, parking lot improvements and capital project contingencies. Capital outlay costs are forecast to increase to $11.4 million in 2027 or 5 percent of the total expenditures. Between 2019 and 2021, a constant amount of $6 million or 2.8 percent of the total expenditures, is forecasted to maintain a basic investment in infrastructure and facility maintenance and fund vehicle lease payment obligations; this level of funding is slightly lower during the period in which the UG is required to make substantial one-time payments for retiring employees. Beginning in 2022 through 2027, 5.0 percent of total expenditures is dedicated in this Forecast for capital outlay and infrastructure improvements, increasing this category to approximately $11 million annually. This recommended assumption is included in the Forecast to transition the UG from, or diminish, its reliance on the use of general obligation debt to finance capital projects. [Refer to the long term financial forecast section for more discussion of the UG debt profile.] A compilation of the various condition assessment reports of the UG’s over 150 facilities and buildings will likely arrive at a very significant level of deferred maintenance costs; potentially totaling approximately over $500 million, given the size of UG organization and geographic service area. Due to the recent recession, on-going operating funding was unavailable to address these needs. Additionally, in the absence of a property tax mill rate increase or other identified resource, the UG’s current general obligation debt capacity is insufficient to finance this significant level of infrastructure investment. Funding these deferred maintenance costs will be challenging without additional resources. Staff will be working on meeting this challenge in future years.
Debt Service The only debt service payment made directly from the General Fund is the Soccer Stadium Parking General Obligation Bonds (Series 2010-H) with principal and interest payment amounting to $641,000 in 2018. The annual amounts included in the Forecast on based on the bond documents’ annual debt service schedule. This debt payment is 100 percent offset by Soccer Stadium Ticket Tax revenues received from the soccer facility.
49

Other general obligation bonded debt service payments are recorded in the Debt Service Fund, not in the General Fund. The Debt Service Fund expenditures are supported by a City Debt Service property tax mill rate of 16.782 in 2017. There is also a County Debt Service Fund for related debt financings with dedicated revenues consisting of lease payments derived from various sources. [Refer to the long term financial forecast section for more discussion of the UG debt profile.]
Transfers & Other Transfers and Other expenditures totals $1.7 million in 2018 or 0.8 percent of total expenditures and remain relatively constant during the forecast period. This category includes transfers-out to other UG funds of $1 million and budget contingencies of $700,000 in 2018 and beyond. The Forecast assumes an inflation factor to budget contingencies and keeps transfers-out to other UG funds at a constant amount. During 2015 and 2016, the General Fund made significant transfers-out to repair deficit positions in the Worker’s Compensation and Health Benefits internal service funds (ISF). The Forecast retains the $1 million annual transfers-out as a contingency for these possible related ISF deficiencies in the future fiscal years.
Conclusions – Expenditure Forecast The Forecast for expenditures begins with a total of $213 million in 2018 and ends with $230 million in 2027, with an average annual growth of 1.0 percent. This forecast is based on general assumptions for percentage increases over the prior year based on expected cost factors and economic indicators. Salary and benefits assumptions are significantly impacted by one-time costs during the period. Variability in debt service payment annual percentage changes are because these costs are tied directly to the bonds’ debt service schedule. The remaining cost categories’ assumptions are consistent year-over-year based on statistically correlated factors.
50

51

52

This forecast projects the use of fund balance in 2018 to 2020 during large one-time payments required for expected retirements; the shortfalls are covered by reserves and the financial position of the General Fund recovers to a surplus status in 2021 and beyond. The forecast reflects a generally positive outlook with the General Fund’s financial position improving in the last five of ten years.
Economic indicators demonstrate that the local business environment has rebounded to pre-2009 Recession levels; however, substantial financial obligations and added uncertainties may diminish the General Fund surplus over the next 10 years. One uncertainty is the timing of the significant level of retiring employees in the next five years; if these employees retire sooner than expected, the General Fund financial position would be negatively impacted and could impair the UG’s ability to meet operational demands. While the UG is addressing these short-term and long-term issues, the UG need to continue reviewing its operations and service delivery options. Over the past years, the UG has outsourced services to the private sector and entered negotiations with the non-profit sector for public-private partnerships. While the UG further explores alternative service delivery models with the goal to reduce staff levels and related unfunded pension liabilities, the UG will also review cost recovery levels of services currently provided to the community During the next three months, staff will continue to monitor revenue sources as well as update spending plans, as applicable, based on newly available information. This updated information will be reflected in the 2018 Proposed Budget, which is scheduled to be released to the Commission in July 2017.
CONCLUSION
53

Long Term Financial Forecast Section Endnotes:
1. Unified Government Comprehensive Annual Financial Report (CAFR) for the Fiscal Year Ended December 31, 2015, Pension Status References, Pages 67-70; web link: 2015 Unified Government of WyCo/KCK CAFR
2. National Association of State Retirement Administrators, “The 80-percent threshold: Its source as a healthy or minimum funding level for public pension levels”, January 2012, web link: NASRA Pension Funding Status Threshold White Paper-January 2012
3. Unified Government Comprehensive Annual Financial Report (CAFR) for the Fiscal Year Ended December 31, 2015, Pension Status References, Page 88; web link: 2015 Unified Government of WyCo/KCK CAFR
4. Kansas Public Employees Retirement System, November 16, 2016 press release, ”KPERS Decreasing Investment Return Assumption to 7.75%”, https://kpers.org/pdf/AssumptionChanges.pdf
5. Kansas Public Employees Retirement System, November 29, 2016 press release, “Rates Will Increase January 2019”, https://www.kpers.org/employers/communications/eremail_2016_1129_LOCAL_AssumptionChange.pdf.
6. Ibid, LTFP Endnote #1 Revenue Section Endnotes:
1. National Property Tax Delinquency Declining, Matt Cannon, CoreLogic, Inc., December 29, 2015. 2. Ibid 3. The Effects of Increasing the Number of Property Tax Payment Installments on the Rate of Property Tax Delinquency, Paul Waldhart,
Lincoln Institute of Land Policy, 2011. 4. Nonprofit PILOTs (Payment in Lieu of Taxes), Daphne Kenyon and Adam Langley, Policy Brief, Lincoln Institute of Land Policy, Nov 2016. 5. Making Debt Pay: Examining the Use of Property Tax Delinquency as a Revenue Source, Michelle Marchiony, Emory Law Journal, October
31, 2012. Expenditure Section Endnotes:
1. United States Centers for Disease Control, http://www.cdc.gov/nchs/products/vsus.htm, "Vital Statistics of the United States, 2003, Volume I, Natality", Table 1-1 "Live births, birth rates, and fertility rates, by race: United States, 1909–2003."
2. Kansas Public Employees Retirement System, November 16, 2016 press release, ”KPERS Decreasing Investment Return Assumption to 7.75%”, https://kpers.org/pdf/AssumptionChanges.pdf
3. Kansas Public Employees Retirement System, November 29, 2016 press release, “Rates Will Increase January 2019”, https://www.kpers.org/employers/communications/eremail_2016_1129_LOCAL_AssumptionChange.pdf.
ENDNOTES
54

55

Spanish explorer Francisco Vazquez de Coronado set out in 1541 to search for the fabled cities of gold. Rather than gold, he found the rich heritage of the Midwest and Southwest and its indigenous people. In 1959, the Wyandotte Constitutional Convention gave Kansas its new State Constitution. Kansas City, Kansas was incorporated in 1872 and the neighboring cities of Armstrong, Armourdale, Riverview and Wyandotte were joined in 1886 to form “new” Kansas City, Kansas. Over a century later in 1997, the City of Kansas City, Kansas and Wyandotte County were joined as the Unified Government. The Unified Government is adaptive, innovative and knows the citizens we serve are gold.
Unified Government of Wyandotte County / Kansas City, Kansas 701 North 7th Street, Kansas City, KS 66101 P 913-573-5280 W wycokck.org
56