long term investment portfolio annual review – fy 2011 september 8, 2011
TRANSCRIPT
Long Term Investment PortfolioAnnual Review – FY 2011
September 8, 2011
Overview/Executive SummaryOverview/Executive Summary
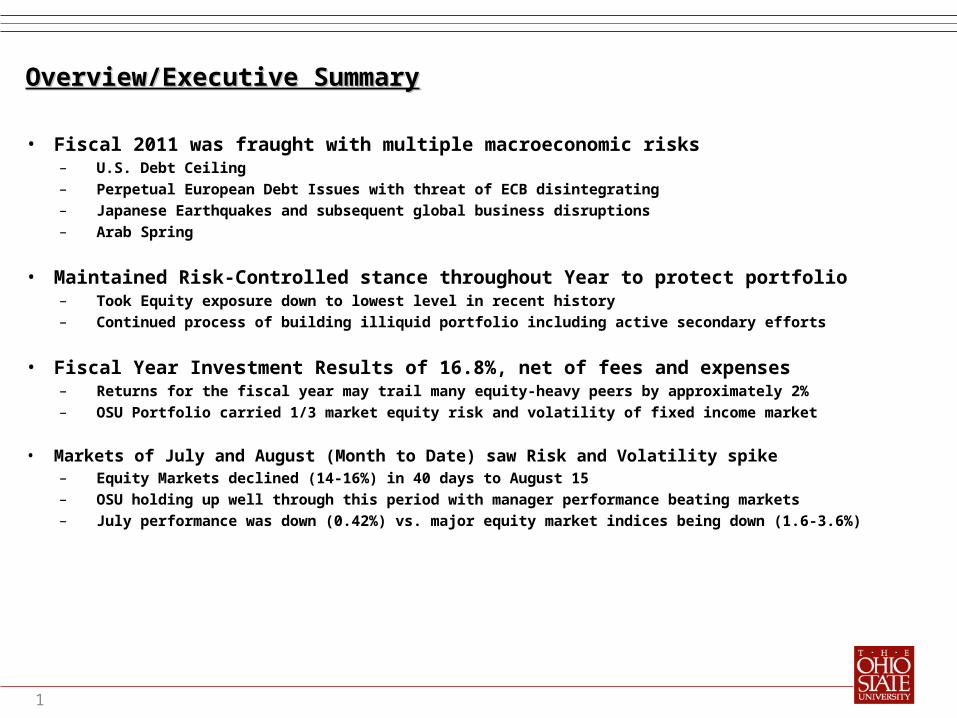
• Fiscal 2011 was fraught with multiple macroeconomic risks– U.S. Debt Ceiling– Perpetual European Debt Issues with threat of ECB disintegrating– Japanese Earthquakes and subsequent global business disruptions– Arab Spring
• Maintained Risk-Controlled stance throughout Year to protect portfolio– Took Equity exposure down to lowest level in recent history– Continued process of building illiquid portfolio including active secondary efforts
• Fiscal Year Investment Results of 16.8%, net of fees and expenses– Returns for the fiscal year may trail many equity-heavy peers by approximately 2%– OSU Portfolio carried 1/3 market equity risk and volatility of fixed income market
• Markets of July and August (Month to Date) saw Risk and Volatility spike– Equity Markets declined (14-16%) in 40 days to August 15– OSU holding up well through this period with manager performance beating markets– July performance was down (0.42%) vs. major equity market indices being down (1.6-3.6%)
1
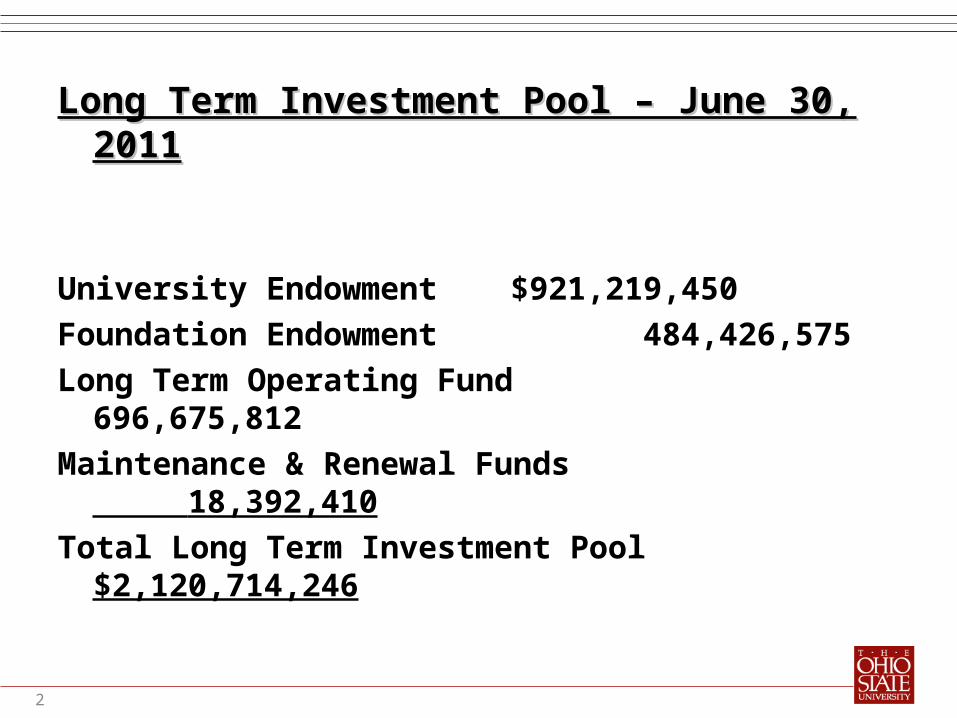
Long Term Investment Pool – June 30, Long Term Investment Pool – June 30, 20112011
University Endowment $921,219,450Foundation Endowment
484,426,575Long Term Operating Fund
696,675,812Maintenance & Renewal Funds
18,392,410Total Long Term Investment Pool
$2,120,714,246
2
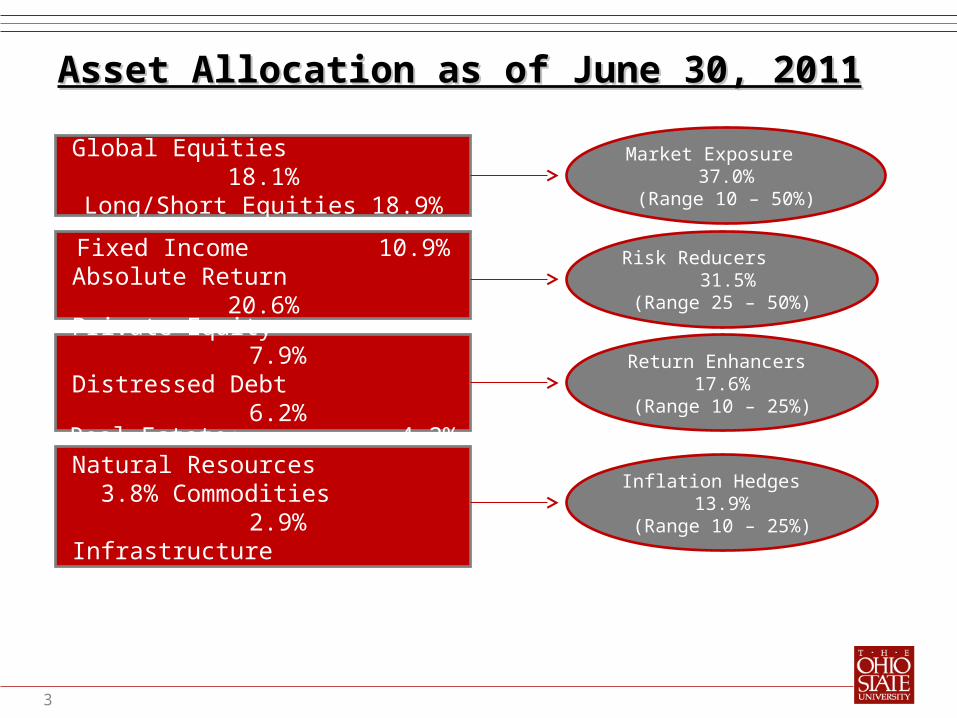
Asset Allocation as of June 30, 2011Asset Allocation as of June 30, 2011
Global Equities 18.1%Long/Short Equities18.9%
Fixed Income 10.9%Absolute Return 20.6%
Private Equity 7.9%Distressed Debt 6.2%Opportunistic 3.5%
Real Estate 4.2%Natural Resources 3.8% Commodities 2.9%Infrastructure 3.0%
Market Exposure 37.0%(Range 10 – 50%)
Risk Reducers 31.5%(Range 25 – 50%)
Return Enhancers 17.6%(Range 10 – 25%)
Inflation Hedges 13.9%(Range 10 – 25%)
3
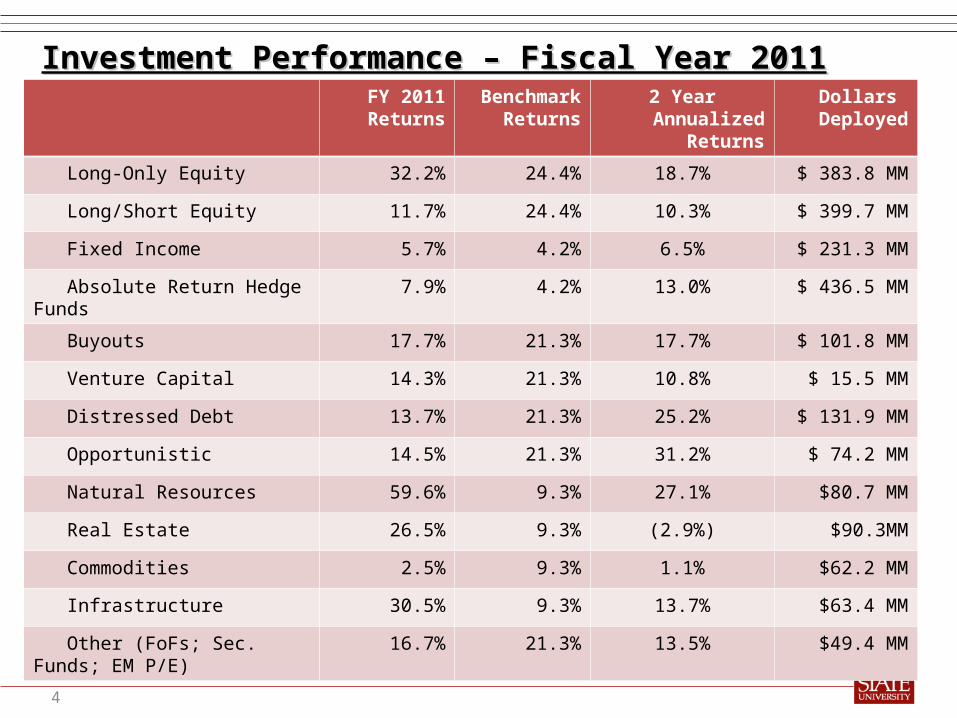
FY 2011 Returns
Benchmark Returns
2 Year Annualized Returns
Dollars Deployed
Long-Only Equity 32.2% 24.4% 18.7% $ 383.8 MM
Long/Short Equity 11.7% 24.4% 10.3% $ 399.7 MM
Fixed Income 5.7% 4.2% 6.5% $ 231.3 MM
Absolute Return Hedge Funds 7.9% 4.2% 13.0% $ 436.5 MM
Buyouts 17.7% 21.3% 17.7% $ 101.8 MM
Venture Capital 14.3% 21.3% 10.8% $ 15.5 MM
Distressed Debt 13.7% 21.3% 25.2% $ 131.9 MM
Opportunistic 14.5% 21.3% 31.2% $ 74.2 MM
Natural Resources 59.6% 9.3% 27.1% $80.7 MM
Real Estate 26.5% 9.3% (2.9%) $90.3MM
Commodities 2.5% 9.3% 1.1% $62.2 MM
Infrastructure 30.5% 9.3% 13.7% $63.4 MM
Other (FoFs; Sec. Funds; EM P/E) 16.7% 21.3% 13.5% $49.4 MM
Investment Performance – Fiscal Year 2011Investment Performance – Fiscal Year 2011
4
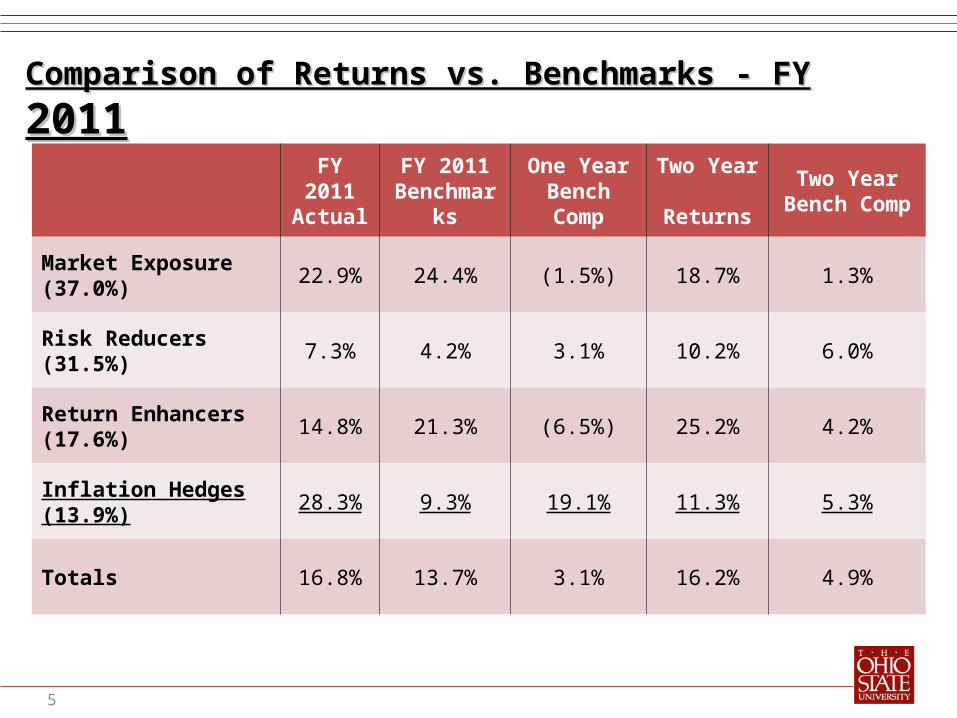
Comparison of Returns vs. Benchmarks - FY Comparison of Returns vs. Benchmarks - FY
20112011FY 2011 Actual
FY 2011 Benchmarks
One Year Bench Comp
Two Year Returns
Two Year Bench Comp
Market Exposure (37.0%) 22.9% 24.4% (1.5%) 18.7% 1.3%
Risk Reducers (31.5%) 7.3% 4.2% 3.1% 10.2% 6.0%
Return Enhancers (17.6%) 14.8% 21.3% (6.5%) 25.2% 4.2%
Inflation Hedges (13.9%) 28.3% 9.3% 19.1% 11.3% 5.3%
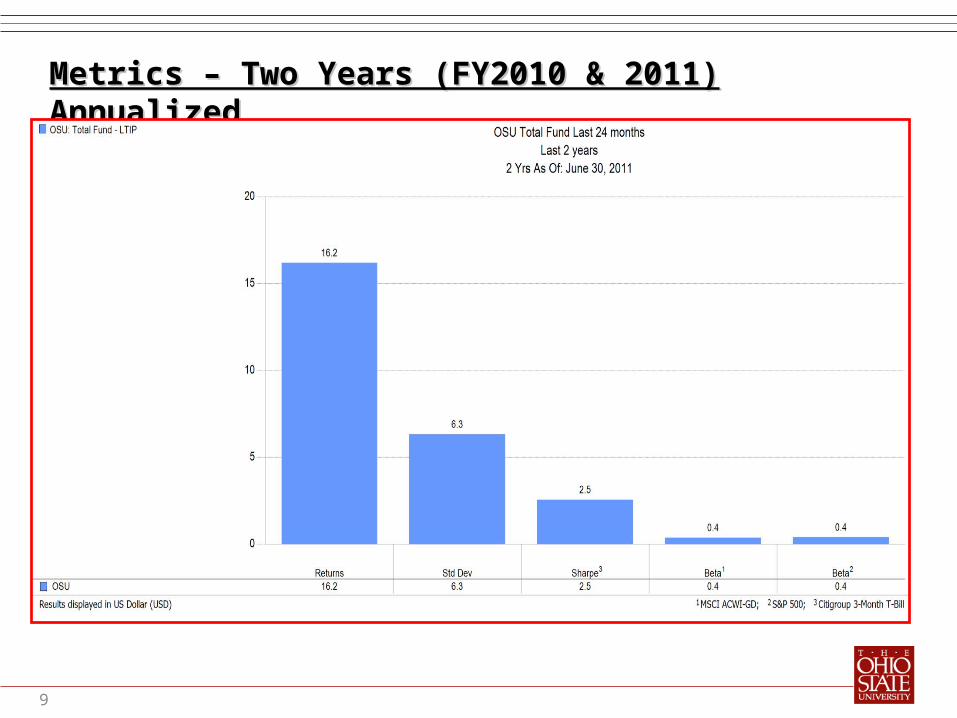
Totals 16.8% 13.7% 3.1% 16.2% 4.9%
5
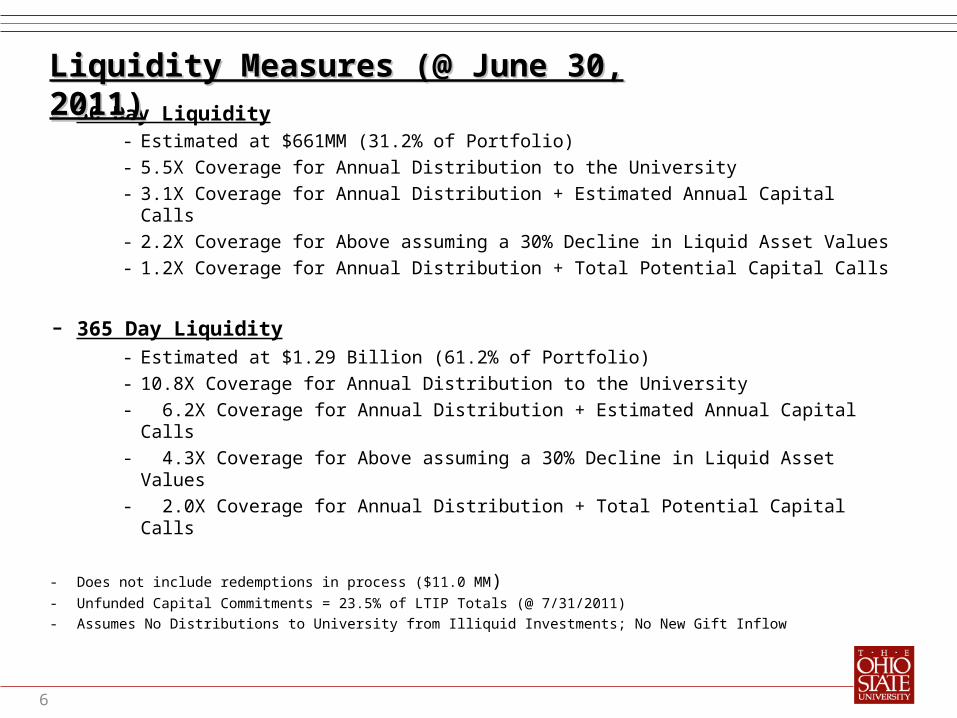
- 30 Day Liquidity- Estimated at $661MM (31.2% of Portfolio)- 5.5X Coverage for Annual Distribution to the University- 3.1X Coverage for Annual Distribution + Estimated Annual Capital Calls- 2.2X Coverage for Above assuming a 30% Decline in Liquid Asset Values- 1.2X Coverage for Annual Distribution + Total Potential Capital Calls
- 365 Day Liquidity- Estimated at $1.29 Billion (61.2% of Portfolio)- 10.8X Coverage for Annual Distribution to the University- 6.2X Coverage for Annual Distribution + Estimated Annual Capital Calls- 4.3X Coverage for Above assuming a 30% Decline in Liquid Asset Values- 2.0X Coverage for Annual Distribution + Total Potential Capital Calls
- Does not include redemptions in process ($11.0 MM)- Unfunded Capital Commitments = 23.5% of LTIP Totals (@ 7/31/2011)- Assumes No Distributions to University from Illiquid Investments; No New Gift Inflow
Liquidity Measures (@ June 30, Liquidity Measures (@ June 30, 2011)2011)
6

Upside/Downside Capture – Last Two YearsUpside/Downside Capture – Last Two Years
7
One Year Two Years
Upside Downside Upside Downside
Vs. S & P 500 44.2% 22.7% 47.8% 26.4%
Vs. ACWI 36.5% 3.5% 45.9% 19.3%
The Portfolio was designed and changed in 2008/2009 with implementation from 2009 through today.
That was a period of exceptionally high risk and, in the estimation of some, remains a period of high risk today.
The primary job of the Investment Office is to act as a fiduciary for the University, preserving capital, and funding the University to the extent required by policy.
8
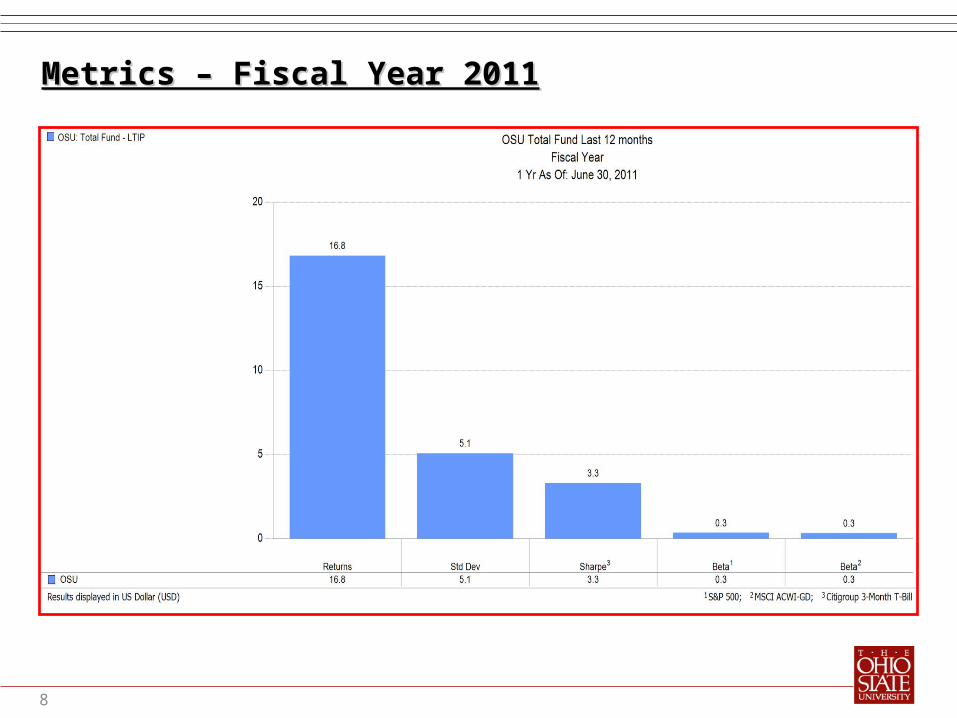
Metrics – Fiscal Year 2011Metrics – Fiscal Year 2011
9
Metrics – Two Years (FY2010 & 2011) Metrics – Two Years (FY2010 & 2011) AnnualizedAnnualized

10
Private Capital Diversification Over TimePrivate Capital Diversification Over Time(MV as of 06/30/2011)(MV as of 06/30/2011)
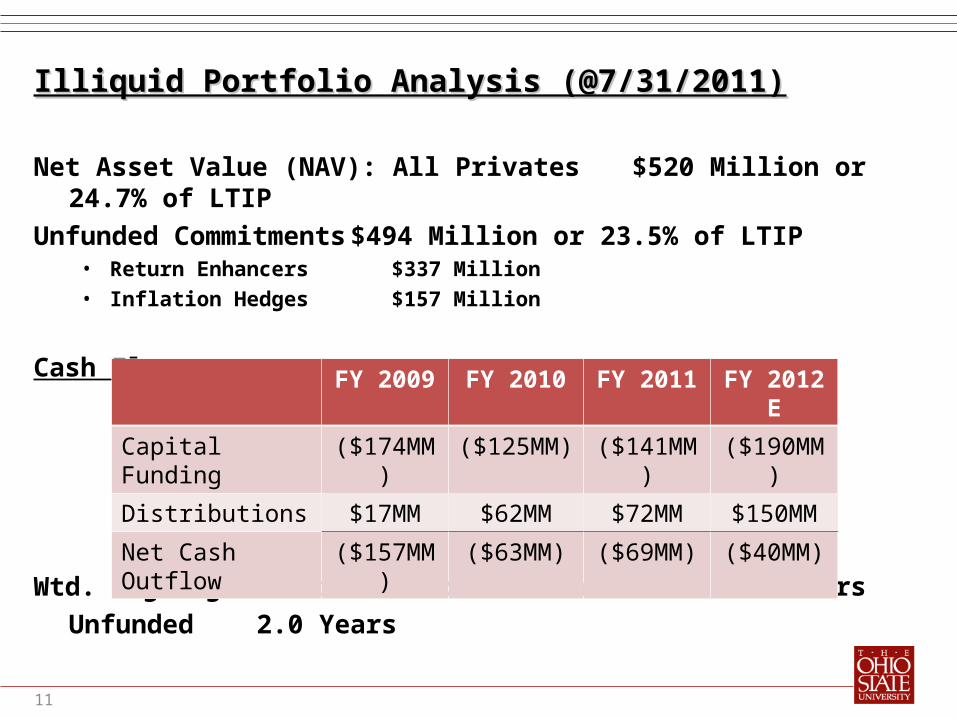
Illiquid Portfolio Analysis (@7/31/2011)Illiquid Portfolio Analysis (@7/31/2011)
Net Asset Value (NAV): All Privates $520 Million or 24.7% of LTIP
Unfunded Commitments $494 Million or 23.5% of LTIP• Return Enhancers $337 Million• Inflation Hedges $157 Million
Cash Flows:
Wtd. Avg. Age of Portfolio: Commitments 2.9 Years
Unfunded 2.0 Years
11
FY 2009 FY 2010 FY 2011 FY 2012 E
Capital Funding ($174MM) ($125MM) ($141MM) ($190MM)
Distributions $17MM $62MM $72MM $150MM
Net Cash Outflow ($157MM) ($63MM) ($69MM) ($40MM)
The Ohio State University Office of Investmentsinvestments.osu.edu
12