long-term mitigg()ation scenarios (ltms) for south africa · 2020-02-06 · long-term mitigg()ation...
TRANSCRIPT

Long-Term Mitigation Scenarios (LTMS) g g ( )for South Africa
Jongikhaya WitiJongikhaya WitiDepartment of Environmental Affairs & Tourism
Energy Research Centre, University of Cape TownAIM Training Workshop NIES, Tsukuba, Japan
27 31 S t b 200827 - 31 September 2008

The ContextClimate Change is real
The ContextClimate Change is real
and its predicted impacts for SA are serious

Climate Change evidence & impacts
• Climate change is already having• Scientific evidence for a • Climate change is already having predominantly negative impacts on people and ecosystems. South Africa is suffering and will
Scientific evidence for a rise in global temperatureover the past century
l • South Africa is suffering and will suffer serious impacts under global business-as-usual:
Water stress
unequivocal• Climate change almost
t i l d i b • Water stress• Floods• Rainfall patterns
certainly driven byincreased greenhouse gas concentrations caused by
• Spreading malariaconcentrations caused by human activities

The ChallengeThe Challenge
The World has a GHG emission problem Time is limitedTime is limited
We will have to act globallySouth Africa is in a unique situationSouth Africa is in a unique situation

Mitigation is urgenttime to bend the curve is short
“It is clear that delaying action on this matter of climate change will hit poor countries and communities hardest” Pres Mbeki UN GA
20072007

SA compared to other countries
E i i itEmissions per capita
12
14
16
n n c
Emissions intensity
600700800
l int
'l $
6
8
10
12
2-eq
per
per
so
Def
ores
tatio et
c
100200300400500600
s C
O2
/ mill
0
2
4
South Brazil China India OECD World
t CO -
South Afric
aBrazil
China
IndiaOECD
World
tons
Africa So
• Relative to the size of our population, emissions ‘per capita’ are high• Emissions-intensity due to dependency on coal and inefficient use of
energy• Share of cumulative emissions lower than annual - historical
responsibility works bestresponsibility works best

LTMSMandate & Objectives
LTMSj
Scenario Building TeamProductsProducts

LTMS mandate & objectives
• LTMS is a Cabinet-mandated process for id tif i i f iti ti f li tidentifying scenarios for mitigation of climate change
d b d b C• Led by DEAT, project managed by ERC, independent facilitation by Tokiso
• Two sets of key outputs:• Robust, broadly supported recommendations for a , y pp
long-term national climate policy• Sound basis for SA negotiating position for
negotiations on post-2012 • Follow up with awareness and implementation

The work of the Scenario Building Team (SBT)
S i B ildi T bli h d A 2006• Scenario Building Team established Aug 2006 to carry out the technical aspects
• SBT made up of strategic thinkers from government,industry, labour, civil society, as well as other y, , y,relevant players
• Commissioned research teams to provide• Commissioned research teams to provide information 24 Octobe 2007 afte mo e than a ea of intense• 24 October 2007, after more than a year of intense work, the initial technical work of the LTMS was i d ff b SBTsigned off by SBT

LTMS productsAPPROVED by
all members of SBT
All t h i l t
A) Scenario Document B) T h i l S
All technical reports ACCEPTED
by SBT as rigorous researchbest available scientific
i f ti B) Technical SummaryTechnical Report and Appendix
cess
Technical Inputs:
information adequate basis to inform the further LTMS process
S P
roc Technical Inputs:
- Energy emissions- Non-energy emissions
Full texts of the various research groups
LTM
S Non energy emissions-Economy – wide analysis
- Climate impactspFacilitated PROCESS
with strategic thinkers from key stakeholder sectorsy

Cabinet on LTMS
•• Cabinet lekgotla considered LTMS outcomes Cabinet lekgotla considered LTMS outcomes gg(July 2008)(July 2008)S t i i t t i di ti d f k fS t i i t t i di ti d f k f•• Set vision, strategic direction and framework for Set vision, strategic direction and framework for policy directions policy directions p yp y
•• Policy development process to followPolicy development process to follow

LTMS: Process and research
Robust and broadly supported results hi d th h t h i lachieved through technical
methodology and extensive stakeholder involvement

Management, Facilitation Team & Secretariat
• Joanne Yawitch and DEAT team (Project• Joanne Yawitch and DEAT team (Project Manager)H ld Wi kl (P j t L d) Pi M kh ibi• Harald Winkler (Project Lead), Pierre Mukheibir (Administration)
• Facilitators: Stefan Raubenheimer (Lead), Edwin Mohlalehi, and Pascal Moloi (High Level)Mohlalehi, and Pascal Moloi (High Level)
• Tokiso Secretariat: Tanya Venter, Yasmin Moola, Rachel Mosupye Elin LorimerRachel Mosupye, Elin Lorimer

Scenario Building Team
Government Business Civil society Government• DEAT Environment• DME Minerals & Energy• DST Science & Technology
• SASOL• Eskom• EIUG Energy Intensive
U G
y• EcoCity/CURES• Groundwork• SESSA• DST Science & Technology
• DoT Transport • Treasury• Foreign Affairs
Users Group• Engen• Grain SA • Anglo Coal
• SESSA• Labour (NUM)• SEA • SACANg
• DTI Trade & Industry• DPE Public Enterprises • DWAF Water Affairs & Forestry
P id
• Anglo Coal• BHP Billiton• Chamber of Mines • Aluminium – AFSA
• COSATU• SALGA• WWF-SA
• Presidency• SAWS Weather Services • CEF / SA Nat’l Energy Research
Institute
• Kumba Resources• Chemical – CAIA • Engen
• Earthlife Africa
Institute• NERSA Energy Regulator • W Cape Province (DEADP)• City of Johannesburg
• Forestry SA• AgriSA• Business Unity SA• Sappi• Sappi

Four research teams and inputs from stakeholder experts
• Energy Emissions (led by ERC modeling)• Alison Hughes, Mary Haw, Harald Winkler, Andrew Marquard, Bruno Merven• Markal model reviewed by Stephen Pye (AEAT, UK)• Expert input from stakeholders: Sonwabo Damba (Eskom); Energy Efficiency Technical Committee special meeting: Ian Langridge
(Anglo American), Valerie Geen, Tsvetana Mateva, Hermien vd Walt (all three National Business Initiative); Chesney Bradshaw (ABB); Barry Bredenkamp (Nat’l Energy Efficiency Agency); Burt Buissine (British American Tobacco); Rochelle Chetty Sonwabo Damba, (both Eskom); LJ Grobler (NW University); Chris Teffo (Chamber of Mines); Alan Munn (Engen); Egmont Otterman (PPCement); Nico Smith (Mittal Steel); Neal Smither (BP); Theresa Maree (Eon)(PPCement); Nico Smith (Mittal Steel); Neal Smither (BP); Theresa Maree (Eon)
• Non-Energy Emissions (led by CSIR)• Rina Taviv, Marna van der Merwe, Bob Scholes and Gill Collet• Industrial process emissions: G Kornelius (Airshed), A Marquard and H Winkler• Expert input from stakeholders: Linda Godfrey (NRE CSIR) Antony Phiri (NRE CSIR) Harma Greben (NRE CSIR) Susanne Dittke• Expert input from stakeholders: Linda Godfrey (NRE CSIR), Antony Phiri (NRE CSIR), Harma Greben (NRE CSIR), Susanne Dittke
(EnviroSense CC), Saliem Haider (City of Cape Town) and Stan Jewaskiewitz (Envitech Solutions); John Scotcher ForestLore Consulting, Howick and Johan Bester from the DWAF. Johan Claasen from NDA, Pietman Botha from GrainSA, Sylvester Mpandeli and Matiga Motsepe from the ARC, Koos van Zyl and Nic Opperman from AgriSA; Guy F Midgley from SANBI and Brian van Wilgen from CSIR.
• Economy-wide research (led by UCT economics)y ( y )• Kalie Pauw, with Celeste Coetzee• Reviewed by Dirk van Seventer (TIPS)• 2 special meetings of economists: Roger Baxter (Chamber of Mines). Raymond Parsons (Nedlac); Theo van Rensburg, Louise Du
Plessis, Marna Kearney (all three Naitonal Treasury); Ashraf Kariem (Presidency); Stephen Gelb (Edge Institute); Michael McClintock (Sasol); James Blignaut (University of Pretoria); Simi Siwisi BUSA(Sasol); James Blignaut (University of Pretoria); Simi Siwisi BUSA
• Climate Change Impacts (led by SANBI)• G Midgley, with Pierre Mukheibir• Expert authors: R Chapman, P Mukheibir, M Tadross, B Hewitson, S Wand, R Schulze, T Lumsden, M Horan, M Warburton, B
Kgope, B Mantlana, A Knowles, A Abayomi, G Ziervogel, R Cullis and A Therong p , , , y , g ,
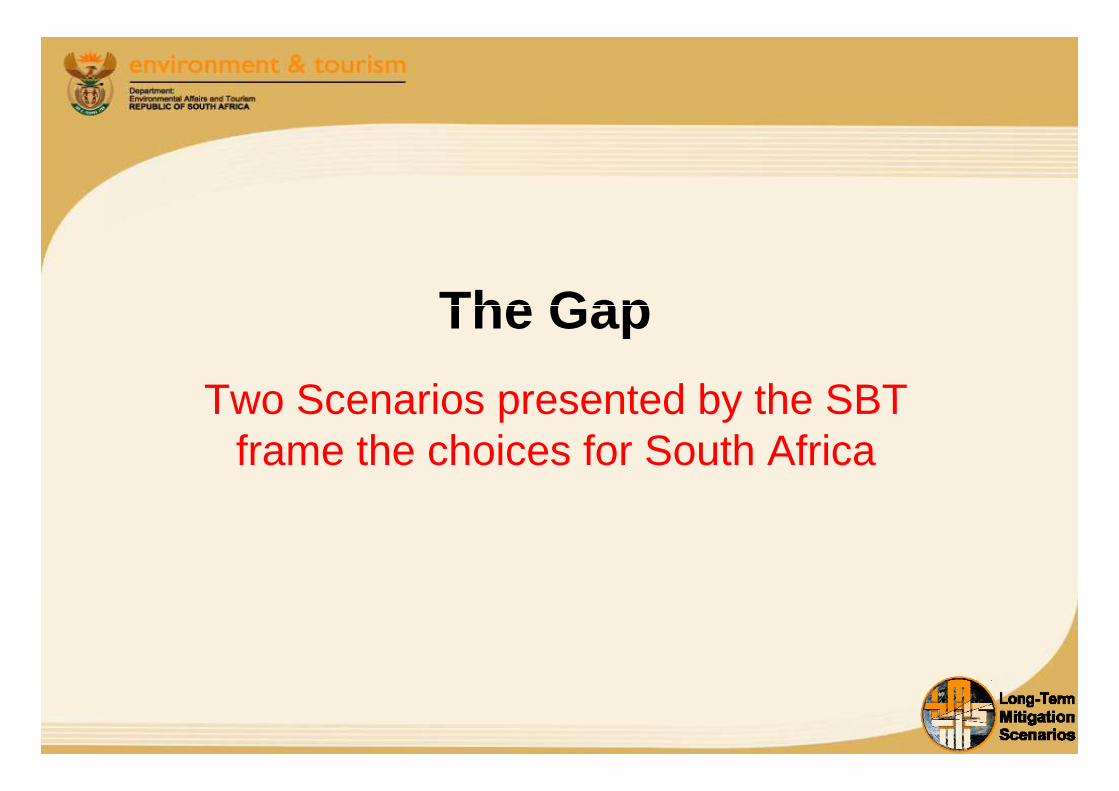
The GapTwo Scenarios presented by the SBT
The GapTwo Scenarios presented by the SBT
frame the choices for South Africa

Two Scenarios: Growth without Constraints and Required by Science
1,800
1,400
1,600
1,000
1,200
uiva
lent Growth without Constraints
THE GAP
Gap: difference between where emissions might go and where they need to go
600
800
,
Mt C
O2-
equ
Current Dev PathTHE GAPy g
(GWC – RBS, emissions in 2050)Gap is 1300 Mt CO2-eq in 2050
More than three times 2003 annual emissions
400
600M
R i d b S i
2003 annual emissions
-
200 Required by Science

The Technical OptionsThe Technical Options
Wedges = Individual Mitigation Actionsg gShowing Emission Reductions
& Costs (and savings)& Costs (and savings)

0
150
300
R 20
Nuclear, extended
50 SW H subsidy25
50 Electric vehicles in GW C grid
S f l th450
600
Escalating CO2 tax
0
5
10
-R 4,404
Limit less eff
Ele ctr ic ve hicle s w ith
0 0
50 CCS 20 Mt
0
25-R 208 0
25R 607
25
50
-R 203
Commercia l efficiency
Manure management
05
10R 8
Synfuels methane
0
150
300R 42
0
150
300
R 102
nuclear, rene w ables
300Re new ables , extended
0
25R 72
50 Biofuel subsidy0
25
50
R 524
Biofuels0
-R 203
05
10
-R 19
g
10R 0
Aluminium
0
150R 92 0
25R 697
25
50 Hybrids
150
300 Im prove d vehicle e fficiency
All Medium Wedges
150
300 All Small W edges
2550
510
Enteric fermentation
05 R 0
150
300Subs idy for re new ables
0
25R 1,987
0
150-R 269
25
50Residentia l e fficiency
0
150
025
05 R 50
510
Reduced tillage
Waste management0
150R 125
25
50
R 5
Cleaner coal
Passenger modal shift
0
25-R 198
05 R 24
02550
R 14
aste a age e t
510
R 39
Afforestation
150
300Renewables with learning,
extended
R3
0
150
300
-R 34
Indus tr ial e fficiency0
-R 5
0
25
50
-R 1,131
Passenger modal shift
2550
-R15
Fire control
0R 39
05
10R 476
Synfuels CCS 2 Mt
50Synfuels CCS 23 Mt
0R3
0
0
150
300
R 18
Nucle ar
0
150
300
R 52
Renew ables 0R 15
05
10R 346
Coal mine methane
0
02550
R 105

Strategic OptionsStrategic Options
Four packages of actions to get from GWCto get from GWC
towards the goal ofRequired by Science

Four Strategic Options
1800
Start Now is a combination ofaggressive energy efficiency+
Scale Up is a combination ofStart NowUse the Market is as an 300
Industrial efficiency300
Industrial efficiencyEscalating CO2 tax
1400
1600
Growth withoutConstraints
+27% nuclear and 27% renewable energy generation
+ extension of energy generation to50% nuclear and
Use the Market is as analternative instrument to Scale Up; it applies a carbon tax (starting from R100
0
150-R 34
300Renewables
0
150
300
-R 34
300Nuclear, extended
150
300
450
600
R 42
1000
1200
ConstraintsReach for the Goal
energy generationby 205050% renewable by 2050
(starting from R100(slowing emissions growth); R250 (stabilising emissions)to R750 (absolute
0
150R 52
300Nuclear
0
150R 20
Renewables, extended
0
150
300Subsidy for renewables
1. New technology2. Identify resources
600
800
Start Now
Use the MarketScale Up
to R750 (absolute reductions 2040ff) plus incentives
300Passenger modal shift
0
150R 18
0150300
R 92
300Synfuels CCS 23 Mt
0
150R 125
300
Biofuel subsidy
3. People-oriented measures4. Transition to a low carbon economy
400
600
Required by Science
Use the MarketScale Up0
150-R 1,131
300Improved vehicle efficiency
0150300
R 54
300Electric vehicles in GWC grid
0
150 R 697
300SWH subsidy
0
200 Required by Science0
150-R 269
0
150
300
R 6070
150
300
-R 208
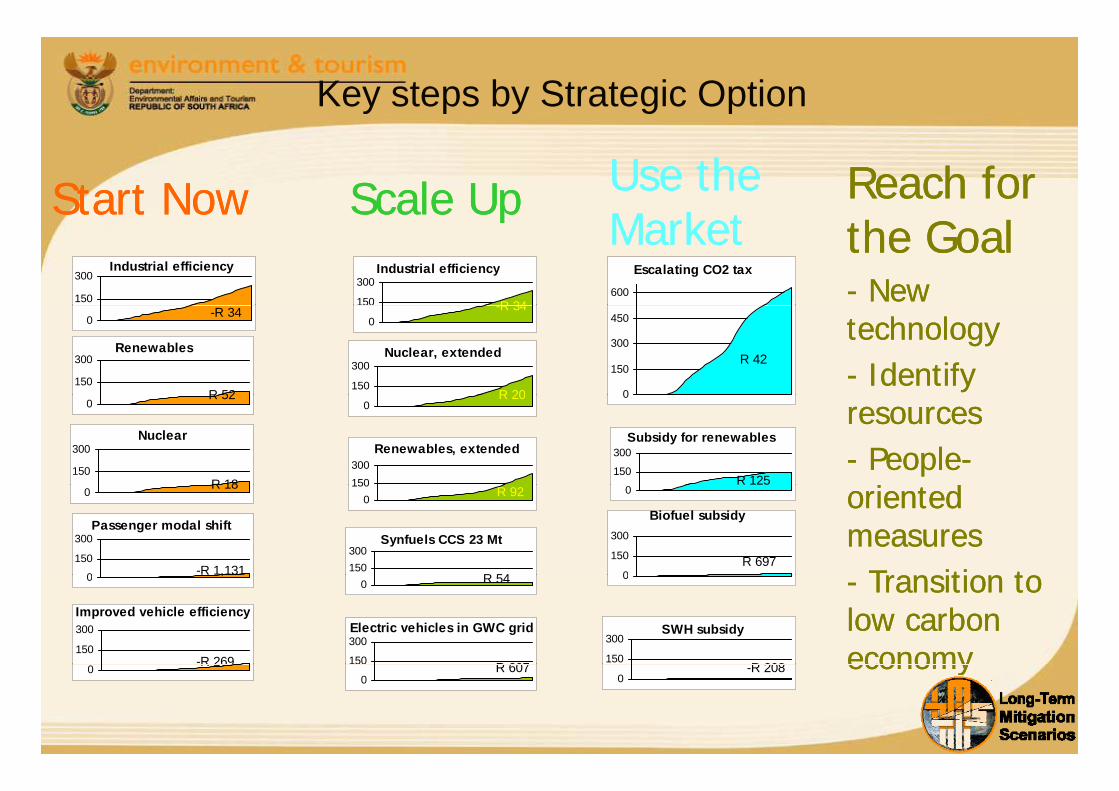
Key steps by Strategic Option
Start NowStart Now Scale UpScale Up Use the Use the M k tM k t
Reach for Reach for ppMarketMarket the Goalthe Goal
-- New New 150
300Industrial efficiency
150
300
R 34
Industrial efficiency
600
Escalating CO2 tax
technologytechnology-- Identify Identify
0 -R 34
150
300
R 52
Renewables
0-R 34
150
300
R 20
Nuclear, extended
0
150
300
450
R 42
resourcesresources-- PeoplePeople--
i di d
0R 52
150
300
R 18
Nuclear
0R 20
Renewables, extended
150300
0
150
300
R 125
Subsidy for renewables
oriented oriented measuresmeasures
Transition toTransition to0
150
300
-R 1,131
Passenger modal shift
0 R 180
150R 92
150300
R 54
Synfuels CCS 23 Mt
0
0
150
300
R 697
Biofuel subsidy
-- Transition to Transition to low carbon low carbon economyeconomy
0 ,
150
300
-R 269
Improved vehicle efficiency
0 R 54
150
300
R 607
Electric vehicles in GWC grid
0
150
300
R 208
SWH subsidy
economy economy 0 R 2690
R 6070
-R 208

CostsCosts
&
Economy-wide yimplications

Total mitigation costs in relation to the size of the economy
1.5%0 Limit on low-efficiency
vehicles1 +Passenger modal shift1% Threshold
0.5%
1.0%
e of
GD
P
Without industrial efficiency
14
15
14
15
1 +Passenger modal shift2 +Improved vehicle
efficiency3 +SWH subsidy
-0.5%
0.0%
ost a
s sh
are industrial efficiency
0
10
11 12
13
9 11 12
13
14 y4 +Commercial efficiency5 +Residential efficiency6 +Industrial efficiency7 Cl l
-1.5%
-1.0%
Miti
gatio
n co
With i d t i l ffi i
101
2
37
9
8
109
7 +Cleaner coal8 +Nuclear9 +Escalating CO2 tax10 +Renewables
-2.5%
-2.0%
5 000 10 000 15 000 20 000
M industrial efficiency543
76 8
10 +Renewables 11 +CCS 20 Mt12 +Subsidy for renewables13 +Biofuels- 5,000 10,000 15,000 20,000
Mt CO2 reduced, 2003-2050 14 +Electric vehicles in GWC grid15 +Hybrids
Mitigation costs as share of GDP, for runs of combined wedgeseach time adding another as in list at right

Economy Wide Impacts
Impact on GDP Employment (change in jobs) Impact on poverty (change in income distribution)
+0.2% in 2015 2% in 2015Jobs slightly below that of
the reference case. Notlarge, but any job loss isof concern and would
household welfare rises 3% on average
Start of concern and wouldhave to be off-set
Lowest figure is -2.5% forsemi-skilled workers in2010
Start Now
+1% in 2015 Overall 1% improvement in 2015
Semi-skilled jobs peak at 3% in 2015
Scale Up
-2 % 2015Negative effect on economy,
unless off-set by othermeasures
Jobs increase for lower-skilled (+3% semi-skilled, 0% for unskilledin 2015)
Overall, negative welfareeffects, except poorerhouseholds 0%
Up
Use the measures in 2015)Decrease for higher-skilled
workers (-2% for skilledand -4% for highlyskilled)
Market

POLICY DIRECTIONS
•• The feedback from the LTMS highThe feedback from the LTMS high--level process, taken with level process, taken with C bi t’ di ti d li li t l i h bC bi t’ di ti d li li t l i h bCabinet’s direction and a policy alignment analysis, has been Cabinet’s direction and a policy alignment analysis, has been translated into translated into 6 broad policy direction themes6 broad policy direction themes..
•• Theme 1: Greenhouse gas emission reductions and limits Theme 1: Greenhouse gas emission reductions and limits •• Theme 2: Build on, strengthen and/or scale up current initiatives Theme 2: Build on, strengthen and/or scale up current initiatives , g / p, g / p•• Theme 3: Implementing the “Business Unusual” Call for Action Theme 3: Implementing the “Business Unusual” Call for Action •• Theme 4: Preparing for the future Theme 4: Preparing for the future
Th 5 V l bili d Ad iTh 5 V l bili d Ad i•• Theme 5: Vulnerability and Adaptation Theme 5: Vulnerability and Adaptation •• Theme 6: Alignment, Coordination and CooperationTheme 6: Alignment, Coordination and Cooperation
See Annexure A – LTMS Policy Directions

Theme 1: GHG emission reductions and limits (Cont.)( )
Peak
Decline
Plateau
Decline

Thank youThank you
For additional information visitwww.environment.gov.za: go to Hot Issues, wait for LTMS
http://www.environment.gov.za/HotIssues/2008/LTMS/A%20LTMS%20Scenarios%20for%20SA.pdf