long term modeling and transition towards a low carbon society semaine athens module changement...
TRANSCRIPT
Long term modeling and transition towards a Low Carbon Society
Semaine Athens module Changement climatique
Christophe CASSENCentre International de Recherche sur l’Environnement et le
Développement (CIRED)[email protected]
Presentation schedule
• IPCC reports: structure and some insights
• Long term modeling: current development and perspective views
• The Imaclim program and the transition toward a LCS
History of the IPCC (GIEC)
• 1979 : First World Climate Conference (WMO)
« continued expansion of man’s activities on earth may cause significant extended regional and even global changes of climate »
« global cooperation to explore the possible future course of global climate and to take this new understanding into account in planning for the future development of human society »
The Conference appealed to nations of the world « to foresee and to prevent potential man-made changes in climate that might be adverse to the well-being of humanity »

History of the IPCC
• 1979 : First World Climate Conference (WMO)• 1985 : UNEP/WMO Conference
‘Assessment of the Role of Carbon Dioxide and of Other Greenhouse Gases in Climate Variations and Associated Impacts’
- Rise in temperature during 21st century due to GHG
- Sea level rise
- Need of mitigation policies
Advisory Group on Greenhouse Gases (AGGG, precursor of the IPCC)

History of the IPCC
• 1979 : First World Climate Conference (WMO)• 1985 : UNEP/WMO Conference
‘Assessment of the Role of Carbon Dioxide and of Other Greenhouse Gases in Climate Variations and Associated Impacts’
• 1988 : G7 recommendation and the setting up of the IPCC at the 40th session WMO, with UNEP support

Initial objectives
• Identify uncertainties and scientific researches relating to climate needs
• Identify informations necessary to assess climate policies
• Review policies implemented • Assess all implications of CC• Collaborate with other UN agencies and
governments

History of the IPCC
• 1979 : First World Climate Conference (WMO)• 1985 : UNEP/WMO Conference
‘Assessment of the Role of Carbon Dioxide and of Other Greenhouse Gases in Climate Variations and Associated Impacts’
• 1988 : setting up of the IPCC at the 40th session WMO, with UNEP support
• 1988 : complete report on CC requested preparing a possible international convention on climate
Structure
• IPCC Bureau
• Three Working Groups :
– WGI : Scientific Assessment of CC– WGII : Impact assessment of CC– WGIII : Response strategies to CC
Structure and report writing process
• Each group divided in chapters with coordinating, lead and contributing authors
• Strict appointment of experts
• Long process of writing: a volunteer job!
• Three reports: complete report, technical summary, and the Summary for policy makers (SPM)

A scientific or a political report?
• The ambiguous role of the SPM
• A loose consensus
• « Climategate »: limits of the process?
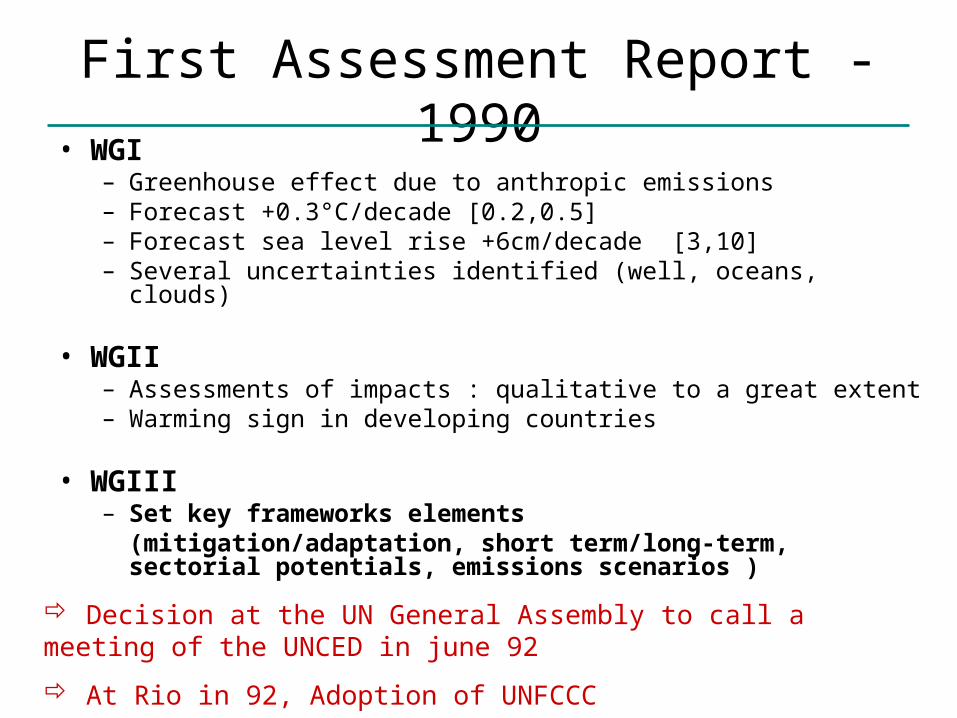
First Assessment Report - 1990• WGI
– Greenhouse effect due to anthropic emissions– Forecast +0.3°C/decade [0.2,0.5]– Forecast sea level rise +6cm/decade [3,10]– Several uncertainties identified (well, oceans, clouds)
• WGII– Assessments of impacts : qualitative to a great extent– Warming sign in developing countries
• WGIII– Set key frameworks elements
(mitigation/adaptation, short term/long-term, sectorial potentials, emissions scenarios )
Decision at the UN General Assembly to call a meeting of the UNCED in june 92
At Rio in 92, Adoption of UNFCCC
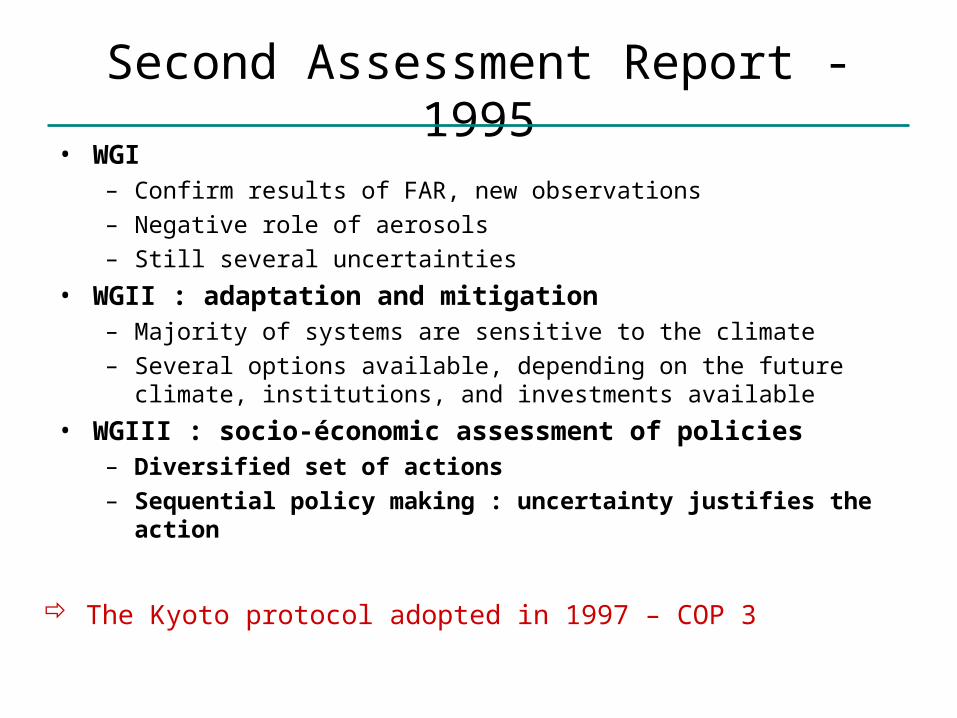
Second Assessment Report - 1995• WGI
– Confirm results of FAR, new observations
– Negative role of aerosols
– Still several uncertainties
• WGII : adaptation and mitigation– Majority of systems are sensitive to the climate
– Several options available, depending on the future climate, institutions, and investments available
• WGIII : socio-économic assessment of policies – Diversified set of actions
– Sequential policy making : uncertainty justifies the action
The Kyoto protocol adopted in 1997 – COP 3

Special Report on Emission Scenarios - 2000
– Definition of 4 main ‘storylines’
Em
ph
asi
s on
su
sta
inab
ilit
y a
nd
eq
uit
y
Globalisation
Regionalisation/fragmentation
Globalised, intensive
‘Market-Forces’
Regional, extensive
‘Mixed green bag’
Globalised, extensive
‘Sustainable development’
Regional, intensive
‘Clash of civilisations’
Source : SRES, H. Kieken
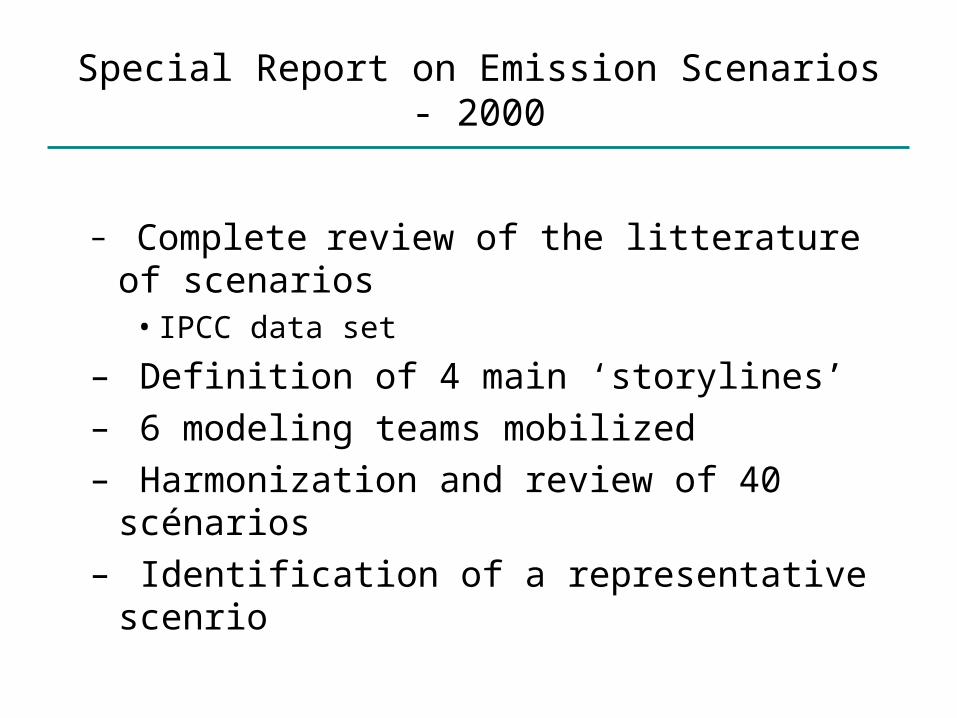
Special Report on Emission Scenarios - 2000
– Complete review of the litterature of scenarios• IPCC data set
– Definition of 4 main ‘storylines’– 6 modeling teams mobilized– Harmonization and review of 40 scénarios– Identification of a representative scenrio

Special Report on Emission Scenarios - 2000
– Data set of existing scenarios
– Complete assessment of the literature

« Une stabilisation entre 710 et 445 ppm équiv.-CO2 en 2050 impliquerait, à l'échelle de la planète, des coûts macroéconomiques moyens se situant entre une hausse de 1 % et une baisse de 5,5 % du PIB mondial. Cela équivaut à un ralentissement de la progression moyenne du PIB mondial de moins de 0,12 point de pourcentage par an. » (AR4 WGIII SPM Box 3)
Fourth Report on Emission Scenarios - 2007

Moderate stabilization costs
t
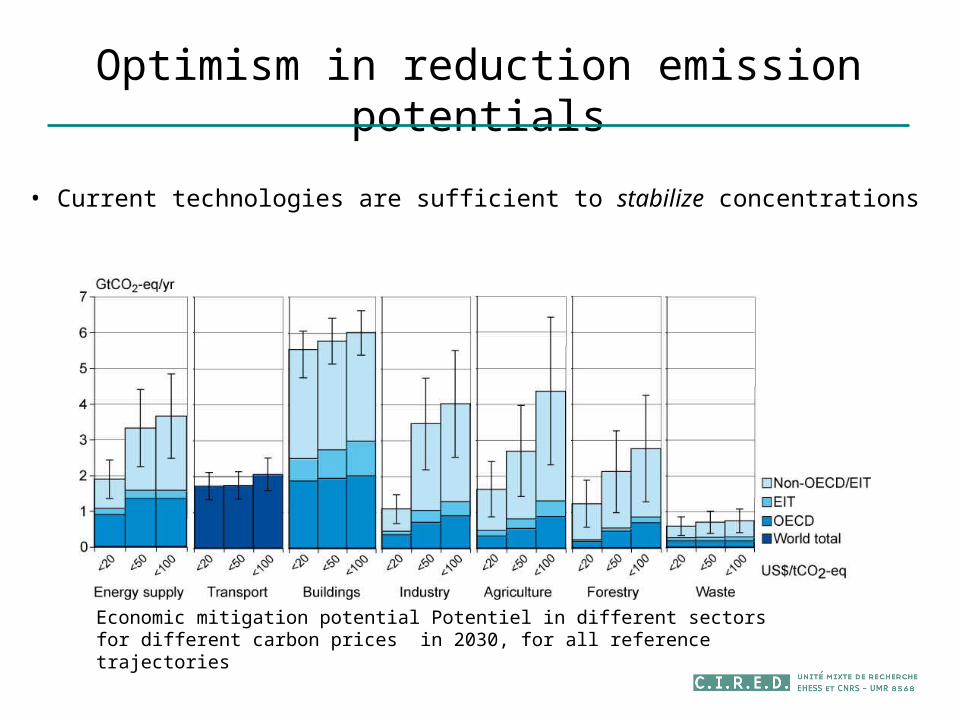
Optimism in reduction emission potentials
• Current technologies are sufficient to stabilize concentrations
Economic mitigation potential Potentiel in different sectors for different carbon prices in 2030, for all reference trajectories

Source: McKinsey 2009
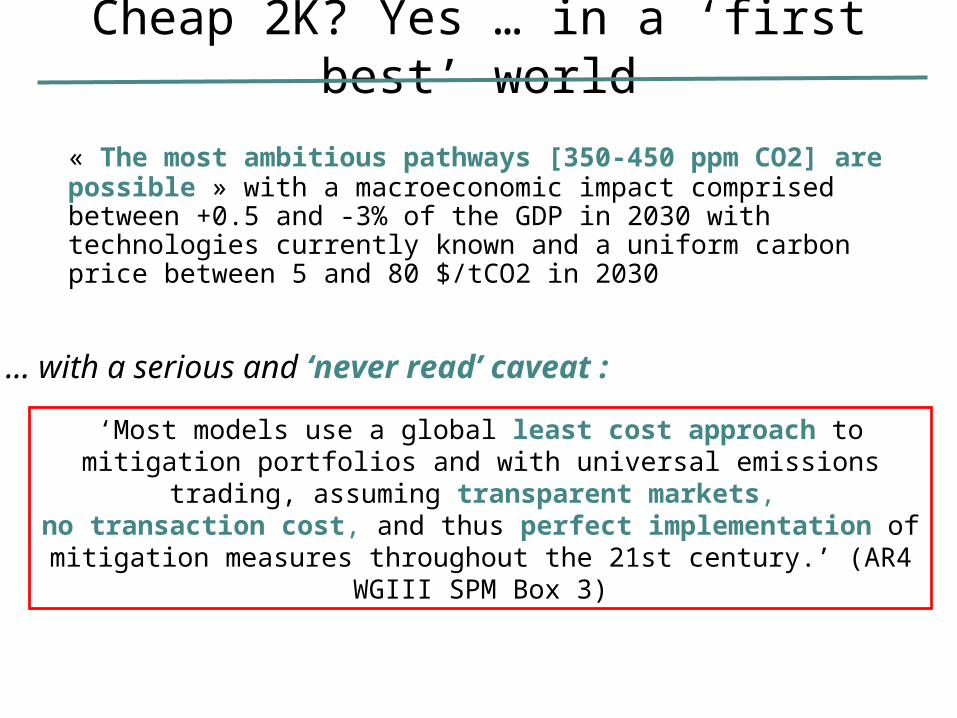
Cheap 2K? Yes … in a ‘first best’ world
« The most ambitious pathways [350-450 ppm CO2] are possible » with a macroeconomic impact comprised between +0.5 and -3% of the GDP in 2030 with technologies currently known and a uniform carbon price between 5 and 80 $/tCO2 in 2030
‘Most models use a global least cost approach to mitigation portfolios and with universal emissions trading, assuming transparent markets, no transaction cost, and thus perfect implementation of mitigation
measures throughout the 21st century.’ (AR4 WGIII SPM Box 3)
… with a serious and ‘never read’ caveat :

Technologies are not the only way to reduce emissions
• Behavioral obstacles
• Bottlenecks, lock in
• Technical progress is not a manna from heaven!

Information gap in the residential sector
65% 90%
22Source: Giraudet 2010
Technologies are not the only way to reduce emissions
• Behavioral obstacles
• Bottlenecks, lock in
• Technical progress is not a manna from heaven!

Early investissement, bottlenecks and maturation of the EV industry
Uncertainty on the triggering date of the EV penetration
Max market share of EV in solds
years
Source: vogt et al 2009

Source: WEO 2007
© OECD/IEA - 2007
Next 10 years are crucial: CO2 Emissions from Coal-Fired Power Stations built prior to 2015 in China & India
0
1 000
2 000
3 000
4 000
5 000
6 000
2006 2015 2030 2045 2060 2075
milli
on to
nnes
of C
O2
Existing power plants Power plants built in 2005-2015
Capacity additions in the next decade will lock-in technology & largely determine emissions through 2050 & beyond

Technologies are not the only way to reduce emissions
• Behavioral obstacles
• Bottlenecks, lock in
• Technical progress is not a manna from heaven!

Models and the transition towards a low carbon society: some
perspectives

The rise of modeling issues
• The development of modeling in the 70’s: the experience of the club of Rome and the Meadows report Limits to Growth (72)
• In a context of increasing political, economic and energy tensions
• Stockolm conference 1972: the Third World has to play an active role to solve the environmental and resource issues but it refuses constraints to its own development
• Outburst of modeling scenario with the computer revolution
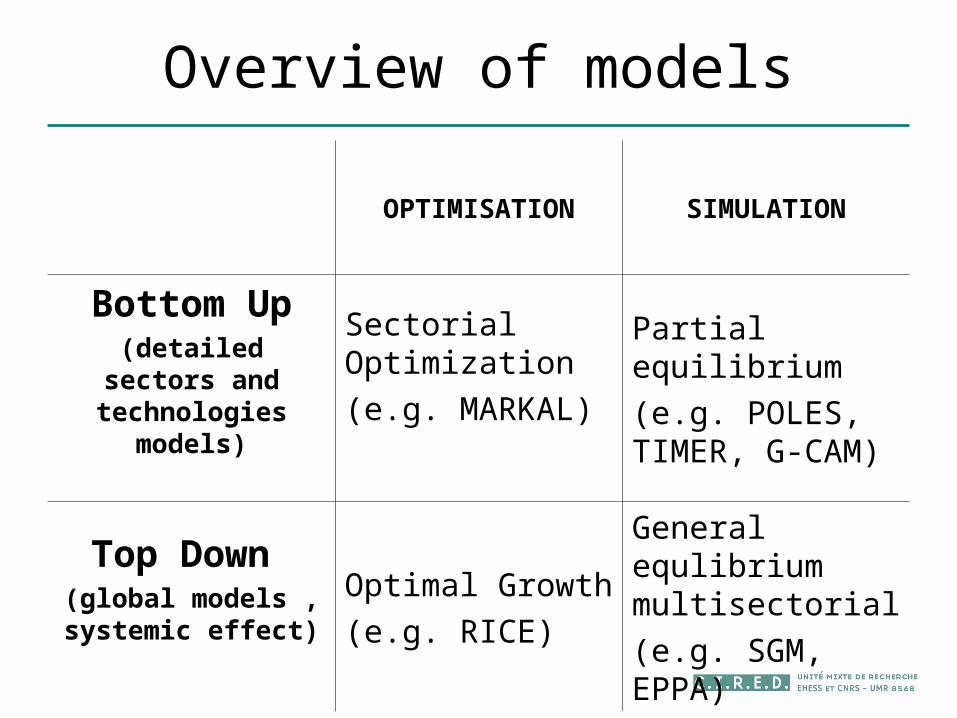
Overview of models
OPTIMISATION SIMULATION
Bottom Up(detailed sectors and
technologies models)
Sectorial Optimization
(e.g. MARKAL)
Partial equilibrium
(e.g. POLES, TIMER, G-CAM)
Top Down (global models , systemic effect)
Optimal Growth
(e.g. RICE)
General equlibrium multisectorial
(e.g. SGM, EPPA)

Overview of the climate issue
• 1979 1st world conference on CC• 1988: G7: launching of the « climate case »• 1992: Rio de Janeiro: Climate Convention• 1995: The Berlin warrant1995: The Berlin warrant• 1997: The Kyoto Protocol1997: The Kyoto Protocol• 2000: Half-failure of de COP6 at La Haye• 2001: Marrakech agreement (COP7) exit of USA• 2004: Kyoto protocol ratified and applied• 2005: G8 Gleneagle : a rupture• 2009: Copenhaguen• 2010:Cancun: some progress?

Modeling perspective and climate negotiations
(early 90’s)
Rio 1992: the climate convention
« stabiliser les concentrations de gaz à effet de serre dans l’atmosphère à un niveau qui empêche toute perturbation anthropique dangereuse du système climatique […]dans un délai convenable pour que les écosystèmes puissent s’adapter naturellement […] et que le développement économique puisse se poursuivre de manière durable », (art.2, CNUCC).
« les politiques et mesures prises pour faire face au changement climatique devraient être coût efficace de manière à assurer des bénéfices globaux au plus bas coût possible. », (art.3, CNUCC).

Modeling perspective and climate negotiations
(early 90’s)
Optimism of “engineers” vs pessimism of “economists”
Technical cost vs macro-economic costs
What about the instruments? The debate around a carbon tax: the EU vs the USA

The Kyoto Protocol
• The mandate of Berlin: quotas of emissions instead of an international carbon tax
• Kyoto: commitments and flexibility mechanisms (CDM, JI)
• In term of modeling: The When, Where and What flexibility strategies

When flexibility?
• Action timing : early vs delayed action
• The alarmists vs the a wait and see policy partisans
• What’s next after Kyoto?
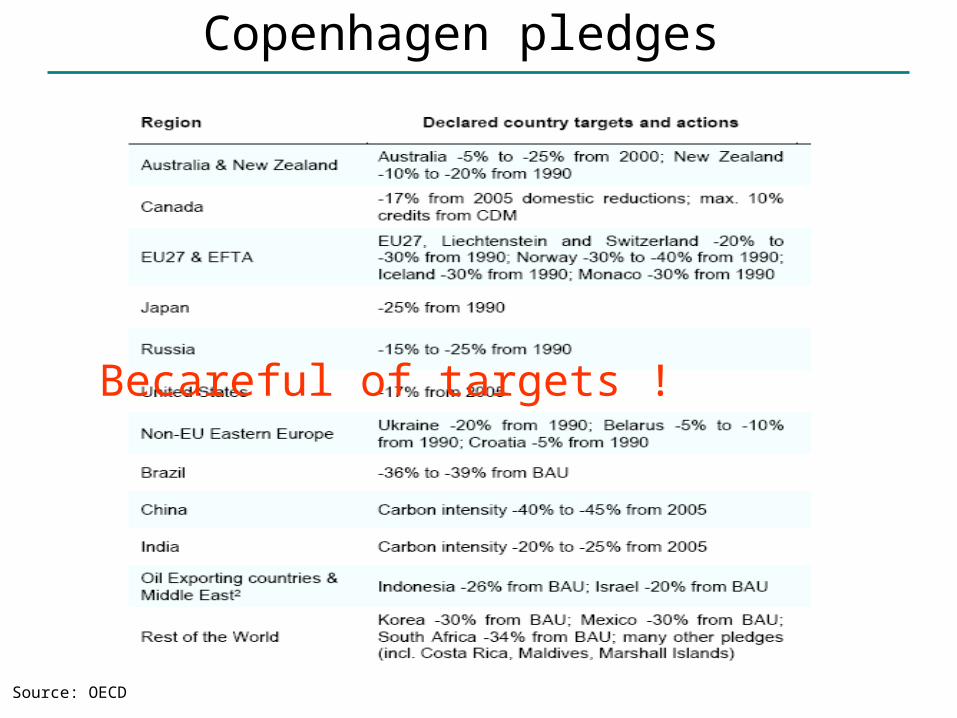
Copenhagen pledges
Becareful of targets !
Source: OECD
Where flexibility?
• Different reduction potentials in sectors and countries
• The problem of transfers between developed and developing countries
• Toward an international carbon market or a fragmented regime?

Transfer may appear prohibitive
Source: Crassous 2009
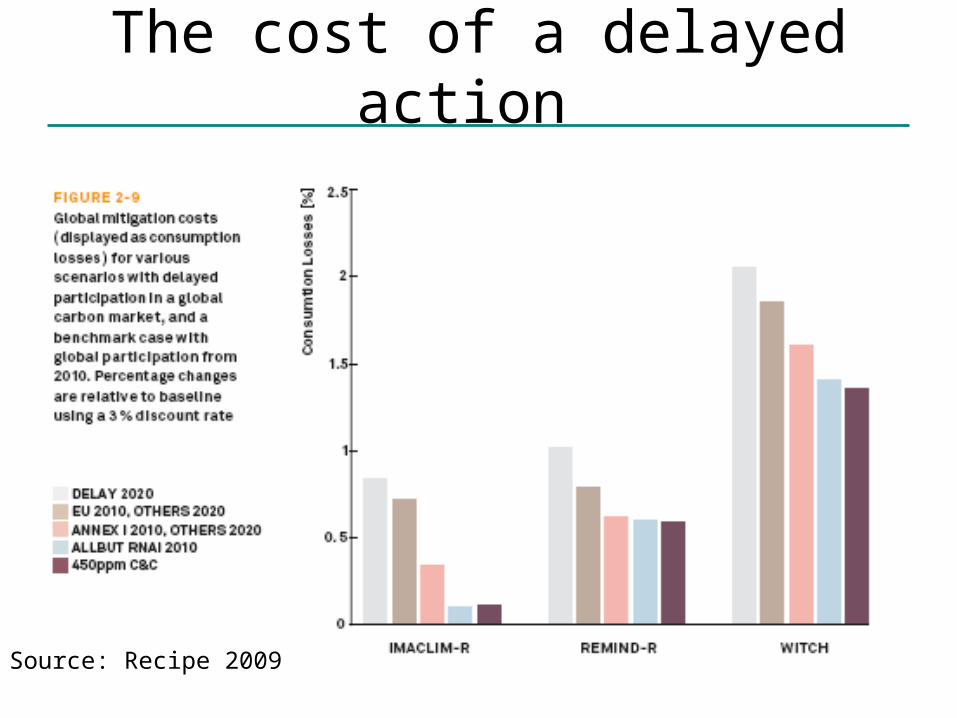
The cost of a delayed action
Source: Recipe 2009
Current issues not (or rarely) addressed in the climate policy literature
The climate/development Gordian Knot: Weak representation of medium-run dynamics: a lack of insights about the magnitude of transition costs
Few attempts to use models of a non-perfect world with imperfect foresight and disequilibria

Toward hybrid models?
Macroeconomic feedbacks
Technological precision
Behavioural realism
Idéal model
TD models
BU models
Source: Hourcade
The Imaclim-R modelThe Imaclim program and the transition towards LCS
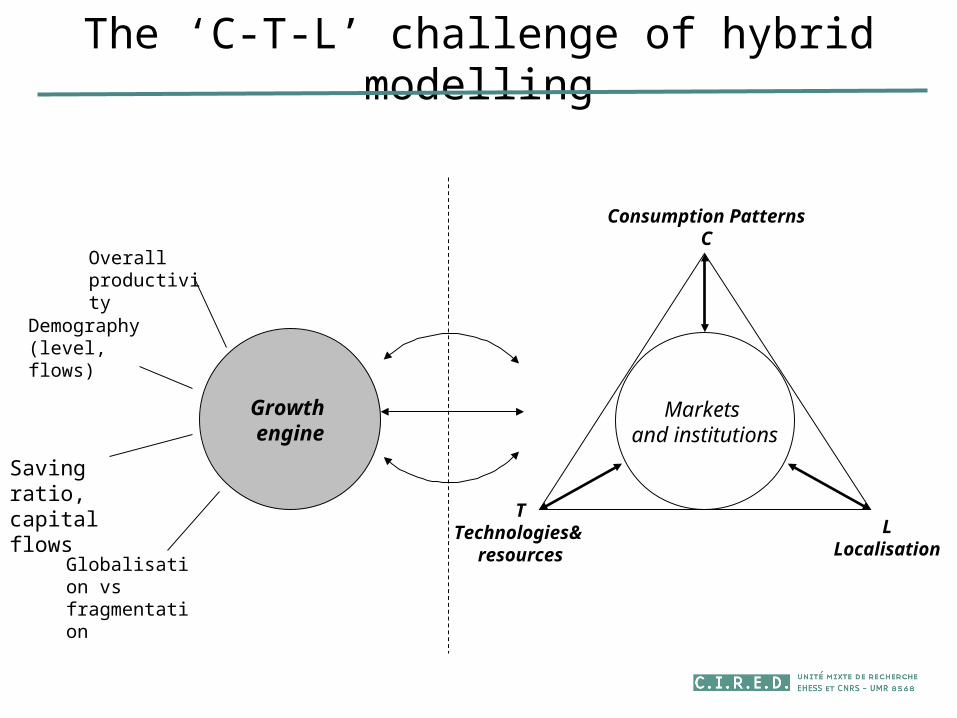
The ‘C-T-L’ challenge of hybrid modelling
Growth engine
Demography (level, flows)
Overall productivity
Globalisation vs fragmentation
Markets and institutions
Consumption PatternsC
TTechnologies&
resources
LLocalisation
Saving ratio, capital flows
43
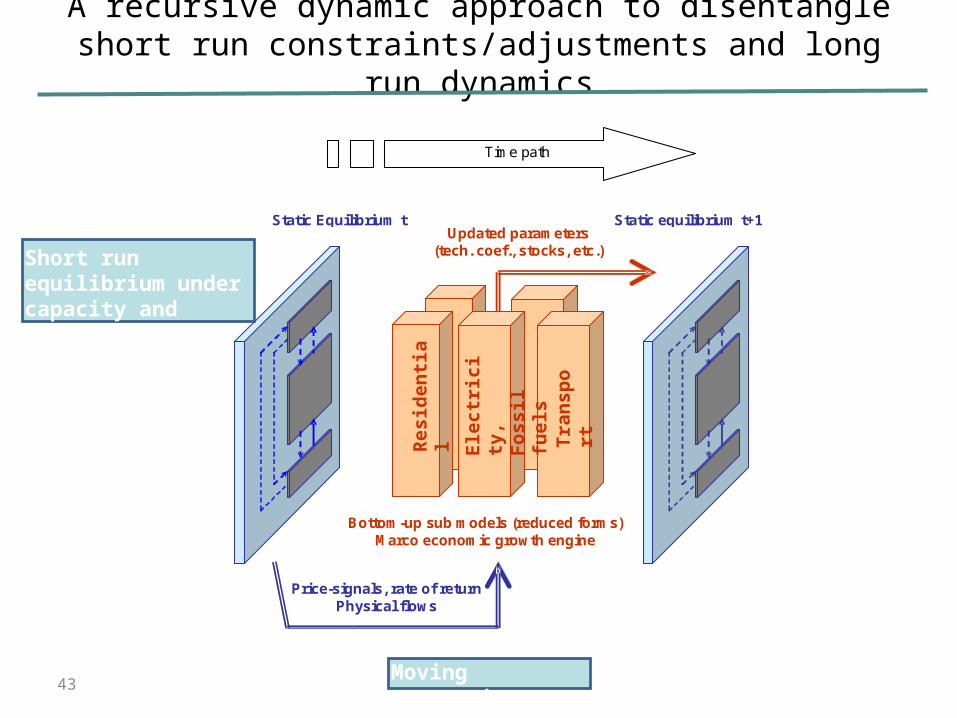
A recursive dynamic approach to disentangle short run constraints/adjustments and long run dynamics
Updated parameters (tech. coef., stocks, etc.)
Bottom-up sub models (reduced forms) Marco economic growth engine
Price-signals, rate of return Physical flows
Static Equilibrium t Static equilibrium t+1
Time path
Resi
denti
al
Elec
tric
ity,
Foss
il fu
els
Tran
spor
t
Short run equilibrium under capacity and technology constraints
Moving constraints
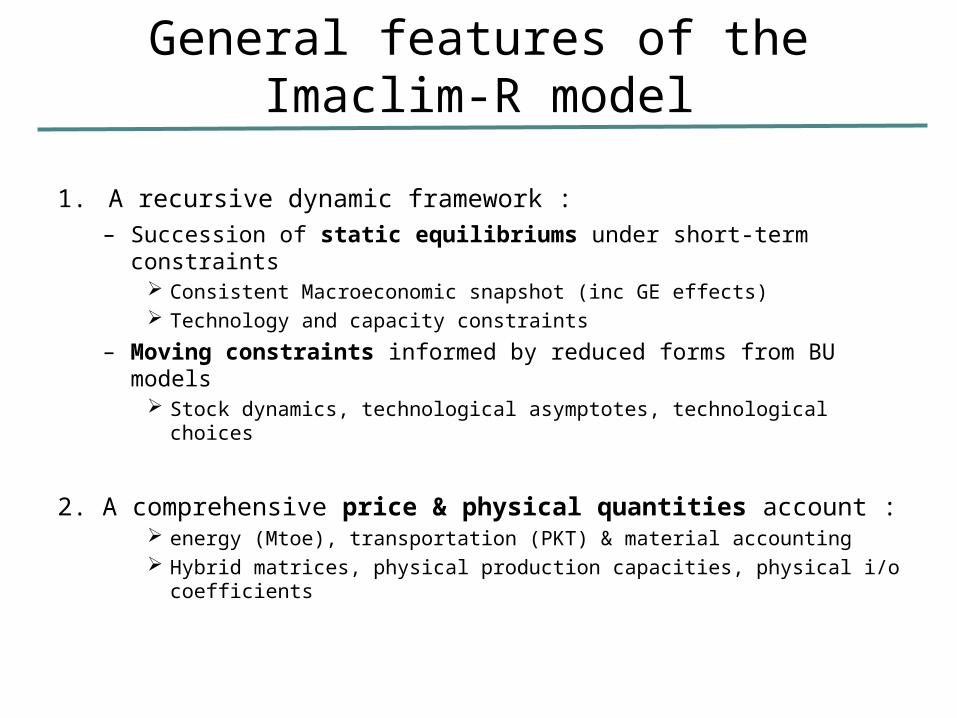
General features of the Imaclim-R model
1. A recursive dynamic framework :– Succession of static equilibriums under short-term constraints
Consistent Macroeconomic snapshot (inc GE effects) Technology and capacity constraints
– Moving constraints informed by reduced forms from BU models Stock dynamics, technological asymptotes, technological choices
2. A comprehensive price & physical quantities account : energy (Mtoe), transportation (PKT) & material accounting Hybrid matrices, physical production capacities, physical i/o coefficients

Mind the transition specifically for the « poors »!(450ppm CO2 w/o biological sequestration)
-10%
-9%
-8%
-7%
-6%
-5%
-4%
-3%
-2%
-1%
0%
1%
2000 2025 2050 2075
GD
P v
aria
tio
n w
.r.t
. th
e b
asel
ine
Annex 1
World
Non Annex 1
Source: Imaclim CIRED
Why such a transitional slowdown ?
• Ambitious
• Inertia and ‘lock-in’ effects
• Imperfect foresight
• Perverse effects on terms of trade and exchange rates
• Price-only policies (no infrastructure policy, no spatial planning)

Range of GDP variations (% of corresponding baseline GDP)
-16%
-14%
-12%
-10%
-8%
-6%
-4%
-2%
0%
2010 2020 2030 2040 2050 2060 2070 2080 2090 2100G
DP v
ari
ati
on w
.r.t. r
efer
ence
sce
nari
o (%
)
Annex I
non Annex I
World
“added” carbon tax + “later” infrastructures
(Transition Losses, long term dispersions)
Source: Guivarch, 2009

Range of GDP variations (% of corresponding baseline GDP)
-16%
-14%
-12%
-10%
-8%
-6%
-4%
-2%
0%
2%
4%
6%
2010 2020 2030 2040 2050 2060 2070 2080 2090 2100
GD
P v
ari
ati
on w
.r.t. r
efer
ence
sce
nari
o (%
)
Annex I
non Annex I
World
“added” carbon tax + specific early action on transportation infrastructure(Economic advantage on the long term)
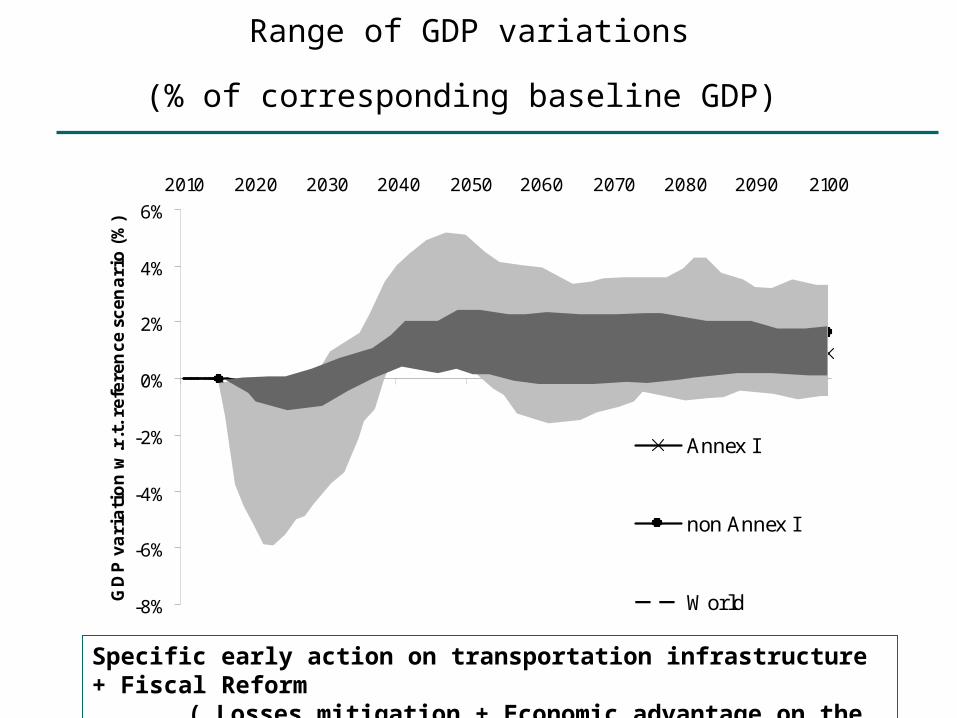
Range of GDP variations
(% of corresponding baseline GDP)
-8%
-6%
-4%
-2%
0%
2%
4%
6%
2010 2020 2030 2040 2050 2060 2070 2080 2090 2100
GD
P v
ari
ati
on w
.r.t. r
efer
ence
sce
nari
o (%
)
Annex I
non Annex I
World
Specific early action on transportation infrastructure + Fiscal Reform( Losses mitigation + Economic advantage on the long term)
Conclusion
• A community confronted to great challenges to inform the post-Copenhagen discussions :– Need a better understanding of the transition by
models, especially in developing countries– More linking international framework and domestic
policies– Think more in a second best world
• Objectives of AR5– integration of WG I, II, III and linking global and
regional scale– Toward commun scenarios ?