long-term nitrogen additions and nitrogen saturation...
TRANSCRIPT
Long-Term Nitrogen Additions andNitrogen Saturation in Two
Temperate Forests
Alison H. Magill,1* John D. Aber,1 Glenn M. Berntson,1 William H. McDowell,2Knute J. Nadelhoffer,3 Jerry M. Melillo,3 and Paul Steudler3
1Complex Systems Research Center, University of New Hampshire, Durham, New Hampshire 03824; 2Department of NaturalResources, University of New Hampshire, Durham, New Hampshire 03824; 3The Ecosystem Center, Marine Biological Laboratory,
Woods Hole, Massachusetts 02354, USA
ABSTRACTThis article reports responses of two different forestecosystems to 9 years (1988–96) of chronic nitrogen(N) additions at the Harvard Forest, Petersham,Massachusetts. Ammonium nitrate (NH4NO3) wasapplied to a pine plantation and a native deciduousbroad-leaved (hardwood) forest in six equal monthlydoses (May–September) at four rates: control (nofertilizer addition), low N (5 g N m-2 y-1), high N (15g N m-2 y-1), and low N 1 sulfur (5 g N m-2 y-1 plus7.4 g S m-2 y-1). Measurements were made of net Nmineralization, net nitrification, N retention, woodproduction, foliar N content and litter production,soil C and N content, and concentrations of dis-solved organic carbon (DOC) and nitrogen (DON) insoil water. In the pine stand, nitrate losses weremeasured after the first year of additions (1989) inthe high N plot and increased again in 1995 and1996. The hardwood stand showed no significantincreases in nitrate leaching until 1995 (high Nonly), with further increases in 1996. Overall Nretention efficiency (percentage of added N re-tained) over the 9-year period was 97–100% in thecontrol and low N plots of both stands, 96% in the
hardwood high N plot, and 85% in the pine high Nplot. Storage in aboveground biomass, fine roots,and soil extractable pools accounted for only 16–32% of the added N retained in the amended plots,suggesting that the one major unmeasured pool, soilorganic matter, contains the remaining 68–84%.Short-term redistribution of 15N tracer at naturalabundance levels showed similar division betweenplant and soil pools. Direct measurements of changesin total soil C and N pools were inconclusive due tohigh variation in both stands. Woody biomass pro-duction increased in the hardwood high N plot butwas significantly reduced in the pine high N plot,relative to controls. A drought-induced increase infoliar litterfall in the pine stand in 1995 is onepossible factor leading to a measured increase in Nmineralization, nitrification, and nitrate loss in thepine high N plot in 1996.
Key words: ammonium nitrate; biomass produc-tion; foliar chemistry; net mineralization; net nitrifi-cation; nitrogen deposition; nitrogen saturation; soilsolution chemistry.
INTRODUCTION
N deposition was first proposed as a possible threatto forest ecosystems nearly 15 years ago (Nihlgard1985). Since that time, a number of coordinated
studies in Europe under the NITREX and EXMANprograms (Wright and van Breemen 1995; Wrightand Rasmussen 1998) and individual experimentsin the US (for example, Christ and others 1995;Magill and others 1996, 1997; McNulty and others1996; Peterjohn and others 1996; Fenn and others1998; Norton and Fernandez 1999) have providedmuch of the data necessary for an increased under-
Received 2 April 1999; Accepted 29 October 1999.*Corresponding author; e-mail: [email protected]
Ecosystems (2000) 3: 238–253DOI: 10.1007/s100210000023 ECOSYSTEMS
r 2000 Springer-Verlag
238
standing of the process of N saturation. In a recentarticle (Aber and others 1998), the results of Euro-pean and North American studies were summarizedinto an inclusive theory where N saturation isdefined as a series of nonlinear changes in keyecosystem processes in response to elevated nitro-gen inputs. The primary indicators of N saturationinclude increases in nitrate leaching losses, netnitrification rates, and foliar N content, and aninitial increase and subsequent decline in both netnitrogen mineralization and net primary productiv-ity. Observation and measurement of such changescan be used to estimate the stage of N saturation,with each stage being characterized by a set ofecosystem response variables (see Aber and others1989, 1998).
In contrast to the similarities observed among theN deposition experiments mentioned above is asignificant amount of variation in the sensitivity ofdifferent forest types to N deposition. For example,it appears that conifer stands move through thestages of N saturation more rapidly than broad-leaved deciduous forests (Stoddard 1994; Aber andothers 1998). Where a forest lies within the con-tinuum of N saturation is a function of severalfactors including community type, soil properties(especially C:N ratios; Gundersen and others 1998a;Gundersen and others 1998b), land-use history, andthe rate and duration of N loading (Aber and others1998). Still, little is known about the mechanismsthat drive N retention and control the rate at whichN saturation proceeds.
The Chronic Nitrogen Amendment experiment atthe Harvard Forest in central Massachusetts (USA)is one of the longest running N addition experi-ments to date and has provided some of the essen-tial data for understanding ecosystem responses to Nadditions (Aber and others 1993; Castro and others1995; Currie and others 1996; Magill and others1997; McDowell and others 1998; Magill and Aber1998, Berntson and Aber forthcoming; Nadelhofferand others 1999a; Yano and others 1998). Thecomparison of two forest types that have markedlydifferent sensitivities to N deposition, coupled withan experimental gradient of N addition rates, makethe Chronic N Amendment experiment an excellentplatform for elucidating the mechanisms of N immo-bilization in response to N deposition.
This article summarizes 9 years (1988–96) offorest ecosystem N cycling, N and C storage, andforest productivity in the Chronic Nitrogen Amend-ment experiment. The long-term record of N fluxesand storage allowed us to examine several impor-tant questions including: (a) how does interannual
climatic variability, including extreme events, suchas drought, influence the ontogeny of N saturation;(b) can we discern whether rates of N deposition orcumulative N deposition have a greater impact onthe progression of N saturation?; (c) do differentforest types show a convergence or a divergence inresponses to long-term N deposition?
METHODS
Study Site and Experimental DesignThe Chronic Nitrogen Addition experiment is lo-cated at the Harvard Forest in central Massachusetts(42o30’N, 72o10’W) and is one of the core experi-ments of the Harvard Forest Long-Term EcologicalResearch (LTER) program. Two forest stands werestudied: a 701-year-old red pine (Pinus resinosa Ait.)plantation (planted in 1926) and a 501-year-oldmixed hardwood stand. The hardwood stand isdominated by black and red oak (Quercus velutinaLam.; Q. rubra L.) with varying amounts of blackbirch (Betula lenta L.), red maple (Acer rubrum L.),and American beech (Fagus grandifolia Ehrh.). Thedominant soil types are stony to sandy loams,classified as Typic Dystrochrepts according to soil pitdescriptions completed in December 1995. The pinestand soil is a Montauk variant and the hardwoodsoil is a Canton variant. Mean monthly tempera-tures range from 19°C in July to -12°C in January(Van Cleve and Martin 1991). Average annualprecipitation is 112 cm. N deposition to the forest isapproximately 0.8 g m-2 y-1 (0.6 g m-2 y-1 wet and 0.2g m-2 y-1 dry; Ollinger and others 1993).
Four 30 x 30–m plots were established in eachstand receiving the following treatments: control(no N added), low N (5 g N m-2 y-1), high N (15 g Nm
-2y-1), and N1S (5 g N m-2 y-1 plus 7.4 g S m-2 y-1).
Fertilizer additions were divided into six equalmonthly doses (May–September) beginning in 1988(see Table 1) and were applied as a concentratedsolution of NH4NO3 plus Na2SO4 for the N1S treat-ment. Each plot was divided into 36 5 x 5–msubplots, and only the center 16 subplots were usedfor sample collection.
Soil WaterSoil water samples were collected approximatelymonthly, May through November, from five porouscup lysimeters installed in each plot at 60 cm depth.A suction of 50 centibar was applied to each lysim-eter for approximately 24 h, samples were collected,and a 20-mL subsample was frozen for subsequentanalysis. Due to drought conditions in 1995, the soil
Nitrogen Saturation in Temperate Forests 239
was too dry to collect soil water from the lysimetersbetween May 31 and October 17.
Lysimeter samples were filtered and analyzed forNO3-N and NH4-N by using a Bran and Luebbe(Technicon) TrAAcs 800 Autoanalyzer. Ammoniumwas analyzed using the Berthelot Reaction chemis-try (Technicon Method 780-86T); nitrate was deter-mined using hydrazine sulfate reduction (TechniconMethod 782-86T). Detection limits for both ni-trate-N and ammonium-N are 0.2 mg L-1 by usingthese techniques. Dissolved inorganic nitrogen (DIN)was determined as the sum of NO3-N and NH4-N.Nitrate flux below the rooting zone was calculatedusing monthly water drainage flux estimates fromthe PnET model (Aber and others 1995b) parameter-ized with climatic data over the same period.
From 1993 to 1996, when sufficient volume ofwater was collected, lysimeter samples also wereanalyzed for dissolved organic carbon (DOC) andnitrogen (DON) concentrations. DOC was measuredwith a Shimadzu TOC-5000 Total Organic Carbonanalyzer. Samples were combusted at 680oC with aPt catalyst and CO2 measured using a nondispersiveinfrared (NDIR) detector. Total dissolved nitrogen(TDN) was measured on the same machine modi-fied with an Antek chemiluminecent detector (Mer-riam and others 1996). DON was calculated asTDN—DIN. The intermittent nature of sample avail-ability does not allow the determination of seasonaltrends or volume weighted average concentrationsper lysimeter. Rather, data will be presented asannual mean concentrations for each treatment.
Trace Gas Emissions
Nitrous oxide fluxes were measured on 20 May1996 on the control and high N treatment plotsonly. This date was chosen because intensive sam-pling over the first 3 years (Bowden and others1990, 1991), and subsequent intermittent sampling(for example, Magill and others 1997) showed thatchanges in N2O flux were only detectable in mid-spring during periods of moderate soil temperatureand high soil moisture content. The static chambermethod used in previous studies was used here(Bowden and others 1990, 1991). Sites were sampledtwice at approximately 0600 and 01400 h; chambertops were placed over rings, and four air samplescollected over a 30-minute period. Air samples wereanalyzed using gas chromatography with flameionization detection. Fluxes were calculated usingthe initial linear portion of the change in gasconcentration in the chamber headspace (n 5 3chambers per plot). For detailed method, see Bowdenand others (1990, 1991).
Net N Mineralization and NitrificationNet nitrification and net N mineralization weremeasured in situ on all plots by using the buried bagtechnique (Nadelhoffer and others 1983; Pastor andothers 1984, Aber and others 1993). Soils wereincubated for a period of 4 to 6 weeks during thegrowing season, with an over-winter incubationfrom October to May. All incubations were initiateda minimum of 2 weeks after the most recentfertilizer addition. Net N mineralization and netnitrification were measured for a full year in 1988,1990, 1993, and 1996. In 1991, growing seasonmeasurements were made and overwinter net min-eralization and net nitrification were estimated as apercentage of growing season values by using datafrom 1988, 1990, and 1993.
In the laboratory, soil samples were homogenizedthrough a 5.6-mm mesh sieve, and a 15-g samplewas extracted in 150 mL of 1 N KCl for 48 hours. Asubsample was oven-dried at 105oC for 48 hours todetermine moisture content. Both initial and incu-bated cores were analyzed for extractable nitrateand ammonium; extracts were analyzed in the samemanner as the lysimeter samples.
Net N mineralization was calculated as the differ-ence between extractable nitrate-N plus ammo-nium-N in the incubated sample and extractablenitrate-N plus ammonium-N in the initial sample.Net nitrification was calculated as the differencebetween nitrate-N in the incubated sample andnitrate-N in the initial sample. Annual totals werecalculated as the sum of 4- or 6-week buried bagincubations in each of the nine soil subplots for eachtreated plot (May through May). This provided ninereplicate values of annual net N mineralization andnet nitrification in each plot for statistical analyses.Data from 1988 were omitted due to a high numberof missing sample points.
Soil Mass and Carbon and Nitrogen ContentAn estimate of soil mass for the organic horizon andtop 10 cm of the mineral soil was used to convert Cand N concentration to total pools and for conver-sion of net mineralization rates from mg N g-1 soil tog N m-2. A mean dry soil core weight value wascalculated for 270–288 cores/horizon from eachplot, collected between 1988 and 1991 as follows:[total sieved core weight (g) ] * [wet weight to dryweight conversion] / [area of soil core collector(m2)] . Using total sieved soil core weight correctsfor inclusions and removes the need to use bulkdensity corrections. In 1996, we acquired sub-samples from all soil samples used to measure initialextractable nitrate and ammonium for N mineraliza-tion. A total of 54 samples was collected per soil
240 A. H. Magill and others
horizon and plot. Samples were aggregated to 21samples within each horizon and plot and analyzedfor C and N concentration by using a Fisons CHNanalyser (Milan, Italy).
Foliar and Woody BiomassAboveground litterfall was collected three times peryear on or near June 1, September 1, and November15 from each of nine plastic baskets per plot (0.2345m2 in size). Litter samples were sorted by species(red and black oak combined), dried for 48 hours at70oC, weighed, and ground using a Wiley mill witha 1-mm mesh screen. Ground samples were driedovernight at 70oC and analyzed for nitrogen, lignin,and cellulose content by using near-infrared (NIR)spectroscopy (McLellan and others 1991; Bolsterand others 1996). Only a partial collection wasmade in 1988 (November). June and Septembercollections were estimated for each stand as apercentage of the November collection, by using1990 control plot data. The 1988 data thereforewere not used in statistical analyses.
All trees greater than 5 cm in diameter at 1.5 maboveground level in 1988 were numbered withaluminum tags, and diameter breast height (DBH)was measured 2.5 cm above the tag in October1988. Trees were measured in November 1990,November 1993, and January 1997. Abovegroundwoody biomass was calculated from tree diametermeasurements by using allometric equations (Pas-tor and others 1983; Nadelhoffer and others 1985).Estimated annual aboveground net primary produc-tion over the entire measurement period (eightgrowing seasons) was calculated as the sum ofwoody biomass increment and aboveground litterinputs.
Foliar ChemistryFresh foliage was collected during the first week ofAugust each year. Needle samples from 20 differentred pines in each plot were pooled into five samplesfor analysis. Oak, red maple, and black birch weresampled in the hardwood stand. A total of fourcomposite samples per species was collected in eachplot. Each sample included leaves from the uppercanopy, midlevel, and understory. Red oak andblack oak were pooled together for all vegetationsampling. Fresh foliage samples were dried, thenground in the same manner as litterfall; freshweights were not recorded. Foliar samples wereanalyzed for percentage nitrogen, lignin, and cellu-lose content by using near-infrared spectroscopy(McLellan and others 1991; Bolster and others1996).
Statistical AnalysesThe effects of the N deposition treatments werecompared separately for the two forest types byusing one of two approaches: nested, repeated-measures ANOVAs or simple ANOVAs. All measure-ments that were made at multiple times at the samelocation, without aggregating samples, were ana-lyzed using a nested, repeated-measures analysis ofvariance (including soil water sampling and buriedbag measurements). Nitrogen deposition was treatedas a main (fixed) factor, replicate sampling locations(for example, lysimeter, treatment subplot) werenested in the nitrogen deposition treatment, andtime was a subplot (fixed) factor. Post hoc compari-sons were performed using least significant differ-ences (LSDs) corrected for multiple comparisons byusing the Bonferroni method (Day and Quinn1989). Measurements for which individual sampleshad been aggregated and/or samples that werecollected through time but not from the samelocation/individual (for example, green leaf nitro-gen concentration) were analyzed using a two-wayANOVA with time and nitrogen deposition treat-ment as fixed factors. Soil C:N samples were col-lected seven times during the year, and nine repli-cate samples in each treatment were aggregated intothree bulk samples. These measurements were ana-lyzed using a nested, repeated-measures ANOVAbecause samples were always taken from the samesubplots and aggregate samples were made usingthe same group of subplots. Normal probability plotswere used to assess the homoscedasticity and nor-mality of residuals (Velleman 1994).
BudgetInput/Output/Retention budgets were calculatedfor all plots for the entire 9-year period. Total inputswere equal to fertilizer additions plus estimated Ndeposition calculated from regional deposition data(Ollinger and others 1993). Total outputs were thesum of gaseous and leaching losses. Gaseous losseswere measured directly as described above. Leach-ing losses were calculated as N concentration (mg NL-1) measured in tension lysimeters (60 cm depth)times estimated monthly runoff calculated using thePnET model (Aber and others 1995b).
Net sinks for added N within the plots weredetermined for directly measurable pools, as thedifference between 1996 and 1988 standing pools .These included (a) soil extractable N, calculated asmean annual NO3-N 1 NH4-N; (b) foliar N calcu-lated as (litterfall mass * green foliage %N), with aneedle retention constant of 2.5 years for pine(Wessman and others 1988); (c) woody biomasscalculated as [increment mass] * [N content of wood
Nitrogen Saturation in Temperate Forests 241
tissue] where mean wood N concentration was0.063% for pine and 0.155% hardwoods (Nadelhof-fer and others 1999a); and; (d) fine roots (notremeasured in 1996, 1993 data used; Magill andothers 1997).
RESULTS AND DISCUSSION
Nitrogen Inputs and LossesNitrogen Additions. Background nitrogen deposi-
tion at the Harvard Forest (0.8 g Nm-2 y-1) ismoderate for the northeastern US (Ollinger andothers 1993; Lovett and Lindberg 1993) and substan-tially lower than in many experimental sites inEurope (Dise and Wright 1995; Gundersen andothers 1998b). Ammonium nitrate additions to thechronic N plots have increased total N inputs byapproximately 6- and 19-fold (Table 1).
Nitrate Leaching. Nitrate leaching is one of themost easily measured indicators of N saturation(Aber and others 1989, 1998). The pine and hard-wood stands have shown very different patterns ofleaching in response to N additions. In the pine high
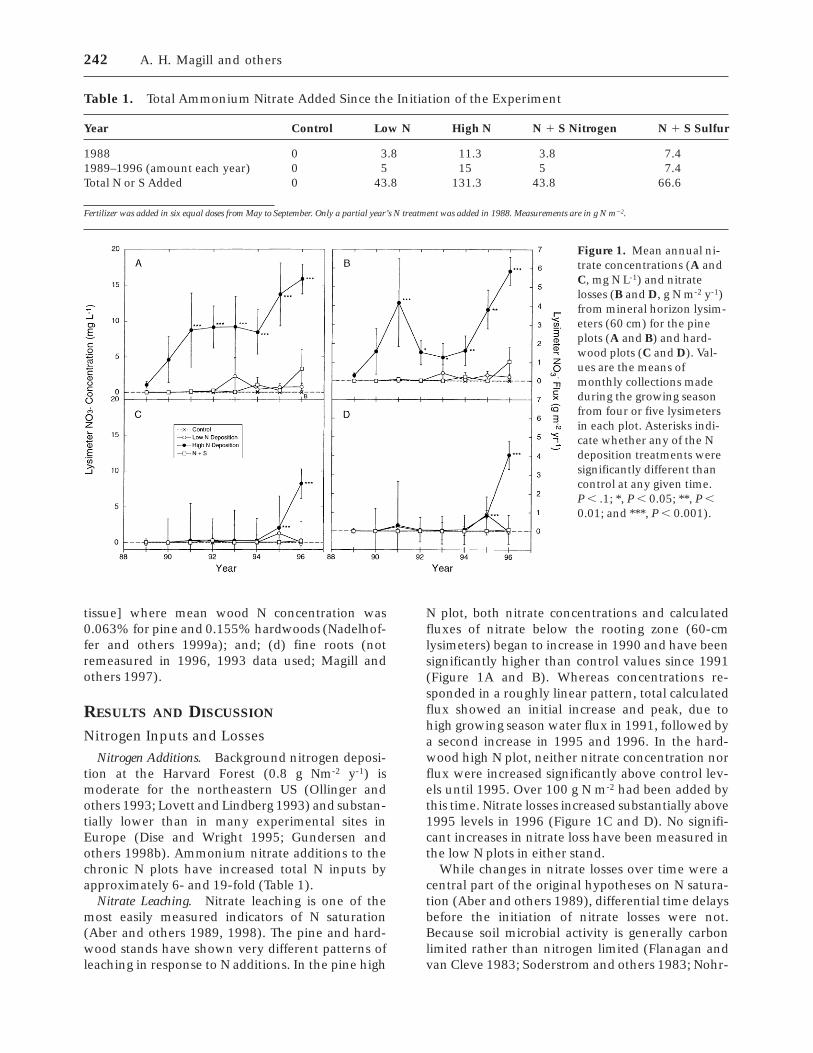
N plot, both nitrate concentrations and calculatedfluxes of nitrate below the rooting zone (60-cmlysimeters) began to increase in 1990 and have beensignificantly higher than control values since 1991(Figure 1A and B). Whereas concentrations re-sponded in a roughly linear pattern, total calculatedflux showed an initial increase and peak, due tohigh growing season water flux in 1991, followed bya second increase in 1995 and 1996. In the hard-wood high N plot, neither nitrate concentration norflux were increased significantly above control lev-els until 1995. Over 100 g N m-2 had been added bythis time. Nitrate losses increased substantially above1995 levels in 1996 (Figure 1C and D). No signifi-cant increases in nitrate loss have been measured inthe low N plots in either stand.
While changes in nitrate losses over time were acentral part of the original hypotheses on N satura-tion (Aber and others 1989), differential time delaysbefore the initiation of nitrate losses were not.Because soil microbial activity is generally carbonlimited rather than nitrogen limited (Flanagan andvan Cleve 1983; Soderstrom and others 1983; Nohr-
Table 1. Total Ammonium Nitrate Added Since the Initiation of the Experiment
Year Control Low N High N N 1 S Nitrogen N 1 S Sulfur
1988 0 3.8 11.3 3.8 7.41989–1996 (amount each year) 0 5 15 5 7.4Total N or S Added 0 43.8 131.3 43.8 66.6
Fertilizer was added in six equal doses from May to September. Only a partial year’s N treatment was added in 1988. Measurements are in g N m22.
Figure 1. Mean annual ni-trate concentrations (A andC, mg N L-1) and nitratelosses (B and D, g N m-2 y-1)from mineral horizon lysim-eters (60 cm) for the pineplots (A and B) and hard-wood plots (C and D). Val-ues are the means ofmonthly collections madeduring the growing seasonfrom four or five lysimetersin each plot. Asterisks indi-cate whether any of the Ndeposition treatments weresignificantly different thancontrol at any given time.P , .1; *, P , 0.05; **, P ,0.01; and ***, P , 0.001).
242 A. H. Magill and others
stedt and others 1989), we hypothesized that plantsinks for added N would provide most of theresistance to N losses and therefore would be satu-rated fairly quickly. The lack of measurable nitratelosses in the hardwood high N plot through 1994indicate that this first stage of N saturation can bedelayed significantly by initial, predeposition condi-tions of the stand. The eventual increases in 1995and 1996 suggest that ‘‘nitrate breakthrough’’ willeventually occur in even the most N limited stands.
Increased mobility of nitrate would be expected toincrease losses of base cations as well, eventuallyaffecting soil and foliar chemistry (van Breemen andothers 1984; Reuss and Johnson 1986; Foster andothers 1989). Increased movement of calcium, mag-nesium, and potassium between the forest floor andmineral soil in all treated plots has been measured(Currie and others 1996, 1999), as well as signifi-cant decreases in both the Mg:N and Ca:Al ratios infoliage (Aber and others 1995a; Magill and others1997). The longer-term effects of chronic N addi-tions on nutrient cation fluxes, foliar element ratios,and biochemical stress indicators are summarized inMinocha and others forthcoming.
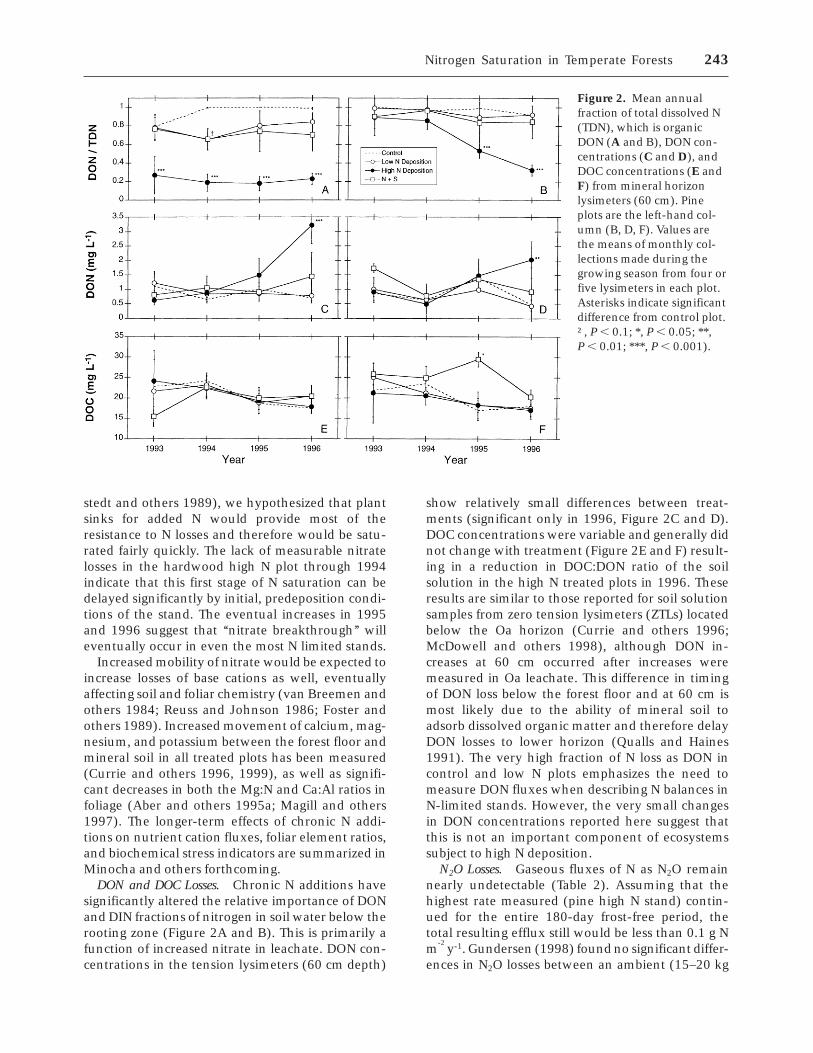
DON and DOC Losses. Chronic N additions havesignificantly altered the relative importance of DONand DIN fractions of nitrogen in soil water below therooting zone (Figure 2A and B). This is primarily afunction of increased nitrate in leachate. DON con-centrations in the tension lysimeters (60 cm depth)
show relatively small differences between treat-ments (significant only in 1996, Figure 2C and D).DOC concentrations were variable and generally didnot change with treatment (Figure 2E and F) result-ing in a reduction in DOC:DON ratio of the soilsolution in the high N treated plots in 1996. Theseresults are similar to those reported for soil solutionsamples from zero tension lysimeters (ZTLs) locatedbelow the Oa horizon (Currie and others 1996;McDowell and others 1998), although DON in-creases at 60 cm occurred after increases weremeasured in Oa leachate. This difference in timingof DON loss below the forest floor and at 60 cm ismost likely due to the ability of mineral soil toadsorb dissolved organic matter and therefore delayDON losses to lower horizon (Qualls and Haines1991). The very high fraction of N loss as DON incontrol and low N plots emphasizes the need tomeasure DON fluxes when describing N balances inN-limited stands. However, the very small changesin DON concentrations reported here suggest thatthis is not an important component of ecosystemssubject to high N deposition.
N2O Losses. Gaseous fluxes of N as N2O remainnearly undetectable (Table 2). Assuming that thehighest rate measured (pine high N stand) contin-ued for the entire 180-day frost-free period, thetotal resulting efflux still would be less than 0.1 g Nm
-2y-1. Gundersen (1998) found no significant differ-
ences in N2O losses between an ambient (15–20 kg
Figure 2. Mean annualfraction of total dissolved N(TDN), which is organicDON (A and B), DON con-centrations (C and D), andDOC concentrations (E andF) from mineral horizonlysimeters (60 cm). Pineplots are the left-hand col-umn (B, D, F). Values arethe means of monthly col-lections made during thegrowing season from four orfive lysimeters in each plot.Asterisks indicate significantdifference from control plot.†, P , 0.1; *, P , 0.05; **,P , 0.01; ***, P , 0.001).
Nitrogen Saturation in Temperate Forests 243
ha-1 y-1) and an NH4NO3 fertilized (ambient plus 35kg ha-1 y-1) Norway spruce stand in Denmark.Denitrification rate was estimated at 0.04 kg N ha-1
y-1 by using these N2O measurements. In contrast;Tietema and others (1991) measured N2O losses of 2g N m-2 y-1 in an N-saturated Dutch forest with aseasonal change in depth to the water table. Resultsfrom the Tietema study show that for gaseous lossesto be substantial, soil conditions may need to bewetter than will likely ever be found at the chronicN plots.
Internal Sinks for Added NFoliage. Foliar N concentration in untreated plots
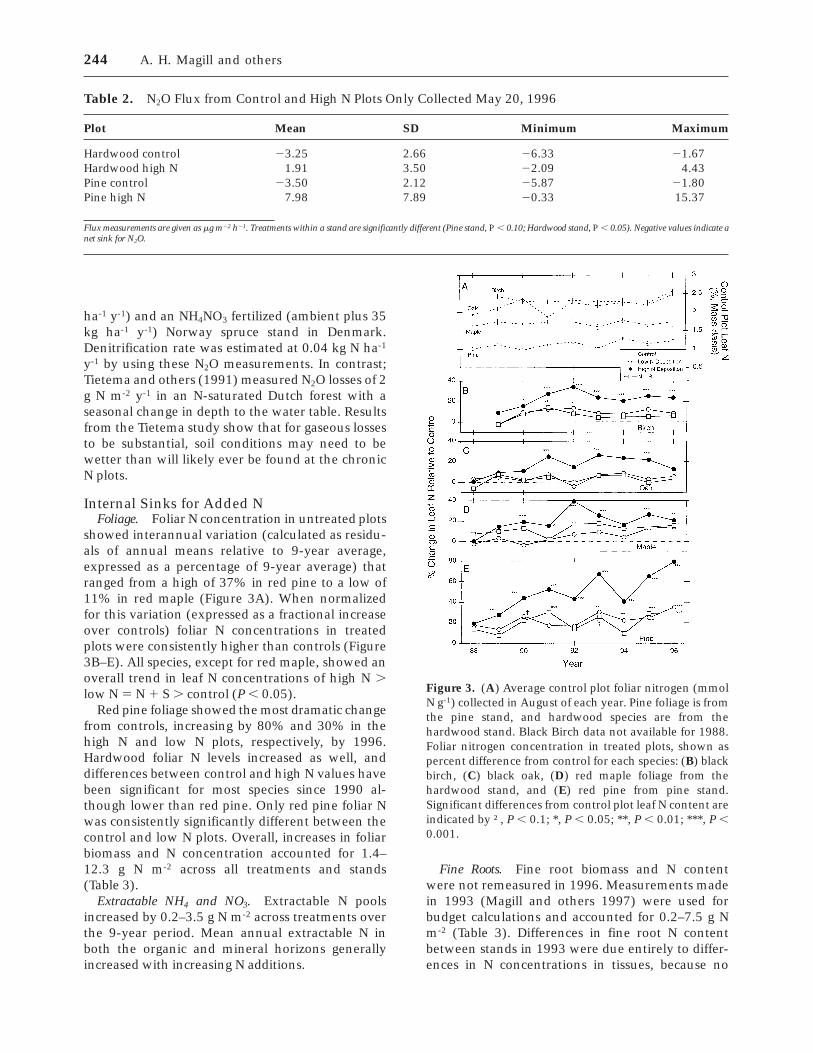
showed interannual variation (calculated as residu-als of annual means relative to 9-year average,expressed as a percentage of 9-year average) thatranged from a high of 37% in red pine to a low of11% in red maple (Figure 3A). When normalizedfor this variation (expressed as a fractional increaseover controls) foliar N concentrations in treatedplots were consistently higher than controls (Figure3B–E). All species, except for red maple, showed anoverall trend in leaf N concentrations of high N .low N 5 N 1 S . control (P , 0.05).
Red pine foliage showed the most dramatic changefrom controls, increasing by 80% and 30% in thehigh N and low N plots, respectively, by 1996.Hardwood foliar N levels increased as well, anddifferences between control and high N values havebeen significant for most species since 1990 al-though lower than red pine. Only red pine foliar Nwas consistently significantly different between thecontrol and low N plots. Overall, increases in foliarbiomass and N concentration accounted for 1.4–12.3 g N m-2 across all treatments and stands(Table 3).
Extractable NH4 and NO3. Extractable N poolsincreased by 0.2–3.5 g N m-2 across treatments overthe 9-year period. Mean annual extractable N inboth the organic and mineral horizons generallyincreased with increasing N additions.
Fine Roots. Fine root biomass and N contentwere not remeasured in 1996. Measurements madein 1993 (Magill and others 1997) were used forbudget calculations and accounted for 0.2–7.5 g Nm-2 (Table 3). Differences in fine root N contentbetween stands in 1993 were due entirely to differ-ences in N concentrations in tissues, because no
Table 2. N2O Flux from Control and High N Plots Only Collected May 20, 1996
Plot Mean SD Minimum Maximum
Hardwood control 23.25 2.66 26.33 21.67Hardwood high N 1.91 3.50 22.09 4.43Pine control 23.50 2.12 25.87 21.80Pine high N 7.98 7.89 20.33 15.37
Flux measurements are given as mg m22 h21. Treatments within a stand are significantly different (Pine stand, P , 0.10; Hardwood stand, P , 0.05). Negative values indicate anet sink for N2O.
Figure 3. (A) Average control plot foliar nitrogen (mmolN g-1) collected in August of each year. Pine foliage is fromthe pine stand, and hardwood species are from thehardwood stand. Black Birch data not available for 1988.Foliar nitrogen concentration in treated plots, shown aspercent difference from control for each species: (B) blackbirch, (C) black oak, (D) red maple foliage from thehardwood stand, and (E) red pine from pine stand.Significant differences from control plot leaf N content areindicated by †, P , 0.1; *, P , 0.05; **, P , 0.01; ***, P ,0.001.
244 A. H. Magill and others
differences in biomass were detected. Whereas de-clining fine root biomass has been identified as a keyresponse to N saturation and forest decline inEuropean and North American studies (for ex-ample, Persson and others 1998), this response hadnot occurred in the chronic N plots by 1993. Resam-pling of fine root biomass is planned in the twelfthyear of the study.
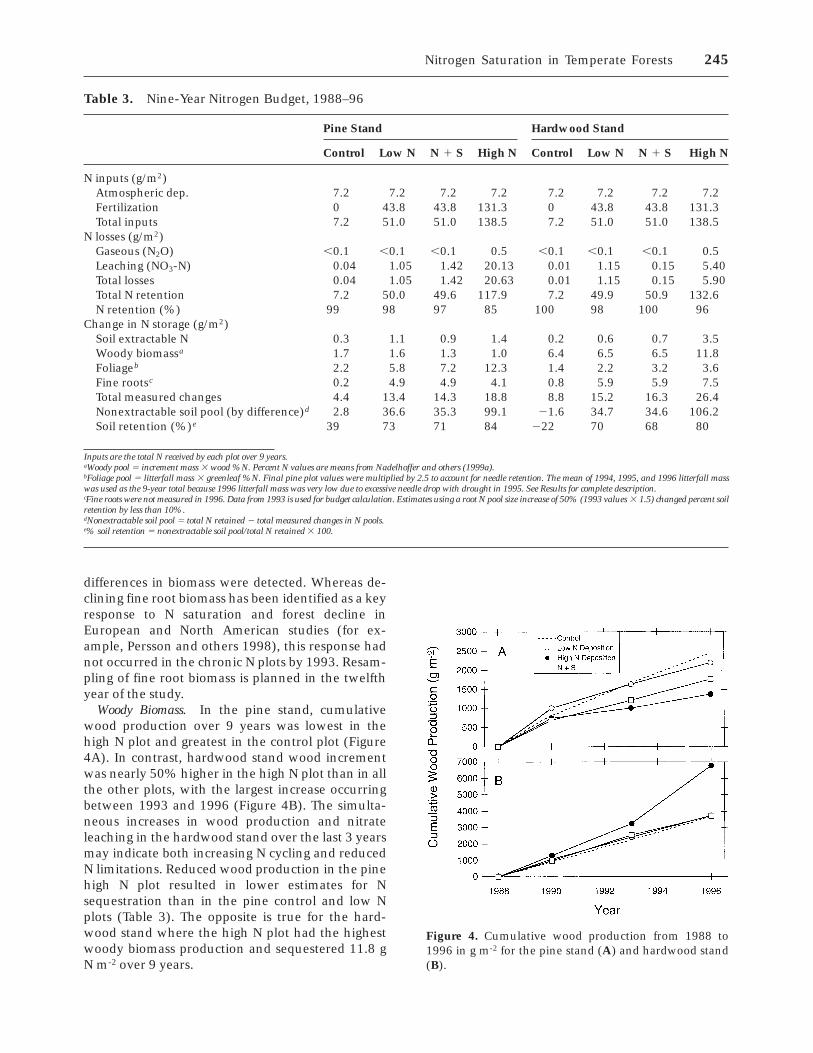
Woody Biomass. In the pine stand, cumulativewood production over 9 years was lowest in thehigh N plot and greatest in the control plot (Figure4A). In contrast, hardwood stand wood incrementwas nearly 50% higher in the high N plot than in allthe other plots, with the largest increase occurringbetween 1993 and 1996 (Figure 4B). The simulta-neous increases in wood production and nitrateleaching in the hardwood stand over the last 3 yearsmay indicate both increasing N cycling and reducedN limitations. Reduced wood production in the pinehigh N plot resulted in lower estimates for Nsequestration than in the pine control and low Nplots (Table 3). The opposite is true for the hard-wood stand where the high N plot had the highestwoody biomass production and sequestered 11.8 gN m-2 over 9 years.
Table 3. Nine-Year Nitrogen Budget, 1988–96
Pine Stand Hardwood Stand
Control Low N N 1 S High N Control Low N N 1 S High N
N inputs (g/m2)Atmospheric dep. 7.2 7.2 7.2 7.2 7.2 7.2 7.2 7.2Fertilization 0 43.8 43.8 131.3 0 43.8 43.8 131.3Total inputs 7.2 51.0 51.0 138.5 7.2 51.0 51.0 138.5
N losses (g/m2)Gaseous (N2O) ,0.1 ,0.1 ,0.1 0.5 ,0.1 ,0.1 ,0.1 0.5Leaching (NO3-N) 0.04 1.05 1.42 20.13 0.01 1.15 0.15 5.40Total losses 0.04 1.05 1.42 20.63 0.01 1.15 0.15 5.90Total N retention 7.2 50.0 49.6 117.9 7.2 49.9 50.9 132.6N retention (%) 99 98 97 85 100 98 100 96
Change in N storage (g/m2)Soil extractable N 0.3 1.1 0.9 1.4 0.2 0.6 0.7 3.5Woody biomassa 1.7 1.6 1.3 1.0 6.4 6.5 6.5 11.8Foliageb 2.2 5.8 7.2 12.3 1.4 2.2 3.2 3.6Fine rootsc 0.2 4.9 4.9 4.1 0.8 5.9 5.9 7.5Total measured changes 4.4 13.4 14.3 18.8 8.8 15.2 16.3 26.4Nonextractable soil pool (by difference)d 2.8 36.6 35.3 99.1 21.6 34.7 34.6 106.2Soil retention (%)e 39 73 71 84 222 70 68 80
Inputs are the total N received by each plot over 9 years.aWoody pool 5 increment mass 3 wood %N. Percent N values are means from Nadelhoffer and others (1999a).bFoliage pool 5 litterfall mass 3 greenleaf %N. Final pine plot values were multiplied by 2.5 to account for needle retention. The mean of 1994, 1995, and 1996 litterfall masswas used as the 9-year total because 1996 litterfall mass was very low due to excessive needle drop with drought in 1995. See Results for complete description.cFine roots were not measured in 1996. Data from 1993 is used for budget calculation. Estimates using a root N pool size increase of 50% (1993 values 3 1.5) changed percent soilretention by less than 10%.dNonextractable soil pool 5 total N retained 2 total measured changes in N pools.e% soil retention 5 nonextractable soil pool/total N retained 3 100.
Figure 4. Cumulative wood production from 1988 to1996 in g m-2 for the pine stand (A) and hardwood stand(B).
Nitrogen Saturation in Temperate Forests 245
Declines in productivity or increases in mortalityhave been reported for other coniferous evergreenforests in the US receiving elevated N deposition(Aber and others 1995a; McNulty and others 1996),and increases in growth in response to removal of Nand S from throughfall have been seen in Europeanconiferous evergreen forests (for example, Beierand others 1998; Boxman and others 1998). At theSolling site, earlier studies linked forest decline toreduced Mg:N ratios in foliage (Schulze 1989), aresponse that also has been seen in the chronic Nplots (Magill and others 1997; Minocha and othersforthcoming). Together, these results suggest thatthe cumulative effects of N deposition at moderate-to-high levels may have negative impacts on bio-mass production in commercial evergreen forests.
Sum of Measured Sinks and N Retention EfficiencyMeasured N retention in the four sinks describedabove (foliage, extractable soil, roots, wood), ac-counted for nearly all ambient N deposition in boththe pine and hardwood control plots. Discrepanciesof 1.6 and 2.7 g N m-2 may be due either tocumulative measurement errors or to minor changesin total storage in soil organic matter. This near-balance and the similarity in values for most pro-cesses between the low N and N1S plots providesome evidence for internal consistency in methodsand calculations.
Overall DIN retention efficiency (percentage ofadded DIN retained) for the first 9 years was 97–100% in the control, low, and N1S plots (Table 3).Elevated nitrate losses in the hardwood high N plotin 1996 reduced the 9-year retention efficiency inthat plot to 96%, whereas a longer period of nitrateloss in the pine high N plot yielded an overall DINretention efficiency of 85%. Increases in directlymeasurable ecosystem N storage pools accounted
for 16–32% of added DIN retained in the amendedplots (Table 3). This suggests that the one majorunmeasured pool, soil organic matter, contained theremaining 68–84% (last line in Table 3).
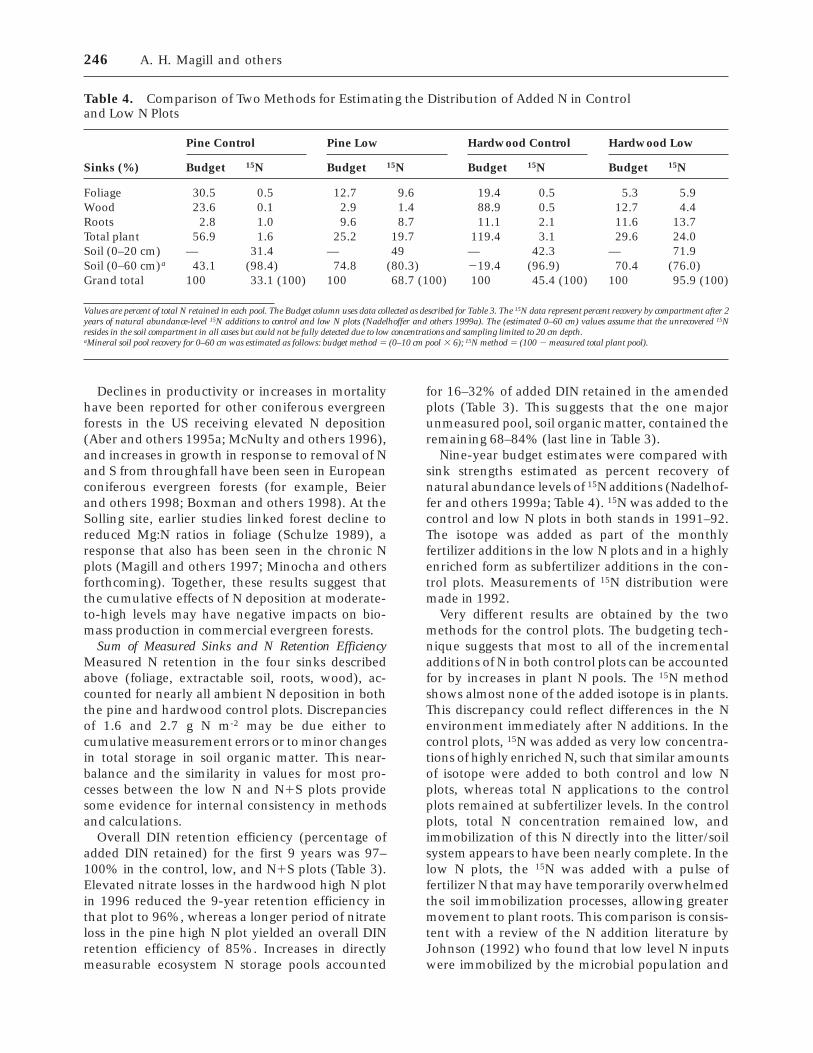
Nine-year budget estimates were compared withsink strengths estimated as percent recovery ofnatural abundance levels of 15N additions (Nadelhof-fer and others 1999a; Table 4). 15N was added to thecontrol and low N plots in both stands in 1991–92.The isotope was added as part of the monthlyfertilizer additions in the low N plots and in a highlyenriched form as subfertilizer additions in the con-trol plots. Measurements of 15N distribution weremade in 1992.
Very different results are obtained by the twomethods for the control plots. The budgeting tech-nique suggests that most to all of the incrementaladditions of N in both control plots can be accountedfor by increases in plant N pools. The 15N methodshows almost none of the added isotope is in plants.This discrepancy could reflect differences in the Nenvironment immediately after N additions. In thecontrol plots, 15N was added as very low concentra-tions of highly enriched N, such that similar amountsof isotope were added to both control and low Nplots, whereas total N applications to the controlplots remained at subfertilizer levels. In the controlplots, total N concentration remained low, andimmobilization of this N directly into the litter/soilsystem appears to have been nearly complete. In thelow N plots, the 15N was added with a pulse offertilizer N that may have temporarily overwhelmedthe soil immobilization processes, allowing greatermovement to plant roots. This comparison is consis-tent with a review of the N addition literature byJohnson (1992) who found that low level N inputswere immobilized by the microbial population and
Table 4. Comparison of Two Methods for Estimating the Distribution of Added N in Controland Low N Plots
Sinks (%)
Pine Control Pine Low Hardwood Control Hardwood Low
Budget 15N Budget 15N Budget 15N Budget 15N
Foliage 30.5 0.5 12.7 9.6 19.4 0.5 5.3 5.9Wood 23.6 0.1 2.9 1.4 88.9 0.5 12.7 4.4Roots 2.8 1.0 9.6 8.7 11.1 2.1 11.6 13.7Total plant 56.9 1.6 25.2 19.7 119.4 3.1 29.6 24.0Soil (0–20 cm) — 31.4 — 49 — 42.3 — 71.9Soil (0–60 cm)a 43.1 (98.4) 74.8 (80.3) 219.4 (96.9) 70.4 (76.0)Grand total 100 33.1 (100) 100 68.7 (100) 100 45.4 (100) 100 95.9 (100)
Values are percent of total N retained in each pool. The Budget column uses data collected as described for Table 3. The 15N data represent percent recovery by compartment after 2years of natural abundance-level 15N additions to control and low N plots (Nadelhoffer and others 1999a). The (estimated 0–60 cm) values assume that the unrecovered 15Nresides in the soil compartment in all cases but could not be fully detected due to low concentrations and sampling limited to 20 cm depth.aMineral soil pool recovery for 0–60 cm was estimated as follows: budget method 5 (0–10 cm pool 3 6); 15N method 5 (100 2 measured total plant pool).
246 A. H. Magill and others
that larger pulses of N were necessary before plantscould compete effectively against soil immobiliza-tion processes.
Net increases in total plant N pools in the controlplots must represent a longer-term accumulation ofN by plants against the strong soil N sinks. Theshort-term pulse of 15N into these systems may berapidly immobilized and only slowly released in aform that can be accessed by plants. In the low Nplots, the pulse of fertilizer addition apparentlyincreased N mobility to roots immediately andresulted in a larger portion residing in the plantpool.
Given the potential for error in each method dueto the number of factors affecting field level datacollections, the agreement between the two esti-mates in the low N plots is reasonable. This isespecially true if the unrecovered 15N is assumed toreside in the lower, unsampled soil horizons, whichaccounts for a much larger fraction of added N in thepine low N plot than the hardwood low N plot.These results appear to be consistent and supportthe theory that most of the added N in these plotsresides in the litter/soil system.
Results from three other field 15N addition studieswere compared with the chronic N results, andwhereas total 15N recovery varied significantly be-tween studies, the fraction retained within the soilpool was similar. Total tracer recovery at four Ndeposition sites in Europe (Tietema and others1998) ranged from 65 to 105%. In addition, theyfound that organic soils retained between 11 and54% of added 15N whereas mineral soil retention of15N ranged from 1 to 27% of the total N added. In asecond study, watershed level additions of 15NH4 atBear Brook in eastern Maine, USA were measuredin three different forest types (Nadelhoffer andothers 1999b). Total recovery was low (34–40%) aswas 0–5 cm soil retention (18–32%). A third studyfound that recovery of 15N (both 15NO3 and 15NH4
labels) added to Pinus radiata stands in New Zealandas part of fertilizer treatments ranged from 72 to100%, depending on presence or absence of pasture(Clinton and Mead 1994). Organic soil retentionwas 18–32%, and mineral soil retention (0-20 cm)of 15N ranged from 22 to 31%. Overall, the variationin recovery rates illustrate the difficulties in workingwith ecosystem or plot level 15N additions andmeasurements. However, they also demonstratethat soils usually exhibit a significant capacity for Nretention.
Possible Mechanisms of N Retention. Near completeretention of long-term N additions is one of themost striking results of the chronic N experiment.Determining the mechanisms by which this has
occurred remains the major challenge of this project.In a recent article (Aber and others 1998), wediscussed three possible mechanisms for incorpora-tion into soil organic matter: (a) N immobilizationby free-living microbes; (b) abiotic reactions withsoil organic matter; and (c) mycorrhizal assimilationand exudation of organically bound N. Simulta-neous consideration of carbon and nitrogen cyclingconstraints on the mechanism of N retention sug-gested a greater importance for abiotic and mycorrhi-zal pathways than previously had been thought.Still, these remain hypotheses to be tested. A num-ber of studies have measured abiotic or chemicalNH4 immobilization rates into soil organic mattersterilized soil samples (Nommik 1970; Axelsson andBerg 1988; Schimel and Firestone 1989; Sen andChalk 1995). An initial set of measurements ofnitrate cycling by 15N pool dilution techniques(Berntson and Aber forthcoming) suggested that‘‘fast’’ immobilization processes (generally associ-ated with abiotic reactions) account for all grossnitrate immobilization in the pine high N, pinecontrol, and hardwood high N plots. Only thehardwood control plot showed detectable ‘‘slow’’gross immobilization, generally associated with mi-crobial processes. Given that the hardwood controlplot is the furthest from saturation, these resultsindicate that nitrate retention mechanisms maychange with increasing N availability and stage of Nsaturation (Berntson and Aber forthcoming).
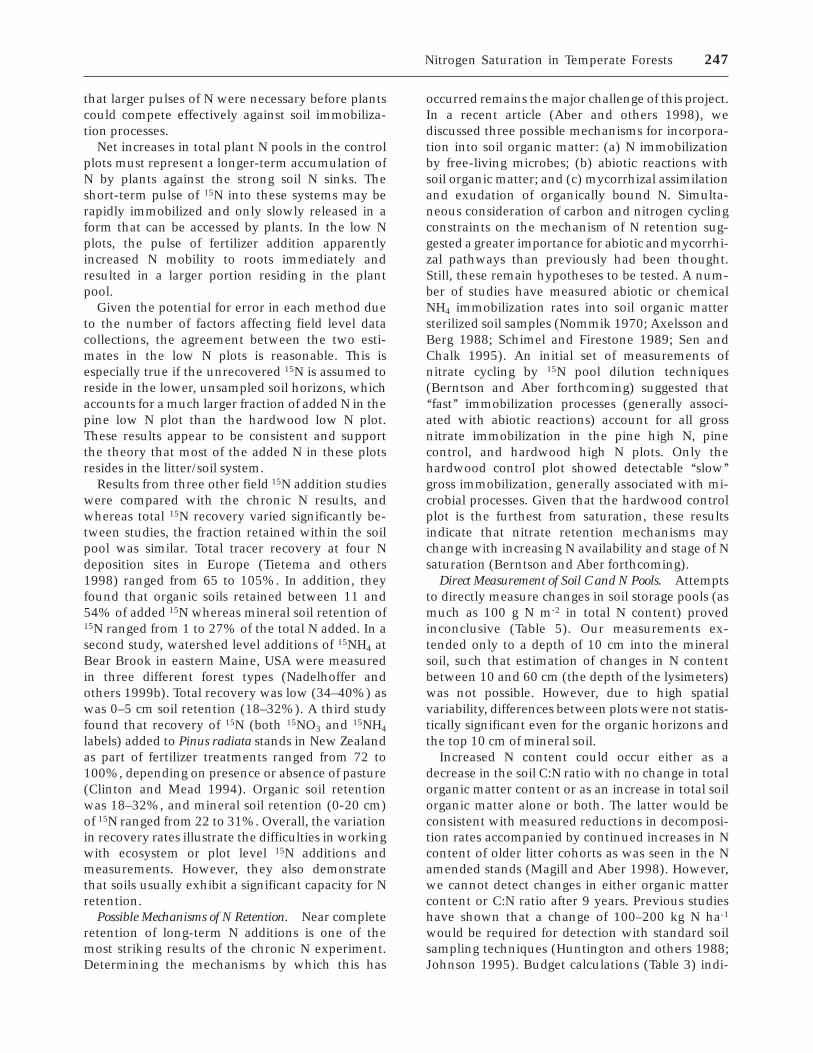
Direct Measurement of Soil C and N Pools. Attemptsto directly measure changes in soil storage pools (asmuch as 100 g N m-2 in total N content) provedinconclusive (Table 5). Our measurements ex-tended only to a depth of 10 cm into the mineralsoil, such that estimation of changes in N contentbetween 10 and 60 cm (the depth of the lysimeters)was not possible. However, due to high spatialvariability, differences between plots were not statis-tically significant even for the organic horizons andthe top 10 cm of mineral soil.
Increased N content could occur either as adecrease in the soil C:N ratio with no change in totalorganic matter content or as an increase in total soilorganic matter alone or both. The latter would beconsistent with measured reductions in decomposi-tion rates accompanied by continued increases in Ncontent of older litter cohorts as was seen in the Namended stands (Magill and Aber 1998). However,we cannot detect changes in either organic mattercontent or C:N ratio after 9 years. Previous studieshave shown that a change of 100–200 kg N ha-1
would be required for detection with standard soilsampling techniques (Huntington and others 1988;Johnson 1995). Budget calculations (Table 3) indi-
Nitrogen Saturation in Temperate Forests 247
cate that increased total N content in the nonextract-able soil pools in the high N plots (99-106 g N m-2)are just beginning to approach detectable levels.
Internal Nitrogen CyclingN Mineralization and Nitrification. Significant in-
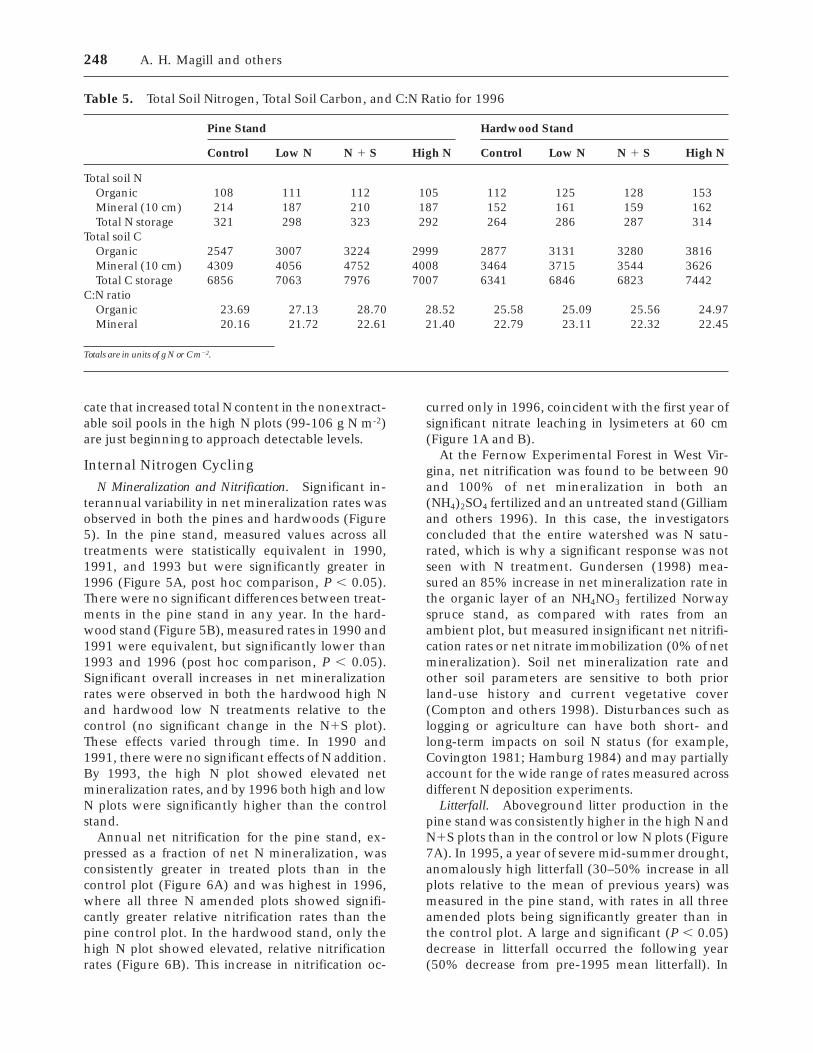
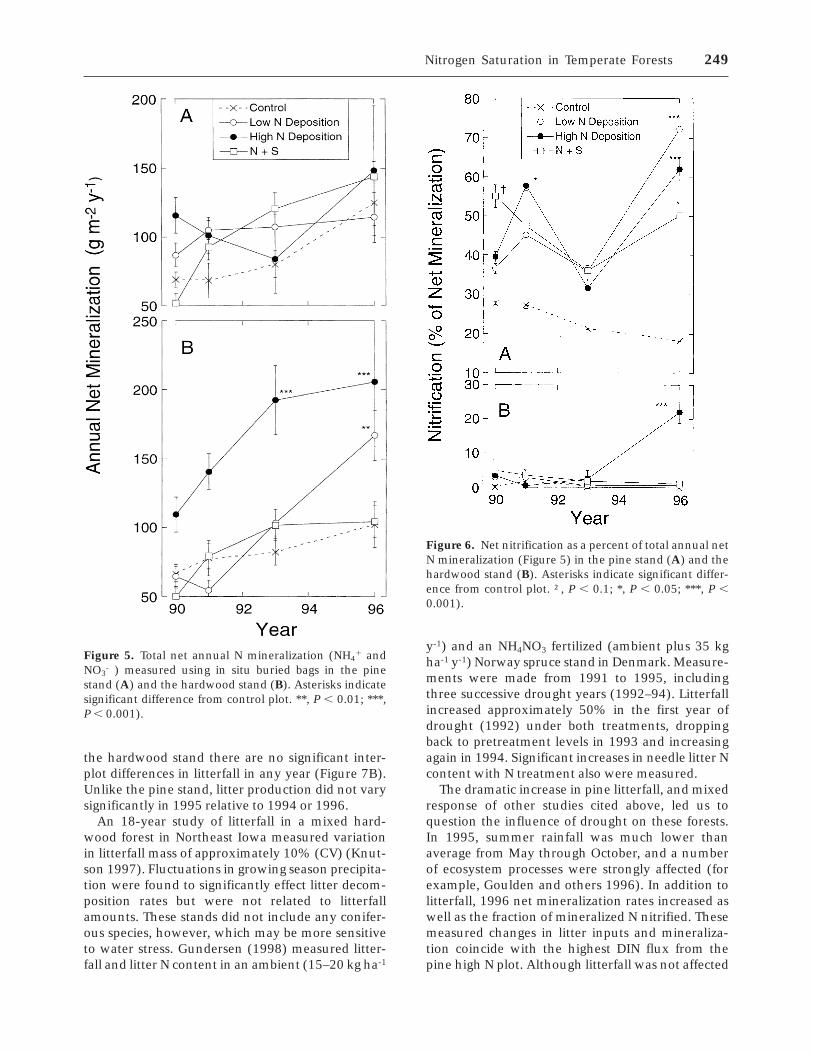
terannual variability in net mineralization rates wasobserved in both the pines and hardwoods (Figure5). In the pine stand, measured values across alltreatments were statistically equivalent in 1990,1991, and 1993 but were significantly greater in1996 (Figure 5A, post hoc comparison, P , 0.05).There were no significant differences between treat-ments in the pine stand in any year. In the hard-wood stand (Figure 5B), measured rates in 1990 and1991 were equivalent, but significantly lower than1993 and 1996 (post hoc comparison, P , 0.05).Significant overall increases in net mineralizationrates were observed in both the hardwood high Nand hardwood low N treatments relative to thecontrol (no significant change in the N1S plot).These effects varied through time. In 1990 and1991, there were no significant effects of N addition.By 1993, the high N plot showed elevated netmineralization rates, and by 1996 both high and lowN plots were significantly higher than the controlstand.
Annual net nitrification for the pine stand, ex-pressed as a fraction of net N mineralization, wasconsistently greater in treated plots than in thecontrol plot (Figure 6A) and was highest in 1996,where all three N amended plots showed signifi-cantly greater relative nitrification rates than thepine control plot. In the hardwood stand, only thehigh N plot showed elevated, relative nitrificationrates (Figure 6B). This increase in nitrification oc-
curred only in 1996, coincident with the first year ofsignificant nitrate leaching in lysimeters at 60 cm(Figure 1A and B).
At the Fernow Experimental Forest in West Vir-gina, net nitrification was found to be between 90and 100% of net mineralization in both an(NH4)2SO4 fertilized and an untreated stand (Gilliamand others 1996). In this case, the investigatorsconcluded that the entire watershed was N satu-rated, which is why a significant response was notseen with N treatment. Gundersen (1998) mea-sured an 85% increase in net mineralization rate inthe organic layer of an NH4NO3 fertilized Norwayspruce stand, as compared with rates from anambient plot, but measured insignificant net nitrifi-cation rates or net nitrate immobilization (0% of netmineralization). Soil net mineralization rate andother soil parameters are sensitive to both priorland-use history and current vegetative cover(Compton and others 1998). Disturbances such aslogging or agriculture can have both short- andlong-term impacts on soil N status (for example,Covington 1981; Hamburg 1984) and may partiallyaccount for the wide range of rates measured acrossdifferent N deposition experiments.
Litterfall. Aboveground litter production in thepine stand was consistently higher in the high N andN1S plots than in the control or low N plots (Figure7A). In 1995, a year of severe mid-summer drought,anomalously high litterfall (30–50% increase in allplots relative to the mean of previous years) wasmeasured in the pine stand, with rates in all threeamended plots being significantly greater than inthe control plot. A large and significant (P , 0.05)decrease in litterfall occurred the following year(50% decrease from pre-1995 mean litterfall). In
Table 5. Total Soil Nitrogen, Total Soil Carbon, and C:N Ratio for 1996
Pine Stand Hardwood Stand
Control Low N N 1 S High N Control Low N N 1 S High N
Total soil NOrganic 108 111 112 105 112 125 128 153Mineral (10 cm) 214 187 210 187 152 161 159 162Total N storage 321 298 323 292 264 286 287 314
Total soil COrganic 2547 3007 3224 2999 2877 3131 3280 3816Mineral (10 cm) 4309 4056 4752 4008 3464 3715 3544 3626Total C storage 6856 7063 7976 7007 6341 6846 6823 7442
C:N ratioOrganic 23.69 27.13 28.70 28.52 25.58 25.09 25.56 24.97Mineral 20.16 21.72 22.61 21.40 22.79 23.11 22.32 22.45
Totals are in units of g N or C m22.
248 A. H. Magill and others
the hardwood stand there are no significant inter-plot differences in litterfall in any year (Figure 7B).Unlike the pine stand, litter production did not varysignificantly in 1995 relative to 1994 or 1996.
An 18-year study of litterfall in a mixed hard-wood forest in Northeast Iowa measured variationin litterfall mass of approximately 10% (CV) (Knut-son 1997). Fluctuations in growing season precipita-tion were found to significantly effect litter decom-position rates but were not related to litterfallamounts. These stands did not include any conifer-ous species, however, which may be more sensitiveto water stress. Gundersen (1998) measured litter-fall and litter N content in an ambient (15–20 kg ha-1
y-1) and an NH4NO3 fertilized (ambient plus 35 kgha-1 y-1) Norway spruce stand in Denmark. Measure-ments were made from 1991 to 1995, includingthree successive drought years (1992–94). Litterfallincreased approximately 50% in the first year ofdrought (1992) under both treatments, droppingback to pretreatment levels in 1993 and increasingagain in 1994. Significant increases in needle litter Ncontent with N treatment also were measured.
The dramatic increase in pine litterfall, and mixedresponse of other studies cited above, led us toquestion the influence of drought on these forests.In 1995, summer rainfall was much lower thanaverage from May through October, and a numberof ecosystem processes were strongly affected (forexample, Goulden and others 1996). In addition tolitterfall, 1996 net mineralization rates increased aswell as the fraction of mineralized N nitrified. Thesemeasured changes in litter inputs and mineraliza-tion coincide with the highest DIN flux from thepine high N plot. Although litterfall was not affected
Figure 5. Total net annual N mineralization (NH41 and
NO3- ) measured using in situ buried bags in the pine
stand (A) and the hardwood stand (B). Asterisks indicatesignificant difference from control plot. **, P , 0.01; ***,P , 0.001).
Figure 6. Net nitrification as a percent of total annual netN mineralization (Figure 5) in the pine stand (A) and thehardwood stand (B). Asterisks indicate significant differ-ence from control plot. †, P , 0.1; *, P , 0.05; ***, P ,0.001).
Nitrogen Saturation in Temperate Forests 249
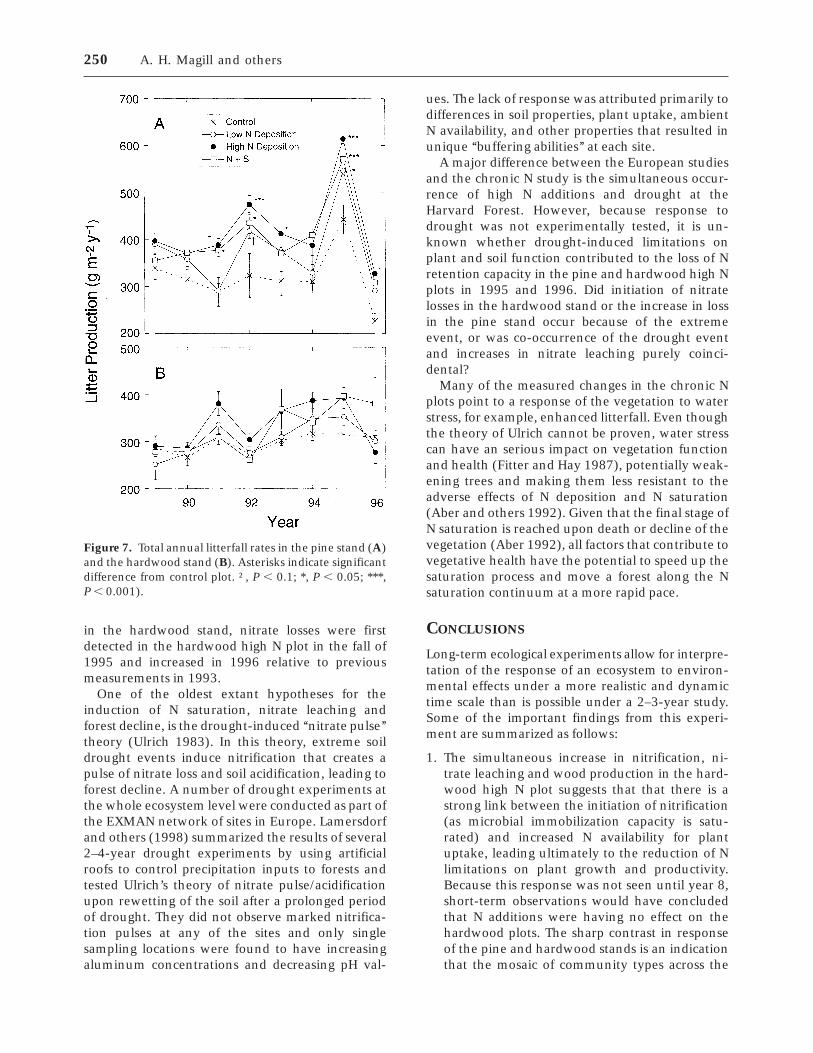
in the hardwood stand, nitrate losses were firstdetected in the hardwood high N plot in the fall of1995 and increased in 1996 relative to previousmeasurements in 1993.
One of the oldest extant hypotheses for theinduction of N saturation, nitrate leaching andforest decline, is the drought-induced ‘‘nitrate pulse’’theory (Ulrich 1983). In this theory, extreme soildrought events induce nitrification that creates apulse of nitrate loss and soil acidification, leading toforest decline. A number of drought experiments atthe whole ecosystem level were conducted as part ofthe EXMAN network of sites in Europe. Lamersdorfand others (1998) summarized the results of several2–4-year drought experiments by using artificialroofs to control precipitation inputs to forests andtested Ulrich’s theory of nitrate pulse/acidificationupon rewetting of the soil after a prolonged periodof drought. They did not observe marked nitrifica-tion pulses at any of the sites and only singlesampling locations were found to have increasingaluminum concentrations and decreasing pH val-
ues. The lack of response was attributed primarily todifferences in soil properties, plant uptake, ambientN availability, and other properties that resulted inunique ‘‘buffering abilities’’ at each site.
A major difference between the European studiesand the chronic N study is the simultaneous occur-rence of high N additions and drought at theHarvard Forest. However, because response todrought was not experimentally tested, it is un-known whether drought-induced limitations onplant and soil function contributed to the loss of Nretention capacity in the pine and hardwood high Nplots in 1995 and 1996. Did initiation of nitratelosses in the hardwood stand or the increase in lossin the pine stand occur because of the extremeevent, or was co-occurrence of the drought eventand increases in nitrate leaching purely coinci-dental?
Many of the measured changes in the chronic Nplots point to a response of the vegetation to waterstress, for example, enhanced litterfall. Even thoughthe theory of Ulrich cannot be proven, water stresscan have an serious impact on vegetation functionand health (Fitter and Hay 1987), potentially weak-ening trees and making them less resistant to theadverse effects of N deposition and N saturation(Aber and others 1992). Given that the final stage ofN saturation is reached upon death or decline of thevegetation (Aber 1992), all factors that contribute tovegetative health have the potential to speed up thesaturation process and move a forest along the Nsaturation continuum at a more rapid pace.
CONCLUSIONS
Long-term ecological experiments allow for interpre-tation of the response of an ecosystem to environ-mental effects under a more realistic and dynamictime scale than is possible under a 2–3-year study.Some of the important findings from this experi-ment are summarized as follows:
1. The simultaneous increase in nitrification, ni-trate leaching and wood production in the hard-wood high N plot suggests that that there is astrong link between the initiation of nitrification(as microbial immobilization capacity is satu-rated) and increased N availability for plantuptake, leading ultimately to the reduction of Nlimitations on plant growth and productivity.Because this response was not seen until year 8,short-term observations would have concludedthat N additions were having no effect on thehardwood plots. The sharp contrast in responseof the pine and hardwood stands is an indicationthat the mosaic of community types across the
Figure 7. Total annual litterfall rates in the pine stand (A)and the hardwood stand (B). Asterisks indicate significantdifference from control plot. †, P , 0.1; *, P , 0.05; ***,P , 0.001).
250 A. H. Magill and others
landscape must be considered when determiningregional scale responses to N deposition.
2. A continued decline in wood production in thepine high N plot, accompanied by increasingfoliar N concentrations, suggests the existence ofnutrient imbalances and the potential for reduc-tion in photosynthetic rates. In a previous article(Magill and others 1997), foliar N content in thepine high N appeared to have reached a maxi-mum after year 4 and did not increase throughyear 6. Continued measurement of this N sink, aspresented in this article, revealed that the foliarcapacity was greater than would have beenconcluded after 6 years of N additions.
3. Low N plots have shown minimal responses to Nadditions to date. If cumulative N dose is thedetermining factor in pushing these plots tosaturation, it should take roughly three times aslong for the low N plots to show the sameresponse as the high N plots. A comparison ofmeasured nitrate losses from the pine standrevealed that low N plot concentrations in year 9were similar to nitrate concentrations in the highN plot in year 3, supporting the theory thatcumulative dose is important. Because a leachingresponse was not seen until year 8 in the hard-wood high N plot, (a cumulative dose of 120 gm-2), the low N plot may not be affected untilyear 24 of additions. If the intensity of additionsis also important, low N response would occurover even longer periods of time.
ACKNOWLEDGMENTS
This research was funded by the National ScienceFoundation Long-Term Ecological Research Pro-gram and the USDA National Research InitiativeCompetitive Grants Program. Many people havecontributed to the success and longevity of thisproject, including Gloria Quigley, Steve Newman,Richard Bowden, Bill Currie, Joe Hendricks, MattKizlinski, and all the hourly employees of the ForestEcosystem Group at the Complex System ResearchCenter, UNH. Additional thanks goes to Chris Catri-cala and Kathy Newkirk for collection of trace gasdata and Jeff Merriam for DOC and DON analysis.
REFERENCES
Aber JD. 1992. Nitrogen cycling and nitrogen saturation intemperate forest ecosystems. TREE 7(7):220–3.
Aber JD, Nadelhoffer KJ, Steudler P, Melillo JM. 1989. Nitrogensaturation in northern forest ecosystems. Bioscience 39(6):378–86.
Aber JD, Magill AH, Boone R, Melillo JM, Steudler P, Bowden R.1993. Plant and soil responses to chronic nitrogen additions atthe Harvard Forest, Massachusetts. Ecol Appl 3(1):156–66.
Aber JD, Magill A, McNulty SG, Boone RD, Nadelhoffer KJ,Downs M, Hallett R. 1995a. Forest biogeochemistry andprimary production altered by nitrogen saturation. Water AirSoil Pollut 85:1665–70.
Aber JD, Ollinger SV, Federer CA, Reich PB, Goulden ML,Kicklighter DW, Melillo JM, Lathrop RG. 1995b. Predicting theeffects of climate change on water yield and forest productionin the Northeastern U.S. Climate Res 5:207–22.
Aber JD, McDowell W, Nadelhoffer K, Magill A, Berntson G,Kamakea M, McNulty S, Currie W, Rustad L, Fernandez I.1998. Nitrogen saturation in temperate forest ecosystems:hypotheses revisited. Bioscience 48(11):921–34.
Axelsson G, Berg B. 1988. Fixation of ammonium (15N) to Pinussilvestris needle litter in different stages of decomposition.Scand J For Res 3:273–9.
Beier C, Blanck K, Bredemeier M, Lamersdorf N, Rasmussen L,Xu YJ. 1998. Field-scale ‘clean rain’ treatments to two Norwayspruce stands within the EXMAN project—effects on soilsolution chemistry, foliar nutrition and tree growth. For EcolManage 101:111–23
Berntson GM, Aber JD. The importance of fast immobilization ofnitrate immobilization in N saturated temperate forest soils.Soil Biol Biochem. Forthcoming.
Bolster KL, Martin ME, Aber JD. 1996. Interactions betweenprecision and generality in the development of calibrations forthe determination of carbon fraction and nitrogen concentra-tion in foliage by near infrared reflectance. Can J For Res26(4):590–600.
Bowden RD, Melillo JM, Steudler PA, Aber JD. 1990. Annualnitrous oxide fluxes from temperate forest soils in the North-eastern United States. J Geophys Res 95:13997–14005.
Bowden RD, Melillo JM, Steudler PA, Aber JD. 1991. Effects ofnitrogen additions on annual nitrous oxide fluxes from temper-ate forest soils in the Northeastern United States. J GeophysRes 96(D5):9321–8.
Boxman AW, Blanck K, Brandrud T, Emmett BA, Gundersen P,Hogervorst RF, Kjønass OJ, Persson H, Timmermann V. 1998.Vegetation and soil biota response to experimentally-changednitrogen inputs in coniferous forest ecosystems of the NITREXproject. For Ecol Manage 101:65–79.
Castro MS, Steudler P, Melillo JM, Aber JD, Bowden RD. 1995.Factors controlling atmospheric methane consumption bytemperate forest soils. Global Biogeochem Cycles 9:1–10.
Christ M, Zhang Y, Likens GE, Driscoll CT. 1995. Nitrogenretention capacity of a northern hardwood forest soil underammonium sulfate additions. Ecol Appl 5(3):802–12.
Clinton PW, Mead DJ. 1994. Competitions for nitrogen betweenPinus radiata and pasture. I. Recovery of 15N after one growingseason. Can J For Res 24:882–8.
Compton J.E, Boone RD, Motzkin G, Foster DR. 1998. Soilcarbon and nitrogen in a pine-oak sand plain in centralMassachusetts: role of vegetation and land-use history. Oecolo-gia 116(4):536–42.
Covington WW. 1981. Changes in forest floor organic matter andnutrient content following clear cutting in northern hard-woods. Ecology 62(1):41–8.
Currie WS, Aber JD, McDowell WH, Boone RD, Magill AH. 1996.Verticle transport of dissolved organic C and N under long-term N amendments in pine and hardwood forests. Biogeo-chemistry 35:471–505.
Currie WS, Aber JD, Driscoll CT. 1999. Leaching of nutrientcations from the forest floor: effects of nitrogen saturation intwo long-term manipulations. Can J For Res 29:609–20.
Nitrogen Saturation in Temperate Forests 251
Day RW, Quinn GP. 1989. Comparisons of treatments after ananalysis variance in ecology. Ecol Monogr 59:433–6.
Dise NB, Wright RF. 1995. Nitrogen leaching from Europeanforests in relation to nitrogen deposition. For Ecol Manage71:153–61.
Fenn ME, Poth MA, Aber JD, Baron JS, Bormann BT, JohnsonDW, Lemly AD, McNulty SG, Ryan DF, Stottlemyer R. 1998.Nitrogen excess in North American ecosystems: predisposingfactors, ecosystem responses, and management strategies. EcolAppl 8(3):706–33.
Fitter AH, Hay RKM. 1987. Environmental physiology of plants.London: Academic Press.
Flanagan PW, van Cleve K. 1983. Nutrient cycling in relation todecomposition and organic-matter quality in taiga ecosystemsCan J For Res 13(5):795–817.
Foster NW, Nicolson JA, Hazlett PW. 1989. Temporal variation innitrate and nutrient cations in drainage waters from a decidu-ous forest. J Environ Quality 18:238–44.
Gilliam FS, Adams MB, Yurish BM. 1996. Ecosystem nutrientresponses to chronic nitrogen inputs at Fernow ExperimentalForest, West Virginia. Can J For Res 26(2):196–205.
Goulden ML, Munger JW, Fan SM, Daube BC, Wofsy SC. 1996.Exchange of carbon dioxide by a deciduous forest: response tointerannual climate variability. Science 271(5255):1576–8.
Gundersen P. 1998. Effects of enhanced nitrogen deposition in aspruce forest at Klosterhede, Denmark, examined by moderateNH4NO3 addition. For Ecol Manage 101:251–68.
Gundersen P, Callesen I, deVries CW. 1998a. Nitrate leaching inforest ecosystems is related to forest floor CN ratios. EnvironPollut 102:403–7.
Gundersen P, Emmett BA, Kjonaas OJ, Koopmans CJ, Tietema A.1998b. Impact of nitrogen deposition on nitrogen cycling inforests: a synthesis of NITREX data. For Ecol Manage 101:37–55.
Hamburg SP. 1984. Effects of forest growth on soil nitrogen andorganic matter pools following release from subsistence agricul-ture. In: Stone EL, editor. Forest soils and treatment impacts:proceedings of the sixth North American Forest Soils Confer-ence. June 1983. University of Tennessee, Knoxville. p 145–58.
Huntington TG, Ryan DF, Hamburg SP. 1988. Estimating soilnitrogen and carbon pools in a northern hardwood forestecosystem. Soil Sci Soc Am J 52:1162–7.
Johnson CE. 1995. Soil nitrogen status 8 years after clear-cutting.Can J For Res 25:1346–55.
Johnson DW. 1992. Nitrogen retention in forest soils. J EnvironQuality 21:1–12
Knutson RM. 1997. An 18-year study of litterfall and litterdecomposition in a northeast Iowa deciduous forest. Am MidlNat 138:77–83.
Lamersdorf NP, Beier C, Blanck K, Bredemeier M, Cumminc T,Farrell EP, Kreutzer K, Rasmussen L, Ryan M, Weis W, Xu YJ.1998. Effect of drought experiments using roof installations onacidification/nitrification of soils. For Ecol Manage 101:95–101.
Lovett GM, Lindberg SE. 1993. Atmospheric deposition andcanopy interactions of nitrogen in forests. Can J For Res23:1603–16.
Magill AH, Aber JD. 1998. Long-term effects of experimentalnitrogen additions on foliar litter decay and humus formation.Plant Soil 203:301–11.
Magill AH, Downs MR, Nadelhoffer KJ, Hallett RA, Aber JD.1996. Forest ecosystem response to four years of chronicnitrate and sulfate additions at Bear Brooks Watershed, Maine,USA. For Ecol Manage 84:29–37.
Magill AH, Aber JD, Hendricks JJ, Bowden RD, Steudler PA,Melillo JM. 1997. Biogeochemical response of forest ecosys-tems to simulated chronic nitrogen deposition. Ecol Appl7(2):402–15.
McDowell WH, Currie WS, Aber JD, Yano Y. 1998. Effects ofchronic nitrogen amendments on production of dissolvedorganic carbon in forest soils. Water Air Soil Pollut 105:175–82.
McLellan TM, Martin ME, Aber JD, Melillo JM, Nadelhoffer KJ,Dewey B. 1991. Comparison of wet chemistry and nearinfrared reflectance measurements of carbon-fraction chemis-try and nitrogen concentration of forest foliage. Can J For Res21(11):1689–93.
McNulty SG, Aber JD, Newman SD. 1996. Nitrogen saturation ina high elevation spruce-fir stand. For Ecol Manage 84:109–21.
Merriam J, McDowell WH, Currie WS. 1996. A high-tempera-ture catalytic oxidation technique for determining total dis-solved nitrogen. Soil Sci Soc Am J 60(4):1050–5.
Minocha R, Long S, Magill AH, Aber JD, McDowell WH.Submitted. Foliar free polyamine and inorganic ion content inrelation to soil and soil solution chemistry in two fertilizedforest stands at the Harvard Forest, Massachusetts. Plant Soil.
Nadelhoffer KJ, Aber JD, Melillo JM. 1983. Leaflitter productionand soil organic matter dynamics along a nitrogen mineraliza-tion gradient in Southern Wisconsin (USA). Can J For Res13:12–21.
Nadelhoffer KJ, Aber JD, Melillo JM. 1985. Fine roots, netprimary production and soil nitrogen availability: a newhypothesis. Ecology 66(4):1377–90.
Nadelhoffer KJ, Downs MR, Fry B. 1999a. Sinks for N additionsto an oak forest and a red pine plantation at the Harvard Forest,Massachusetts, USA. Ecol Appl 9:72–86.
Nadelhoffer KJ, Downs MR, Fry B, Magill AH, Aber JD. 1999b.Controls on N retention and exports in a fertilized forestedwatershed. Environ Monitor Assess 55:187–210.
Nihlgard B. 1985. The ammonium hypothesis—an additionalexplanation to the forest dieback in Europe. Ambio 14:2–8.
Nohrstedt HO, Arnebrant K, Baath E, Soderstrom B. 1989.Changes in carbon content, respiration rate, ATP content, andmicrobial biomass in nitrogen-fertilized pine forest soils inSweden. Can J For Res 19(3):323–8.
Nommik H. 1970. Non-exchangeable binding of ammonium andamino nitrogen by Norway spruce raw humus. Plant Soil33:581–95.
Norton SA, Fernandez IJ. 1999. The bear brook watershed inMaine: a paired watershed experiment—the first decade (1987–1997). Dordrecht, The Netherlands: Kluwer Academic Publish-ers.
Ollinger SV, Aber JD, Lovett GM, Millham SE, Lathrop RG, EllisJM. 1993. A spatial model of atmospheric deposition for thenortheastern U.S. Ecol Appl 3(3):459–72.
Pastor J, Aber JD, Melillo JM. 1983. Biomass predictions usinggeneralized allometric regressions for some Northeast treespecies. For Ecol Manage 7:265–74.
Pastor J, Aber JD, McClaugherty CA, Melillo JM. 1984. Above-ground production and N and P cycling along a nitrogenmineralization gradient on Blackhawk Island, Wisconsin. Ecol-ogy 65:256–68.
252 A. H. Magill and others
Persson H, Ahlstrom K, Clemensson-Lindell A. 1998. Nitrogenaddition and removal at Gardsjon—effects on fine-root growthand fine-root chemistry. For Ecol Manage 101:199–205.
Peterjohn WT, Adams MB, Gilliam FS. 1996. Symptoms ofnitrogen saturation in two central Appalachian hardwoodforest ecosystems. Biogeochemistry 35:507–22.
Qualls RG, Haines BL. 1991. Geochemistry of dissolved organicnutrients in water percolating through a forest ecosystem. SoilSci Soc Am J 55(4):1112–23.
Reuss JO, Johnson DW. 1986. Acid deposition and the acidifica-tion of soils and water. New York: Springer-Verlag.
Schimel JP, Firestone MK. 1989. Inorganic N incorporation byconiferous forest floor material. Soil Biol Biochem 21(1):41–6.
Schulze ED. 1989. Air pollution and forest decline in a spruce(picea abies) forest. Science 244:776–83.
Sen S, Chalk PM. 1995. Biological interactions between soilnitrogen and alkaline-hydrolysing nitrogen fertilizers. BiolFertil Soils 20:41–8.
Soderstrom B, Baath E, Lundgren B. 1983. Decrease in soilmicrobial activity and biomass owing to nitrogen amendments.Can J Microb 29:1500–6.
Stoddard JL. 1994. Long-term changes in watershed retention ofnitrogen: its causes and consequences. In: Baker LA, editor.Environmental chemistry of lakes and reservoirs. Washington,DC: American Chemical Society. p 223–8.
Tietema A, Bouten W, Wartenbergh PE. 1991. Nitrous oxidedynamics in an oak-beech forest ecosystem in the Netherlands.For Ecol Manage 44:53–61.
Tietema A, Emmett BA, Gundersen P, Kjønaas OJ, Koopmans CJ.1998. The fate of 15N labelled nitrogen deposition in coniferousforest ecosystems. For Ecol Manage 101:19–27.
Ulrich B. 1983. A concept of forest ecosystem stability and aciddeposition as a driving force for destabilization In: Ulrich B,Pankrath J, editors. Effect of accumulation of air pollution onforest ecosystems. Dodrecht, The Netherlands: D. Reidel. p1–29.
van Breemen N, Driscoll CT, Mulder J. 1984. Acidic depositionand internal proton sources in acidification of soils and water.Nature 307:599–604.
Van Cleve K, Martin S. 1991. Long term ecological research in theUnited States. Seattle, WA: Long Term Ecological ResearchNetwork Office, University of Washington. 178 p.
Velleman PF. 1994. Data desk statistics guide. Vol. 2. Ithaca, NY:Data Description Inc.
Wessman CA, Aber JD, Peterson DL, Melillo JM. 1988. Remotesensing of canopy chemistry and nitrogen cycling in temperateforest ecosystems. Nature 335(6186):154–6.
Wright RF, Rasmussen L. 1998. Introduction to the NITREX andEXMAN projects. For Ecol Manage 101:1–7.
Wright RF, van Breemen N. 1995. The NITREX project: anintroduction. For Ecol Manage 71:1–5.
Yano Y, McDowell WH, Kinner NE. 1998. Quantification ofbiodegradable dissolved organic carbon in soil solution withflow-through bioreactors. Soil Sci Soc Am J 62(6):1556–64.
Nitrogen Saturation in Temperate Forests 253