long-term observations of the background aerosol at the
TRANSCRIPT
Long-term observations of the background aerosol at the Cabauw,The NetherlandsD. Mamali1, J. Mikkilä2, B. Henzing3, R. Spoor4, M. Ehn2, T. Petäjä2, H. Russchenberg1, andG. Biskos1,5
1Faculty of Civil Engineering and Geosciences, Delft University of Technology, Delft 2628 CN, The Netherlands2Department of Physics, University of Helsinki, P.O. Box 64, 00014 Helsinki, Finland3Netherlands Organisation for Applied Scientific Research TNO, Princetonlaan 6, 3508 TA Utrecht, The Netherlands4National Institute of Public Health and the Environment RIVM, 3720 BA Bilthoven - The Netherlands5Energy Environment and Water Research Center, The Cyprus Institute, Nicosia 2121, Cyprus
Correspondence to: D. Mamali ([email protected]), G.Biskos ([email protected])
Abstract. Long-term measurements of PM2.5 mass concentrations and aerosol particle size distributions from 2008 to 2015,
as well as hygroscopicity measurements conducted over one year (2008-2009) at Cabauw, The Netherlands, are compiled here
in order to provide a comprehensive dataset for understanding the trends and annual variabilities of the atmospheric aerosol in
the region. PM2.5 concentrations have a mean value of 14.4 µg m−3 with standard deviation 2.1 µg m−3, and exhibit an overall
decreasing trend of −0.74 µg m−3 year−1. The highest values are observed in winter and spring and are associated with a5
shallower boundary layer and lower precipitation, respectively, compared to the rest of the seasons. The number concentration
of the particles smaller than 500 nm has a mean of 9.2×10³ particles cm−3 and standard deviation 4.9×10³ particles cm−3
and shows an increasing trend between 2008 and 2011 while it decreases from 2013 to 2015. It exhibits highest concentrations
in spring and summer, despite the increased precipitation, due to the high occurrence of nucleation-mode particles, which most
likely are formed elsewhere and are transported to the observation station. Particle hygroscopicity measurements show that,10
independently of the air mass origin, the particles are mostly externally mixed with the more hydrophobic mode having a mean
hygroscopic parameter κ of 0.1 while for the more hydrophilic mode κ is 0.35. The hygroscopicity of the smaller particles
investigated (i.e., particles having diameters of 35 nm) appears to increase during the course of the nucleation events, reflecting
a change in the chemical composition of the particles.
1 Introduction15
Epidemiological and medical studies have established that Particulate Matter (PM) pollution has a strong impact on human
health (e.g., US-EPA 2004; Pope and Dockery 2006; Baccarelli et al. 2016), with elevated ambient PM2.5 concentrations being
associated with adverse respiratory effects to chronically ill patients and increased mortality rates for people with respiratory
problems (Wichmann and Peters, 2000). In addition, fine particles (i.e., particles with diameters below 1 µm), and especially
their smallest fraction that can penetrate deeper in the respiratory tract and reach the alveoli (Asgharian et al., 2014), can enter20
the blood recirculation system and cause cardiovascular deceases (Zlotkowska, 2015). Model studies have shown that PM2.5
1
concentrations correlate well with morbidity and mortality, causing ca. 3.3 million premature deaths annually around the globe
(e.g., Lelieveld et al., 2015).
Apart from being related to adverse health effects, airborne particles emitted from natural and anthropogenic sources can
affect the climate of our planet at local, regional and global scales. Air-suspended particles affect climate in a direct way by
absorbing and scattering incoming solar radiation (Ramanathan et al., 2001), and indirectly by acting as cloud condensation and5
ice nuclei (CCN and IN, respectively; Lohmann and Feichter, 2005). Both effects result in an overall cooling of the Earth and
together can contribute to a forcing of the order of -1 W/m2 at the top of the atmosphere with an estimated uncertainty of the
order of 100% (Solomon, 2007). This high uncertainty results from the high spatial and temporal variability of the atmospheric
aerosol as well as from the poor understanding of key physicochemical transformations that the aerosol particles undergo during
their lifetime. To better understand their role on climate, and thus to improve the predictability of atmospheric-climate models,10
we need long-term measurements of the aerosol properties. Apart from the concentration (by mass and number) of airborne
particles, information on the temporal variability of their size and chemical composition is highly required for understanding
the processes they are involved in.
The Cabauw Experimental Site for Atmospheric Research (CESAR) in The Netherlands is one of oldest stations for atmo-
spheric observations in Europe and one of the core observatories in the global network. CESAR is one of the few observatories15
where characterization of the atmosphere from the ground up to the top of the atmosphere is taking place by combining in situ
sensors installed on the ground and along a 213-m tower, as well as ground-based remote sensing instruments for measuring
radiation, wind, turbulence, trace gases, aerosols, and clouds at higher altitudes. Continuous long-term in-situ measurements
of the mass concentrations and the number size distributions of atmospheric particles are performed at CESAR since more
than a decade. In addition, measurements related to the atmospheric state and various atmosphere-land surface interactions for20
supporting climate modeling are carried out at CESAR using both in-situ and remote sensing techniques (Russchenberg et al.,
2005).
Here we report PM2.5 mass concentration and aerosol size distribution measurements conducted at Cabauw from 2008 to
2015, and analyze their trends and seasonal variability. In addition, we provide aerosol hygroscopicity measurements that took
place over almost one year (10 months), and link them with the patterns observed in the recorded size distributions. The rest of25
the paper is organized as follows: Section 2 describes the instrumentation used for the measurements. Section 3 discusses the
measurements, including the inter-annual and seasonal variations of PM2.5 concentrations and the particle number distributions,
as well as the seasonality in particle hygroscopicity. Finally Section 4 summarizes the most important conclusions.
2 Instrumentation and Methods
2.1 The Cabauw Experimental Site for Atmospheric Research (CESAR)30
CESAR is a rural site in a region that is one of the most populated areas in Europe (Gallego, 2010). The station, located 50
km away from the coast, is surrounded by grassland and agricultural pastures, and is influenced by maritime and continental
environments. The terrain in the region is flat, varying from -3 to 5 m a.s.l. within a radius of 45 km. Figure 1 shows the
2

location of the station and the frequency of the different wind directions based on measurements recorded between 2008 and
2015 at the tower of the station (cf. Fig. S1 for the wind rose diagrams of each year). The site most often receives continental
air masses from Southern Europe (40%), with the predominant wind directions being Southwestern (SW), advecting polluted
air masses that pass over the neighboring city of Rotterdam. Clean air masses are associated with Northern (N) air originating
from the North Sea or Scandinavia only if they do not follow trajectories over Amsterdam and Utrecht; i.e., the other two5
major neighboring cities to CESAR. Considering that the site mostly receives air masses passing over close-by cities and a
dense highway grid located within a radius of 45 km, the station is representative of the wider region.
Atlantic & the UK (22%)
Scandinavia (12%)Scandinavia (12%)
Atlantic & the UK (22%)
North Sea (10%)North Sea (10%)
Figure 1. Location of the CESAR and annual relative frequency of the wind directions observed at the site during the study period.
2.2 Instrumentation
A low-volume sampler operated at a flow rate of 2.3 m3 h−1 and equipped with a PM2.5 sampling head (complying with the
EN 12341 standards) was deployed to measure the mass concentration of particles smaller than 2.5 µm on quartz filters (What-10
man QM-A). All PM2.5 measurements were performed by the Dutch National Institute of Public Health and the Environment
(RIVM) at the Cabauw Wielsekade station (500 m away from the tower) where air was sampled at a height of 4 m a.s.l.. The
samples were collected every 24 hours, and the mass of the particles deposited on the filters was determined gravimetrically
(e.g., Triantafyllou et al., 2016). All the filters were conditioned at 20 ± 1 ◦C and 50 ± 5% RH for at least 48 hours before
weighing (CEN, 2005). PM2.5 measurements were performed on a daily basis during the 2009 and 2015, while for the rest of15
the years investigated in this work data were available every second day. During days without PM2.5 measurements, the quartz
filters were replaced by teflon or tissuquartz filters used for metal Elemental or Organic Carbon analysis, respectively.
3

A Scanning Mobility Particle Sizer (SMPS; TSI Model 3034) was used to measure the size distributions of the particles
having diameters in the range 9.37 - 516 nm. The SMPS consisted of an impactor, a charger, a Differential Mobility Analyzer
(DMA) and a Condensation Particle Counter (CPC). Inversion of the collected data was performed with the algorithm described
by Wiedensohler et al. (2012). Although the SMPS data used for this analysis cover the period from 2008 to 2015, the data
from January to December 2012 were discarded due to high noise levels.5
A Hygroscopic Tandem DMA (HTDMA) system was deployed in the framework of the EUCAARI IMPACT campaign
to determine the hygroscopicity of the particles observed from May 2008 to February 2009 at CESAR. In brief, the system
consists of two DMAs (cf. Winklmayr et al. 1991, for details) and a CPC (TSI Model 3772; Stolzenburg and McMurry,
1991). To reduce the humidity below 20% and comply with the EUSAAR standards (Duplissy et al., 2009), a custom-made
Nafion drying system was used upstream the HTDMA, in addition to the sample drying system of the station. In the HTDMA,10
the polydisperse aerosol sample was first charge neutralized (by passing through a 85Kr-source aerosol neutralizer) and then
passed through the first DMA that selected particles of specific dry sizes (35, 50, 75, 110 and 165 nm) before being exposed
at a constant RH of 90% in the humidifier of the system. The size distribution of the humidified particles was measured by the
second DMA and a CPC. Both DMAs used sheath flows in closed loops (Jokinen and Mäkelä, 1997), whereas the measurement
time for each particle size was 5 min. Values of the hygroscopic parameter κ, which are discussed in the following section,15
were determined by the HTDMA measurements (see, e.g., Bougiatioti et al., 2016).
Both the SMPS and the HTDMA sampled air at 60 m a.s.l. through a specially-designed inlet system that consisted of four
parts: (a) 4 PM10 inlets, (b) a Nafion-tube system that dried the aerosol stream to relative humidity values (RH) below 40%,
(c) a 60-m stainless steel pipe and (d) a manifold that split the flow to the instrument suite (Zieger et al., 2011). The total flow
through the 60-m long inlet pipe was maintained at about 60 l min−1, which was the highest flow warranting laminar flow20
(Re≈ 2000), from which the SMPS and the HTDMA were sampling at a flow rate of 1 l min−1 each. For the SMPS data,
corrections were applied to account for the diffusional losses of the particles on the walls of the 60-m sampling line (Henzing,
2011).
Meteorological measurements of wind direction, wind speed, temperature and relative humidity (cf. Table S1) at 40 m
altitude were used in the analysis. In addition, back-trajectories of the air masses arriving at the station were calculated by the25
NOAA HYSPLIT model (Draxler and Hess, 1998; Draxler and Rolph, 2003).
3 Results and Discussion
3.1 Particle Mass and Number Concentrations
3.1.1 PM2.5 Intra-annual Variation
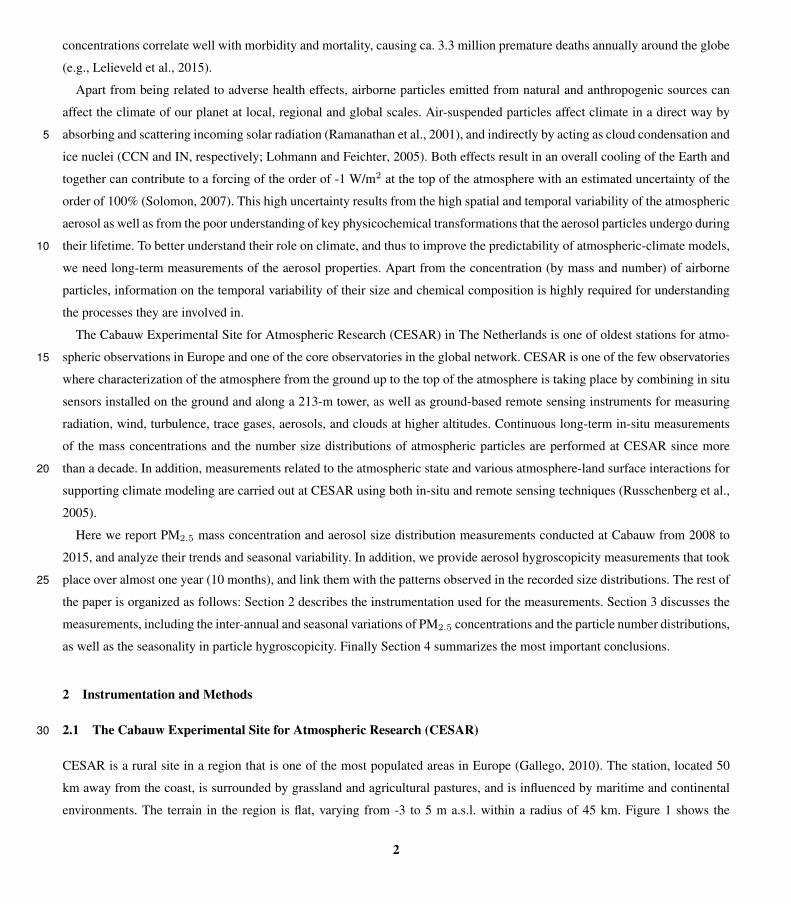
Fig. 2 shows PM2.5 daily concentrations measured at Cabauw from January 2008 to December 2015. The measurements30
exhibit an overall decreasing trend with a slope of −0.74 µg m−3 year−1, calculated based on the yearly mean values. This
trend is partly (28%) due to the absence of extreme mass concentrations of PM2.5 > 50 µg m−3 from 2011 onwards, which are
4
more frequent under Eastern winds (cf. Figure 3; left figure). Analysis excluding these extreme values still showed a negative
trend with a slope of −0.54 µg m−3 year−1, suggesting that the overall decrease is mainly attributed to the reduction of the
background aerosol concentration. Despite the decreasing trend, all the yearly averages (cf. Table S2) exceed the annual PM2.5
limit of 10 µg m−3 of the World Health Organization (WHO).
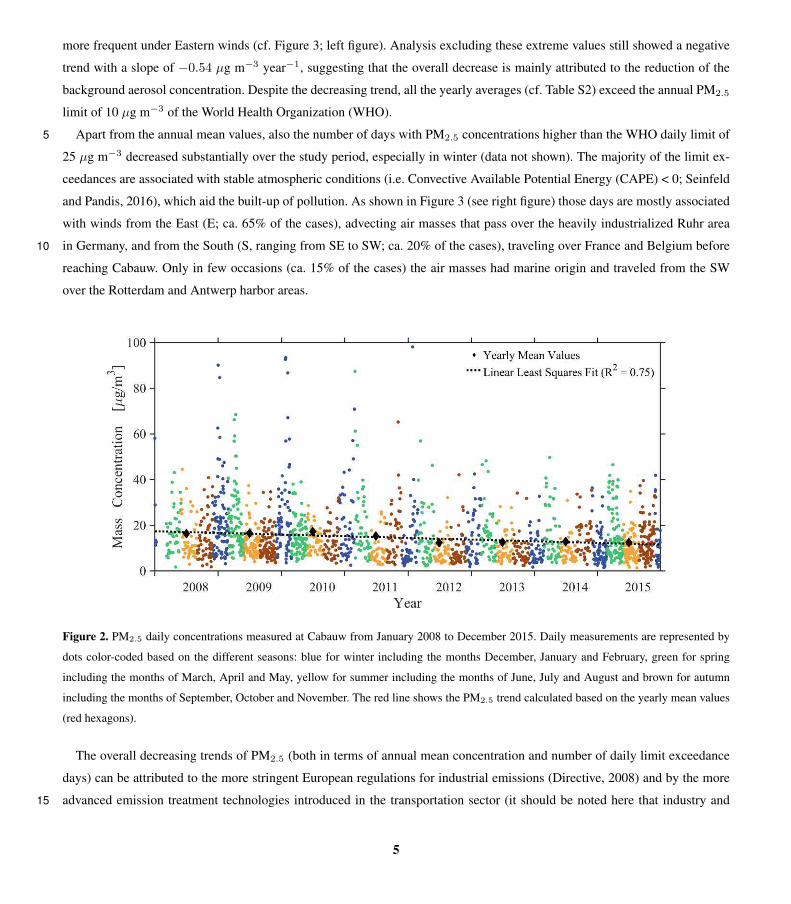
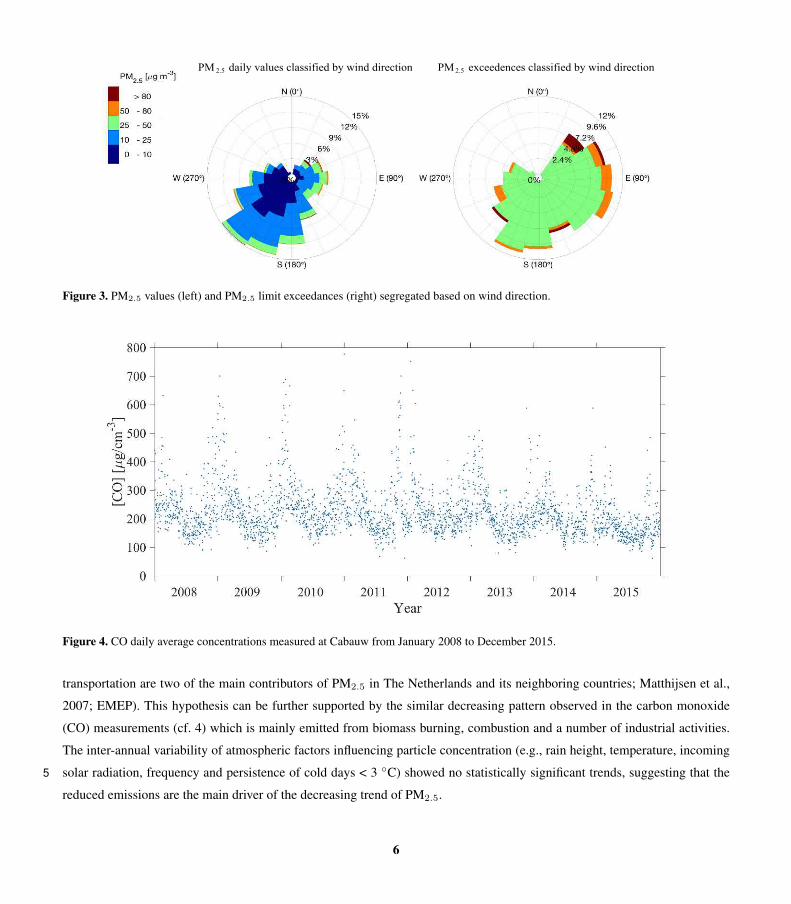
Apart from the annual mean values, also the number of days with PM2.5 concentrations higher than the WHO daily limit of5
25 µg m−3 decreased substantially over the study period, especially in winter (data not shown). The majority of the limit ex-
ceedances are associated with stable atmospheric conditions (i.e. Convective Available Potential Energy (CAPE) < 0; Seinfeld
and Pandis, 2016), which aid the built-up of pollution. As shown in Figure 3 (see right figure) those days are mostly associated
with winds from the East (E; ca. 65% of the cases), advecting air masses that pass over the heavily industrialized Ruhr area
in Germany, and from the South (S, ranging from SE to SW; ca. 20% of the cases), traveling over France and Belgium before10
reaching Cabauw. Only in few occasions (ca. 15% of the cases) the air masses had marine origin and traveled from the SW
over the Rotterdam and Antwerp harbor areas.
Figure 2. PM2.5 daily concentrations measured at Cabauw from January 2008 to December 2015. Daily measurements are represented by
dots color-coded based on the different seasons: blue for winter including the months December, January and February, green for spring
including the months of March, April and May, yellow for summer including the months of June, July and August and brown for autumn
including the months of September, October and November. The red line shows the PM2.5 trend calculated based on the yearly mean values
(red hexagons).
The overall decreasing trends of PM2.5 (both in terms of annual mean concentration and number of daily limit exceedance
days) can be attributed to the more stringent European regulations for industrial emissions (Directive, 2008) and by the more
advanced emission treatment technologies introduced in the transportation sector (it should be noted here that industry and15
5
- 8050 - 8025 - 5010 - 250 - 10
PM daily values classified by wind direction PM exceedences classified by wind direction2.5 2.5
0 - 10
10 - 25 25 - 50 50 - 80
> 80
Figure 3. PM2.5 values (left) and PM2.5 limit exceedances (right) segregated based on wind direction.
Figure 4. CO daily average concentrations measured at Cabauw from January 2008 to December 2015.
transportation are two of the main contributors of PM2.5 in The Netherlands and its neighboring countries; Matthijsen et al.,
2007; EMEP). This hypothesis can be further supported by the similar decreasing pattern observed in the carbon monoxide
(CO) measurements (cf. 4) which is mainly emitted from biomass burning, combustion and a number of industrial activities.
The inter-annual variability of atmospheric factors influencing particle concentration (e.g., rain height, temperature, incoming
solar radiation, frequency and persistence of cold days < 3 ◦C) showed no statistically significant trends, suggesting that the5
reduced emissions are the main driver of the decreasing trend of PM2.5.
6
3.1.2 PM2.5 Seasonal Variation
The highest PM2.5 concentrations throughout the study period were observed in winters and springs, with average values
of 19.0 and 15.0 µg m−3, respectively, whereas the lowest concentrations were observed in summers and autumns, having
respective mean values of 9.1 and 10.8 µg m−3. In general, high emissions from combustion sources (i.e., transportation and
residential heating) in winter and autumn, and from agricultural activities in spring and summer, are the main contributors to5
this seasonal variation (Manders-Groot et al., 2016).
Apart from the local sources, PM2.5 seasonal variability is also affected by the regional meteorological conditions including
the variations in the wind speed that influences horizontal transport, in Boundary Layer Height (BLH) which is related to the
dilution of the pollutants, and in precipitation that is the most important sink of PM pollution. Interestingly, only weak anti-
correlation between wind speed and PM2.5 concentrations (linear Pearson and non-linear Kendall correlation coefficient had10
respective values of RPearson = -0.32 and τKendall = -0.27; Gilbert, 1987; cf. Figure S2) was observed despite the high wind
speeds occurring in The Netherlands, suggesting that vertical dispersion (rather than natural ventilation) is the main process
of dilution. Our analysis showed that the seasonal variability of the BLH influences the PM2.5 concentrations (cf. Supplement
for details) which is in-line with previous studies (Pal et al., 2012, 2014). However, the low BLHs observed during winter
cannot alone justify the higher PM2.5 concentrations (cf. Fig. S3), and thus additional factors certainly contribute towards their15
seasonality. The rainfall height showed an anti-correlation with PM2.5 (RPearson = -0.68, τKendall = -0.51, based on monthly
average values) with the highest PM2.5 concentrations observed in April, which is the driest month of the year (cf. Fig. 5 c).
3.1.3 Particle Number Concentrations
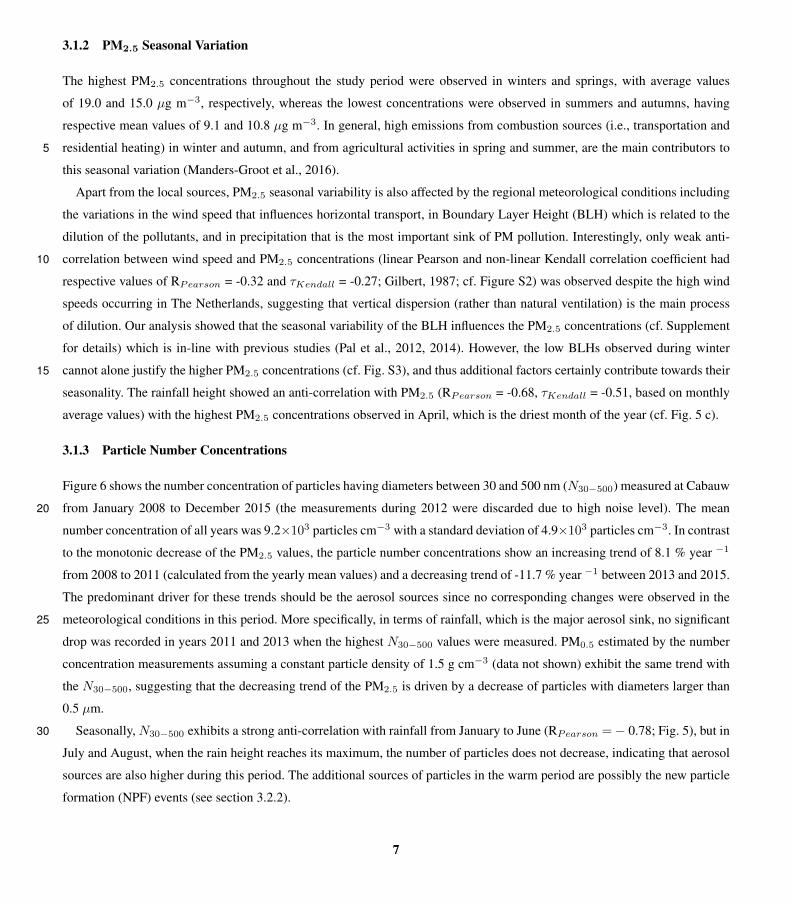
Figure 6 shows the number concentration of particles having diameters between 30 and 500 nm (N30−500) measured at Cabauw
from January 2008 to December 2015 (the measurements during 2012 were discarded due to high noise level). The mean20
number concentration of all years was 9.2×10³ particles cm−3 with a standard deviation of 4.9×10³ particles cm−3. In contrast
to the monotonic decrease of the PM2.5 values, the particle number concentrations show an increasing trend of 8.1 % year −1
from 2008 to 2011 (calculated from the yearly mean values) and a decreasing trend of -11.7 % year −1 between 2013 and 2015.
The predominant driver for these trends should be the aerosol sources since no corresponding changes were observed in the
meteorological conditions in this period. More specifically, in terms of rainfall, which is the major aerosol sink, no significant25
drop was recorded in years 2011 and 2013 when the highest N30−500 values were measured. PM0.5 estimated by the number
concentration measurements assuming a constant particle density of 1.5 g cm−3 (data not shown) exhibit the same trend with
the N30−500, suggesting that the decreasing trend of the PM2.5 is driven by a decrease of particles with diameters larger than
0.5 µm.
Seasonally, N30−500 exhibits a strong anti-correlation with rainfall from January to June (RPearson =− 0.78; Fig. 5), but in30
July and August, when the rain height reaches its maximum, the number of particles does not decrease, indicating that aerosol
sources are also higher during this period. The additional sources of particles in the warm period are possibly the new particle
formation (NPF) events (see section 3.2.2).
7

Jan Feb Mar Apr May Jun Jul Aug Sep Oct Nov Dec
[
]
(a)
(b)
(c)
Rain
Heig
ht [
mm
]
Figure 5. (a) Monthly averages of PM2.5 concentrations from 2008 to 2015. The box plots indicate the median (red line) and the 25% and
75% percentile, whereas the red crosses are the maximum values observed in every month; (b) seasonal variability of N30−500 from 2008
to 2015 (Due to discontinuities of the SMPS data during the entire study period, only the data between January 2008-December 2011 and
January 2013-December 2015, were considered in the analysis), and (c) rainfall height.
8
Yearly MeansLinear Least Squares Fit
2008 2009 2010 2011 2012 2013 2014 2015
Year
Figure 6. N30−500 concentrations measured at Cabauw from January 2008 to December 2015. Daily measurements are represented by dots
color-coded based on the different seasons (winter (DJF) - blue, spring (MAM) - green, summer (JJA) - yellow, autumn (SON) - brown). The
black dotted line shows the PM2.5 trend calculated based on the yearly mean values (black diamonds).
3.2 Aerosol Particle Size Distributions
3.2.1 Diurnal and Seasonal Variation
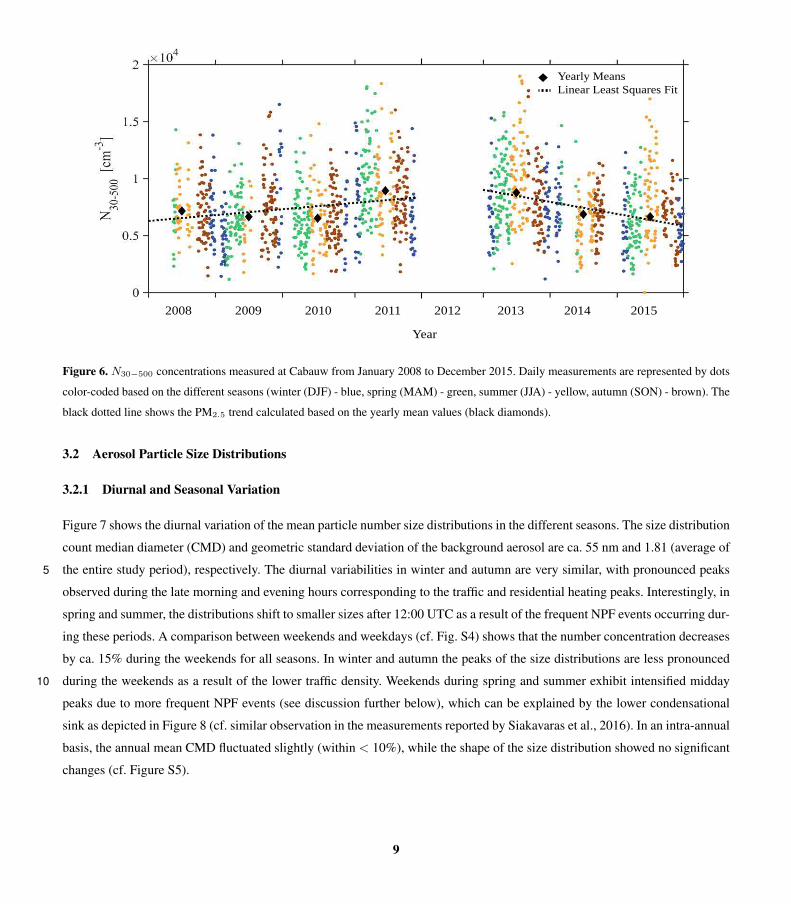
Figure 7 shows the diurnal variation of the mean particle number size distributions in the different seasons. The size distribution
count median diameter (CMD) and geometric standard deviation of the background aerosol are ca. 55 nm and 1.81 (average of
the entire study period), respectively. The diurnal variabilities in winter and autumn are very similar, with pronounced peaks5
observed during the late morning and evening hours corresponding to the traffic and residential heating peaks. Interestingly, in
spring and summer, the distributions shift to smaller sizes after 12:00 UTC as a result of the frequent NPF events occurring dur-
ing these periods. A comparison between weekends and weekdays (cf. Fig. S4) shows that the number concentration decreases
by ca. 15% during the weekends for all seasons. In winter and autumn the peaks of the size distributions are less pronounced
during the weekends as a result of the lower traffic density. Weekends during spring and summer exhibit intensified midday10
peaks due to more frequent NPF events (see discussion further below), which can be explained by the lower condensational
sink as depicted in Figure 8 (cf. similar observation in the measurements reported by Siakavaras et al., 2016). In an intra-annual
basis, the annual mean CMD fluctuated slightly (within < 10%), while the shape of the size distribution showed no significant
changes (cf. Figure S5).
9
Winter Spring
Summer Autumn
dN/dlogDp (cm )
Time of the Day [UTC] Time of the Day [UTC]
[
][
]
[
]
-3
Figure 7. Diurnal variation of the mean number size distributions in the different seasons. The color shading represents the particle concen-
tration.
00:00 06:00 12:00 18:00 24:00[ ]
[
]
Figure 8. Diurnal evolution of the condensational sink in weekdays (error bars correspond to 1 standard deviation).
10

Table 1. Number of new particle formation events recorded each month for the years 2010 and 2011.
Month NPF events (2010) NPF events (2011)
January 0 -
February 0 2
March 2 5
April 5 8
May 9 10
June 13 11
July 6 3
August 2 7
September 2 7
October 3 4
November 2 1
December 2 0
3.2.2 New Particle Formation Events
The particle number size distribution measurements show that numerous NPF events took place during the study period. To
discriminate between an "event-day" and a "non-event" day, we used the procedure described in Dal Maso et al. (2005). In brief,
we first examined the data visually, based on the 24-h (midnight to midnight) contour plots of the size distributions. A day was
characterized as an event-day if the size distribution exhibited a new mode corresponding to particles smaller than 25 nm,5
followed by growth which lasted for several hours; otherwise it was labeled as a "non-event" day. This classification showed
that NPF events occur at Cabauw throughout the year but they are pronounced during spring and summer as has been observed
in climatological studies at different locations in Europe (Birmili et al., 2001; Boulon et al., 2010). Our analysis focused on
measurements from January 2010 to December 2011, when measurements down to 9.6 nm were available. Table 1 summarizes
the number of NPFs for each month. The fraction of the number of "event-days" to the total number of (measurement) days10
was 20% in 2010 and 24% in 2011. All the events took place during daytime between 08:00 and 14:00 UTC, with the majority
being observed under cloud free conditions. These observations are in line with those reported by Manninen et al. (2010),
who investigated nucleation events and the first steps of growth, at many observatories in Europe, including Cabauw, using
ion spectrometer measurements. Back-trajectory analysis (cf. Fig. S6) showed that NPF events are mostly related to marine air
masses from the NW, N, W and SW (80%). These clean air masses having low particle number concentrations, and thus low15
condensational sinks, most often pass over cities (e.g. Amsterdam, Rotterdam) where they get enriched with gaseous pollutants
which act as precursors for NPF. The rest of the events (20%) were recorded when air from the E and SE, that carry polluted
air from Central Europe, reached Cabauw.
11
0 0.1 0.2 0.3 0.4 0.5 0.6 0.7 0.8 0.9 1Normalized Concentration
[ ]
[
][
]
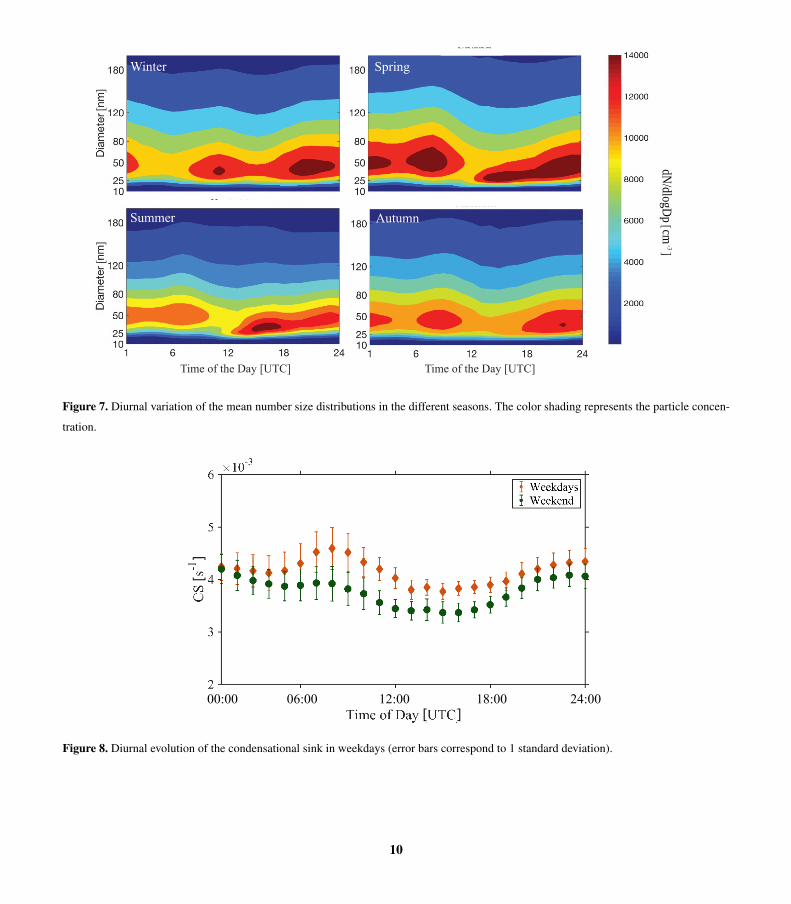
Figure 9. Evolution of the particle size distributions during two consecutive days, (9 and 10 April 2011) with new particle formation events.
The upper panel shows hourly measurements of the aerosol size distribution (normalized by the maximum value), whereas the lower panel
shows the number concentrations of the particles for four size ranges: 9-25 nm, 26-90 nm, 96-516 nm and 9-516 nm (total).
Characteristic NPF events, associated with air masses from the North Sea, are shown in Fig. 9. Solar radiation in the morning
triggers the photochemical formation of new particles which grow to the detectable sizes within ∼3-4 h. A steep increase in
the number concentration of the smaller particles (having diameters up to 25 nm) was observed around 08:00-10:00 UTC. The
small, newly formed particles slowly increase in size reaching that of the background aerosol sizes late at night.
It should be noted here that the smallest particles for which increased concentrations were observed during the events had5
diameters of ca. 11 nm (note that the SMPS can measure from 9.6 nm and higher), suggesting that the fresh particles were
formed elsewhere and were advected to the site. This, however, is valid provided that the sub-11-nm channels of the SMPS do
not underestimate the corresponding particle number concentrations significantly, and that the particles grow slow enough so
that the instrument time resolution allows for capturing their growth.
3.3 Aerosol Particle Hygroscopicity10
The hygroscopicity parameter κ is a measure of the affinity of the aerosol particles to water. Relatively high κ values >1
correspond to the highly hygroscopic inorganic species (e.g. sodium chloride; Petters and Kreidenweis, 2007) while oxidized
organic compounds found in the atmosphere have κ values in the range 0.01-0.3. In the case of multicomponent aerosol
particles κ can be estimated assuming that the total volume of water is equal to the sum of the water associated to the individual
12
ddry = 165 nm
ddry = 165 nm
ddry = 165 nm
ddry = 165 nm
ddry = 35 nm
ddry = 35 nm
ddry = 35 nm
ddry = 35 nm
Time of Day (UTC) Time of Day (UTC)
Win Win
Aut Aut
Spr Spr
Sum Sum
0
0.05
0.1
0.15
0
0.05
0.1
0.15
0
0.05
0.1
0.15
0.2
0
0.05
0.1
0.15
0.2
0
0.05
0.1
0.15
0
0.05
0.1
0.15
0
0.1
0.2
0
0.05
0.1
0.15
0.2
ProbabilityProbability
ProbabilityProbability
[ ][ ]
0
0 6 12 18 24
0 6 12 18 24
0 6 12 18 24
0 6 12 18 24
0 6 12 18 24
0 6 12 18 24
0 6 12 18 24
0 6 12 18 24
.000.00
0.05
0.10
0.15
0.20
0.00
0.05
0.10
0.15
0.00
0.05
0.10
0.15
0.20
0.00
0.05
0.10
0.15
0.00
0.05
0.10
0.15
0.00
0.05
0.10
0.15
0.00
0.10
0.20
0.00
0.05
0.10
0.20
0.15
0.6
0.4
0.2
0.0
0.6
0.4
0.2
0.0
0.6
0.4
0.2
0.0
0.6
0.4
0.2
0.0
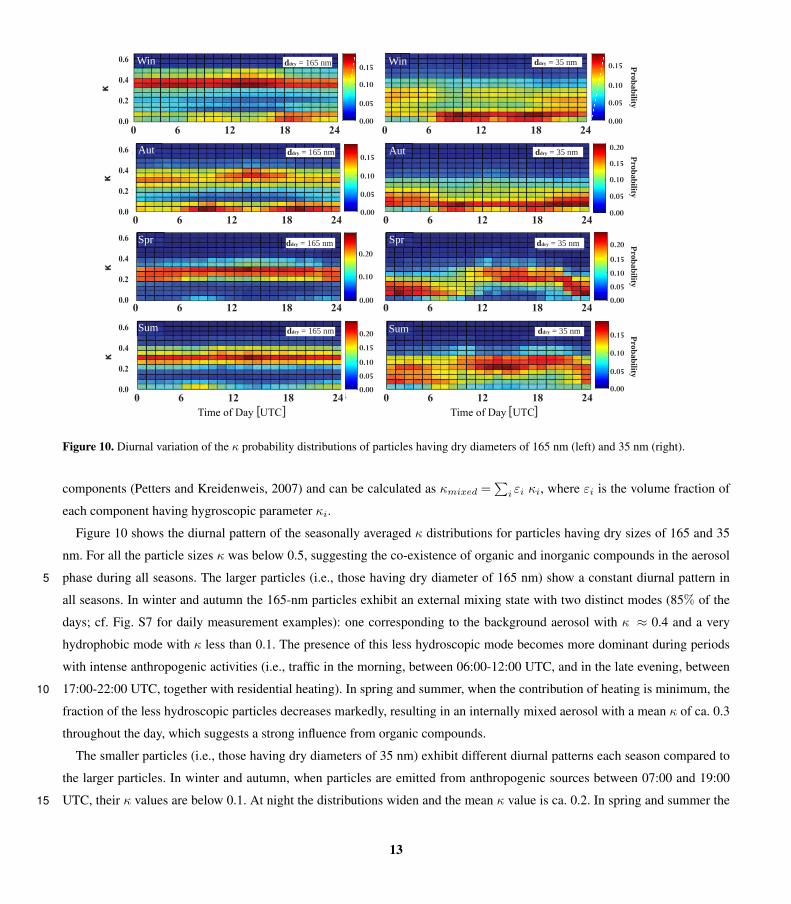
Figure 10. Diurnal variation of the κ probability distributions of particles having dry diameters of 165 nm (left) and 35 nm (right).
components (Petters and Kreidenweis, 2007) and can be calculated as κmixed =∑
i εi κi, where εi is the volume fraction of
each component having hygroscopic parameter κi.
Figure 10 shows the diurnal pattern of the seasonally averaged κ distributions for particles having dry sizes of 165 and 35
nm. For all the particle sizes κ was below 0.5, suggesting the co-existence of organic and inorganic compounds in the aerosol
phase during all seasons. The larger particles (i.e., those having dry diameter of 165 nm) show a constant diurnal pattern in5
all seasons. In winter and autumn the 165-nm particles exhibit an external mixing state with two distinct modes (85% of the
days; cf. Fig. S7 for daily measurement examples): one corresponding to the background aerosol with κ ≈ 0.4 and a very
hydrophobic mode with κ less than 0.1. The presence of this less hydroscopic mode becomes more dominant during periods
with intense anthropogenic activities (i.e., traffic in the morning, between 06:00-12:00 UTC, and in the late evening, between
17:00-22:00 UTC, together with residential heating). In spring and summer, when the contribution of heating is minimum, the10
fraction of the less hydroscopic particles decreases markedly, resulting in an internally mixed aerosol with a mean κ of ca. 0.3
throughout the day, which suggests a strong influence from organic compounds.
The smaller particles (i.e., those having dry diameters of 35 nm) exhibit different diurnal patterns each season compared to
the larger particles. In winter and autumn, when particles are emitted from anthropogenic sources between 07:00 and 19:00
UTC, their κ values are below 0.1. At night the distributions widen and the mean κ value is ca. 0.2. In spring and summer the15
13
0.20
0.16
0.12
0.08
0.04
0.00
Prob
abili
ty
0.0 0.1 0.2 0.3 0.4 0.5 0.6κ κ
D = 35 nm
D = 75 nm
D = 165 nm
dry
dry
dry
0.20
North Sea Central Europe
0.0 0.1 0.2 0.3 0.4 0.5 0.6
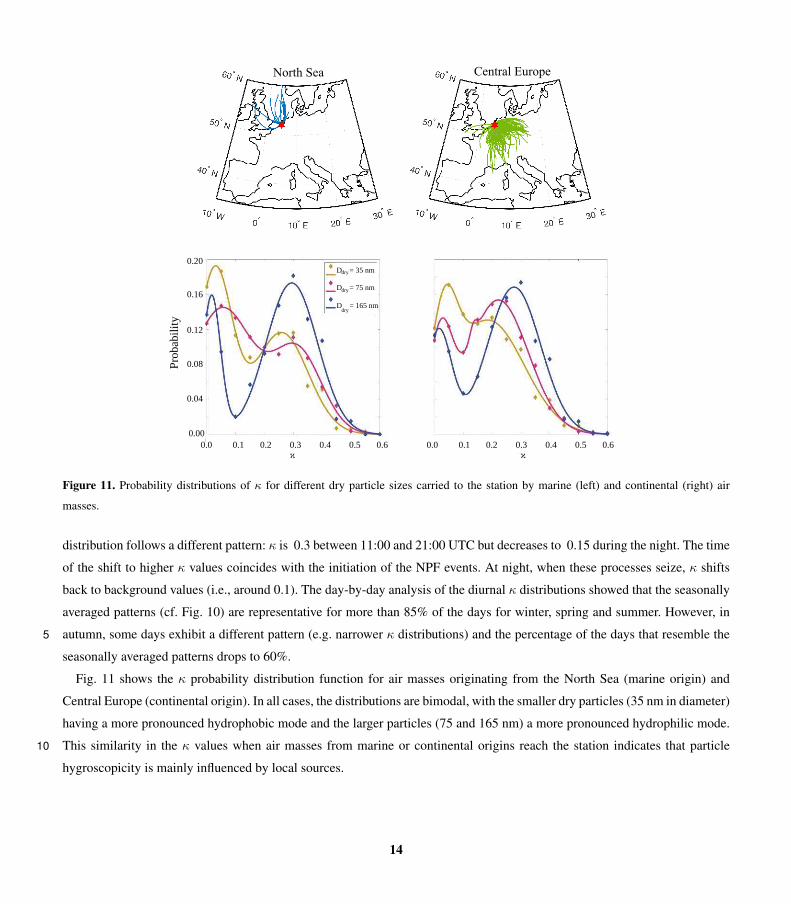
Figure 11. Probability distributions of κ for different dry particle sizes carried to the station by marine (left) and continental (right) air
masses.
distribution follows a different pattern: κ is 0.3 between 11:00 and 21:00 UTC but decreases to 0.15 during the night. The time
of the shift to higher κ values coincides with the initiation of the NPF events. At night, when these processes seize, κ shifts
back to background values (i.e., around 0.1). The day-by-day analysis of the diurnal κ distributions showed that the seasonally
averaged patterns (cf. Fig. 10) are representative for more than 85% of the days for winter, spring and summer. However, in
autumn, some days exhibit a different pattern (e.g. narrower κ distributions) and the percentage of the days that resemble the5
seasonally averaged patterns drops to 60%.
Fig. 11 shows the κ probability distribution function for air masses originating from the North Sea (marine origin) and
Central Europe (continental origin). In all cases, the distributions are bimodal, with the smaller dry particles (35 nm in diameter)
having a more pronounced hydrophobic mode and the larger particles (75 and 165 nm) a more pronounced hydrophilic mode.
This similarity in the κ values when air masses from marine or continental origins reach the station indicates that particle10
hygroscopicity is mainly influenced by local sources.
14
4 Conclusions
In this study we report on a 8-year-long dataset (2008-2015) of aerosol particle mass concentrations (PM2.5) and size distribu-
tions, as well as on a 10-month record of aerosol hygroscopicity at the CESAR site in The Netherlands. The yearly mean PM2.5
concentrations showed a decreasing trend that can be attributed to more stringent regulations to industrial emissions and to the
advanced emission treatment technologies introduced in the transportation sector over the past decade. PM2.5 concentrations5
exhibit a clear seasonal variability which is primarily affected by the higher emissions and to a lesser extent by meteorological
conditions such as the BLH and precipitation.
In contrast to the PM2.5, the number concentration of particles having diameters in the range 30-500 nm showed an increasing
trend between 2008 and 2011 and an opposite trend from 2013 to 2015, with N30−500 values in 2015 being at the same level
with those in 2008, raising questions on whether air quality actually improves as the PM2.5 measurements suggest. Seasonally,10
N30−500 was higher in spring and summer mostly due to the production of new particles by nucleation. The diurnal variation of
the number concentration in winter and autumn shows pronounced peaks in the late morning and evening hours corresponding
to the traffic and residential heating peaks. The measurements also show a shift towards smaller particle sizes in spring and
summer, supporting that the particle number concentrations during these seasons are strongly influenced by the NPF events.
The hygroscopic parameter κ, for all sizes measured in this work suggest the presence of organics in the particle phase. The15
freshly emitted smaller particles (35 nm) are most often externally mixed compared to the chemically aged larger particles (165
nm). The diurnal patterns of the seasonally averaged κ distributions of the larger particles showed constant values throughout
the day while the smaller particles exhibited diurnal variations. The 165-nm particles are mostly internally mixed in spring
and summer whereas in autumn and winter the κ distributions are bimodal with the more hydrophobic peak being temporarily
associated to traffic and residential heating. The smaller particles are externally mixed during all seasons and are also influenced20
by anthropogenic activities in the cold season as suggested be the reduced κ values during the day. In spring and summer, new
particles formation events and photochemical aging are affecting the κ distribution, which is shifted to higher values during
the day. Air masses of different origins (continental and marine) exhibit similar κ distributions for all sizes signifying the
dominance of the local sources to particles hygroscopicity.
Data availability. 1. Meteorological data can be obtained from the CESAR database http://www.cesar-database.nl25
2. The SMPS data for the Cabauw station (Zijdeweg) are available at www.ebas.nilu.no
3. The PM2.5 for the Cabauw station (Wielsekade) data were provided from National Institute for Public Health and the Environment
(RIVM; contact person Rob Zwartjes [email protected])
4. The CAPE maps were obtained from www1.wetter3.de
Competing interests. The authors declare that they have no competing interests.30
15

Acknowledgements. We extend special appreciation to Mr. Rob Zwartjes of Rijksinstituut voor Volksgezondheid en Milieu (RIVM) for
providing useful information about the PM measurements, to Mrs. Ann-Mari Fjæraa of the Norwegian Institute for Air Research (NILU)
for providing level 0 SMPS data for quality check, to Dr. Ari Asmi and Prof. Dr. Alfred Wiedensohler for providing valuable information
regarding the SMPS measurements.
16

References
CEN 14907 Ambient air quality; Standard gravimetric measurement method for the determination of the PM2.5 mass fraction of suspended
particulate matter., 2005.
Asgharian, B., Price, O., Oldham, M., Chen, L.-C., Saunders, E., Gordon, T., Mikheev, V., Minard, K., and Teeguarden, J.: Computational
modeling of nanoscale and microscale particle deposition, retention and dosimetry in the mouse respiratory tract, Inhalation toxicology,5
26, 829–842, 2014.
Baccarelli, A. A., Hales, N., Burnett, R. T., Jerrett, M., Mix, C., Dockery, D. W., and Pope III, C. A.: Particulate air pollution, exceptional
aging, and rates of centenarians: A nationwide analysis of the United States, 1980–2010, Environmental health perspectives, 124, 1744,
2016.
Birmili, W., Wiedensohler, A., Heintzenberg, J., and Lehmann, K.: Atmospheric particle number size distribution in central Europe- Statistical10
relations to air masses and meteorology, Journal of Geophysical Research. D. Atmospheres, 106, 32, 2001.
Bougiatioti, A., Bezantakos, S., Stavroulas, I., Kalivitis, N., Kokkalis, P., Biskos, G., Mihalopoulos, N., Papayannis, A., and Nenes, A.:
Biomass-burning impact on CCN number, hygroscopicity and cloud formation during summertime in the eastern Mediterranean, Atmo-
spheric Chemistry and Physics, 16, 7389–7409, doi:10.5194/acp-16-7389-2016, https://www.atmos-chem-phys.net/16/7389/2016/, 2016.
Boulon, J., Sellegri, K., Venzac, H., Picard, D., Weingartner, E., Wehrle, G., Collaud Coen, M., Bütikofer, R., Flückiger, E., Baltensperger,15
U., et al.: New particle formation and ultrafine charged aerosol climatology at a high altitude site in the Alps (Jungfraujoch, 3580 m asl,
Switzerland), Atmospheric Chemistry and Physics, 10, 9333–9349, 2010.
Dal Maso, M., Kulmala, M., Riipinen, I., Wagner, R., Hussein, T., Aalto, P. P., and Lehtinen, K. E.: Formation and growth of fresh atmospheric
aerosols: eight years of aerosol size distribution data from SMEAR II, Hyytiala, Finland, Boreal Environment Research, 10, 323, 2005.
Directive: 2008/1/EC of the European Parliament and of the Council of 21 December 2007 on industrial emissions (integrated pollution20
prevention and control)., 2008.
Draxler, R. R. and Hess, G.: An overview of the HYSPLIT_4 modelling system for trajectories, Australian meteorological magazine, 47,
295–308, 1998.
Draxler, R. R. and Rolph, G.: HYSPLIT (HYbrid Single-Particle Lagrangian Integrated Trajectory) model access via NOAA ARL READY
website (http://www. arl. noaa. gov/ready/hysplit4. html). NOAA Air Resources Laboratory, Silver Spring, 2003.25
Duplissy, J., Gysel, M., Sjogren, S., Meyer, N., Good, N., Kammermann, L., Michaud, V., Weigel, R., dos Santos, S. M., Gruening, C., et al.:
Intercomparison study of six HTDMAs: results and recommendations, Atmospheric Measurement Techniques, 2009.
EMEP: EMEP/CEIP 2014 Present state of emission data, http://www.ceip.at/webdab_emepdatabase/reported_emissiondata/.
EN 12341, C. A.: Determination of the PM10 fraction of suspended particulate matter–Reference method and field test procedure to demon-
strate reference equivalence of measurement methods, European Committee for Standardization (European Standard EN 12341), Brussels,30
1998.
Gallego, F. J.: A population density grid of the European Union, Population and Environment, 31, 460–473, 2010.
Gilbert, R. O.: Statistical methods for environmental pollution monitoring, John Wiley & Sons, 1987.
Henzing, J.: Interactive comment on: "Number size distributions and seasonality of submicron particles in Europe 2008–2009" by A. Asmi
et al, Atmos. Chem. Phys. Discuss, 11, C3137–C3142, 2011.35
Jokinen, V. and Mäkelä, J. M.: Closed-loop arrangement with critical orifice for DMA sheath/excess flow system, Journal of Aerosol Science,
28, 643–648, 1997.
17
Lelieveld, J., Evans, J., Fnais, M., Giannadaki, D., and Pozzer, A.: The contribution of outdoor air pollution sources to premature mortality
on a global scale, Nature, 525, 367–371, 2015.
Lohmann, U. and Feichter, J.: Global indirect aerosol effects: a review, Atmospheric Chemistry and Physics, 5, 715–737, 2005.
Manders-Groot, A., Segers, A., Jonkers, S., Schaap, M., Timmermans, R., Hendriks, C., Sauter, R., Wichink Kruit, van der Swaluw, E.,
Eskes, H., et al.: LOTOS-EUROS v2. 0 Reference Guide, 2016.5
Manninen, H., Nieminen, T., Asmi, E., Gagné, S., Häkkinen, S., Lehtipalo, K., Aalto, P., Vana, M., Mirme, A., Mirme, S., et al.: EUCAARI
ion spectrometer measurements at 12 European sites–analysis of new particle formation events, Atmospheric Chemistry and Physics, 10,
7907–7927, 2010.
Matthijsen, J., Brink, H. M., Abels, M., and Frink, C.: PM2. 5 in the Netherlands: Consequences of the New European Air Quality Standards,
Netherlands Environmental Assessment Agency, 2007.10
Pal, S., Xueref-Remy, I., Ammoura, L., Chazette, P., Gibert, F., Royer, P., Dieudonné, E., Dupont, J.-C., Haeffelin, M., Lac, C.,
Lopez, M., Morille, Y., and Ravetta, F.: Spatio-temporal variability of the atmospheric boundary layer depth over the Paris
agglomeration: An assessment of the impact of the urban heat island intensity, Atmospheric Environment, 63, 261 – 275,
doi:https://doi.org/10.1016/j.atmosenv.2012.09.046, http://www.sciencedirect.com/science/article/pii/S135223101200917X, 2012.
Pal, S., Lee, T., Phelps, S., and Wekker, S. D.: Impact of atmospheric boundary layer depth variability and wind rever-15
sal on the diurnal variability of aerosol concentration at a valley site, Science of The Total Environment, 496, 424 – 434,
doi:https://doi.org/10.1016/j.scitotenv.2014.07.067, http://www.sciencedirect.com/science/article/pii/S0048969714010973, 2014.
Petters, M. and Kreidenweis, S.: A single parameter representation of hygroscopic growth and cloud condensation nucleus activity, Atmo-
spheric Chemistry and Physics, 7, 1961–1971, 2007.
Pope, I. C. A. and Dockery, D. W.: Health effects of fine particulate air pollution: lines that connect, Journal of the air & waste management20
association, 56, 709–742, 2006.
Ramanathan, V., Crutzen, P., Kiehl, J., and Rosenfeld, D.: Aerosols, climate, and the hydrological cycle, science, 294, 2119–2124, 2001.
Russchenberg, H., Bosveld, F., Swart, D., ten Brink, H., de Leeuw, G., Uijlenhoet, R., Arbesser-Rastburg, B., van der Marel, H., Ligthart, L.,
Boers, R., et al.: Ground-based atmospheric remote sensing in the Netherlands: European outlook, IEICE Transactions on Communica-
tions, 88, 2252–2258, 2005.25
Seinfeld, J. H. and Pandis, S. N.: Atmospheric chemistry and physics: from air pollution to climate change, John Wiley & Sons, 2016.
Siakavaras, D., Samara, C., Petrakakis, M., and Biskos, G.: Nucleation events at a coastal city during the warm period: Kerbside versus urban
background measurements, Atmospheric Environment, 140, 60–68, 2016.
Solomon, S.: Climate change 2007-the physical science basis: Working group I contribution to the fourth assessment report of the IPCC,
vol. 4, Cambridge University Press, 2007.30
Stolzenburg, M. R. and McMurry, P. H.: An ultrafine aerosol condensation nucleus counter, Aerosol Science and Technology, 14, 48–65,
1991.
Triantafyllou, E., Diapouli, E., Tsilibari, E., Adamopoulos, A., Biskos, G., and Eleftheriadis, K.: Assessment of factors influencing PM mass
concentration measured by gravimetric & beta attenuation techniques at a suburban site, Atmospheric Environment, 131, 409–417, 2016.
US-EPA: Air Quality Criteria for Particulate Matter, 2004.35
Wichmann, H.-E. and Peters, A.: Epidemiological evidence of the effects of ultrafine particle exposure, Philosophical Transactions of the
Royal Society of London A: Mathematical, Physical and Engineering Sciences, 358, 2751–2769, 2000.
18
Wiedensohler, A., Birmili, W., Nowak, A., Sonntag, A., Weinhold, K., Merkel, M., Wehner, B., Tuch, T., Pfeifer, S., Fiebig, M., et al.: Mo-
bility particle size spectrometers: harmonization of technical standards and data structure to facilitate high quality long-term observations
of atmospheric particle number size distributions, Atmospheric Measurement Techniques, 5, 657–685, 2012.
Winklmayr, W., Reischl, G., Lindner, A., and Berner, A.: A new electromobility spectrometer for the measurement of aerosol size distribu-
tions in the size range from 1 to 1000 nm, Journal of Aerosol Science, 22, 289–296, 1991.5
Zieger, P., Weingartner, E., Henzing, J., Moerman, M., Leeuw, G. d., Mikkilä, J., Ehn, M., Petäjä, T., Clémer, K., Roozendael, M. v.,
et al.: Comparison of ambient aerosol extinction coefficients obtained from in-situ, MAX-DOAS and LIDAR measurements at Cabauw,
Atmospheric chemistry and physics, 11, 2603–2624, 2011.
Zlotkowska, R.: Adverse Health Effects of the Exposure to the Spherical Aerosol Particles, Including Ultra-Fine Particles, Synergic Influence
of Gaseous, Particulate, and Biological Pollutants on Human Health, p. 109, 2015.10
19