long term returns for key u.s. asset classes large company stocks small company stocks long term...
Post on 22-Dec-2015
213 views
TRANSCRIPT

Long term returns for key U.S. asset classes
Large Company Stocks
Small Company Stocks
Long Term CorporateBonds

Based on data from Morningstar Stocks, Bonds, Bills and Inflation Yearbook
Long Term Returns
Asset Class Average Return:
1926 - 2006
U.S. Small Company Stocks 12.7%
U.S. Large Company Stocks 10.4%
U.S. Long Term Corporate Bonds 5.9%

Based on data from Morningstar Stocks, Bonds, Bills and Inflation Yearbook
Value of $1000 invested
Long Term Value of $1000 after
Return 5 years 10 years 20
years U.S. Small Company Stocks 12.7% $1818 $3306
$10926
U.S. Large Company Stocks 10.4% $1640 $2690 $ 7234
U.S. Large Company Bonds 5.9% $1332 $1774 $ 3147

Based on data from Morningstar Stocks, Bonds, Bills and Inflation Yearbook
Growth in large co. stocks vs large company bonds
Long Term Growth in $1000 after
Return 5 years 10 years 20 years
U.S. Large Company Stocks 10.4% $ 640 $1690 $ 6234
U.S. Large Company Bonds 5.9% $ 332 $ 774 $ 2147
Difference in growth 1.7x 1.9x 2.2x 2.9x

U.S. Large Company Stocks
Returns from 1926 – 2006
Morningstar Stocks, Bonds, Bills and Inflation Yearbook

Based on data from Morningstar Stocks, Bonds, Bills and Inflation Yearbook
12
38
44
-8
-25
-43
-8
54
-1
48
34
-35
31
0
-10-12
20
26
20
36
-8
6 6
19
32
24
18
-1
53
32
-7-11
43
12
1
27
-9
23
1713
-10
24
11
-9
4
14
19
-15
-27
37
24
-7
7
18
32
-5
2123
6
32
19
5
17
32
-3
31
810
1
37
23
3329
21
-9-12
-22
29
11
5
16
-60
-50
-40
-30
-20
-10
0
10
20
30
40
50
60
70
80
90
26 28 30 32 34 36 38 40 42 44 46 48 50 52 54 56 58 60 62 64 66 68 70 72 74 76 78 80 82 84 86 88 90 92 94 96 98 00 02 04 06
Asset class: U.S. Large Company Stocks
Time period: 1926 - 2006
Returns for 1 year
Best return: 54%Worst return: -43%Gap between bestand worst returns: 97%

Based on data from Morningstar Stocks, Bonds, Bills and Inflation Yearbook
30
22
0
-27-27
-7
12
31
25
95
-5
6
-7
-1
10
22
27
15
10
1
10
18
2525
13
21
2629
811
1317
13
5
139
17
68 7 8
2 3
12
5
-9-5
8
16
75
19
141512
17201918
1317
14
19
11
16
6
15
20
312828
12
-1
-15
-4
4
1410
-60
-50
-40
-30
-20
-10
0
10
20
30
40
50
60
70
80
90
28 30 32 34 36 38 40 42 44 46 48 50 52 54 56 58 60 62 64 66 68 70 72 74 76 78 80 82 84 86 88 90 92 94 96 98 00 02 04 06
Asset class: U.S. Large Company Stocks
Time period: 1928 - 2006
Average annual returns for 3 years
Best return: 31%Worst return: -27%Gap between bestand worst returns: 58%
Based on data from Morningstar Stocks, Bonds, Bills and Inflation Yearbook
9
-5
-13-11-10
3
23
141111
1
-8
5 48
171815
111110
171918
242420
14
22
15
91313
101113
6
1210
53
8 8
2-2
35
04
1514
8
1417
1515
2017
15
20
13151615
9
1715
2024
29
18
11
-1 -13
1
6
-60
-50
-40
-30
-20
-10
0
10
20
30
40
50
60
70
80
90
30 32 34 36 38 40 42 44 46 48 50 52 54 56 58 60 62 64 66 68 70 72 74 76 78 80 82 84 86 88 90 92 94 96 98 00 02 04 06
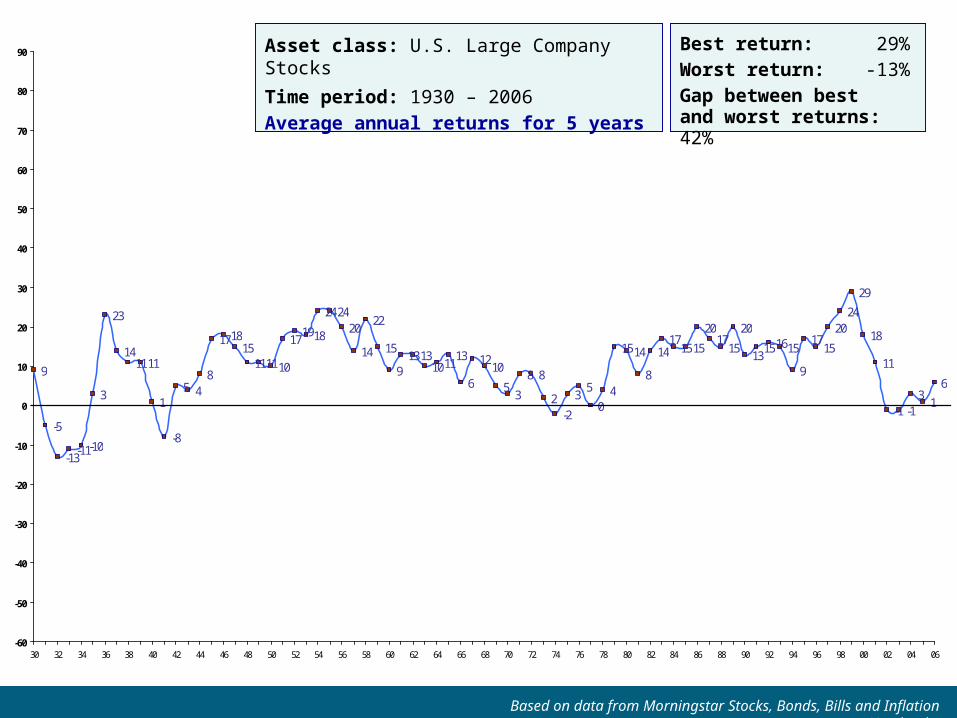
Asset class: U.S. Large Company Stocks
Time period: 1930 – 2006
Average annual returns for 5 years
Best return: 29%Worst return: -13%Gap between bestand worst returns: 42%
Based on data from Morningstar Stocks, Bonds, Bills and Inflation Yearbook
68
0 -1 02
69
79 8
4
107
913
17 1714
1717 1816
20 1916 16
1316
1311
913
108 8 7
106
13
74 3
68 7 7
111516 15
1315
181615
171614
16 16171919
1514
911 1111 10
-60
-50
-40
-30
-20
-10
0
10
20
30
40
50
60
70
80
90
35 37 39 41 43 45 47 49 51 53 55 57 59 61 63 65 67 69 71 73 75 77 79 81 83 85 87 89 91 93 95 97 99 01 03 05
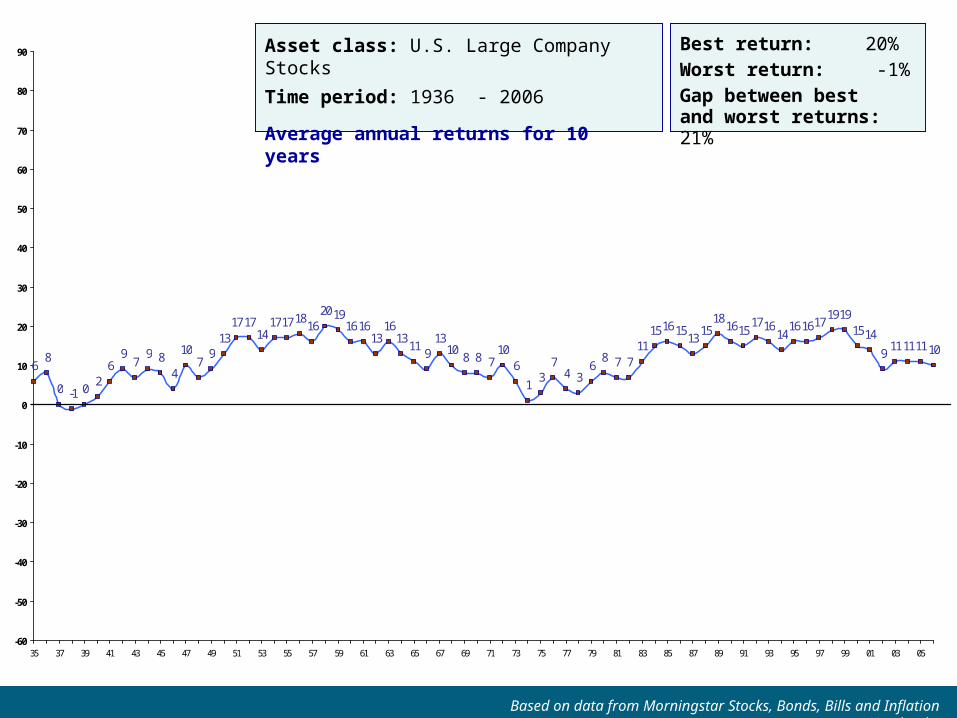
Asset class: U.S. Large Company Stocks
Time period: 1936 - 2006
Average annual returns for 10 years
Best return: 20%Worst return: -1%Gap between bestand worst returns: 21%

Based on data from Morningstar Stocks, Bonds, Bills and Inflation Yearbook
42 2 1
37
10 118
10 9 8
1311
1417 18
16 17 1614
1715
17 16 1513 13 14
108 9
117
47 6 6 5 6 7 7 7 8 9
11 11 1012
1714 14
16 16 15 1517 18 18 19
1614
12 12 11 12 11
-60
-50
-40
-30
-20
-10
0
10
20
30
40
50
60
70
80
90
40 42 44 46 48 50 52 54 56 58 60 62 64 66 68 70 72 74 76 78 80 82 84 86 88 90 92 94 96 98 00 02 04 06
Asset class: U.S. Large Company Stocks
Time period: 1940 - 2006
Average annual returns for 15 years
Best return: 19%Worst return: 1%Gap between bestand worst returns: 18%

Based on data from Morningstar Stocks, Bonds, Bills and Inflation Yearbook
7 6 53
57
12 1311
13 1311
13 14 14 1517
15 15 15 14 14 15 1513 12 12 12 11
7 7 8 8 7 7 8 7 8 8 8 9 10 9 1012 11 12 11
1315 15 15
17 18 1816 15
13 13 13 12 12
-60
-50
-40
-30
-20
-10
0
10
20
30
40
50
60
70
80
90
45 47 49 51 53 55 57 59 61 63 65 67 69 71 73 75 77 79 81 83 85 87 89 91 93 95 97 99 01 03 05
Asset class: U.S. Large Company Stocks
Time period: 1945 - 2006
Average annual returns for 20 years
Best return: 18%Worst return: 3%Gap between bestand worst returns: 15%

Based on data from Morningstar Stocks, Bonds, Bills and Inflation Yearbook
10 year periods when U.S. Bonds beat U.S. Stocks (1936 – 2006)
10 year period Return on U.S. Return on U.S. large
ending corporate bonds company stocks Difference
1935 7.1% 5.9% 1.2%
1937 6.5% 0.0% 6.5%
1938 6.9% - 0.9% 7.8%
1939 6.9% - 0.1% 7.0%
1940 6.5% 1.8% 4.7%
1941 7.0% 6.4% 0.6%
1974 2.1% 1.2% 0.9%
1979 6.2% 5.9% 0.3%
1991 16.3% 15.3% 1.0%

Based on data from Morningstar Stocks, Bonds, Bills and Inflation Yearbook
Average returns on large company stocks (1926 – 2006)
Time period 1 Year 5 Years 10 Years
% Return Gains Losses Gains Losses Gains Losses
Under 5% 3 4 8 5 6 2
5 – 9% 7 9 12 2 20 -
10 – 14% 7 5 18 3 17 -
15 – 19% 8 1 19 - 25 -
20 – 24% 10 1 9 - - -
Over 25% 22 4 1 - - -
Total 57 24 67 10 69 2
% of periods with
positive return 70% 87% 97%

Based on data from Morningstar Stocks, Bonds, Bills and Inflation Yearbook
Average returns on Large Company Stocks (1926 – 2006)
1 Years 5 Years 10 Years
Gains Losses Gains Losses Gains Losses
Average Gain / Loss 23% (12%) 13% (6%) 12% (1%)
Best / worst return 54% (43%) 29% (12%) 20% (1%)
Best / worst period
From 1933 1931 1995 1928 1949 1929 To 1999 1932 1958 1938
Value of $1000 at
end of period $1539 $567 $3511 $514 $6223 $915

U.S. Small Company Stocks
Returns from 1926 – 2006
Morningstar Stocks, Bonds, Bills and Inflation Yearbook

Based on data from Morningstar Stocks, Bonds, Bills and Inflation Yearbook
0
22
40
-51
-38
-50
-5
24
40
65
-58
33
0
-5-9
45
88
54
74
-12
1-2
20
39
8
3
-7
61
20
4
-15
65
16
-3
32
-12
2424
42
-7
64
36
-25
-17
17
4
-31
-20
5357
2524
4440
14
28
40
-7
25
7
-9
23
10
-22
45
2321
3
35
18
23
-7
30
-4
23
-13
61
18
6
16
-60
-50
-40
-30
-20
-10
0
10
20
30
40
50
60
70
80
90
26 28 30 32 34 36 38 40 42 44 46 48 50 52 54 56 58 60 62 64 66 68 70 72 74 76 78 80 82 84 86 88 90 92 94 96 98 00 02 04 06
Asset class: U.S. Small Company Stocks
Time period: 1926 - 2006
Returns for 1 year
*143Best return: 143%Worst return: - 58%Gap between bestand worst returns: 201%

Based on data from Morningstar Stocks, Bonds, Bills and Inflation Yearbook
20
-6
-25
-47
-34
5
42
62
42
-1-3
-18
8
-5
8
35
61
71
33
16
-4
6
1821
16
1
16
2226
2
1418
23
14
4
1310
29
18
3432
23
-6-10
0
-6
-17
-5
24
45
3531
3532
2727
1918
8 7 6 7
2
812
29
151918
25
1014
5
15
1
2018
26
13
-60
-50
-40
-30
-20
-10
0
10
20
30
40
50
60
70
80
90
28 30 32 34 36 38 40 42 44 46 48 50 52 54 56 58 60 62 64 66 68 70 72 74 76 78 80 82 84 86 88 90 92 94 96 98 00 02 04 06
Asset class: U.S. Small Company Stocks
Time period: 1928 - 2006
Average annual returns for 3 years
Best return: 71%Worst return: -47%Gap between bestand worst returns: 118%

Based on data from Morningstar Stocks, Bonds, Bills and Inflation Yearbook
-12
-24-28
-19
-2
15
46
24
10
5
-3
-14
11
19
29
4645
35
8
13
8121312
181514
10
23
16
11
1617
1011
20
12
3032
20
8
13
1
-12-11
1
711
24
4037
292933
2219
17
109 10
1
7
141312
25
2019
13
19
1112
4
1614
1615
-60
-50
-40
-30
-20
-10
0
10
20
30
40
50
60
70
80
90
30 32 34 36 38 40 42 44 46 48 50 52 54 56 58 60 62 64 66 68 70 72 74 76 78 80 82 84 86 88 90 92 94 96 98 00 02 04 06
Asset class: U.S. Small Company Stocks
Time period: 1930 - 2006
Average annual returns for 5 years
Best return: 46%Worst return: -28%Gap between bestand worst returns: 74%
Based on data from Morningstar Stocks, Bonds, Bills and Inflation Yearbook
0
6
-5 -6
1
6
12
1714
1719
12
2219
2125
28
23
151511
1311
17 1713
1513
171415 14
2321
1614
1214
8
3 4
106 5
12
18 1720
2830
28
231919
16
912 12
10 1112 1317
1315
1816
1215 16
14 14
-60
-50
-40
-30
-20
-10
0
10
20
30
40
50
60
70
80
90
35 37 39 41 43 45 47 49 51 53 55 57 59 61 63 65 67 69 71 73 75 77 79 81 83 85 87 89 91 93 95 97 99 01 03 05
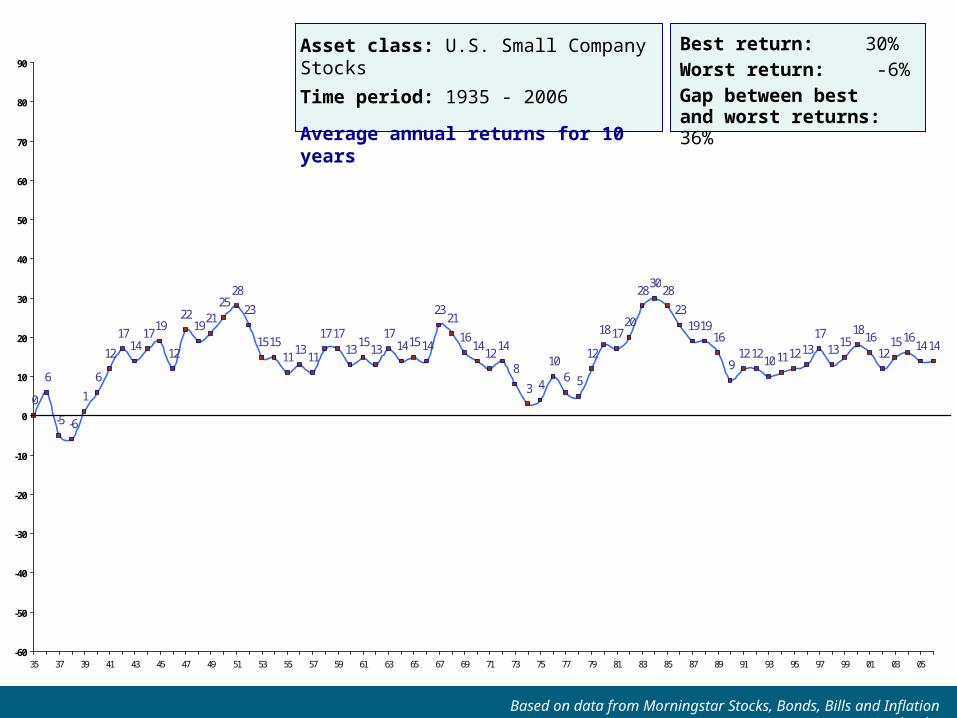
Asset class: U.S. Small Company Stocks
Time period: 1935 - 2006
Average annual returns for 10 years
Best return: 30%Worst return: -6%Gap between bestand worst returns: 36%

Based on data from Morningstar Stocks, Bonds, Bills and Inflation Yearbook
-1 -1 02
10
1822 23
16 15 1512
1916
2022 23
19 1816
1114 13
15 15 15 14
1922
1613 14 15
96
9 1013 13 14 14
1613 13
1518 17 16
2123
18 17 17 1715 14 14 14
1114
12 13 1214 15
1715
-60
-50
-40
-30
-20
-10
0
10
20
30
40
50
60
70
80
90
40 42 44 46 48 50 52 54 56 58 60 62 64 66 68 70 72 74 76 78 80 82 84 86 88 90 92 94 96 98 00 02 04 06
Asset class: U.S. Small Company Stocks
Time period: 1940 - 2006
Average annual returns for 15 years
Best return: 23%Worst return: -1%Gap between bestand worst returns: 24%

Based on data from Morningstar Stocks, Bonds, Bills and Inflation Yearbook
9 9 86
1115
20 20
15 16 1513
17 18 19 1921
1816
14 13 1417
1916
13 14 1412
810
1214
1214
16 1517 18
16 15 1612 12
14 1315 16
19 20 2018 18
16 1613 14
12 1214 13 13
-60
-50
-40
-30
-20
-10
0
10
20
30
40
50
60
70
80
90
45 47 49 51 53 55 57 59 61 63 65 67 69 71 73 75 77 79 81 83 85 87 89 91 93 95 97 99 01 03 05
Asset class: U.S. Small Company Stocks
Time period: 1946 - 2006
Average annual returns for 20 years
Best return: 20%Worst return: 6%Gap between bestand worst returns: 14%
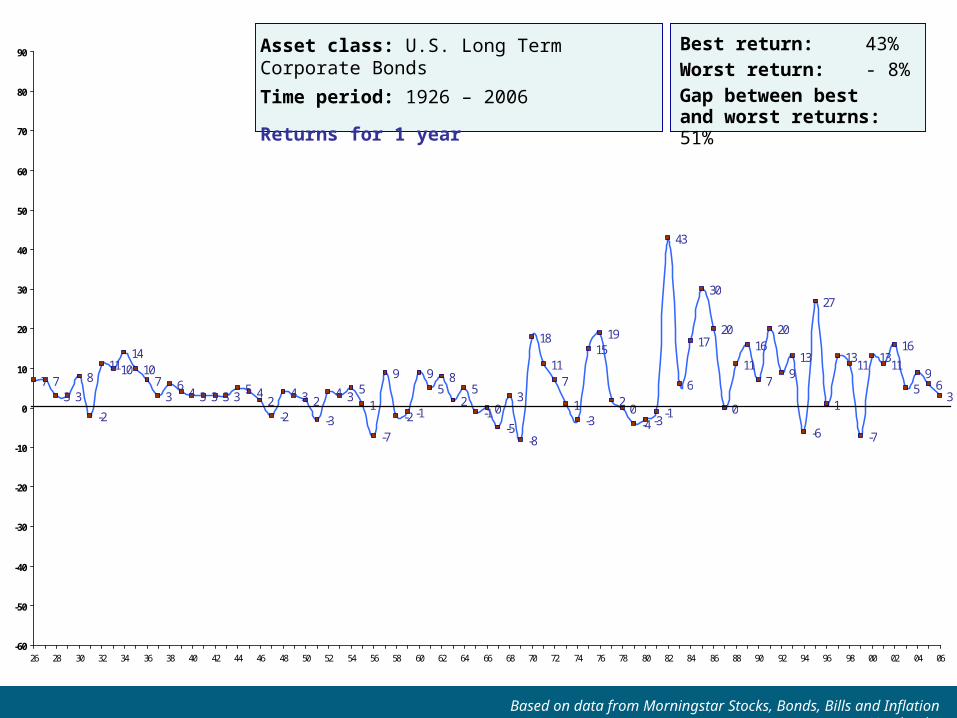
U.S. Long Term Corporate Bonds
Returns from 1926 – 2006
Morningstar Stocks, Bonds, Bills and Inflation Yearbook
Based on data from Morningstar Stocks, Bonds, Bills and Inflation Yearbook
7 73 3
8
-2
111014
107
36
4 3 3 3 35 4
2-2
4 3 2
-3
4 35
1
-7
9
-2 -1
95
8
25
-1 0
-5
3
-8
18
117
1-3
1519
20
-4 -3-1
43
6
17
30
20
0
11
16
7
20
913
-6
27
1
1311
-7
1311
16
59
63
-60
-50
-40
-30
-20
-10
0
10
20
30
40
50
60
70
80
90
26 28 30 32 34 36 38 40 42 44 46 48 50 52 54 56 58 60 62 64 66 68 70 72 74 76 78 80 82 84 86 88 90 92 94 96 98 00 02 04 06
Asset class: U.S. Long Term Corporate Bonds
Time period: 1926 – 2006
Returns for 1 year
Best return: 43%Worst return: - 8%Gap between bestand worst returns: 51%

Based on data from Morningstar Stocks, Bonds, Bills and Inflation Yearbook
6 5 53
6 6
1211106 5 4 5
3 3 3 3 4 41 1 2 3
1 1 14 3
0 1 02 2
47
5 52 2
-2 -1-4
47
12
62
4
1011
6
-1 -2 -3
1114
2117
22
16
10 911
1412
14
5
117
13
85 5 5
131110
7 6
-60
-50
-40
-30
-20
-10
0
10
20
30
40
50
60
70
80
90
28 30 32 34 36 38 40 42 44 46 48 50 52 54 56 58 60 62 64 66 68 70 72 74 76 78 80 82 84 86 88 90 92 94 96 98 00 02 04 06
Asset class: U.S. Long Term Corporate Bonds
Time period: 1928 - 2006
Average annual return for 3 years
Best return: 22%Worst return: - 4%Gap between bestand worst returns: 26%
Based on data from Morningstar Stocks, Bonds, Bills and Inflation Yearbook
64 5 6
8 810 9 8
6 5 4 4 3 3 3 3 2 2 2 2 1 2 2 2 2 1 2 1 0 14 4 5 6
4 30 0
-21
36 6 7 6 7 6 6 6
2-1
6 711
18
23
141515
10101313
812
9 9 9 86
8 8 711
9 8
-60
-50
-40
-30
-20
-10
0
10
20
30
40
50
60
70
80
90
30 32 34 36 38 40 42 44 46 48 50 52 54 56 58 60 62 64 66 68 70 72 74 76 78 80 82 84 86 88 90 92 94 96 98 00 02 04 06
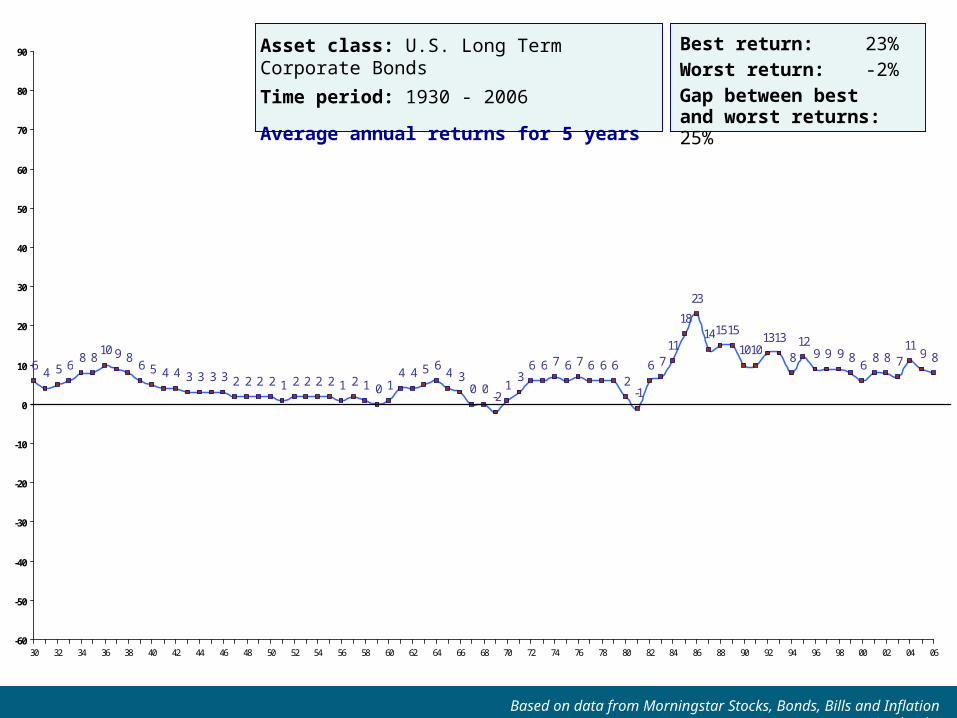
Asset class: U.S. Long Term Corporate Bonds
Time period: 1930 - 2006
Average annual returns for 5 years
Best return: 23%Worst return: -2%Gap between bestand worst returns: 25%

Based on data from Morningstar Stocks, Bonds, Bills and Inflation Yearbook
7 7 7 7 7 7 7 6 5 5 4 4 3 3 3 3 2 2 2 2 2 1 2 1 1 2 2 3 3 3 3 3 2 2 2 3 3 3 3 24 5 6 6 6
4 36 6
9 10 1010 1113 14
161314
1211 1011 118 9 8 9 8
108 8
-60
-50
-40
-30
-20
-10
0
10
20
30
40
50
60
70
80
90
35 37 39 41 43 45 47 49 51 53 55 57 59 61 63 65 67 69 71 73 75 77 79 81 83 85 87 89 91 93 95 97 99 01 03 05
Asset class: U.S. Long Term Corporate Bonds
Time period: 1935 - 2006
Average annual returns for 10 years
Best return: 16%Worst return: 1%Gap between bestand worst returns: 15%