long-term trends and recent upturns in regional mortality variations … trends and recent... ·...
TRANSCRIPT

European Journal of Geography Volume 9, Number 1: 6 - 22, March 2018
©Association of European Geographers
European Journal of Geography-ISSN 1792-1341 © All rights reserved 6
LONG-TERM TRENDS AND RECENT UPTURNS IN REGIONAL MORTALITY
VARIATIONS IN GREECE
Vasilis S. GAVALAS University of the Aegean, Department of Geography, Mytilene, Greece
https://geography.aegean.gr/ppl/index.php?content=0&bio=bgav [email protected]
Abstract
Great regional variations in mortality within a country reflect unequal social and economic
development and an ineffective health system. On the other hand, small mortality variations
from one region to another indicate more homogeneous development and a relatively equal
access to the national health system. Greece has made remarkable progress in this respect
over the last 35 years. The current paper documents this progress in two ways: firstly, by
inspecting regional variations in infant and in general mortality from 1981 onwards and
second by associating indexes of economic and social development of each region with its
level of mortality. A gradual convergence of the mortality rates across the country and a
consequent de-association of the per capita income from the mortality level of an area point
to a more effective welfare system over the examined period. The only ambivalent period is
that of 2009-2014, where no progress is recorded in infant mortality, probably because of the
cuts in public health spending, stemming from an acute economic crisis which started in
2009.
Keywords: Standardized Mortality Rate, Infant Mortality Rate, Administrative divisions, Physicians
per 100,000 population, Regional variations, Official statistics.
1. INTRODUCTION
The current research draws on official statistics (vital statistics and population estimates) to
sketch the mortality profile of modern Greece. The paper focuses on regional variations in
infant and general mortality from 1981 to 2014. The research at hand comes as an addition to
the existing literature on the regional dimensions of Greece’s mortality, which (literature)
consists of few but rigorous studies on the issue (Androulaki, 2007a; Androulaki, 2007b,
Papastergiou, Rachiotis, Polyzou, Zilidis, Hadjichristodoulou, 2008; Agorastakis, 2009;
Petrakos, 2009; Gavalas, 2015). These studies document that the Regions in the North and
North-eastern Greece, (mainly the Region of Eastern Macedonia and Thrace) presented
higher mortality than the national average even in the turn of the 21st century. On the other
hand, the most privileged Regions, mortality-wise, are located on the West and South-West of
Greece, namely the islands of the South Aegean and Crete.
A previous study on regional variation in mortality in Greece has pinpointed three
possible risk factors for the raised mortality in certain areas, namely GDP per capita, number
of physicians per 100,000 population and number of hospital beds per 100,000 population.
All these three factors were proved statistically significant explanatory factors for the raised
mortality in the young age-groups 0-14 years old (Papastergiou et al., 2008). Regional
variations in the economic growth of Greece and especially the core-periphery imbalances

Gavalas V. / European Journal of Geography 9 1 6–22 (2018)
European Journal of Geography-ISSN 1792-1341 © All rights reserved 7
have been documented substantially by economists and geographers alike (Iconomou, 2011;
Petrakos, 2009).
A question raised by the current economic situation in Greece is in what extent the
economic crisis has affected mortality rates in national and regional level. It is well
established that Greece was going through a period of economic development up to 2008,
during which the Gross Domestic Product (GDP) of the country was increasing and the
unemployment had fallen to one-digit figures (ELSTAT 2016a; ELSTAT 2016b). More
specifically the per capita GDP of Greece was amounted to 21,845 euros in 2008 and the
unemployment rate to 9.6%, ascending from even lower figures in previous years. Since
2009, however, the GDP of Greece is continuously decreasing, dropping to 16,181 euros per
inhabitant in 2015 and the unemployment rate reached 27.5% in 2013 due to a fiscal crisis,
which caused a drop in the living standards for most of the population (ELSTAT 2016a;
ELSTAT 2016b). An economic setback to such an extent is unusual for a developed country
and unprecedented for a member state of the European Union.
There is at least one study which claims that infant mortality rate (IMR) raised by 43%
between 2008 and 2010 due to cuts in public health spending (Kentikelenis, Karanikolos,
Revees, McKee, Stuckler, 2014). The current paper reassesses the existing studies in the light
of more recent evidence (data up to 2014) and debates the convergence of mortality indexes
over a period of 34 years. As far as the recent economic crisis is concerned, the paper at hand
tries to assess the impact of this situation on infant mortality and on the mortality of the
general population by deriving valid and comparable mortality indices and by correlating
socio-economic variables with mortality rates.
2. METHODS
The main geographical unit of analysis is the Region, which is an administrative entity
corresponding to NUTS 2 (Nomenclature des Unités Territoriales Statistiques), according to
the standardization used by Eurostat for comparing administrative divisions across European
Union. Greece is divided in 13 Regions. However, in the following analysis the Prefecture of
Thessaloniki (which is a Regional Unit in the NUTS 3 level) is examined separately from the
Region of Central Macedonia, where it belongs, because Thessaloniki, as the second biggest
urban center of Greece, presents different demographic behavior from the rest of Central
Macedonia. Therefore, mortality indexes for the Region of Central Macedonia have been re-
calculated without the Prefecture of Thessaloniki and in that manner they are presented in the
following tables and figures. For the greater Athens area no special treatment was necessary,
since the Prefecture of Attica (as the greater Athens is called) coincides geographically with
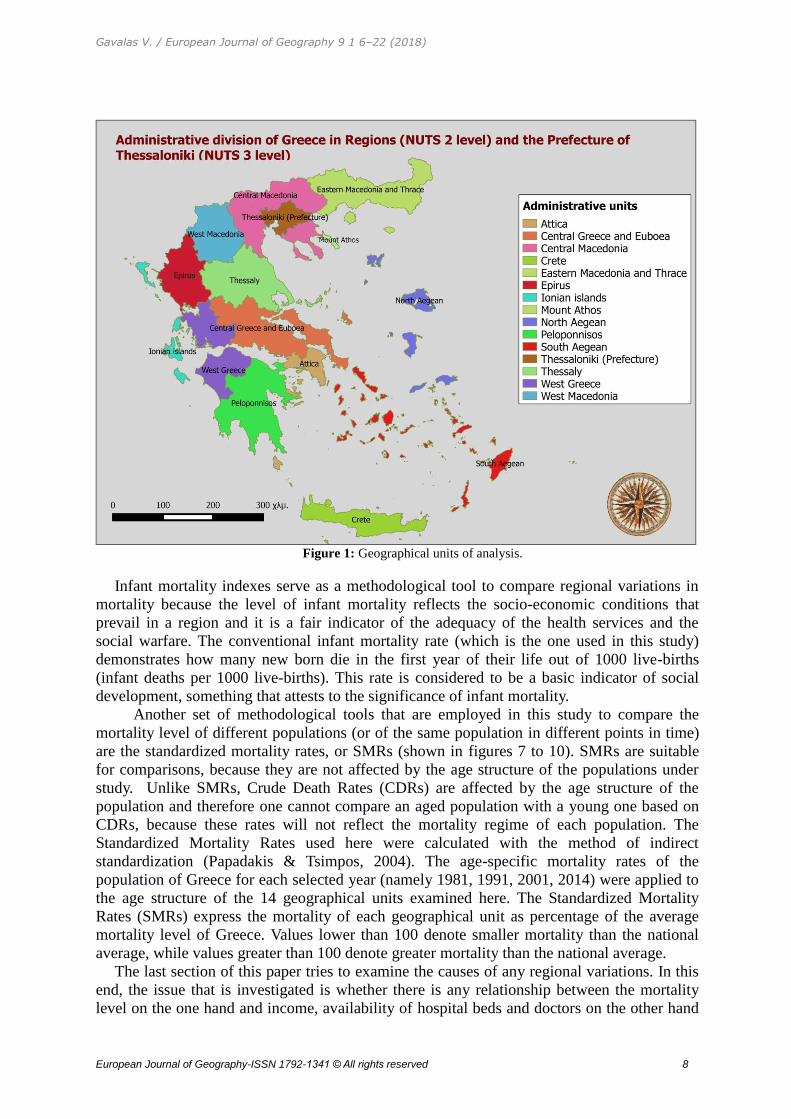
the Region of Attica. Figure 1 shows the 14 administrative, quasi-geographical, units for
which mortality analysis has been made. A fifteenth unit, namely Mount Athos, is shown on
the figures, but no analysis has been made for this area, since it constitutes a special case
within the Greek territory. It is an autonomous monastic community populated by
approximately 2000 men. The small population of Mount Athos and its peculiar structure
(adult men only) do not allow us to derive any comparable mortality indexes for this area.
Gavalas V. / European Journal of Geography 9 1 6–22 (2018)
European Journal of Geography-ISSN 1792-1341 © All rights reserved 8
Figure 1: Geographical units of analysis.
Infant mortality indexes serve as a methodological tool to compare regional variations in
mortality because the level of infant mortality reflects the socio-economic conditions that
prevail in a region and it is a fair indicator of the adequacy of the health services and the
social warfare. The conventional infant mortality rate (which is the one used in this study)
demonstrates how many new born die in the first year of their life out of 1000 live-births
(infant deaths per 1000 live-births). This rate is considered to be a basic indicator of social
development, something that attests to the significance of infant mortality.
Another set of methodological tools that are employed in this study to compare the
mortality level of different populations (or of the same population in different points in time)
are the standardized mortality rates, or SMRs (shown in figures 7 to 10). SMRs are suitable
for comparisons, because they are not affected by the age structure of the populations under
study. Unlike SMRs, Crude Death Rates (CDRs) are affected by the age structure of the
population and therefore one cannot compare an aged population with a young one based on
CDRs, because these rates will not reflect the mortality regime of each population. The
Standardized Mortality Rates used here were calculated with the method of indirect
standardization (Papadakis & Tsimpos, 2004). The age-specific mortality rates of the
population of Greece for each selected year (namely 1981, 1991, 2001, 2014) were applied to
the age structure of the 14 geographical units examined here. The Standardized Mortality
Rates (SMRs) express the mortality of each geographical unit as percentage of the average
mortality level of Greece. Values lower than 100 denote smaller mortality than the national
average, while values greater than 100 denote greater mortality than the national average.
The last section of this paper tries to examine the causes of any regional variations. In this
end, the issue that is investigated is whether there is any relationship between the mortality
level on the one hand and income, availability of hospital beds and doctors on the other hand

Gavalas V. / European Journal of Geography 9 1 6–22 (2018)
European Journal of Geography-ISSN 1792-1341 © All rights reserved 9
(availability is measured in terms of hospital beds (or doctors respectively) per 100,000
population). These bi-variate associations are quantified with the use of Pearson’s correlation
coefficient (Pearson’s r).
3. ANALYSIS
3.1 Regional variations in Infant mortality
It is worth examining infant mortality separately from the mortality of the general population
because the level of infant mortality reflects the socio-economic conditions that prevail in a
country and it is a fair indicator of the adequacy of the health services and the social warfare.
Figures 2 to 6 present IMR by Region (plus the Prefecture of Thessaloniki, which is
examined separately from the Region of Central Macedonia for reasons stated in the
introduction).
In 1981 East Macedonia and Thrace was the Region with the highest infant mortality
(around 25‰), followed by the two main urban centers of Greece, Athens (in the Region of
Attica) and Thessaloniki with IMR 18‰ and 19.3‰ respectively (figure 2). North Aegean
was also a Region with higher IMR than the national average. However, the infant mortality
rate in the Region of North Aegean was only slightly higher than the national average (17.4‰
versus 16.9‰). The remaining Regions presented lower infant mortality than the national
average, with the lowest IMRs recorded in Crete and the South Aegean (just above 10‰).
Figure 2: Infant mortality Rate (infant deaths per 1000 livebirths) in 14 administrative units (Regions and the
Prefecture of Thessaloniki). Greece 1981

Gavalas V. / European Journal of Geography 9 1 6–22 (2018)
European Journal of Geography-ISSN 1792-1341 © All rights reserved 10
In 1991 infant mortality had dropped to 9‰ from 16.9‰ that was a decade ago (figure 3).
The two main urban centers of Greece continued to record higher infant mortality than the
national average with Thessaloniki having the highest IMR (12.7‰). West Greece was also
above the national average as far as IMR was concerned. The remaining Regions presented
lower infant mortality than the national average, with the lowest IMRs recorded in the South
Aegean (5.3‰).
Figure 3: Infant mortality Rate (infant deaths per 1000 livebirths) in 14 administrative units (Regions and the
Prefecture of Thessaloniki). Greece 1991
In 2001 regional variations in mortality had diminished even more (figure 4). The
deviation from the national average (which dropped to 5.1‰) was ±1.6 units, as opposed to
±2.6 units in 1991 and ±4.1 in 1981. The two main urban centers (Athens and Thessaloniki)
did not record higher infant mortality than the national average, as was the case in the
previous decades (in 2001 their IMR was around 5‰). The Region with the highest IMR was
West Greece (7.4‰) and there were two Regions, namely Epirus and South Aegean with
IMRs less than 4‰ (2.6‰ for Epirus and 3.3‰ for South Aegean).

Gavalas V. / European Journal of Geography 9 1 6–22 (2018)
European Journal of Geography-ISSN 1792-1341 © All rights reserved 11
Figure 4: Infant mortality Rate (infant deaths per 1000 livebirths) in 14 administrative units (Regions and the
Prefecture of Thessaloniki). Greece 2001
In the first decade of the 21st century regional variations in Greece as far as infant
mortality is concerned, are negligible. Infant deaths are too few to allow a regional analysis in
yearly basis. There are Regions, like the Ionian islands, West Macedonia, North and South
Aegean, where infant deaths in a single year are less than 10 (and less than 5 in certain years)
and any comparison should be based on time series of several years to be trustworthy. Even
for greater Regions an analysis of infant mortality based on a single year is not reliable
because variations from one year to another are circumstantial and due to the very small
number of infant deaths. Figures 5 and 6 attempt to compare IMRs in the 14 administrative
units examined here based on data concerning three consecutive years, 2009-2011 in figure 5
and 2012-2014 in figure 6. Even with aggregate data of three years, in 7 out of the 14
administrative units less than 50 infant deaths were recorded in every three-year period (2009-
2011 and 2012-2014).

Gavalas V. / European Journal of Geography 9 1 6–22 (2018)
European Journal of Geography-ISSN 1792-1341 © All rights reserved 12
Figure 5: Infant mortality Rate (infant deaths per 1000 livebirths) in 14 administrative units (Regions and the
Prefecture of Thessaloniki). Greece 2009-2011.
Figure 6. Infant mortality Rate (infant deaths per 1000 livebirths) in 14 administrative units (Regions
and the Prefecture of Thessaloniki). Greece 2012-2014.

Gavalas V. / European Journal of Geography 9 1 6–22 (2018)
European Journal of Geography-ISSN 1792-1341 © All rights reserved 13
Table 1 presents the data series used for the construction of figures 2 to 6. The last row of
table 1 shows the standard deviation of infant mortality for each year. Standard deviation can
be used as an indication of variation since it is a measure of dispersion of the data around their
mean. It is obvious that regional variation was continuously reducing in Greece from 1981 to
2009-11.
Table 1. Infant Mortality Rates (IMRs) and their measures of dispersion from 1981 to 2012-14
Region IMR
1981
IMR
1991
IMR
2001
IMR
2009-11
IMR
2012-14
Eastern Macedonia and Thrace 24.9 9.5 6.6 4.9 5.4
Central Macedonia (without Thessaloniki) 13.0 6.6 4.8 3.6 4.1
West Macedonia 13.3 5.7 4.3 3.6 3.6
Epirus 15.5 8.7 2.6 3.1 3.4
Thessaly 11.3 6.0 4.6 2.4 2.0
Central Greece and Euboea 25.0 5.5 5.9 2.7 2.2
Ionian islands 13.9 8.1 4.2 2.7 2.2
West Greece 15.7 11.1 7.4 3.1 3.9
Peloponnesus 15.1 6.4 4.6 4.1 4.3
Attica 18.0 10.5 5.1 3.7 3.2
North Aegean 17.4 7.1 5.3 3.6 4.7
South Aegean 10.8 5.3 3.3 2.7 2.2
Crete 10.4 7.4 4.8 2.0 2.7
Thessaloniki (Prefecture) 19.3 12.7 5.2 3.6 4.1
Greece 16.9 9.0 5.1 3.4 3.4
Max 25.0 12.7 7.4 4.9 5.4
Min 10.4 5.3 1.9 2.0 2.0
St. Deviation 4.8 2.7 1.6 0.7 1.0
Source: Births and infant deaths provided by ELSTAT
3.2 Regional variations in mortality of the general population
It was established above that geographical variations in infant mortality in Greece were
diminished in the beginning of the 21st century, at least at the level of the 14 geographical
units examined here. Nevertheless, the mortality of the general population keeps fluctuating
across Regions, although not to the extent it used to be in the past. The course of mortality
from 1981 to 2014 is presented in figures 7 to 10 below.
Gavalas V. / European Journal of Geography 9 1 6–22 (2018)
European Journal of Geography-ISSN 1792-1341 © All rights reserved 14
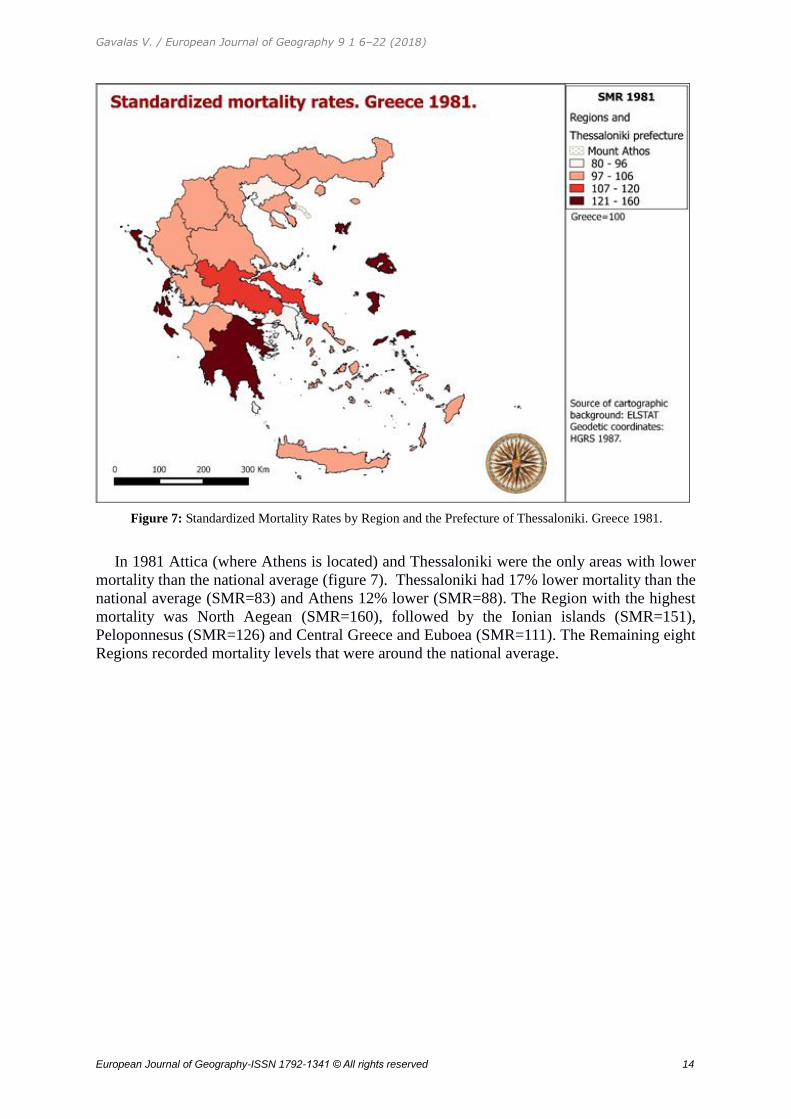
Figure 7: Standardized Mortality Rates by Region and the Prefecture of Thessaloniki. Greece 1981.
In 1981 Attica (where Athens is located) and Thessaloniki were the only areas with lower
mortality than the national average (figure 7). Thessaloniki had 17% lower mortality than the
national average (SMR=83) and Athens 12% lower (SMR=88). The Region with the highest
mortality was North Aegean (SMR=160), followed by the Ionian islands (SMR=151),
Peloponnesus (SMR=126) and Central Greece and Euboea (SMR=111). The Remaining eight
Regions recorded mortality levels that were around the national average.

Gavalas V. / European Journal of Geography 9 1 6–22 (2018)
European Journal of Geography-ISSN 1792-1341 © All rights reserved 15
Figure 8: Standardized Mortality Rates by Region and the Prefecture of Thessaloniki. Greece 1991.
In 1991 the two main urban centers of Greece (Athens and Thessaloniki) remained the
only areas with lower mortality than the national average (figure 8). North Aegean, the Ionian
islands and Peloponnesus kept their place as the Regions with the highest mortality (more
than 20% than the national average). More Regions presented mortality rates that were 7% to
20% higher than the national average and only five were around the national average.
However, regional variations in mortality in 1991 were less acute than in 1981, as the
standard deviation in table 2 attests.

Gavalas V. / European Journal of Geography 9 1 6–22 (2018)
European Journal of Geography-ISSN 1792-1341 © All rights reserved 16
Figure 9: Standardized Mortality Rates by Region and the Prefecture of Thessaloniki. Greece 2001.
In 2001 South Aegean joined Athens and Thessaloniki in the group of areas that exhibited
lower than the national average mortality (figure 9). North Aegean and Peloponnesus were
the only Regions with considerably higher mortality than the national average. In 2001
regional variation in Greece’s mortality was less acute than in the previous decades (see table
2).
In 2014 no Region deviates more than 15% from the national average. Regional variation,
as measured by standard deviation (table 2), is the minimum recorded in the examined period
(1981-2014).

Gavalas V. / European Journal of Geography 9 1 6–22 (2018)
European Journal of Geography-ISSN 1792-1341 © All rights reserved 17
Figure 10 : Standardized Mortality Rates by Region and the Prefecture of Thessaloniki. Greece 2014.
Table 2 : Standardized Mortality Rates (SMRs) and their measures of dispersion from 1981 to 2014.
(Greece=100).
Region SMR 1981 SMR
1991
SMR 2001 SMR 2014
Eastern Macedonia and Thrace 106 113 114 111
Attica 88 89 91 94
North Aegean 160 145 133 115
West Greece 104 104 107 104
West Macedonia 104 104 105 109
Epirus 104 108 109 105
Thessaly 103 104 111 109
Ionian islands 151 135 114 113
Central Macedonia (without
Thessaloniki)
99 107 111 100
Crete 104 97 97 88
South Aegean 100 97 80 79
Peloponnesus 126 128 126 114
Central Greece and Euboea 111 114 115 108
Thessaloniki (Prefecture) 83 80 80 87
Greece 100 100 100 100
Min 83 80 80 79
Max 160 145 133 115
St. Deviation 21.6 17.5 15.3 11.3
Source: mid-year estimates and age-specific deaths provided by ELSTAT.

Gavalas V. / European Journal of Geography 9 1 6–22 (2018)
European Journal of Geography-ISSN 1792-1341 © All rights reserved 18
3.3 The relationship between mortality and socio-economic development
The above analysis on regional variations in mortality raises questions on the etiology of
these variations. Three possible reasons are held responsible for the regional variations in
mortality, namely GDP per capita, number of physicians per 100,000 population and number
of hospital beds per 100,000 population. There are of course many more factors which may
cause mortality to vary from one region to another in the same country: environmental
factors, like the climate of an area, the pollution of atmosphere and water with any king of
industrial waste and chemical substances. Yet, it is mainly the factors that are associated with
the socio-economic development that concern us in this paper.
Table 3 correlates mortality (as measured by the Standardized Mortality Rates, SMR) in
2001 with GDP per capita (as measured by the Purchasing Power Standard per inhabitant,
PPS) and with the number of physicians per 100.000 population. It is obvious from the
bivariate correlations shown in table 4, that only the GDP per capita was correlated with
regional variations in mortality in a non-random way (r =-0.66, p<0.05) in 2001. The
variation in mortality from one region to another could not be explained by the variation in
the relative number of physicians because the correlation coefficient was not statistically
significant (r=-0.24, p=0.427, see table 4). This finding becomes more interesting when one
notices that the relative number of physicians from one region to another presents greater
variation that GDP per capita (the coefficient of variation equals 24 for the former and 17 for
the latter). This could mean that access to health services was more depended on someone’s
income rather than on availability of doctors.
Table 3: Standardized Mortality Rates (SMRs), physicians per 100.000 inhabitants and Purchasing Power
Standard per capita (PPS p.c.) in euros. Greece 2001.
Region SMR
Physicians per
100000
PPS p.c. in
euros
Greece 100 437 17900
Eastern Macedonia and Thrace 114 310 13700
Central Macedonia 111 453 14900
West Macedonia 105 236 15700
Epirus 109 306 13600
Thessaly 111 446 13900
Ionian islands 114 308 18200
West Greece 107 351 13400
Central Greece and Euboea 115 251 18900
Peloponnesus 126 298 14900
Attica 91 579 22600
North Aegean 133 313 13100
South Aegean 80 241 20700
Crete 97 452 16500
St. deviation 14 103 3054
Coefficient of variation 14 24 17
Source: EL.STAT. Own elaboration

Gavalas V. / European Journal of Geography 9 1 6–22 (2018)
European Journal of Geography-ISSN 1792-1341 © All rights reserved 19
Table 4: Correlation of mortality (SMR) with socio-economic development. Regions of Greece 2001
SMR physicians
per 100,000 PPS p.c. in €
Pearson's r -0.24 -0.66
p-value 0.427 0.015
Source: Data from table 3
For 2014 there is one more explanatory variable, namely the number of hospital beds per
100,000 population (table 5). Once again only the GDP per capita was a statistically
significant explanatory variable for the regional variations in mortality (r=-0.55, p<0.05, see
table 6). It is noteworthy, however, that correlation between income and mortality is not as
strong in 2014 as it was in 2001, although the regional variations of income in 2014 are
greater than those in 2001 (coefficient of variation equals 19 for 2014 versus 17 for 2001).
This finding in conjunction with the fact that mortality presents less regional variations in
2014 than in 2001 (c.v.=11 for 2014 and 14 for 2001), may indicate that the national health
system became more effective between 2001 and 2014. The other two variables (availability
of doctors and availability of hospital beds) are not statistically significant, although the
correlation of available doctors with regional variations in mortality is stronger in 2014 than
in 2001.
Table 5: Standardized Mortality Rates (SMRs), physicians per 100.000 inhabitants, hospital beds per 100.000
inhabitants and Purchasing Power Standard per capita (PPS p.c.) in euros. Greece 2014.
Source: EL.STAT. Own elaboration
Table 6: Correlation of mortality (SMR) with socio-economic development. Regions of Greece 2014.
SMR physicians
per 100,000 PPS p.c. in € Hospital beds
per 100000
Pearson's r -0.30 -0.55 -0.21
p-value 0.328 0.049 0.498
Source: Data from table 5
Region SMR
physicians
per 100000
PPS p.c.
in euros
Hospital beds
per 100000
Greece 100 632 19900 424
Eastern Macedonia and Thrace 111 480 13700 406
Central Macedonia 100 605 15300 432
West Macedonia 109 298 18100 423
Epirus 105 667 14000 418
Thessaly 109 496 15100 518
Ionian islands 113 429 18400 269
West Greece 104 548 14800 298
Central Greece and Euboea 108 302 16900 171
Peloponnesus 114 359 15900 240
Attica 94 870 27100 520
North Aegean 115 396 15700 314
South Aegean 79 325 22000 321
Crete 88 631 17300 392
St. deviation 11 169 3692 105
Coefficient of variation 11 27 19 25

Gavalas V. / European Journal of Geography 9 1 6–22 (2018)
European Journal of Geography-ISSN 1792-1341 © All rights reserved 20
4. DISCUSSION
The paper inspected regional variations in mortality in Greece in the last 34 years (1981-
2014). Greece used to have a history of unequal mortality rates in regional level, although
there was no standard geographical pattern to this inequality. The Regions that presented
higher than the national average mortality were scattered all over the country. It is not only
the North and the Northeast of the country, namely the Regions of East Macedonia and
Thrace, and the North Aegean, which were lagging behind the National Average, as far as the
general mortality is concerned. The Ionian islands, Peloponnesus and, to a lesser extent
Central Greece and Euboea, presented higher than average mortality all over the examined
period (1981-2014) in terms of Standardized Mortality Rates. However, a continuous
descending course of regional variations in mortality is more than obvious from 1981 to 2014.
In 2014 the Region with the highest mortality, recorded only 15% higher mortality than the
national average, while in 1981 this figure was 60%.
When it comes to infant mortality, it is worth noting that the two main urban centers of
Greece, Athens and Thessaloniki, presented higher than average infant mortality for most of
the examined period. Neither of the two cities has ever presented lower than the national
average infant mortality. The marginally lower IMR of Attica in 2012-14 (3.2‰ in Attica
versus 3.4‰ in Greece) is not enough to establish a substantially lower IMR than the national
average, and Thessaloniki was always above the national average. On the other hand, the two
urban centers had always lower SMRs than the national average. The case of Thessaloniki is
even more intriguing because its SMR was always by far lower than the SMR of Central
Macedonia (the Region where Thessaloniki belongs) while its IMR was usually higher than
that of Central Macedonia. This fact poses further research questions regarding the reasons
for this inconsequence.
Regarding the effect of the economic crisis that inflicts Greece since 2009, stagnation is
observed in the national infant mortality rate between 2009-11 and 2012-14, which is
accompanied with an increase in regional variations. An increase in infant mortality between
2008 and 2010 is shown by the IMRs of these two years (2.7‰ in 2008 vs 3.8‰ in 2010) and
this increase is attributed by certain scholars to the economic crisis, which caused rapid
upsurge in unemployment, cuts in public health expenditures and concomitant reductions in
the number of healthcare workforce and their salaries (Kentikelenis, et al. 2014). However, a
closer examination of the data shows that the increase in infant mortality between 2008 and
2010 is partly due to an inherent shortcoming of the conventional infant mortality rate (IMR).
The conventional IMR does not satisfy the principle of correspondence, meaning that the
events in the numerator of the index (infant deaths) do not necessarily correspond to the
population in the denominator (live births). The infant deaths recorded in 2010 came from
births that took place both in 2010 and in 2009. The latter was a year with more births than
2010 (117,439 in 2009 versus 114,551 live births in 2010) and therefore the infant deaths that
were recorded in 2010 (434) were more numerous than those corresponding to the births of
2010, thus giving an inflated IMR (3.8‰). The opposite is the case with the IMR of 2008,
which was a year with considerably more birth than 2007 (117,913 vs 111,517). The
conventional IMR for 2008 was low (2.7‰) reflecting the fluctuation of births from one year
to another. A more reliable method to calculate IMRs is to use data for three consecutive
years so as to reduce the effect of any fluctuation of births from one year to another. By
employing this method in our analysis, the national infant mortality rate does not increase
between 2009-11 and 2012-14. The only change that might be attributed to the economic
crisis is that most Regions raised their IMR in this period, although the national IMR was not
raised. It is the Region of Attica (which makes up 35.4% of the country’s population) together
with three more Regions (Thessaly, Central Greece and Euboea, and the Ionian islands) that

Gavalas V. / European Journal of Geography 9 1 6–22 (2018)
European Journal of Geography-ISSN 1792-1341 © All rights reserved 21
achieved some improvements in IMR in the period between 2009-11 and 2012-14 and
balanced out the negative developments in the rest of the Regions (table 1).
Despite these geographical variations and the negative effects of the recent and ongoing
economic crisis, in the long run (1981-2014) there was a spectacular drop in infant mortality
and this drop, in conjunction with the reduced regional variations since 1981, is evidence of
improvements in the socio-economic status of the population and a more homogeneous
access to health services irrespective of the region that someone lives. The only dark spot is
the period 2009-2014, where regional variations in infant mortality increased and the national
rate of infant mortality did not record any reductions. It remains to be seen whether in the
immediate future infant mortality resumes its descending trend or the effects of the economic
crisis in the health system of Greece become even more acute.
However, one should not overlook the progress that has been achieved in the last 35 years
in the National Health System of Greece. The continuous descending course of regional
variations in mortality, in conjunction with the constant increase in life expectancy at birth, is
evidence that the health system in Greece has become more effective and more accessible to
everyone across the country. From the 1980s onwards standard deviation around the national
mortality rate has declined from 21.6 to 11.3 in the Regional level. In 1981 the Region with
the highest mortality had had 60% higher mortality than the national average. In 2014 the
Region with the highest mortality, which happens to be the same all over the examined period,
that of North Aegean, recorded only 15% higher mortality than the national average. This
achievement implies great efforts to improve the health services in remote place of Greece,
and especially in the islands. A study focused on the regional hospitals and health centers and
their effectiveness throughout the last 40 years would shed more light on this issue.
REFERENCES
Agorastakis, M. 2009. Regional variations and inequalities of life expectancy at birth in
Greece (1991-2006). In Minutes of the 2nd Panhellinic Conference on Planning and
Regional Development, eds. B. Kotzamanis, A. Kougkoulos, I. Beriatos, D. Oikonomou,
G. Petrakos, 1391-1403. Volos: University of Thessaly Press
Androulaki, E. 2007a. The regional dimensions of mortality in Greece [in Greek]. Discussion
Paper Series. EDKA, 8: 1-32. URL-link: http://www.demography-
lab.prd.uth.gr/ANDROULAKI_H%20PERIFEREIAKH%20DIASTASH%20THS%20T
HNISISMOTHTAS.pdf (Accessed 26 September 2017).
Androulaki, E. 2007b. The long-term course of mortality in Greece [in Greek]. Discussion
Paper Series. EDKA, 9: 1-36. URL-link: http://www.demography-
lab.prd.uth.gr/abstract/ANDROULAKI_H%20DIAXRONIKH%20EXELIXH%20TH %2
0THNISISMOTHTAS_no9.pdf (Accessed 26 September 2017).
ELSTAT 2015a. Natural movement of the population of Greece. URL-link:
http://dlib.statistics.gr/portal/page/portal/ESYE/categoryyears?p_cat=10007865&p_topic
=10007865 (Accessed 10 June 2016).
ELSTAT 2015b. Mid-year estimates of the population of Greece. URL-link:
http://www.statistics.gr/el/statistics/-/publication/SPO18/- Accessed 10 June 2016
ELSTAT 2016a. Labour Market Indicators 2001-2016. Population 15+. URL-link:
http://www.statistics.gr/el/statistics/-/publication/SJO01/- (Accessed 15 March 2016).
ELSTAT 2016b. Per capita GDP 1995-2015. URL-link: http://www.statistics.gr/el/statistics/-
/publication/SEL33/- (Accessed 15 March 2016).

Gavalas V. / European Journal of Geography 9 1 6–22 (2018)
European Journal of Geography-ISSN 1792-1341 © All rights reserved 22
ELSTAT 2017a. Physicians and dentists per geographical area and Prefecture. URL-link:
http://www.statistics.gr/el/statistics/-/publication/SHE09/- (Accessed 12 January 2017).
ELSTAT, 2017b. Hospitals, clinics and hospital beds per Region. URL-link:
http://www.statistics.gr/el/statistics/-/publication/SHE06/- (Accessed 12 January 2017).
Gavalas, V. 2015. The world we have gained: Population Geography of modern Greece [in
Greek]. Mytilene: Reprographics.
Iconomou, C. 2011. A microeconomic assessment of Greece’s core-periphery imbalances
(1994-2002) confirming Krugman’s initial new economic geography model. European
Journal of Geography: 2(2): 62-78.
Kentikelenis, A., Karanikolos, M., Revees, A., McKee, M., Stuckler, D. 2014. Greece's health
crisis: from austerity to denialism. The Lancet: 9918 (383): 748-753.
Papadakis, M. and Tsimpos, K. 2004. Demographic Analysis [in Greek]. Athens: Stamoulis.
Papastergiou, P., Rachiotis, G., Polyzou, K., Zilidis, C., Hadjichristodoulou, C. 2008.
Regional differences in mortality in Greece (1984–2004): The case of Thrace. BMC
Public Health: 8(297): 1-5.
Petrakos, G. 2009. Regional inequalities and selective development: the spatial economic
dynamics and the conditions of a regional policy making [in Greek]. In 25 papers for
Spatial planning and development, eds. G. Petrakos, H. Beriatios, H. Kokosis, B.
Kotzamanis, 359-393. Volos: University of Thessaly Press.