long-term trends in uk employment: 1861 to 2018
TRANSCRIPT

Page 1 of 20
Next release: 18 July 2019
Release date: 29 April 2019
Contact: Blessing Chiripanhura and Nikolas Wolf [email protected] +44 (0)1633 582512
Compendium
Long-term trends in UK employment: 1861 to 2018Examines the long-term trends in UK employment and provides the historical and legislative context behind some of the trends. Includes analysis by various components, such as industrial sector, sex, full-time and part-time employment, private and public sector employment, as well as employee and self-employed.
Table of contents
1. Main points
2. Introduction
3. Legislative changes
4. Trends of the employment rate
5. The evolution of sectoral distribution of employment
6. Women’s labour market participation
7. Full-time and part-time working (1984 to 2018)
8. Public and private sector employment
9. Employees and self-employed workers
10. Implications and conclusions
11. References
12. Annex 1: Main changes to the UK’s employment institutions and laws since 1860
13. Annex 2: Description of the main data source

Page 2 of 20
1 . Main points
The highest employment rates recorded were in the years 1872, 1943 and 2018, at 76% of the working age population; the lowest rate was 61% recorded in 1932, during the Great Depression.
The labour market participation of women increased over time to reach a record high of 74.2% in 2018; the increase was driven by change in social norms and employment and equality legislation, and structural change in the economy.
Patterns of employment have changed over time: manufacturing employment declined drastically from the 1960s onwards, and services sector employment increased significantly over the same period.
Private and public sector employment have both shown upward trends, though the private sector remains the dominant employer; the decline in public sector employment during the 1980s and 1990s was due largely to privatisation of the economy affecting public corporations.
Self-employment increased at a faster rate from 1979 onwards, to reach the record high of 15% of total employment in 2016.
2 . Introduction
The labour market plays an important role in allocating workers to jobs. It also affects the distribution of earnings and therefore income. Understanding the labour market is important for understanding economic and social changes. The study of long-term employment dynamics will therefore help put current trends into their historical perspective.
This article takes as its background the major changes in the laws and institutions that were introduced between 1860 and 2018 (see Annex 1). The data used for the analysis are mainly from the Bank of England’s Millennium
. Other long-term economic data are being catalogued as part of the Economic Statistics of Macroeconomic DataCentre of Excellence (for more information, see the ).data inventory report (PDF, 1.36MB)
3 . Legislative changes
The 19th and 20th centuries saw significant changes in many aspects of legislation that in turn contributed to significant shifts in the labour market. The interplay of these changes is complex and beyond the scope of this article, but a more detailed summary of these changes can be found in Annex 1. However, the most important changes can be summarised as follows:
the 19th century saw changes to education policy and the legalisation of trades unions
the early 20th century brought with it the beginning of the modern welfare state and widening of educational opportunities
the immediate post-war period witnessed the establishment of an expanded welfare state
the later-half of the 20th century saw the passing of significant legislation to tackle gender and racial discrimination and disadvantage
more recently, times have seen the introduction of the National Minimum Wage and National Living Wage, in addition to policies to promote flexible working

Page 3 of 20
1.
Alongside the legislative reforms have been huge changes in society, many connected with gender. Ideas of gender roles have shifted dramatically and while issues such as the gender pay gap remain, the situation for today’s workforce is significantly different compared with the past.
It is against this backdrop of a changed legislative and social environment that the changes in the labour market should be considered.
4 . Trends of the employment rate
Figure 1 shows the employment rate since 1861 . The employment rate is, in the long run, affected by 1
developments in educational attainment and wider economic policy. Because of the sensitivity of the employment rate to business cycles, its movement clearly indicates the periods of economic booms and busts. What is striking in Figure 1 is the high increase in employment during World War 1 and World War 2.
Figure 1: Employment rate, UK, 1861 to 2018
Source: Bank of England - A Millennium of Macroeconomic Data
Notes:
Although the long-term employment data plotted in Figure 1 are continuous, they do not come from a single source. The series are a composite of several data sources as explained in Annex 2. Further discussion of how the series were derived and the underlying assumptions and processes are contained in the Millennium of Macroeconomic Data.

Page 4 of 20
1.
The highest employment rates recorded were in the years 1872, 1943 and 2018, at 76% of the working age population. During the inter-war years (1919 to 1938), the employment rate averaged 64%, in part reflecting a much more subdued economic outlook. Between 1946 and 1970, the average employment rate was 73%. The lowest rates were during the Great Depression, where it reached a low of 61%, followed by the early 1980s recession at 66%.
Notes for: Trends of the employment level and rate
The Millennium of Macroeconomic Data has two series of employment: one measuring the employment of people aged 16 years and over, and another measuring the employment of people aged 16 to 64 years. We use the 16 years and over series because it accounts for changes in the labour market over time. The employment rate, in line with the international conventions, is based on the age group 16 to 64 years and measures the extent to which available labour resources are used (employed). It is calculated as a ratio of the number of people aged 16 to 64 years who are employed to the working age population.
5 . The evolution of sectoral distribution of employment
This section presents an examination of the sectoral distribution of employment over time. The sectors of the economy are categorised into the following three sectors :1
primary (primarily agriculture and mining)
secondary (primarily manufacturing and construction)
tertiary (services)
The sum of employment in the three categories produces the total employment in the economy. So, the shares of employment sum up to one (or 100%).
Figure 2a shows the employment shares of the three sector categories over time. It shows that since 1920, the largest proportion of workers were employed in the tertiary sector, followed by the secondary and primary sectors respectively.

Page 5 of 20
1.
Figure 2a: UK sectoral shares of employment, 1920 to 2016
Source: Bank of England - A Millennium of Macroeconomic Data
Notes:
A structural break was included for the period 1939 to 1947 as data were not available.
The primary sector share of employment decreased consistently over time, from 14.3% in 1920 to 1.3% in 2016. Secondary and tertiary sector employment shares were 34.2% and 51.5% in 1920, respectively. From 1966 onwards, the tertiary sector share of employment increased significantly to reach 83.6% of total employment in 2016. Over the same period, the secondary sector share of employment decreased to reach 15.1% of total employment in 2016. These changes show how the UK economy evolved to become more services-sector driven.
A more detailed representation of the UK’s sectoral shares of employment can be shown by a disaggregation into its various subcategories. This helps us to understand the main driving factors behind the trends in primary, secondary and tertiary sectors. Figure 2b shows the employment shares disaggregated into 11 subsectors over time.

Page 6 of 20
1.
1.
Figure 2b: UK sectoral shares of employment disaggregated by subsector, 1920 to 2016
Source: Bank of England - A Millennium of Macroeconomic Data
Notes:
In the diagram, agriculture, forestry and fishing, and mining and quarrying have been combined to form the "primary sectors". The gas, electricity and water sector is very small relative to other sectors and has been suppressed.
The manufacturing sector drove the overall decline in secondary sector employment shares, decreasing from an average of 25% during the inter-war years to an average of 9.5% between 2000 and 2016. The growth in the tertiary sector share of employment was driven mainly by growth in the following two subsectors:
professional, scientific and technical services including education and health, from an average of 13.8% between 1960 and 1979, to 27.2% between 2000 and 2016
miscellaneous services, including hotels and catering, from an average of 10.9% between 1960 and 1979, to an average of 21.23% between 2000 and 2016
Notes for: The evolution of sectoral distribution of employment
The primary sector consists of the following sub-sectors: agriculture, fisheries and forestry, and mining and quarrying; the secondary sector consists of manufacturing, construction and gas, electricity and water; and the tertiary or services sector is made up of transport, storage information and communication, retail and wholesale distribution, insurance, banking and finance, public administration and defence, professional, scientific and technical services (including education and health), and miscellaneous services, including hotels and catering.

Page 7 of 20
6 . Women’s labour market participation
The employment patterns of women in the UK have changed significantly. For instance, according to the 1911 Census, about 28% of all women in England and Wales worked in domestic service.
Women’s employment changed significantly during the two world wars, and they played vital roles in war-related industries like the production of ammunition. While 23.6% of women were employed in 1914 (Anitha and Pearson, 2013), this increased to 36% in 1918. At the peak of World War 2, up to 90% of single women aged 18 to 40 years were engaged in national service activities. Therefore, the world wars transformed the structure of the labour market, creating opportunities for women in sectors that were formerly dominated by male employment.
Outside periods of war, women’s position in the labour market was more marginal. A combination of explicit rules and social norms meant that women faced limited opportunities to work, and where work was available it was often less well paid.
Since World War 2, the position of women in the labour market has changed radically. Industrial changes, incremental improvements in legislation and shifting social attitudes have all contributed to a significant increase in female participation in the labour market. Table 1 shows the number of women aged 16 years and over who were engaged in economic activity between 1951 and 2018 (in 10-year averages). It shows that female economic activity increased by nearly 2.5 times over the period 1951 to 2018.
Table 1: Number of economically active women over time, UK, 1951 to 2018
Period Number economically active women
1951 to 1960 6.91 million
1961 to 1970 8.35 million
1971 to 1980 10.12 million
1981 to 1990 11.7 million
1991 to 2000 12.72 million
2001 to 2010 13.99 million
2011 to 2018 15.35 million
Source: Anitha and Pearson (2013) and Office for National Statistics - Labour Force Survey
We can learn more about women’s labour market participation by comparing female and male participation rates over time. Figure 3 shows a comparison of the participation rates between 1971 and 2018. The participation of women increased steadily over time, from 55.5% in 1972 to 74.2% in 2018. Although male participation remained higher, it fell from a high of 94.9% in 1971 to 83.7% in 2018.

Page 8 of 20
Figure 3: Participation rates of men and women (aged 16 to 64 years), UK, seasonally adjusted, 1971 to 2018
Source: Bank of England - A Millennium of Macroeconomic Data
Figure 3 shows that the gap between female and male participation rates has been declining since the 1970s, driven by the increase in the number of women joining the labour force. The lowest ever gap of 9.5 percentage points occurred in 2018.
7 . Full-time and part-time working (1984 to 2018)
People in employment are often categorised based on whether they work on a part-time or full-time basis. The data for these series disaggregated by sex are available from 1984 and are illustrated in Figures 4a and 4b. Figure 4a shows the ratio of female to male full-time workers and shows an upward trend. This was driven by the growing number of women in full-time employment. The annual average growth rate of female full-time employment between 1984 and 2018 was 1.4%, while that of men was 0.3% over the same period. Between 2012 and 2018, female full-time employment grew by an average 2.1% per annum.

Page 9 of 20
Figure 4a: Ratio of female to male workers working on a full-time basis, UK, seasonally adjusted, 1984 to 2018
Source: Office for National Statistics - Labour Force Survey

Page 10 of 20
Figure 4b: Ratio of female to male workers working on a part-time basis, UK, seasonally adjusted, 1984 to 2018
Source: Office for National Statistics - Labour Force Survey
Figure 4b shows the ratio of female to male part-time workers and shows a downward trend over time. Although the number of women working on a part-time basis increased over time, the annual average growth between 1984 and 2018 (1.1%) was lower than that of men working on a part-time basis over the same period (3.9%). The different growth rates caused the ratio to decline over time. However, total part-time employment had an upward trend over the whole period.
The share of full-time employment taken by women has increased over time from 29.0% in 1984 to 37.6% in 2018. Legislative and cultural change are likely to be factors here, just as they contributed to overall rises in employment.
Historically, women have dominated part-time employment. In 1984, they accounted for 87.3% of part-time workers. While still in the majority, that proportion fell to 73.3% in 2018. Several factors explain the fall, including:
a rise in the age of women having their first child
an increase in the population (and especially that of younger women in the workforce)
the introduction of childcare vouchers and other legislative changes that facilitate mothers’ working on a full-time basis

Page 11 of 20
8 . Public and private sector employment
Employment can also be categorised as private or public sector employment. Figures 5a and 5b show the private and public sector employment levels over the period 1855 to 2018 respectively. The figures show that workers have predominantly been employed in the private sector.
In 1855, private sector employment amounted to 10.9 million workers. In that year, private sector employment constituted 96% of all employment. By 2018, it reached its highest level of 27 million, making up 83.5% of all employment. Between 1983 and 2018, the private sector experienced significant growth, increasing by 57.4%.
Figure 5a: Private sector employment, UK, 1855 to 2018
Source: Bank of England - A Millennium of Macroeconomic Data
Page 12 of 20
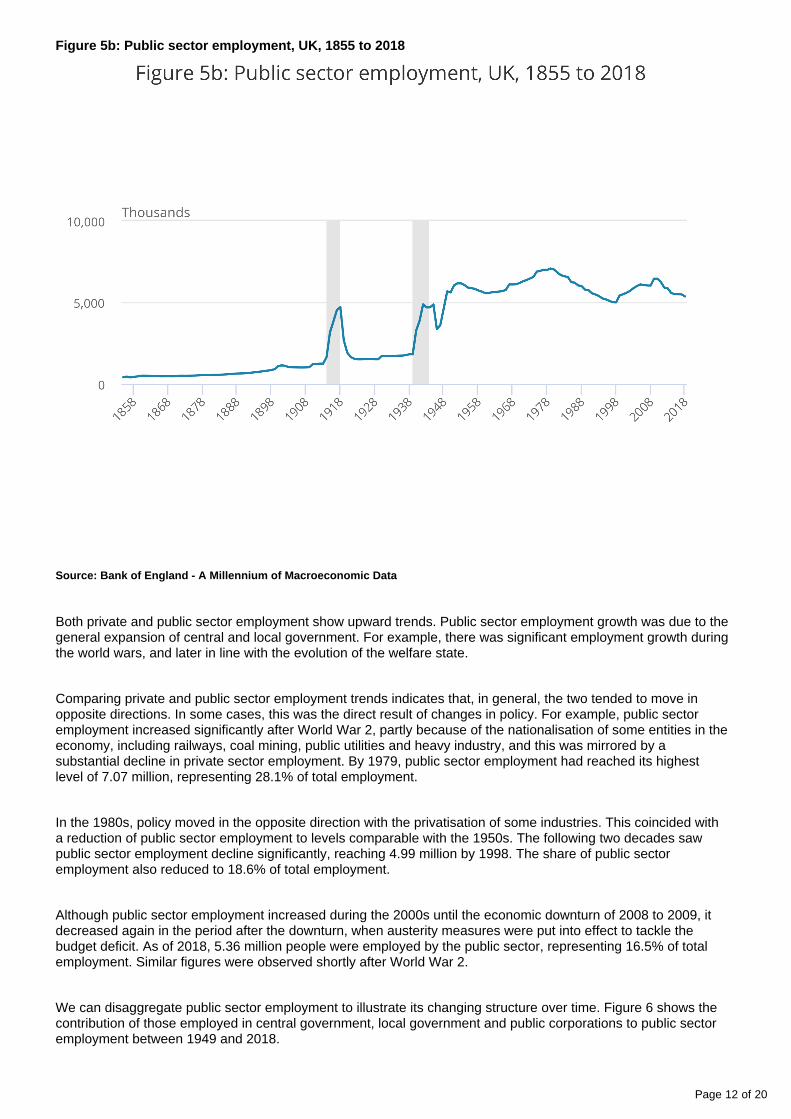
Figure 5b: Public sector employment, UK, 1855 to 2018
Source: Bank of England - A Millennium of Macroeconomic Data
Both private and public sector employment show upward trends. Public sector employment growth was due to the general expansion of central and local government. For example, there was significant employment growth during the world wars, and later in line with the evolution of the welfare state.
Comparing private and public sector employment trends indicates that, in general, the two tended to move in opposite directions. In some cases, this was the direct result of changes in policy. For example, public sector employment increased significantly after World War 2, partly because of the nationalisation of some entities in the economy, including railways, coal mining, public utilities and heavy industry, and this was mirrored by a substantial decline in private sector employment. By 1979, public sector employment had reached its highest level of 7.07 million, representing 28.1% of total employment.
In the 1980s, policy moved in the opposite direction with the privatisation of some industries. This coincided with a reduction of public sector employment to levels comparable with the 1950s. The following two decades saw public sector employment decline significantly, reaching 4.99 million by 1998. The share of public sector employment also reduced to 18.6% of total employment.
Although public sector employment increased during the 2000s until the economic downturn of 2008 to 2009, it decreased again in the period after the downturn, when austerity measures were put into effect to tackle the budget deficit. As of 2018, 5.36 million people were employed by the public sector, representing 16.5% of total employment. Similar figures were observed shortly after World War 2.
We can disaggregate public sector employment to illustrate its changing structure over time. Figure 6 shows the contribution of those employed in central government, local government and public corporations to public sector employment between 1949 and 2018.

Page 13 of 20
Figure 6: Contributions to public sector employment, UK, 1949 to 2018
Source: Bank of England - A Millennium of Macroeconomic Data
Figure 6 shows that, since 1949, the composition of public sector employment has changed significantly. Public corporations’ contribution to public sector employment decreased, while the contribution of central government increased. The contribution of local government increased until 2000. Since then, it has been on a downward trend.
Between 1979 and 1998, the contribution of public corporations to public sector employment decreased from 27.7% to 7.1%. This indicates that the fall in public sector employment from the 1980s onwards was driven largely by reductions in employment by public corporations.
9 . Employees and self-employed workers
The final categorisation we will explore in this article is the split between employees and self-employed workers . 1
The choice of working arrangement has implications for both the earnings and work-life balance of an individual. In general, employees have higher job security and earn more than self-employed workers. Self-employed workers often have greater working flexibility. Self-employment can also allow people who would otherwise be inactive to enter or remain in the labour force. For instance, some older workers may prefer to join self-employment than to retire.
Figure 7 shows the trend of employees between 1862 and 2018 . It shows that the number of employees had an 2
upward trend, and the short-term changes were sensitive to business cycles. The growth in the number of employees was strong between 1861 and 1916. The growth during the inter-war years was interrupted by the decreases in employee level shortly after World War 1, as well as during the Great Depression.

Page 14 of 20
Figure 7: Number of employees, UK, 1861 to 2018
Source: Bank of England - A Millennium of Macroeconomic Data
Over the period 1946 to 1980, the number of employees increased at a moderate rate. Between 1980 and 1984, there was a sharp decline in the number of employees, and this coincided with the economic downturn experienced in the early 1980s. Since then, the number of employees has shown an upward trend, reaching a peak of 27.49 million in 2018.
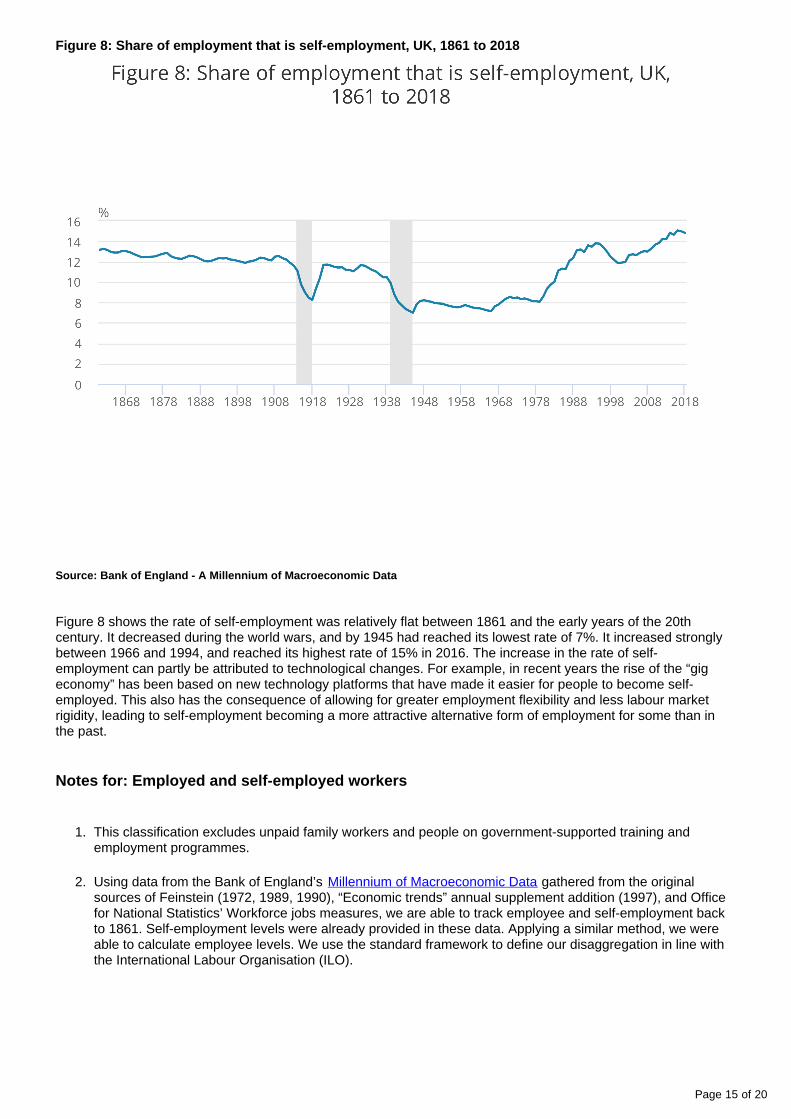
Figure 8 shows the rate of self-employment between 1861 and 2018, that is, the proportion of total employment that is self-employed. It is worth mentioning that self-employment is not a modern concept; there has been a reasonable share of self-employment in the economy since records began in the mid-19th century.
Page 15 of 20
1.
2.
Figure 8: Share of employment that is self-employment, UK, 1861 to 2018
Source: Bank of England - A Millennium of Macroeconomic Data
Figure 8 shows the rate of self-employment was relatively flat between 1861 and the early years of the 20th century. It decreased during the world wars, and by 1945 had reached its lowest rate of 7%. It increased strongly between 1966 and 1994, and reached its highest rate of 15% in 2016. The increase in the rate of self-employment can partly be attributed to technological changes. For example, in recent years the rise of the “gig economy” has been based on new technology platforms that have made it easier for people to become self-employed. This also has the consequence of allowing for greater employment flexibility and less labour market rigidity, leading to self-employment becoming a more attractive alternative form of employment for some than in the past.
Notes for: Employed and self-employed workers
This classification excludes unpaid family workers and people on government-supported training and employment programmes.
Using data from the Bank of England’s gathered from the original Millennium of Macroeconomic Datasources of Feinstein (1972, 1989, 1990), “Economic trends” annual supplement addition (1997), and Office for National Statistics’ Workforce jobs measures, we are able to track employee and self-employment back to 1861. Self-employment levels were already provided in these data. Applying a similar method, we were able to calculate employee levels. We use the standard framework to define our disaggregation in line with the International Labour Organisation (ILO).

Page 16 of 20
10 . Implications and conclusions
The analysis of the long-term trend of employment provides insights into the evolution of employment. At a headline level, employment rates today are not that different to those seen around 150 years ago. But in other respects, there have been notable events and changes:
employment has been sensitive to economic shocks and other events; periods of war increased employment, while economic downturns such as the Great Depression saw significant falls in the share of people in work
the sectoral composition of employment has changed radically, especially in the last 50 years or so, with manufacturing employment falling from around 25% to about 10% today; employment in the services sector now stands at over 80%
the employment patterns for women have changed significantly, as a combination of industrial change, legislation and shifting cultural attitudes have given women more opportunities; the gap between male and female participation rates has fallen by nearly three-quarters in the last 50 years
although most part-time workers are women, the gender split of part-time working has changed significantly since records began; this has been driven by both increasing numbers of men working part-time and more women working full-time
the number and share of workers in the public sector has increased many times in the last 150 years; most recently, the changes in public sector employment have been driven by changes in the welfare state and government policy on public ownership
'the share of' self-employment today is only a little above that seen 150 years ago, though it reached a low in the immediate post-war period
These trends and developments have been the cumulative result of changes in technology, industrial structure, legislation and social change. In that respect, the employment trends we describe have shown the changing socio-economic history of the UK.
11 . References
Airth-Kindree AVM (1987), ‘Munitionettes: British women in munitions during the First World War’, Verlag: University of Tulsa
Anitha S and Pearson R (2013), ‘ ’, Lincoln: University of LincolnStriking Women
Benjamin D and Levis K (1979), ‘Searching for an Explanation of Unemployment in Interwar Britain,’ Journal of Political Economy, volume 87, pages 441 to 478
Bowden S and Higgins DM (2004), ‘British industry in the interwar years’ in: Floud R and Johnson P (eds), The Cambridge Economic History of Modern Britain, volume 2: Economic Maturity, Cambridge, Cambridge University Press, pages 374 to 402
Broadberry S (1986), ‘Aggregate Supply in Interwar Britain,’ Economic Journal, volume 96, pages 467 to 481
Broadberry S and Crafts NFR (1990a), ‘The Impact of the Depression of the 1930s on the Productive Potential of the United Kingdom’, European Economic Review, volume 34, pages 599 to 607

Page 17 of 20
Clarke P (1996), ‘Hope and Glory: Britain 1900-1990’, London: Penguin
Denman, James and McDonald, Paul (1996) ‘Unemployment statistics from 1881 to the present day: Special ’, Labour Market Statistics Group, Central Statistical OfficeFeature (PDF, 2.8MB)
Eichengreen B (2002), ‘ ’, University of California, The British economy between the Wars (PDF, 285.4KB)Berkeley
Goetz SJ, Fleming DA and Rupasingha A (2012), ‘ ,’ The Economic Impacts of Self-Employment Journal of , Southern Agricultural Economics Association, volume 44, issue 3, pages 1 Agricultural and Applied Economics
to 7
McKinlay A and Zeitlin J (1989), ‘The Meaning of Managerial Prerogative: Industrial Relations and the Organisation of Work in British Engineering, 1880-1939,’ in: Harvey C and Turner J (eds), Labour and Business in Modern Britain, London: Cass, pages 32 to 47
Undy R (2012), ‘ ’, Britain at Work, London: TUC CollectionsTrade union organisation 1945 to 1995
12 . Annex 1: Main changes to the UK’s employment institutions and laws since 1860
Table 2: Changes to the UK’s employment institutions and laws since 1860

Page 18 of 20
Law Description
Trade Union Act, 1871 Trade Unions were legalised for the first time.
Factory Act, 1878 Prohibited work for children under 10 years of age in all trades.
Trade Disputes Act, 1906 Protected Trade Unions from being sued for damages during strike action.
The Old Age Pensions Act, 1908
Provided a State Pension for retired workers.
National Insurance Act, 1911
A levy was introduced to mobilise resources to give a benefit to people if they were unable to work.
Education Act, 1944 Protected female teachers from being dismissed upon marriage.
National Insurance Act, 1946
Laid the foundation of the welfare state and provided comprehensive benefits. Introduced an all-inclusive National Insurance scheme covering all male and female workers aged 15 years and over, including part-time workers. It provided for compulsory contributions for unemployment, sickness, maternity and widows’ benefits. It also provided for old age pensions from employers and employees, and instituted a comprehensive state health service, effective in 1948.
The National Assistance Act, 1948
It provided financial assistance for the unemployed and those who had not paid enough contributions into the National Insurance scheme. It also provided for the elderly who had not been paying into the National Insurance scheme during their lives, and established standardised minimal living conditions for the unemployed.
Factories Act, 1961 Consolidated much legislation on workplace health, safety and welfare in Great Britain.
Contracts of Employment Act, 1963
Introduced the right for workers to be given a contract of employment, and entitlement to a minimum statutory termination notice.
National Insurance Act, 1965
Consolidated the National Insurance Acts 1946 to 1964.
Redundancy Payments Act, 1965
Workers were given the right to a severance pay when they were made redundant after a qualifying work period.
Race Relations Act, 1965 Criminalised discrimination in education and employment based on race.
Equal Pay Act, 1970 (effective 1975)
Legislated equal pay for men and women performing similar jobs.
Industrial Relations Act, 1971
Introduced compensation for unfair dismissal.
1972 UK’s ascension to the European Union.
Trade Union and Labour Relations Act, 1974
Introduced rules on the functions of trade unions, their legal status and immunity when they take strike action in furtherance of a trade dispute.
Health and Safety at Work Act, 1974
Defined the central authority and structure for the regulation and enforcement of workplace health, safety and welfare.
Sex Discrimination Act, 1975
Criminalised discrimination in work, education or training based on sex or marital status.
Transfer of Undertakings (Protection of Employment) Regulations, 1981
Protected employees’ terms and conditions when a business or part of one, was transferred to a new employer.
The Equal Pay (Amendment) Act, 1985
Sought to ensure that women and men were paid the same for work of equal value.
1990 For the first time, married women were taxed separately from their husbands (that is, independent taxation of women).
Employment Act, 1990 Made all forms of closed shop union activity illegal.

Page 19 of 20
Trade Union and Labour Relations (Consolidation) Act, 1992
Defined trade union rights and responsibilities, provided a collective bargaining framework and protected striking workers.
Disability Discrimination Act, 1995
Protected disabled people in employment and in respect to access to services.
Pensions Act, 1995 Phased in the equalisation of State Pension ages for men and women over a 10-year period.
Employment Rights Act, 1996
Collated existing laws on individual employment rights.
Protection from Harassment Act, 1997
Gave protection from harassment, stalking and other forms of persistent conduct that may cause alarm and distress.
Data Protection Act, 1998 Governed the protection of personal data in the country.
Working Time Regulations, 1998
Introduced the right to paid holidays per year (20 days), breaks from work, and limits to excessively long working hours.
National Minimum Wage Act, 1998
Introduced a National Minimum Wage at £3.60 per hour (for people aged 21 years and over).
Human Rights Act, 1998 Incorporated the rights contained in the European Convention of Human Rights into UK law.
Maternity and Parental Leave Regulations, 1999
Guaranteed maternity leave for 52 weeks in total.
The Sex Discrimination (Gender Reassignment) Regulations, 1999
Prohibited employers from discriminating against transgender people.
Part-Time Workers (Prevention of Less Favourable Treatment) Regulations, 2000
Obliged employers to give part-time workers treatment that is comparable to that offered to people on full-time contracts doing the same jobs.
Fixed Term Workers (Prevention of Less Favourable Treatment) Regulations, 2002
Obliged employers to give people on fixed-term contracts comparable treatment to that given to people on permanent contracts doing the same jobs.
Paternity and Adoption Leave Regulations, 2002
Guaranteed fathers two weeks’ leave at the statutory rate of pay after the birth or adoption of a child.
Employment Equality (Sextual Orientation) Regulations, 2003
Introduced protection against discrimination based on (actual or perceived) sexual orientation.
Employment Act, 2003 Introduced the right to flexible working for parents with young and disabled children.
Employment Equality (Religious or Belief) Regulations, 2003
Protected against unlawful discrimination on grounds of religion or belief.
Employment Equality (Age) Regulations, 2006
Protected against unlawful discrimination on grounds of age.
Working Time (Amendment) Regulations, 2007
Increased the statutory minimum annual leave entitlement to 28 days.
Pensions Act, 2008 Came into effect incrementally from 2012 onwards. Introduced the right to automatic enrolment into a basic occupational pension scheme.
Equality Act, 2010 Collated existing anti-discrimination legislation.
Additional Paternity Leave Regulations, 2010
Allowed women to transfer up to 26 weeks of their maternity leave to their partners.

Page 20 of 20
Shared Parental Leave Regulations, 2014
Enabled eligible mothers, fathers, partners and adopters to choose how to share time off work after a child is born or placed for adoption.
Deduction from Wages (Limitation) Regulations, 2014
Limited the period over which claimants can seek to recover deductions from wages to a maximum of two years.
Modern Slavery Act, 2015
Introduced to tackle modern slavery by consolidating the offences relating to human trafficking and slavery.
13 . Annex 2: Description of the main data source
The Bank of England’s spreadsheet is large and contains a broad set of Millennium of Macroeconomic Datamacroeconomic and financial data stretching back to the 13th century. The underlying data were produced by Steve Broadberry, Bruce Campbell, Alex Klein, Mark Overton and Bas van Leeuwen (2015), and are included as a standalone section of the database. Although the data do not represent official Bank of England data or National Statistics and are considered as “work-in-progress”, they are the most comprehensive historical series available. The data are also the Bank of England’s contribution to the Economic Statistics Centre of Excellence (ESCoE) project on developing historical national accounts statistics.
The Bank of England spreadsheet is organised into annual, quarterly, monthly and weekly sections. The continuous time series for the main macroeconomic and financial aggregates link various historical components together using several assumptions. The annual series, of which we use, are based on separate and more reliable sources than higher frequency series and cover a wider range of data.
For employment data, the ultimate source prior to the Labour Force Survey (LFS) is the census but some of the data (from 1900 to 1953) were obtained from a secondary source (Feinstein (1972): National Income and Expenditure 1855 to 1965). For the period 1871 to 1900, the data were obtained by interpolating the census data for England and Wales, Scotland and Ireland separately (assuming a constant growth rate for each decade) and then adding them up. For the period 1953 onwards, Office for National Statistics data were used. This article makes use of labour market data from 1860 onwards because it is from that date that complete series exist for the main employment variables.
The Bank of England’s spreadsheet does not have disaggregated data for all Millennium of Macroeconomic Datathe variables we examine in this study. Such data are available from the 1970s, and for some variables, from the 1990s, from the Office for National Statistics. We use these data to illustrate how the labour market has changed over the past 40 years.