longitudinal associations of lifestyle factors and weight status with
TRANSCRIPT
RESEARCH Open Access
Longitudinal associations of lifestyle factorsand weight status with insulin resistance(HOMA-IR) in preadolescent children: thelarge prospective cohort study IDEFICSJenny Peplies1,2, Claudia Börnhorst1, Kathrin Günther1, Arno Fraterman3, Paola Russo4, Toomas Veidebaum5,Michael Tornaritis6, Stefaan De Henauw7, Staffan Marild8, Dénes Molnar9, Luis A. Moreno10,Wolfgang Ahrens1,2,11* and on behalf of the IDEFICS consortium
Abstract
Background: This study investigates prospective associations of anthropometrical and lifestyle indices with insulinresistance (IR) in European children from the IDEFICS cohort. Insulin resistance (IR) is a growing concern inchildhood obesity and a central aspect of the metabolic syndrome (MS). It most likely represents the link betweenobesity and type 2 diabetes.
Methods: This longitudinal study included 3348 preadolescent children aged 3 to 10.9 years from 8 Europeancountries who were observed from 2007/2008 to 2009/2010. The main outcome measure in the present analysis isHOMA-IR (homeostasis model assessment as a common proxy indicator to quantify IR) at follow-up and in itslongitudinal development. Anthropometrical measures and lifestyle indices, including objectively determinedphysical activity, were considered, among others factors, as determinants of IR. Prospective associations between IRat follow-up and anthropometrical and lifestyle indices were estimated by logistic regression models.
Results: Country-specific prevalence rates of IR in the IDEFICS cohort of European children showed a positive trendwith weight category. Prospective multivariate analyses showed the strongest positive associations of IR with BMIz-score (OR = 2.6 for unit change from the mean, 95 % CI 2.1–3.1) and z-score of waist circumference (OR = 2.2 forunit change from the mean, 95 % CI 1.9–2.6), which were analysed in separate models, but also for sex (OR = 2.2 forgirls vs. boys, 95 % CI 1.5–3.1 up to OR 2.5, 95 % CI 1.8–3.6 depending on the model), audio-visual media time (OR = 1.2for an additional hour per day, 95 % CI 1.0–1.4 in both models) and an inverse association of objectively determinedphysical activity (OR = 0.5 for 3rd compared to 1st quartile, 95 % CI 0.3–0.9 in both models). A longitudinal reduction ofHOMA-IR was accompanied with a parallel decline in BMI.(Continued on next page)
* Correspondence: [email protected] Institute for Prevention Research and Epidemiology – BIPS, Bremen,Germany2Faculty of Human and Health Sciences, Institute for Public Health andNursing Research, Bremen University, Bremen, GermanyFull list of author information is available at the end of the article
© 2016 The Author(s). Open Access This article is distributed under the terms of the Creative Commons Attribution 4.0International License (http://creativecommons.org/licenses/by/4.0/), which permits unrestricted use, distribution, andreproduction in any medium, provided you give appropriate credit to the original author(s) and the source, provide a link tothe Creative Commons license, and indicate if changes were made. The Creative Commons Public Domain Dedication waiver(http://creativecommons.org/publicdomain/zero/1.0/) applies to the data made available in this article, unless otherwise stated.
Peplies et al. International Journal of BehavioralNutrition and Physical Activity (2016) 13:97 DOI 10.1186/s12966-016-0424-4

(Continued from previous page)
Conclusions: This study is, to our knowledge, the first prospective study on IR in a preadolescent children’s population.It supports the common hypothesis that overweight and obesity are the main determinants of IR. Our data alsoindicate that physical inactivity and a sedentary lifestyle are likewise associated with the development of IR,independent of weight status. The promotion of physical activity should thus be considered as an equal option todietary intervention for the treatment of IR in the paediatric practice.
Keywords: Insulin resistance, HOMA-IR, Physical activity, Accelerometer, Obesity, Pre-pubertal children, Cohort study
Abbreviations: BIA, Bioelectrical impedance analysis; BMI, Body mass index; HOMA-IR, Homeostasis model assessmentto quantify insulin resistance; IDEFICS (acronym), Identification and prevention of dietary- and lifestyle-induced healtheffects in children and infants; IR, Insulin resistance; ISCED, International Standard Classification of Education;MS, Metabolic syndrome; MVPA, Time spent in moderate to vigorous physical activity; OR, Odds ratio; PA, Physicalactivity; SACINA, Self-administered children and infants nutrition assessment (a standardized 24-h recall method)
BackgroundInsulin resistance (IR), a reduced physiological response ofthe peripheral tissues to normal levels of insulin, is agrowing concern in childhood obesity, although not allobese people are insulin resistant and IR may also occurin nonobese children and adults [1]. IR is also a central as-pect of the metabolic syndrome (MS) and most likely alink between obesity and type 2 diabetes [2–6]. Given theconstantly growing prevalence of metabolic disorders inchildren and adolescents [7], it appears to be important toidentify children at risk before clinical symptoms occur.Several risk factors for IR have been suggested, e.g.
weight status [8], measures of central and peripheral adi-posity [9, 10], dietary factors such as intake of total fator saturated fat [11, 12], physical inactivity [13], poorphysical fitness [14], low or high birth weight for gesta-tional age [7, 15], and maternal factors like gestationaldiabetes [16] or unbalanced maternal nutrition [17].Nevertheless, in children, population-based epidemio-logical data on the determinants of IR are still rare andmostly available from cross-sectional studies. A recentreview [18] on the clustering of obesogenic behavioursin children or adolescents concluded that further re-search is needed particularly in younger children andfrom longitudinal studies.The prevalence of MS in children has recently been
described in a systematic review [19] that related to IRas one of several possible criteria of MS. Estimation ofprevalence in this review was not straightforward be-cause many different criteria had been used to defineMS in children. The median prevalence was overall3.3 % (range 0–19.2 %), 11.9 % (range 2.8–29.3 %) inoverweight children, and 29.2 % (range 10–66 %) inobese children, when studies in all ethnicities were con-sidered. For European children only, prevalence tendedto be slightly lower. Two new definitions of paediatricMS were also suggested by the IDEFICS (“Identificationand prevention of dietary- and lifestyle-induced healtheffects in children and infants”) study group [20], one
for monitoring purposes (with HOMA-IR ≥90th per-centile amongst other criteria) and one to define a cutpoint for clinical action (with HOMA-IR ≥95th percent-ile amongst other criteria). When HOMA-IR alone isconsidered prevalence proportions are usually higherthan those for MS [8, 21], but data from populationbased studies in children are still limited.The importance of metabolic health in the presence of
obesity has been of growing research interest in the lastyears. Metabolically healthy obesity is apparently associ-ated with lower levels of adiposity in youth [22, 23] anda high level of physical activity (PA) in adults [22, 23].Increased PA and cardiorespiratory fitness are also be-lieved to attenuate the risk of cardiovascular disease,type 2 diabetes, and MS, independent of weight status[24]. Physical fitness and physical activity are closely re-lated and have been shown to correlate well in children[25]. The Lancet Physical Activity Series working groupestimated that worldwide in 2008, physical inactivitycaused 6 % of the burden of disease from coronary heartdisease and 7 % of type 2 diabetes, as well as 9 % of pre-mature mortality [26]. A meta-analysis on the influenceof cardiorespiratory fitness and weight status on mortal-ity from all causes showed that overweight and obese fitindividuals had similar mortality risks as normal weightfit individuals. Compared to normal weight fit individ-uals, unfit individuals had twice the risk of mortality re-gardless of their body mass index (BMI) [27].The present study investigates the prospective associa-
tions between anthropometrical and lifestyle indices withIR in preadolescent European children. It also shows thedevelopment of HOMA-IR-values in relation to the lon-gitudinal development of weight status between the twoIDEFICS surveys.
MethodsStudy designIDEFICS is an Integrated Project within the 6th Frame-work Programme of the European Commission aimed at
Peplies et al. International Journal of Behavioral Nutrition and Physical Activity (2016) 13:97 Page 2 of 12
the investigation of diet- and lifestyle-related diseasesand their prevention. The baseline survey was conductedin the school year 2007/2008 and included 16,228 pre-school and primary school children aged 2 to 9 yearsfrom eight European countries. The survey comprisedanthropometrical measurements and examinations ofchildren as well as parental self-completion question-naires on lifestyle habits and dietary intakes of children.Biomarkers were analysed in blood, urine, and salivasamples. Standardised procedures were used by all sur-vey centres. Venous blood was collected from 9185 ofthe IDEFICS children. The majority of children were re-examined after 2 years during a follow-up survey (n =11,292 plus 2517 newly recruited children). The back-ground of the study, its research goals and instrumentshave been described elsewhere in detail [28].
Study sampleAfter exclusion of non-fasting children, children withdiagnosed diabetes, children who had missing data forwaist circumference or one of the laboratory analysesof interest, and children from Cyprus (due to the verysmall sample size that fulfilled the requirements),6970 and 6708 children remained in the data sets forbaseline and follow-up survey, respectively. Thepresent analyses are based on the 3348 children whowere part of both groups. For the prospective ana-lyses, also children with IR at baseline (HOMA-IR≥95th percentile, according to Peplies et al. [29]) wereexcluded, which further reduced the sample to 3125children. Due to missing information for some of thepotential risk factors or confounders, some analyseswere conducted in smaller samples (numbers are indi-cated in the tables). A selection effect could be ex-cluded as characteristics of subgroups (children withdata on sleep duration or children with accelerometerdata) only differed by the first or second decimalcompared to the whole study sample (data notshown).
Physical examinationThe physical examination programme during the twoIDEFICS surveys covered standard anthropometric mea-sures, i.e. height (SECA 225), weight (TANITA BC 420SMA), and circumferences of waist, hip, upper arm, andneck (SECA 200), as well as skinfold thicknesses (sub-scapular and triceps) (Holtain skinfold caliper), foot-to-foot bioelectrical impedance (TANITA BC 420 SMA),and the measurement of blood pressure and pulse rate(Welch Allyn 4200B) [28]. BMI was calculated as weight(in kg) divided by height squared (in m). Sex-specificBMI categories were interpolated for continuous age ac-cording to the extended IOTF criteria [30].
Sleep durationInformation on sleep duration was collected in the con-text of a standardised 24-h recall called SACINA (self-administered children and infants nutrition assessment).SACINA is a computer-based instrument filled out bythe parents/guardians of participating children with theassistance of a study nurse. Next to questions on dietaryintakes, parents were asked about their children’s get upand bed time (hour/minute) of the previous day. Sleepduration on weekday nights was calculated resulting in acontinuous estimate of sleep hours per night as de-scribed previously [31, 32].
Insulin resistanceFasting insulin and HOMA-IR (homeostasis model as-sessment to quantify IR) have been suggested amongothers as surrogate markers for screening purposes inadults [33]. The gold standard method to measure insu-lin sensitivity, the hyperinsulinemic euglycemic clamp, isinvasive and very labour- and time-intensive, and thusnot feasible in epidemiological research. Estimates of IRfrom HOMA-IR have been shown to correlate well withestimates from the clamp-technique [34], especially inhealthy populations [35]. IR was defined as HOMA-IR≥95th percentile, calculated for half year age groups [29].
Blood samplesChildren participating in the IDEFICS surveys wereasked to donate fasting venous blood samples. If con-sent was not given for venous blood withdrawal, ca-pillary blood was taken with the consent of theparents and children. For the present analyses, onlychildren with venous blood samples were included.Pre-analytical processing of blood samples was doneat the local survey centres or at local laboratories.Samples were frozen at −80 °C and shipped to a cen-tral laboratory (accredited according to ISO 15189)for later analysis. Details on the biological sampling pro-cedures can be obtained from a previous publication [36].Blood glucose was assessed on site at each study centre bypoint-of-care analysis using the Cholestech LDX analyser(Cholestech®, Hayward, CA, USA) either in venous orcapillary blood. Insulin was determined by electrochemilu-minescence immunoassay in the central laboratory.HOMA-IR was calculated as fasting insulin (μIU/ml) ×fasting glucose (mg/dl)/405.
Questionnaire dataData on education, lifestyle habits and dietary intakes ofchildren was retrieved from parental self-completionquestionnaires. Parental education was used as a proxyof socioeconomic status. It was coded country-by-country according to the International Standard Classifi-cation of Education (ISCED) [37]. For the analyses, the
Peplies et al. International Journal of Behavioral Nutrition and Physical Activity (2016) 13:97 Page 3 of 12
maximum ISCED level of both parents was considered.Media use was used as a proxy of sedentary behavior. Itwas described by the time spent with audiovisual media(hours/week) and the number of audiovisual media de-vices (TV, Computer, Internet connection, DVD player,Playstation, Game console) located in the child’s bed-room. For dietary assessment, propensity scores forsugar and fat consumption of children were developedfrom a parental food frequency questionnaire [38, 39].This questionnaire recorded the child’s consumption ofcertain obesity-promoting or -inhibiting food items froma given list of foods [40] on a typical week, excludingfoods provided in school or day care setting. Based onthe food frequency questionnaire, the estimation of en-ergy intake or total food intake was thus not possible. Acontinuous index was developed, using the total weeklyfrequency for high-sugar or high-fat items divided by theindividual’s total consumed food frequencies.
Physical activityActivity data (time-varying accelerations) of a subset ofparticipating children was recorded by uniaxial accelerom-eters (ActiGraph® GT1M or Actitrainer, LLC, Pensacola,FL, USA). Accelerometers were mounted on the righthip with an elastic belt ensuring close contact withthe body. Activity data was analysed on the basis of a60 s epoch. Included children had at least threemeasurement days and a minimum of 8 h of valid ac-celerometer wear time per day. Non-wear time wasassumed for 20 min of consecutive zero counts. Timespent performing either moderate or vigorous inten-sity of PA (average minutes over all valid recordingdays) was calculated according to the cut points pro-posed by Evenson [41]. A detailed description of IDE-FICS accelerometer data can be found elsewhere [42].
Quality assuranceAll measurements followed detailed standard operationprocedures (SOPs) which were pre-tested before thebaseline survey [43]. Field personnel from each studycentre participated in a central training course. Site visitswere conducted at all study locations during field sur-veys to check adherence to the SOPs. Questionnaireswere developed in English, translated to local languages,and checked for translation errors after back-translation.All technical equipment and laboratory materials werepurchased centrally to maximise comparability of data.Laboratory analyses were conducted at the central la-boratory which was accredited according to ISO 15189.
Statistical analysesData of parameters with normal distribution are pre-sented as mean values (± standard deviation); data of pa-rameters with skewed distributions are presented as
median (25th, 75th percentile). Normality of distributionwas assessed by the Kolmogorov-Smirnov test. Preva-lence of IR was calculated using the age- and sex-specific 95th percentile of HOMA-IR derived fromnormal weight IDEFICS children as cut off value foreach half year age group [29]. Furthermore, an age- andsex-specific z-score was calculated for HOMA based onthis healthy paediatric population. Delta z-IR was calcu-lated as the difference between the z-scores of HOMA-IR-values at T1 and T0 to depict the development ofHOMA-IR between the two surveys. Logistic regressionanalyses was limited to children without IR at T0, i.e. toall children with a HOMA-IR <95th percentile in theircorresponding half year age groups (cut-off ranged from1.5 to 2.9 for 3–9 year old girls and 1.3–2.7 for the re-spective boys) [29]. An indicator variable for presence ofHOMA-IR at follow-up (HOMA-IR above or below 95th
percentile) was defined as dependent variable for the lo-gistic regression analyses. Univariate logistic regressionanalyses were conducted for sex, age (continuous),ISCED-level, BMI, BMI z-score, z-score of waist circum-ference (continuous and in quartiles), audio-visual mediatime (in quartiles), number of media in bedroom (inquartiles), propensity scores for sugar and fat consump-tion (in quartiles), sleep duration (continuous), and foraccelerometer data as time spent in moderate to vigor-ous physical activity (MVPA, in quartiles) both, for allchildren and children with normal weight only. Multi-variate mixed logistic models were calculated separatelyfor the exposures BMI z-score and z-score of waist cir-cumference to avoid collinearity. Covariables were addedto the model if they were significant in the univariateanalysis for normal weight children, i.e. audio-visualmedia time (as continuous variable), sex, age, ISCEDlevel and time spend in MVPA (in quartiles). A randomcountry effect was included in the model to account forthe clustered study design. ‘Number of media in bed-room’ was dropped in favour of audio-visual media timeas both measure a similar construct, thus to avoid collin-earity. Even though no significant effect was seen for thenutritional covariables in the univariate analyses, fat con-sumption score (as continuous marker) was includedinto the model due to the biological connection of thechildren’s nutrition and the biological markers. Odds ra-tios (ORs) and 95 % confidence limits were calculatedfor all children and for boys and girls separately. All ana-lyses were performed using SAS® statistical software ver-sion 9.3 (SAS Institute, Inc., Cary, NC).
ResultsCharacteristics of the study population at baseline (T0)and during the follow-up survey (T1) are presented inTable 1. Values for all anthropometrical measurementsand biological markers of study participants were higher
Peplies et al. International Journal of Behavioral Nutrition and Physical Activity (2016) 13:97 Page 4 of 12
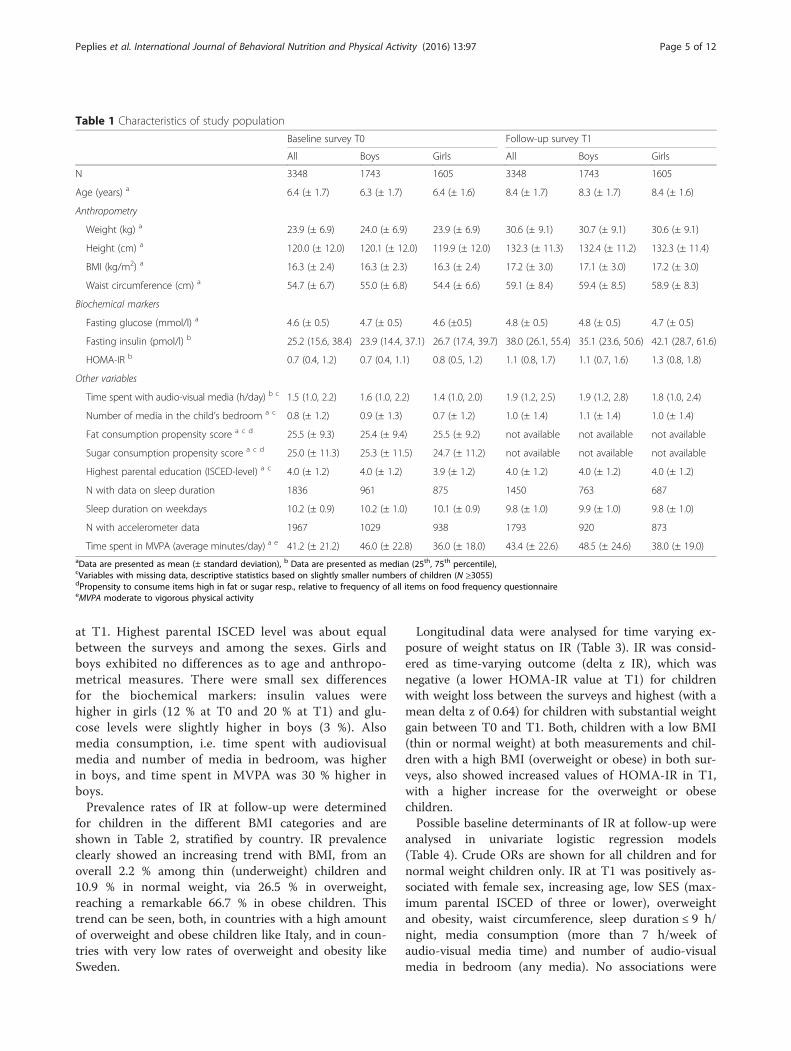
at T1. Highest parental ISCED level was about equalbetween the surveys and among the sexes. Girls andboys exhibited no differences as to age and anthropo-metrical measures. There were small sex differencesfor the biochemical markers: insulin values werehigher in girls (12 % at T0 and 20 % at T1) and glu-cose levels were slightly higher in boys (3 %). Alsomedia consumption, i.e. time spent with audiovisualmedia and number of media in bedroom, was higherin boys, and time spent in MVPA was 30 % higher inboys.Prevalence rates of IR at follow-up were determined
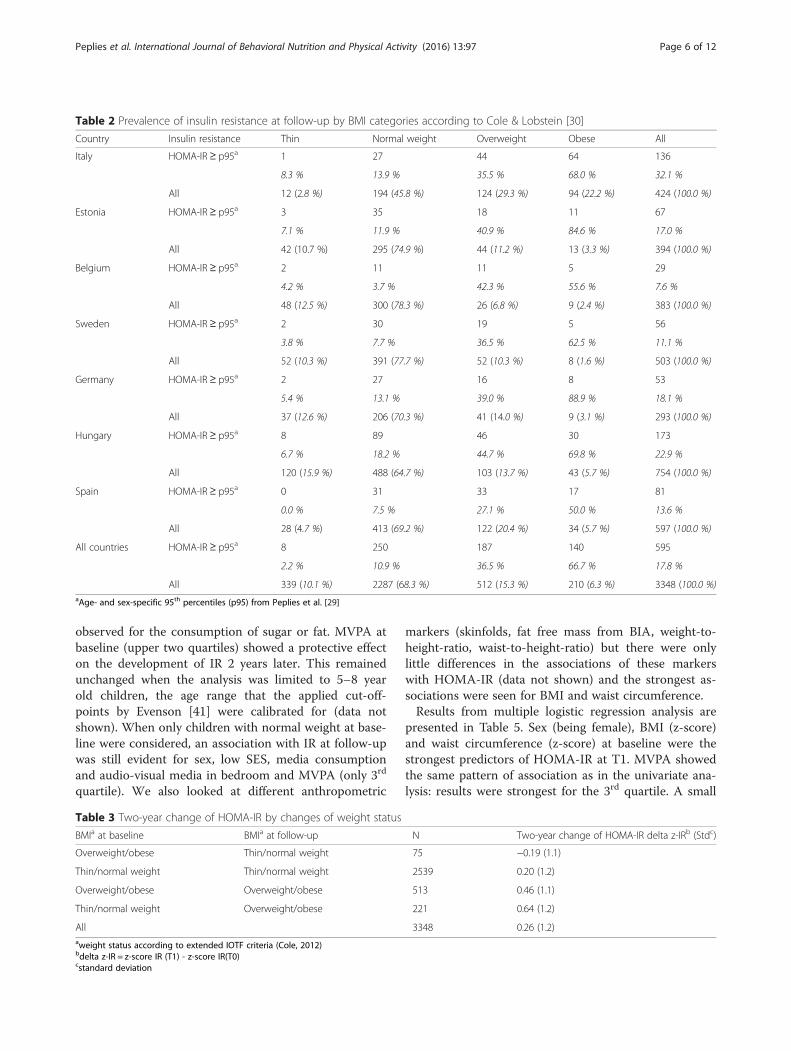
for children in the different BMI categories and areshown in Table 2, stratified by country. IR prevalenceclearly showed an increasing trend with BMI, from anoverall 2.2 % among thin (underweight) children and10.9 % in normal weight, via 26.5 % in overweight,reaching a remarkable 66.7 % in obese children. Thistrend can be seen, both, in countries with a high amountof overweight and obese children like Italy, and in coun-tries with very low rates of overweight and obesity likeSweden.
Longitudinal data were analysed for time varying ex-posure of weight status on IR (Table 3). IR was consid-ered as time-varying outcome (delta z IR), which wasnegative (a lower HOMA-IR value at T1) for childrenwith weight loss between the surveys and highest (with amean delta z of 0.64) for children with substantial weightgain between T0 and T1. Both, children with a low BMI(thin or normal weight) at both measurements and chil-dren with a high BMI (overweight or obese) in both sur-veys, also showed increased values of HOMA-IR in T1,with a higher increase for the overweight or obesechildren.Possible baseline determinants of IR at follow-up were
analysed in univariate logistic regression models(Table 4). Crude ORs are shown for all children and fornormal weight children only. IR at T1 was positively as-sociated with female sex, increasing age, low SES (max-imum parental ISCED of three or lower), overweightand obesity, waist circumference, sleep duration ≤ 9 h/night, media consumption (more than 7 h/week ofaudio-visual media time) and number of audio-visualmedia in bedroom (any media). No associations were
Table 1 Characteristics of study population
Baseline survey T0 Follow-up survey T1
All Boys Girls All Boys Girls
N 3348 1743 1605 3348 1743 1605
Age (years) a 6.4 (± 1.7) 6.3 (± 1.7) 6.4 (± 1.6) 8.4 (± 1.7) 8.3 (± 1.7) 8.4 (± 1.6)
Anthropometry
Weight (kg) a 23.9 (± 6.9) 24.0 (± 6.9) 23.9 (± 6.9) 30.6 (± 9.1) 30.7 (± 9.1) 30.6 (± 9.1)
Height (cm) a 120.0 (± 12.0) 120.1 (± 12.0) 119.9 (± 12.0) 132.3 (± 11.3) 132.4 (± 11.2) 132.3 (± 11.4)
BMI (kg/m2) a 16.3 (± 2.4) 16.3 (± 2.3) 16.3 (± 2.4) 17.2 (± 3.0) 17.1 (± 3.0) 17.2 (± 3.0)
Waist circumference (cm) a 54.7 (± 6.7) 55.0 (± 6.8) 54.4 (± 6.6) 59.1 (± 8.4) 59.4 (± 8.5) 58.9 (± 8.3)
Biochemical markers
Fasting glucose (mmol/l) a 4.6 (± 0.5) 4.7 (± 0.5) 4.6 (±0.5) 4.8 (± 0.5) 4.8 (± 0.5) 4.7 (± 0.5)
Fasting insulin (pmol/l) b 25.2 (15.6, 38.4) 23.9 (14.4, 37.1) 26.7 (17.4, 39.7) 38.0 (26.1, 55.4) 35.1 (23.6, 50.6) 42.1 (28.7, 61.6)
HOMA-IR b 0.7 (0.4, 1.2) 0.7 (0.4, 1.1) 0.8 (0.5, 1.2) 1.1 (0.8, 1.7) 1.1 (0.7, 1.6) 1.3 (0.8, 1.8)
Other variables
Time spent with audio-visual media (h/day) b c 1.5 (1.0, 2.2) 1.6 (1.0, 2.2) 1.4 (1.0, 2.0) 1.9 (1.2, 2.5) 1.9 (1.2, 2.8) 1.8 (1.0, 2.4)
Number of media in the child’s bedroom a c 0.8 (± 1.2) 0.9 (± 1.3) 0.7 (± 1.2) 1.0 (± 1.4) 1.1 (± 1.4) 1.0 (± 1.4)
Fat consumption propensity score a c d 25.5 (± 9.3) 25.4 (± 9.4) 25.5 (± 9.2) not available not available not available
Sugar consumption propensity score a c d 25.0 (± 11.3) 25.3 (± 11.5) 24.7 (± 11.2) not available not available not available
Highest parental education (ISCED-level) a c 4.0 (± 1.2) 4.0 (± 1.2) 3.9 (± 1.2) 4.0 (± 1.2) 4.0 (± 1.2) 4.0 (± 1.2)
N with data on sleep duration 1836 961 875 1450 763 687
Sleep duration on weekdays 10.2 (± 0.9) 10.2 (± 1.0) 10.1 (± 0.9) 9.8 (± 1.0) 9.9 (± 1.0) 9.8 (± 1.0)
N with accelerometer data 1967 1029 938 1793 920 873
Time spent in MVPA (average minutes/day) a e 41.2 (± 21.2) 46.0 (± 22.8) 36.0 (± 18.0) 43.4 (± 22.6) 48.5 (± 24.6) 38.0 (± 19.0)aData are presented as mean (± standard deviation), b Data are presented as median (25th, 75th percentile),cVariables with missing data, descriptive statistics based on slightly smaller numbers of children (N ≥3055)dPropensity to consume items high in fat or sugar resp., relative to frequency of all items on food frequency questionnaireeMVPA moderate to vigorous physical activity
Peplies et al. International Journal of Behavioral Nutrition and Physical Activity (2016) 13:97 Page 5 of 12
observed for the consumption of sugar or fat. MVPA atbaseline (upper two quartiles) showed a protective effecton the development of IR 2 years later. This remainedunchanged when the analysis was limited to 5–8 yearold children, the age range that the applied cut-off-points by Evenson [41] were calibrated for (data notshown). When only children with normal weight at base-line were considered, an association with IR at follow-upwas still evident for sex, low SES, media consumptionand audio-visual media in bedroom and MVPA (only 3rd
quartile). We also looked at different anthropometric
markers (skinfolds, fat free mass from BIA, weight-to-height-ratio, waist-to-height-ratio) but there were onlylittle differences in the associations of these markerswith HOMA-IR (data not shown) and the strongest as-sociations were seen for BMI and waist circumference.Results from multiple logistic regression analysis are
presented in Table 5. Sex (being female), BMI (z-score)and waist circumference (z-score) at baseline were thestrongest predictors of HOMA-IR at T1. MVPA showedthe same pattern of association as in the univariate ana-lysis: results were strongest for the 3rd quartile. A small
Table 2 Prevalence of insulin resistance at follow-up by BMI categories according to Cole & Lobstein [30]
Country Insulin resistance Thin Normal weight Overweight Obese All
Italy HOMA-IR≥ p95a 1 27 44 64 136
8.3 % 13.9 % 35.5 % 68.0 % 32.1 %
All 12 (2.8 %) 194 (45.8 %) 124 (29.3 %) 94 (22.2 %) 424 (100.0 %)
Estonia HOMA-IR≥ p95a 3 35 18 11 67
7.1 % 11.9 % 40.9 % 84.6 % 17.0 %
All 42 (10.7 %) 295 (74.9 %) 44 (11.2 %) 13 (3.3 %) 394 (100.0 %)
Belgium HOMA-IR≥ p95a 2 11 11 5 29
4.2 % 3.7 % 42.3 % 55.6 % 7.6 %
All 48 (12.5 %) 300 (78.3 %) 26 (6.8 %) 9 (2.4 %) 383 (100.0 %)
Sweden HOMA-IR≥ p95a 2 30 19 5 56
3.8 % 7.7 % 36.5 % 62.5 % 11.1 %
All 52 (10.3 %) 391 (77.7 %) 52 (10.3 %) 8 (1.6 %) 503 (100.0 %)
Germany HOMA-IR≥ p95a 2 27 16 8 53
5.4 % 13.1 % 39.0 % 88.9 % 18.1 %
All 37 (12.6 %) 206 (70.3 %) 41 (14.0 %) 9 (3.1 %) 293 (100.0 %)
Hungary HOMA-IR≥ p95a 8 89 46 30 173
6.7 % 18.2 % 44.7 % 69.8 % 22.9 %
All 120 (15.9 %) 488 (64.7 %) 103 (13.7 %) 43 (5.7 %) 754 (100.0 %)
Spain HOMA-IR≥ p95a 0 31 33 17 81
0.0 % 7.5 % 27.1 % 50.0 % 13.6 %
All 28 (4.7 %) 413 (69.2 %) 122 (20.4 %) 34 (5.7 %) 597 (100.0 %)
All countries HOMA-IR≥ p95a 8 250 187 140 595
2.2 % 10.9 % 36.5 % 66.7 % 17.8 %
All 339 (10.1 %) 2287 (68.3 %) 512 (15.3 %) 210 (6.3 %) 3348 (100.0 %)aAge- and sex-specific 95th percentiles (p95) from Peplies et al. [29]
Table 3 Two-year change of HOMA-IR by changes of weight status
BMIa at baseline BMIa at follow-up N Two-year change of HOMA-IR delta z-IRb (Stdc)
Overweight/obese Thin/normal weight 75 −0.19 (1.1)
Thin/normal weight Thin/normal weight 2539 0.20 (1.2)
Overweight/obese Overweight/obese 513 0.46 (1.1)
Thin/normal weight Overweight/obese 221 0.64 (1.2)
All 3348 0.26 (1.2)aweight status according to extended IOTF criteria (Cole, 2012)bdelta z-IR = z-score IR (T1) - z-score IR(T0)cstandard deviation
Peplies et al. International Journal of Behavioral Nutrition and Physical Activity (2016) 13:97 Page 6 of 12

Table 4 Determinants of IR (HOMA-IR ≥p95a) from univariate logistic regression analyses (children without IR at T0)
Children of all weight groups Normal weight children only
N % OR 95 % CI N % OR 95 % CI
Sex 3152 (all) 2297 (all)
Female 1508 47.8 1.5 1.3–1.9 1078 46.9 1.4 1.1–1.9
Male 1644 52.2 Ref. 1219 53.1 Ref.
Age (continuous, unit change from mean) 3152 (all) 1.2 1.1–1.3 2297 (all) 1.1 1.0–1.2
ISCED 3114 (all) 2269 (all)
Low (1–2) 215 6.9 2.6 1.9–3.6 135 6.0 2.2 1.4–3.5
Medium (3–4) 1563 50.2 1.8 1.4–2.3 1121 49.4 1.6 1.2–2.2
High (5–6) 1336 52.9 Ref. 1013 44.7 Ref.
BMI (Cole) 3152 (all)
Thin 362 11.5 0.5 0.3–0.9
Normal weight 2297 72.9 Ref.
Overweight 345 11.0 4.1 3.3–5.0
Obese 148 4.7 10.8 8.2–14.0
BMI z-score (Cole) 3152 (all)
1st Quartile (≤ −0.49) 813 26.2 0.7 0.5–1.1
2nd Quartile (−0.49 - ≤0.19) 802 25.6 Ref.
3rd Quartile (0.19 - ≤0.97) 811 23.1 1.2 0.9–1.8
4th Quartile (≥ 0.97) 726 25.1 4.9 3.7–6.6
BMI z-score (Cole) (unit change from mean) 3152 (all) 2.5 2.2–2.8
Waist z-score (Cole) 3152 (all)
1st Quartile (≤ −0.66) 826 26.2 0.8 0.5–1.2
2nd Quartile (−0.66 - ≤0.09) 791 25.1 Ref.
3rd Quartile (0.09 - ≤0.95) 808 25.6 1.5 1.0–2.1
4th Quartile (≥ 0.95) 727 23.1 5.7 4.1–7.7
Waist z-score (Cole) (unit change from mean) 3152 (all) 2.2 2.0–2.4
Audio-visual media time 3152 (all) 2297 (all)
≤1 h/day 1062 33.7 Ref. 774 33.7 Ref.
1 - ≤2 h/day 1221 38.7 1.4 1.1–1.9 899 39.1 1.4 1.0–2.1
2 - ≤3 h/day 603 19.1 1.7 1.3–2.3 439 19.1 1.8 1.2–2.6
>3 h/day 266 8.4 2.1 1.5–2.9 185 8.1 2.3 1.5–3.6
Media in bedroom 3090 (all) 2250 (all)
0 media 1902 61.5 Ref. 1429 63.5 Ref.
1–2 media 868 28.1 1.8 1.4–2.2 609 27.1 1.8 1.3–2.3
3 media 320 10.4 2.6 2.0–3.4 212 9.4 2.4 1.7–3.4
Sugar consumption propensity score (N = 3125)c 3152 (all) 2297 (all)
1st Quartile (≤ 16.9) 842 26.7 Ref. 625 27.2 Ref.
2nd Quartile (16.9 - ≤24.1) 832 26.4 1.0 0.8–1.4 557 24.3 1.0 0.7–1.5
3rd Quartile (24.1 - ≤32.4) 766 24.3 1.1 0.8–1.4 562 24.5 1.0 0.7–1.5
4th Quartile (≥ 32.4) 713 22.6 1.2 0.9–1.6 553 24.1 1.4 1.0–1.9
Peplies et al. International Journal of Behavioral Nutrition and Physical Activity (2016) 13:97 Page 7 of 12
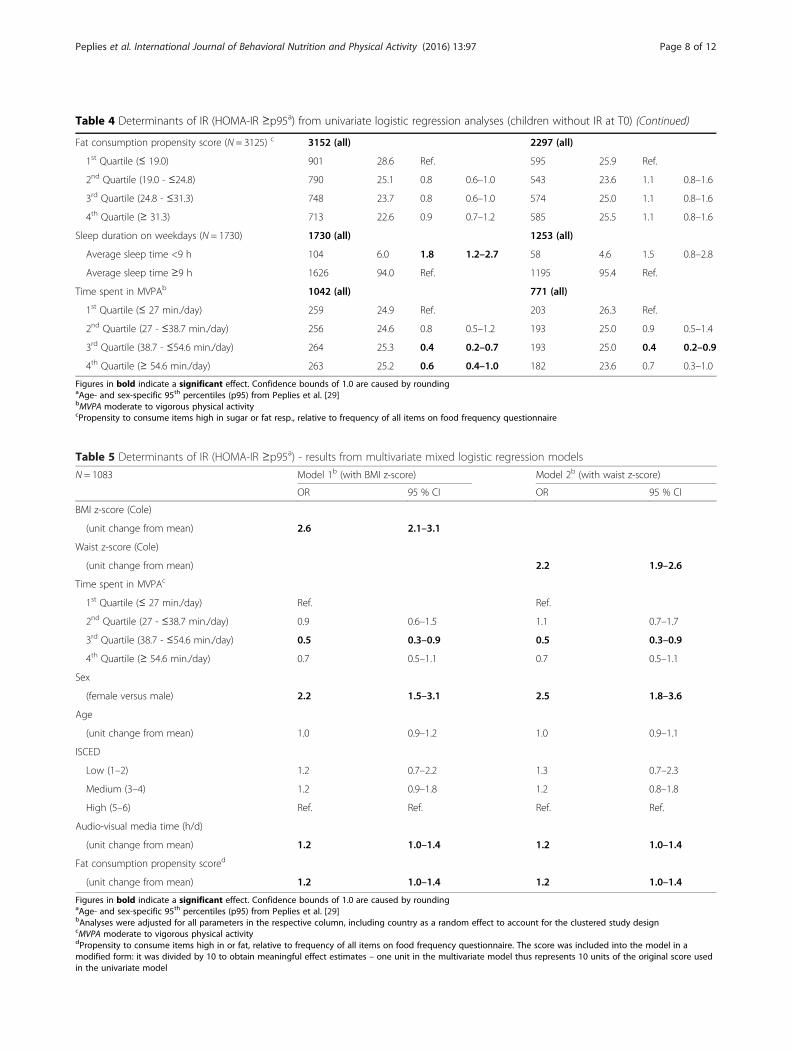
Table 4 Determinants of IR (HOMA-IR ≥p95a) from univariate logistic regression analyses (children without IR at T0) (Continued)
Fat consumption propensity score (N = 3125) c 3152 (all) 2297 (all)
1st Quartile (≤ 19.0) 901 28.6 Ref. 595 25.9 Ref.
2nd Quartile (19.0 - ≤24.8) 790 25.1 0.8 0.6–1.0 543 23.6 1.1 0.8–1.6
3rd Quartile (24.8 - ≤31.3) 748 23.7 0.8 0.6–1.0 574 25.0 1.1 0.8–1.6
4th Quartile (≥ 31.3) 713 22.6 0.9 0.7–1.2 585 25.5 1.1 0.8–1.6
Sleep duration on weekdays (N = 1730) 1730 (all) 1253 (all)
Average sleep time <9 h 104 6.0 1.8 1.2–2.7 58 4.6 1.5 0.8–2.8
Average sleep time ≥9 h 1626 94.0 Ref. 1195 95.4 Ref.
Time spent in MVPAb 1042 (all) 771 (all)
1st Quartile (≤ 27 min./day) 259 24.9 Ref. 203 26.3 Ref.
2nd Quartile (27 - ≤38.7 min./day) 256 24.6 0.8 0.5–1.2 193 25.0 0.9 0.5–1.4
3rd Quartile (38.7 - ≤54.6 min./day) 264 25.3 0.4 0.2–0.7 193 25.0 0.4 0.2–0.9
4th Quartile (≥ 54.6 min./day) 263 25.2 0.6 0.4–1.0 182 23.6 0.7 0.3–1.0
Figures in bold indicate a significant effect. Confidence bounds of 1.0 are caused by roundingaAge- and sex-specific 95th percentiles (p95) from Peplies et al. [29]bMVPA moderate to vigorous physical activitycPropensity to consume items high in sugar or fat resp., relative to frequency of all items on food frequency questionnaire
Table 5 Determinants of IR (HOMA-IR ≥p95a) - results from multivariate mixed logistic regression models
N = 1083 Model 1b (with BMI z-score) Model 2b (with waist z-score)
OR 95 % CI OR 95 % CI
BMI z-score (Cole)
(unit change from mean) 2.6 2.1–3.1
Waist z-score (Cole)
(unit change from mean) 2.2 1.9–2.6
Time spent in MVPAc
1st Quartile (≤ 27 min./day) Ref. Ref.
2nd Quartile (27 - ≤38.7 min./day) 0.9 0.6–1.5 1.1 0.7–1.7
3rd Quartile (38.7 - ≤54.6 min./day) 0.5 0.3–0.9 0.5 0.3–0.9
4th Quartile (≥ 54.6 min./day) 0.7 0.5–1.1 0.7 0.5–1.1
Sex
(female versus male) 2.2 1.5–3.1 2.5 1.8–3.6
Age
(unit change from mean) 1.0 0.9–1.2 1.0 0.9–1.1
ISCED
Low (1–2) 1.2 0.7–2.2 1.3 0.7–2.3
Medium (3–4) 1.2 0.9–1.8 1.2 0.8–1.8
High (5–6) Ref. Ref. Ref. Ref.
Audio-visual media time (h/d)
(unit change from mean) 1.2 1.0–1.4 1.2 1.0–1.4
Fat consumption propensity scored
(unit change from mean) 1.2 1.0–1.4 1.2 1.0–1.4
Figures in bold indicate a significant effect. Confidence bounds of 1.0 are caused by roundingaAge- and sex-specific 95th percentiles (p95) from Peplies et al. [29]bAnalyses were adjusted for all parameters in the respective column, including country as a random effect to account for the clustered study designcMVPA moderate to vigorous physical activitydPropensity to consume items high in or fat, relative to frequency of all items on food frequency questionnaire. The score was included into the model in amodified form: it was divided by 10 to obtain meaningful effect estimates – one unit in the multivariate model thus represents 10 units of the original score usedin the univariate model
Peplies et al. International Journal of Behavioral Nutrition and Physical Activity (2016) 13:97 Page 8 of 12
but significant increase of risk was also seen for audio-visual media time and fat consumption score. ISCED,age and country showed no influence on HOMA-IR inthe multivariate model.
DiscussionThis study shows a strong prospective association be-tween weight status and HOMA-IR in preadolescentEuropean children and a protective effect of MVPA. Itindicates that a longitudinal reduction of BMI also leadsto a decline in HOMA-IR and thus a favourable changein metabolic status. The study describes country-specificprevalence rates of IR in the IDEFICS cohort, showingan increasing trend of IR prevalence with BMI category.Prevalence proportions of IR found in our study
(10.9 % in normal weight, 26.5 % in overweight, 66.7 %in obese children) were in agreement with those re-ported in the literature, even though comparability islimited, because previous studies were based on olderchildren and used different definitions of IR. A Chileancohort of 10–15 year old children displayed prevalencevalues of 13 % in normal weight, 37.1 % in overweight,and 61.6 % in obese children, using HOMA-IR ≥ p90 ascut point for IR [21]. An US-American survey on 12–19year old adolescents [8] used a cut point of HOMA-IR≥p97.5, which resulted in prevalence values of about 4 %in normal weight, 16 % in overweight and 52 % in obeseUS-adolescents aged 12–19 years (data taken from fig-ure). As it was previously shown that insulin levels andthus also HOMA-IR levels show a peak round the age of13 to 14 years [44], slightly lower prevalence proportionsfor older adolescents are plausible.In our study, weight status and waist circumference at
baseline appeared as the main risk factors for IR atfollow-up, but sex and lifestyle indices (objectively deter-mined PA, fat consumption score, audio-visual mediatime, and media in bedroom) were also associated withincidence of IR. The age effect which was seen in theunivariate analysis can probably be attributed in largepart to the increase of overweight and obesity with age.The higher risk of IR in girls compared to boys also per-sisted when older children (>7 years at baseline) wereexcluded from the analysis to avoid possible influencesof early puberty. Fat consumption, as expressed by apropensity score [38, 39], was also connected with IRrisk in the multivariate model. The PA level of childrenin our study was rather low, and only a small proportionof children (24.2 % of the boys and 9.7 % of the girls)reached the daily activity level recommended by theWorld Health Organization (≥ 60 min/ day) [45]. Con-sidering this and the fact that accelerometer data wereonly available for about one third of the study popula-tion, the protective effect on IR found for MVPA is cer-tainly noteworthy, despite the lack of a clear trend.
The associations observed in this study confirm previ-ous findings, which however are mainly based on studiesin older children/ adolescents and on cross-sectionaldata. A Spanish cross-sectional study on cardiovascularrisk factors in 6 to 8 year-old schoolchildren found someof the same metabolic consequences of obesity as inadults (elevated triglycerides, insulin, HOMA-IR, andlower HDL-cholesterol) [46]. In a representative sub-sample of diabetes-free US-adolescents aged 12–19 yearswho participated in the National Health and NutritionExamination Survey (NHANES), obesity was by far themost important determinant of IR, independent of sex,age, or race/ethnicity, but data on PA was not includedin the analysis [8]. Subcutaneous adiposity was also themost significant covariate for HOMA-IR in a family-based US-American study, including children and ado-lescents from 6 years on [9]. A large insulin screeningstudy conducted on 10–14 year old children in a meth-odological context, using a blood spot assay on filterpaper, indicated associations of pubertal stage and mea-sures of central and peripheral adiposity with insulinlevel [10]. In the IDEFICS baseline survey, a low amountof physical activity was shown to be associated with acluster of CVD risk factors including IR [13]. In accord-ance with the evidence from our analysis, a few otherstudies published data on the association of dietary fac-tors like intake of total energy, total fat or saturated fatwith IR in children and adolescents [11, 12].When longitudinal change of HOMA-IR (delta z-IR)
was linked to overweight and obesity, children whoretained their low or normal weight until the follow-upsurvey showed a moderate increase of their IR z-score,while children who were overweight or obese in bothsurveys showed a stronger increase of their IR z-score.In both cases, the mean BMI increased within the de-fined weight groups. In the small group of children (N =75) who had changed to a lower weight group at follow-up, the delta z-IR values also declined. The highest gainin IR was seen for children who changed to a higherweight group.There is a solid body of evidence for the association of
obesity and physical inactivity with IR, especially inadults, but there is a controversy on whether the influ-ence of sedentary lifestyle on IR is mediated by obesity,whether both are independent predictors of this condi-tion, or whether the risk for IR involved with obesity ismodified by PA. In our study, the association of MVPAwith IR is attenuated only slightly when only childrenwith normal weight at baseline are considered, i.e.MVPA reduces the risk of developing IR, also for chil-dren with normal weight at baseline which indicates thatthe effect of missing physical activity is not just mediatedby obesity. This is also confirmed by the results of themultivariate model.
Peplies et al. International Journal of Behavioral Nutrition and Physical Activity (2016) 13:97 Page 9 of 12
Other studies have also shown that increased PA can re-duce the risk of cardiovascular disease and metabolic riskfactors including insulin, already in children [47–49].Obesity might thus be the main determinant of IR, but itseffect can be attenuated by a sufficient amount of PA. AnUS-American cross-sectional study [50] included 8–17year olds with a BMI ≥85th percentile who were enrolledin a multidisciplinary paediatric weight managementclinic. MVPA was the strongest independent predictor ofmetabolic health in these overweight and obese children.A review [51] on the therapeutic power of PA in childrensuggests that PA may have greater influence on body com-position and cardiovascular risk factors than dieting as itpossibly modulates the fuel metabolism. The increased fatoxidation by PA might be the basis for prevention and res-toration of insulin sensitivity and reduction of MS inobese children.In an analysis on NHANES data from obese adoles-
cents and adults [52], self-reported PA was associatedwith a metabolically healthy phenotype in adults, butnot in adolescents. A large cross-sectional study amongSpanish adults [23] provided evidence that PA is one ofthe main factors responsible for a healthy phenotypeamong the obese. Only few studies published results foradolescents and these showed no association betweenPA and metabolically healthy obesity [22, 52]. Further re-search in children is needed, as there are no studies onmetabolically healthy obesity in children. A cross-sectionalanalysis of IDEFICS baseline data showed the importanceof PA to protect against clustering of CVD risk factors[13]. In preschool and even more so in school children(≤9 years), CVD risk was elevated for children in the lowerquintiles of MVPA.The main strengths of this study are the large study
size, its longitudinal design, the highly standardised datacollection across different European countries, and theyoung age of the examined children, as well as the factthat PA was measured objectively by activity monitors.There are on the other hand also some limitations thatshould be mentioned: Pubertal stage was not assessed inthe IDEFICS surveys and it can be suspected that a con-siderable proportion of the older children might havealready started into puberty at follow-up. During theGerman Health Interview and Examination Survey forChildren and Adolescents (KiGGS) [53], at an age of10 years, 42.4 % of girls and 35.7 % of boys reported thedevelopment of pubic hair. Early puberty is thus morelikely in girls and especially in girls, insulin concentra-tions have been shown to have a distinct pubertal peak[44]. Nevertheless, as mentioned above, the elevated IRrisk seen in girls remained unchanged when older chil-dren (>7 years) where excluded. Food consumptionscores used in this study were based on a food frequencyquestionnaire which neither included school meals nor
portion sizes and were thus calculated from averagequantities which might reduce the truly existing differ-ences. Presented prevalence rates only apply for thestudy population at hand. These should neither be trans-ferred to the respective countries in general nor to otherstudy populations.
ConclusionsThis study is, to our knowledge, the first study to showlongitudinal data on IR in a preadolescent children’spopulation. It supports the available evidence, that over-weight and obesity are the main determinants of IR,while PA seems to ameliorate the risk, independent ofweight status. Reduction of weight is thus an importantmeasure in the fight against IR in children, but childrenshould above all be encouraged to engage in regular PA,as this will keep them metabolically healthy even underthe presence of overweight/obesity.
AcknowledgementThis work was done as part of the IDEFICS Study (http://www.ideficsstudy.eu). The authors also wish to thank the IDEFICS childrenand their parents for their participation.
FundingWe gratefully acknowledge the financial support of the EuropeanCommunity within the Sixth RTD Framework Programme Contract No.016181 (FOOD). The European Community had no influence on the designof the study, on collection, analysis, and interpretation of data nor on writingthe manuscript.
Availability of data and materialsDue to ethical restrictions and participant confidentiality, data cannot bemade publicly available.
Authors’ contributionsJP conceived the study, conducted the analyses, interpreted the data anddrafted the paper with advice from CB, WA and KG. WA; PR, TV, MT, SDH, SM,DM and LAM, were responsible for data collection, AF was in charge ofbiological sample analyses. All authors contributed to revisions of the paper.All authors read and approved the final manuscript.
Competing interestsThe authors declare that they have no competing interests.
Ethics approval and consent to participateWe certify that all applicable institutional and governmental regulationsconcerning the ethical use of human volunteers were followed during thisresearch, and that the IDEFICS project passed the Ethics Review process ofthe Sixth Framework Programme (FP6) of the European Commission. Ethicalapproval was obtained from the relevant local or national ethics committeesby each of the 8 study centers, namely from the Ethics Committee of theUniversity Hospital Ghent (Belgium), the National Bioethics Committee ofCyprus (Cyprus), the Tallinn Medical Research Ethics Committee of theNational Institutes for Health Development (Estonia), the Ethics Committeeof the University Bremen (Germany), the Scientific and Research EthicsCommittee of the Medical Research Council Budapest (Hungary), the EthicsCommittee of the Health Office Avellino (Italy), the Ethics Committee forClinical Research of Aragon (Spain), and the Regional Ethical Review Board ofGothenburg (Sweden). All parents or legal guardians of the participatingchildren gave written informed consent to data collection, examinations,collection of samples, subsequent analysis, and storage of personal data andcollected samples. Additionally, each child gave oral consent after beingorally informed about the modules by a study nurse immediately beforeevery examination using a simplified text. This procedure was chosen due tothe young age of the children. The oral consenting process was not further
Peplies et al. International Journal of Behavioral Nutrition and Physical Activity (2016) 13:97 Page 10 of 12
documented, but it was subject to central and local training and qualitycontrol procedures of the study. Study participants and their parents / legalguardians could consent to single components of the study while abstainingfrom others. All procedures were approved by the above-mentioned EthicsCommittees.
Author details1Leibniz Institute for Prevention Research and Epidemiology – BIPS, Bremen,Germany. 2Faculty of Human and Health Sciences, Institute for Public Healthand Nursing Research, Bremen University, Bremen, Germany. 3MVZDortmund Dr. Eberhard und Partner, Dortmund, Germany. 4Epidemiology &Population Genetics, Institute of Food Sciences, CNR, Avellino, Italy. 5NationalInstitute for Health Development, Tallinn, Estonia. 6Research & EducationInstitute of Child Health, Strovolos, Cyprus. 7Department of Public Health,Ghent University, Ghent, Belgium. 8Department of Public Health andCommunity Medicine, The Queen Silvia Children’s Hospital, Göteborg,Sweden. 9National Institute of Health Promotion, University of Pécs,Gyermekklinika, Pécs, Hungary. 10GENUD (Growth, Exercise, Nutrition andDevelopment) Research Group, School of Health Sciences, University ofZaragoza, Zaragoza, Spain. 11Epidemiological Methods and EtiologicResearch, Leibniz Institute for Prevention Research and Epidemiology – BIPS,Achterstraße 30, 28359 Bremen, Germany.
Received: 25 March 2016 Accepted: 24 August 2016
References1. Levy-Marchal C, Arslanian S, Cutfield W, et al. Insulin resistance in children:
consensus, perspective, and future directions. J Clin Endocrinol Metab.2010;95(12):5189–98. doi:10.1210/jc.2010-1047.
2. Weiss R, Kaufman FR. Metabolic complications of childhood obesity:identifying and mitigating the risk. Diabetes Care. 2008;31 Suppl 2:S310–316.doi:10.2337/dc08-s273.
3. Martin BC, Warram JH, Krolewski AS, Bergman RN, Soeldner JS, Kahn CR.Role of glucose and insulin resistance in development of type 2 diabetesmellitus: results of a 25-year follow-up study. Lancet. 1992;340(8825):925–9.
4. International Obesity Task Force. Obesity in Europe, the Case for Action. 2002.5. Cruz ML, Shaibi GQ, Weigensberg MJ, Spruijt-Metz D, Ball GDC, Goran MI.
Pediatric obesity and insulin resistance: chronic disease risk and implicationsfor treatment and prevention beyond body weight modification. Annu RevNutr. 2005;25:435–68. doi:10.1146/annurev.nutr.25.050304.092625.
6. Berenson GS, Srinivasan SR, Bao W, Newman WP, Tracy RE, Wattigney WA.Association between multiple cardiovascular risk factors and atherosclerosisin children and young adults. The Bogalusa Heart Study. N Engl J Med.1998;338(23):1650–6. doi:10.1056/NEJM199806043382302.
7. Maclaren NK, Gujral S, Ten S, Motagheti R. Childhood obesity and insulinresistance. Cell Biochem Biophys. 2007;48(2-3):73–8.
8. Lee JM, Okumura MJ, Davis MM, Herman WH, Gurney JG. Prevalence anddeterminants of insulin resistance among U.S. adolescents: a population-based study. Diabetes Care. 2006;29(11):2427–32. doi:10.2337/dc06-0709.
9. Ali O, Cerjak D, Kent JW, James R, Blangero J, Zhang Y. Obesity, centraladiposity and cardiometabolic risk factors in children and adolescents: a family-based study. Pediatr Obes. 2014;9(3):e58–62. doi:10.1111/j.2047-6310.2014.218.x.
10. Martin RM, Patel R, Zinovik A, et al. Filter paper blood spot enzyme linkedimmunoassay for insulin and application in the evaluation of determinantsof child insulin resistance. PLoS One. 2012;7(10):e46752. doi:10.1371/journal.pone.0046752.
11. Zimmermann MB, Aeberli I. Dietary determinants of subclinicalinflammation, dyslipidemia and components of the metabolic syndrome inoverweight children: a review. Int J Obes 2005. 2008;32 Suppl 6:S11–18. doi:10.1038/ijo.2008.202.
12. Aeberli I, Spinas GA, Lehmann R, l’Allemand D, Molinari L, Zimmermann MB.Diet determines features of the metabolic syndrome in 6- to 14-year-oldchildren. Int J Vitam Nutr Res. 2009;79(1):14–23. doi:10.1024/0300-9831.79.1.14.
13. Jiménez-Pavón D, Konstabel K, Bergman P, et al. Physical activity andclustered cardiovascular disease risk factors in young children: a cross-sectional study (the IDEFICS study). BMC Med. 2013;11:172. doi:10.1186/1741-7015-11-172.
14. Leite SA, Monk AM, Upham PA, Chacra AR, Bergenstal RM. Lowcardiorespiratory fitness in people at risk for type 2 diabetes: early marker forinsulin resistance. Diabetol Metab Syndr. 2009;1:8. doi:10.1186/1758-5996-1-8.
15. Guerrero-Romero F, Aradillas-García C, Simental-Mendia LE, Monreal-Escalante E, de la Cruz Mendoza E, Rodríguez-Moran M. Birth weight, familyhistory of diabetes, and metabolic syndrome in children and adolescents.J Pediatr. 2010;156(5):719–23. doi:10.1016/j.jpeds.2009.11.043. 723.e1.
16. Boney CM, Verma A, Tucker R, Vohr BR. Metabolic syndrome in childhood:association with birth weight, maternal obesity, and gestational diabetesmellitus. Pediatrics. 2005;115(3):e290–296. doi:10.1542/peds.2004-1808.
17. Bruce KD, Hanson MA. The developmental origins, mechanisms, andimplications of metabolic syndrome. J Nutr. 2010;140(3):648–52.doi:10.3945/jn.109.111179.
18. Leech RM, McNaughton SA, Timperio A. The clustering of diet, physicalactivity and sedentary behavior in children and adolescents: a review.Int J Behav Nutr Phys Act. 2014;11:4. doi:10.1186/1479-5868-11-4.
19. Friend A, Craig L, Turner S. The prevalence of metabolic syndrome inchildren: a systematic review of the literature. Metab Syndr Relat Disord.2013;11(2):71–80. doi:10.1089/met.2012.0122.
20. Ahrens W, Moreno LA, Mårild S, et al. Metabolic syndrome in youngchildren: definitions and results of the IDEFICS study. Int J Obes 2005. 2014;38 Suppl 2:S4–14. doi:10.1038/ijo.2014.130.
21. Mardones F, Arnaiz P, Barja S, et al. Nutritional status, metabolic syndromeand insulin resistance in children from Santiago (Chile). Nutr Hosp. 2013;28(6):1999–2005. doi:10.3305/nutrhosp.v28in06.6770.
22. Sénéchal M, Wicklow B, Wittmeier K, et al. Cardiorespiratory fitness andadiposity in metabolically healthy overweight and obese youth. Pediatrics.2013;132(1):e85–92. doi:10.1542/peds.2013-0296.
23. Lopez-Garcia E, Guallar-Castillon P, Leon-Muñoz L, Rodriguez-Artalejo F.Prevalence and determinants of metabolically healthy obesity in Spain.Atherosclerosis. 2013;231(1):152–7. doi:10.1016/j.atherosclerosis.2013.09.003.
24. Duncan GE. Exercise, fitness, and cardiovascular disease risk in type 2diabetes and the metabolic syndrome. Curr Diab Rep. 2006;6(1):29–35.
25. Armstrong N. Aerobic fitness and physical activity in children. Pediatr ExercSci. 2013;25(4):548–60.
26. Lee I-M, Shiroma EJ, Lobelo F, et al. Effect of physical inactivity on majornon-communicable diseases worldwide: an analysis of burden of diseaseand life expectancy. Lancet Lond Engl. 2012;380(9838):219–29. doi:10.1016/S0140-6736(12)61031-9.
27. Barry VW, Baruth M, Beets MW, Durstine JL, Liu J, Blair SN. Fitness vs. fatnesson all-cause mortality: a meta-analysis. Prog Cardiovasc Dis. 2014;56(4):382–90. doi:10.1016/j.pcad.2013.09.002.
28. Ahrens W, Bammann K, Siani A, et al. The IDEFICS cohort: design,characteristics and participation in the baseline survey. Int J Obes 2005.2011;35 Suppl 1:S3–15. doi:10.1038/ijo.2011.30.
29. Peplies J, Jiménez-Pavón D, Savva SC, et al. Percentiles of fasting seruminsulin, glucose, HbA1c and HOMA-IR in pre-pubertal normal weightEuropean children from the IDEFICS cohort. Int J Obes 2005. 2014;38 Suppl2:S39–47. doi:10.1038/ijo.2014.134.
30. Cole TJ, Lobstein T. Extended international (IOTF) body mass index cut-offsfor thinness, overweight and obesity. Pediatr Obes. 2012;7(4):284–94.doi:10.1111/j.2047-6310.2012.00064.x.
31. Hense S, Barba G, Pohlabeln H, et al. Factors that influence weekday sleepduration in European children. Sleep. 2011;34(5):633–9.
32. Börnhorst C, Hense S, Ahrens W, et al. From sleep duration to childhoodobesity–what are the pathways? Eur J Pediatr. 2012;171(7):1029–38.doi:10.1007/s00431-011-1670-8.
33. Singh B, Saxena A. Surrogate markers of insulin resistance: a review.World J Diabetes. 2010;1(2):36–47. doi:10.4239/wjd.v1.i2.36.
34. Matthews DR, Hosker JP, Rudenski AS, Naylor BA, Treacher DF, Turner RC.Homeostasis model assessment: insulin resistance and beta-cell functionfrom fasting plasma glucose and insulin concentrations in man.Diabetologia. 1985;28(7):412–9.
35. Gungor N, Saad R, Janosky J, Arslanian S. Validation of surrogate estimatesof insulin sensitivity and insulin secretion in children and adolescents.J Pediatr. 2004;144(1):47–55. doi:10.1016/j.jpeds.2003.09.045.
36. Peplies J, Fraterman A, Scott R, Russo P, Bammann K. Quality managementfor the collection of biological samples in multicentre studies. Eur J Epidemiol.2010;25(9):607–17. doi:10.1007/s10654-010-9481-1.
37. UNESCO Institute for Statistics. International Standard Classification forEducation ISCED 1997. 2006.
38. Lanfer A, Knof K, Barba G, et al. Taste preferences in association with dietaryhabits and weight status in European children: results from the IDEFICSstudy. Int J Obes 2005. 2012;36(1):27–34. doi:10.1038/ijo.2011.164.
Peplies et al. International Journal of Behavioral Nutrition and Physical Activity (2016) 13:97 Page 11 of 12
39. Lissner L, Lanfer A, Gwozdz W, et al. Television habits in relation tooverweight, diet and taste preferences in European children: the IDEFICSstudy. Eur J Epidemiol. 2012;27(9):705–15. doi:10.1007/s10654-012-9718-2.
40. Lanfer A, Hebestreit A, Ahrens W, et al. Reproducibility of food consumptionfrequencies derived from the Children’s Eating Habits Questionnaire used in theIDEFICS study. Int J Obes 2005. 2011;35 Suppl 1:S61–68. doi:10.1038/ijo.2011.36.
41. Evenson KR, Catellier DJ, Gill K, Ondrak KS, McMurray RG. Calibration of twoobjective measures of physical activity for children. J Sports Sci. 2008;26(14):1557–65. doi:10.1080/02640410802334196.
42. Konstabel K, Veidebaum T, Verbestel V, et al. Objectively measured physicalactivity in European children: the IDEFICS study. Int J Obes 2005. 2014;38Suppl 2:S135–143. doi:10.1038/ijo.2014.144.
43. Suling M, Hebestreit A, Peplies J, et al. Design and results of the pretest of theIDEFICS study. Int J Obes 2005. 2011;35 Suppl 1:S30–44. doi:10.1038/ijo.2011.33.
44. Mellerio H, Alberti C, Druet C, et al. Novel modeling of reference values ofcardiovascular risk factors in children aged 7 to 20 years. Pediatrics. 2012;129(4):e1020–1029. doi:10.1542/peds.2011-0449.
45. World Health Organization. WHO: Global Recommendations on PhysicalActivity for Health. 2010.
46. Garcés C, Gutierrez-Guisado J, Benavente M, et al. Obesity in Spanishschoolchildren: relationship with lipid profile and insulin resistance. ObesRes. 2005;13(6):959–63. doi:10.1038/oby.2005.111.
47. Ekelund U, Luan J’a, Sherar LB, et al. Moderate to vigorous physical activityand sedentary time and cardiometabolic risk factors in children andadolescents. JAMA. 2012;307(7):704–12. doi:10.1001/jama.2012.156.
48. Väistö J, Eloranta A-M, Viitasalo A, et al. Physical activity and sedentarybehaviour in relation to cardiometabolic risk in children: cross-sectionalfindings from the Physical Activity and Nutrition in Children (PANIC) Study.Int J Behav Nutr Phys Act. 2014;11:55. doi:10.1186/1479-5868-11-55.
49. Van Buren DJ, Tibbs TL. Lifestyle interventions to reduce diabetes andcardiovascular disease risk among children. Curr Diab Rep. 2014;14(12):557.doi:10.1007/s11892-014-0557-2.
50. Prince RL, Kuk JL, Ambler KA, Dhaliwal J, Ball GDC. Predictors ofmetabolically healthy obesity in children. Diabetes Care. 2014;37(5):1462–8.doi:10.2337/dc13-1697.
51. Brambilla P, Pozzobon G, Pietrobelli A. Physical activity as the maintherapeutic tool for metabolic syndrome in childhood. Int J Obes 2005.2011;35(1):16–28. doi:10.1038/ijo.2010.255.
52. Camhi SM, Waring ME, Sisson SB, Hayman LL, Must A. Physical activity andscreen time in metabolically healthy obese phenotypes in adolescents andadults. J Obes. 2013;2013:984613. doi:10.1155/2013/984613.
53. Kahl H, Schaffrath Rosario A, Schlaud M. Sexual maturation of children andadolescents in Germany. Results of the German Health Interview andExamination Survey for Children and Adolescents (KiGGS).Bundesgesundheitsblatt Gesundheitsforschung Gesundheitsschutz. 2007;50(5-6):677–85. doi:10.1007/s00103-007-0229-3.
• We accept pre-submission inquiries
• Our selector tool helps you to find the most relevant journal
• We provide round the clock customer support
• Convenient online submission
• Thorough peer review
• Inclusion in PubMed and all major indexing services
• Maximum visibility for your research
Submit your manuscript atwww.biomedcentral.com/submit
Submit your next manuscript to BioMed Central and we will help you at every step:
Peplies et al. International Journal of Behavioral Nutrition and Physical Activity (2016) 13:97 Page 12 of 12