longitudinal outcomes for mathematics achievement for students with learning disabilities
TRANSCRIPT

This article was downloaded by: [University of Toronto Libraries]On: 17 October 2014, At: 05:44Publisher: RoutledgeInforma Ltd Registered in England and Wales Registered Number: 1072954 Registered office: Mortimer House,37-41 Mortimer Street, London W1T 3JH, UK
The Journal of Educational ResearchPublication details, including instructions for authors and subscription information:http://www.tandfonline.com/loi/vjer20
Longitudinal Outcomes for Mathematics Achievementfor Students with Learning DisabilitiesSharon Judge a & Silvana M. R. Watson aa Old Dominion UniversityPublished online: 31 Mar 2011.
To cite this article: Sharon Judge & Silvana M. R. Watson (2011) Longitudinal Outcomes for Mathematics Achievement forStudents with Learning Disabilities, The Journal of Educational Research, 104:3, 147-157, DOI: 10.1080/00220671003636729
To link to this article: http://dx.doi.org/10.1080/00220671003636729
PLEASE SCROLL DOWN FOR ARTICLE
Taylor & Francis makes every effort to ensure the accuracy of all the information (the “Content”) containedin the publications on our platform. However, Taylor & Francis, our agents, and our licensors make norepresentations or warranties whatsoever as to the accuracy, completeness, or suitability for any purpose of theContent. Any opinions and views expressed in this publication are the opinions and views of the authors, andare not the views of or endorsed by Taylor & Francis. The accuracy of the Content should not be relied upon andshould be independently verified with primary sources of information. Taylor and Francis shall not be liable forany losses, actions, claims, proceedings, demands, costs, expenses, damages, and other liabilities whatsoeveror howsoever caused arising directly or indirectly in connection with, in relation to or arising out of the use ofthe Content.
This article may be used for research, teaching, and private study purposes. Any substantial or systematicreproduction, redistribution, reselling, loan, sub-licensing, systematic supply, or distribution in anyform to anyone is expressly forbidden. Terms & Conditions of access and use can be found at http://www.tandfonline.com/page/terms-and-conditions

The Journal of Educational Research, 104:147–157, 2011Copyright C© Taylor & Francis Group, LLCISSN: 0022-0671 print / 1940-067 onlineDOI:10.1080/00220671003636729
Longitudinal Outcomes forMathematics Achievement for Students
with Learning DisabilitiesSHARON JUDGESILVANA M. R. WATSONOld Dominion University
ABSTRACT. Using longitudinal data from the first 6 wavesof the Early Childhood Longitudinal Study–Kindergarten Co-hort (ECLS-K), the authors examined mathematics achieve-ment and growth trajectories by learning disability (LD)subgroups. The 2-level (time–student) growth curve modelshowed that lower levels of mathematics achievement werealready evident at kindergarten entry for all subgroups of stu-dents identified as LD during the elementary school years. Re-sults indicate that students with LD as a group made smallergains in mathematics than students without disabilities. Thisfinding underscores the need for early identification combinedwith frequent assessment of progress and responsive instruc-tion.
Keywords: achievement, learning disabilities, mathematics
Many students with disabilities lag behind their peerswithout disabilities in mathematics achievement. For ex-ample, in the 2005 National Assessment of EducationalProgress (NAEP) mathematics assessment, 43% of Grade4 students with disabilities compared to 17% of Grade 4 stu-dents without disabilities scored below the basic level. Math-ematics disabilities are included in most, if not all, defini-tions of learning disability (LD). However, because there isdisagreement on the definition of LD, there are also vari-ations in methods and criteria to identify students withmathematics LD (B.R. Bryant, Bryant, & Hammill, 2000;Kavale & Forness, 2000).
The prevalence of mathematics LD in the school-age pop-ulation, which is approximately 5%–8% (Fuchs et al., 2005;Geary, 2004; Gross-Tsur, Manor, & Shalev, 1996), is com-parable to that of reading disabilities, and yet less atten-tion has been devoted to understanding mathematics LD(Butterworth, 2005; Jordan & Montani, 1997; Mazzocco &Myers, 2003). One reason for this emphasis may be the socialand cultural importance attached to reading skills; a furtherreason, however, is that a similar deficit may contribute tothe cooccurrence of mathematics LD and reading LD in somechildren (Ackerman & Dykman, 1995; Geary, 1993). Withthe recent alignment of the Individuals with Disabilities
Education Act (IDEA) Amendments of 2004 with the NoChild Left Behind Act of 2001 (NCLB; 2002), there is moreemphasis on the achievement outcomes of students with dis-abilities than ever before. Both pieces of legislation expectstudents with disabilities to achieve the same academic stan-dards as students without disabilities. Consequently, there isan enormous need for more research on assessment, identi-fication, and intervention for mathematics difficulties.
Mathematical concepts acquired in the primary grades(e.g., number identification, one-to-one correspondence,counting, groups) help children learn the four basic mathoperations and problem solving (e.g., National Councilof Mathematics Educators, 2004; Van Luit & Schopman,2000). These skills also lay the foundation for later acquisi-tion of mathematical concepts (e.g., Mercer & Miller, 1992).More importantly, the success or failure to acquire earlynumerical concepts influences the interest and confidencestudents bring to new mathematical tasks and may funda-mentally alter a student’s success in mathematics through-out the elementary grades (Jordan, 1995). However, fewmethodologically rigorous studies that examined instruc-tional practices designed to improve the performance ofstudents with mathematics disabilities have been identifiedeven though this literature base extends over the past 30years (National Mathematics Advisory Panel, 2008).
The Nature of Mathematical Difficulties
Presently, more students are identified as having LD thanany other type of disability. The heterogeneity found amongstudents with LD is also reflected in mathematics LD sub-types and in the manifestation of their deficits (Augusty-niak, Murphy, & Phillips, 2005). Students are classified ashaving disabilities in mathematics without reading problems(mathematics LD only) and having disabilities in both math-ematics and reading (mathematics LD/reading LD). Gersten,
Address correspondence to Sharon Judge, Old Dominion University,218 Education, Norfolk, VA 23529, USA. (E-mail: [email protected])
Dow
nloa
ded
by [
Uni
vers
ity o
f T
oron
to L
ibra
ries
] at
05:
44 1
7 O
ctob
er 2
014

148 The Journal of Educational Research
Jordan, and Flojo (2005) indicated that most students withmathematics LD have problems with (a) accuracy and flu-ency of retrieval of arithmetic facts, (b) slower and lessmature use of strategies, and (c) reading that seems to be as-sociated with slower progress in many areas of mathematics.Furthermore, students with mathematics LD only or mathe-matics LD/reading LD are confronted with several difficultiesin the different areas of mathematics, including computa-tion, concepts, and problem solving (Berch, 2005; Fuchs,Fuchs, & Prentice, 2004; Garcia, Jimenez, & Hess, 2006;Miller & Mercer, 1997). Therefore, students with mathe-matics LD are not only heterogeneous in their characteris-tics, but also in the expression of their performance deficits.
A determining feature of the literature on mathemat-ics LD is the lack of research-based identification of maindeficits, which makes screening difficult for identifying stu-dents who may have mathematics LD (Augustyniak et al.,2005; Fuchs, Fuchs, Compton, Hamlett, & Seethaler, 2007).In reading, for example, phonological processing difficulties,specifically phonological awareness, have been identified asthe basis for reading decoding deficits. However, in math-ematics a unifying core of deficits has not been recognizedas the mathematics behavior predictor of mathematics LD.Consequently, present screening measures available to de-tect mathematics LD do not consider the developmentalthinking stages students go through during the school years(Mazzocco, 2005) and, as the range of skills grow, ignoremore complex mathematical skills (Fuchs et al., 2004). Con-sequently, the number of false positives (i.e., the identifica-tion of a problem that does not exist) and false negatives(i.e., failure to identify a problem that does exist) are usu-ally higher than true positives. Fuchs et al. (2007), afterreviewing studies on mathematics LD, commented, “Screen-ing measures investigated to date may be insufficiently dif-ficult to yield fine discriminations at the lower end of thedistribution” (p. 316).
Another problem with screening for mathematics LDfound in the literature has to do with the different cutpoints used to determine math problems. Cut-points varyfrom the 35th percentile to 10th percentile (Fuchs et al.,2007; Mazzocco, 2005). The setting of the cut points mayinfluence the identification of true positives, false positives,and false negatives, which have implications for the esti-mation of prevalence of mathematics LD and for instruc-tion, especially in the implementation of responsiveness-to-intervention model. As a result, school resources may beexhausted, or students at risk may not receive early interven-tion (Fuchs et al., 2007). In spite of the cutoff score for deter-mination of mathematics LD, the most commonly agreed-onfailure of children with mathematics LD is in learning to re-member arithmetic facts (H. L. Swanson & Jerman, 2006).
School age is the time when the majority of childrenare first identified as having a learning disability. However,the timing of special education services provided over thesegrades varies for children identified as having LD. Data re-cently released by the National Center for Education Statis-
tics Early Childhood Longitudinal Study, Kindergarten Classof 1998–1999 (ECLS-K) indicated that the percentage of thestudent cohort receiving special education grew from 4.1%in kindergarten to 11.9% of students in Grade 5 (Herring,McGrath, & Buckley, 2007). The percentage of studentswith a LD as a primary disability climbed as students pro-gressed through school, from 0.5% in kindergarten to 6.5%in Grade 5. Thus, increasingly more children were identifiedand served for LD over the course of the elementary grades.However, there has been almost no investigation about howthese changes in the characteristics of the LD populationoccur over the first years of school.
Student Characteristics, Mathematics Achievement, andLearning Disabilities
Academic risk factors that are frequently documented inthe clinical and child development literature include eth-nicity, gender, poverty and lack of parental education, familymobility, and limited English proficiency, along with nutri-tional and health factors (for examples, see Garmezy, 1993;Garmezy & Masten, 1986; Werner, 1993). Gender differ-ences plays a role in the recognition of LD. Boys are 3 timesas likely as girls to be identified as LD (Child Trend Data-bank, n.d.). Some researchers have reported that girls areequally or more likely than boys to have mathematics LD(Kovas, Haworth, Petrill, & Plomin, 2007; Lewis, Hitch,& Walker, 1994; Shalev & Gross-Tsur, 2001). Others havesuggested that mathematics LD is more common among boysthan girls (Barbaresi, Katusic, Colligan, Weaver, & Jacob-sen, 2005). However, according to Lerner and Johns (2009),there are not fewer girls with LD, but girls are not as readilyidentified due to boys’ more disruptive and attention-gettingbehavior in the classroom.
Besides gender differences in LD, numerous studies havealso documented differences in LD by socioeconomic status(SES) and ethnicity (Blair & Scott, 2002; Denton & West,2002; Lee, Grigg, & Donahue, 2007). Because children ofminority race or ethnicity are much more likely than Whitechildren to grow up in poverty in the United States, they areat risk for achievement problems and placement in specialeducation programs (Blackorby & Wagner, 2005). Accord-ing to a 2002 report by the National Research Council, acontributing factor to minority overrepresentation in spe-cial education programs is poverty. Much concern has beenexpressed about disproportionate representation of minori-ties in special education programs (e.g., Harry & Anderson,1994; Reschly, 1997; U. S. Department of Education, 1998).Despite these concerns, the percentage of the populationreceiving special education and related services still variesconsiderably by race or ethnicity.
Additionally, students with LD are retained more thanstudents without LD (Barnett, Clarizio, & Payette, 1996;McLeskey & Grizzle, 1992). Barnett et al. (1996) found that72% of students with LD were retained at least once beforethey were referred for special education placement. They
Dow
nloa
ded
by [
Uni
vers
ity o
f T
oron
to L
ibra
ries
] at
05:
44 1
7 O
ctob
er 2
014

The Journal of Educational Research 149
also found that retained LD students generally exhibitedlower levels of intelligence and weaker skills in reading com-prehension, writing, and mathematics at the time of theirreferral. In the Special Education Elementary LongitudinalStudy (SEELS), parents reported that significant numbersof students in each disability category have been retainedat some point in their education career; however, 31% ofstudents with LD have been retained compared to 16% ofstudents with autism (Blackorby, Chorost, Garza, & Guz-man, 2005). However, educational research fails to supportgrade retention as an effective intervention (Jimerson, 2001;Jimerson, Anderson, & Whipple, 2002; Roderick, Nagaoka,Bacon, & Easton, 2000). In fact, grade retention has beenassociated with a host of negative outcomes on a variety oflevels.
Purpose of the Study
The purpose of the present study was to address some ofthe limitations in the literature by examining the trajectoryof mathematics achievement within subgroups of studentsidentified as having LD during the elementary school years.The analyses were conducted to investigate the patterns ofemergence of LD and the nature of the children’s mathe-matics ability and risk status across the 6 years. Therefore,specific objectives were to determine (a) whether the math-ematics achievement gap exists at kindergarten entry be-tween either children who were identified for LD during theearly primary grades (kindergarten and Grade 1), childrenwho were identified for LD during the later primary grades(Grades 2–3), children who were identified for LD during theupper elementary grades (Grades 4–5), or children withoutLD; and (b) whether any preexisting gap narrows or widensover the first 6 years of school for the four LD subgroupscompared to the non-LD group after statistically controllingfor a student’s sociodemographic characteristics, includingSES, ethnicity, grade retention, and gender.
Method
Sample
The ECLS-K is a national longitudinal study that focuseson children’s early school experiences in U.S. public andprivate schools from kindergarten through Grade 5. TheECLS-K data set is particularly suited for this investigationbecause it includes data that are nationally representative ofstudents with and without disabilities. The sample reflectsthe racial, ethnic, and economic diversity of students in theUnited States. Additionally, the design includes oversam-pling of students reporting Asian or Pacific Islander ethnicityand students attending private schools.
Data were collected over a 6-year period, with the firstcollection occurring at the beginning of the child’s kinder-garten year (Fall 1998). The latter four time points usedfor the present analyses were at the end of kindergarten,
Grade 1, Grade 3, and Grade 5. During each of these col-lection periods, children were individually administered thedirect assessments of academic skills (including mathemat-ics) and school staff completed the student records abstractform for each sampled child. This instrument was used toobtain information about the child’s Individual EducationPlan (IEP), if applicable. If the sampled child had an IEP onrecord, the school staff also reported the disability classifica-tion listed on the IEP as well as the academic school yearsthe child had an IEP on record. In addition, the primaryspecial education teacher or service provider completed aquestionnaire for each sampled child who received specialeducation services in the spring of kindergarten, Grade 1,Grade 3, or Grade 5. The questionnaires addressed topicssuch as the child’s primary disability, when the child firsthad an IEP, IEP goals, the amount and type of services usedby sampled students, and communication with parents andgeneral education teachers.
Using data from the student record abstract and specialeducation teacher questionnaire, 1,265 children were identi-fied as having LD from kindergarten through Grade 5. Chil-dren were identified as early-emerging LD if they had beenidentified and received special education services during ei-ther kindergarten or Grade 1. If children were first identifiedand received special education services during either Grades2 or 3, they were identified as emerging LD. Children wereidentified as late-emerging LD if they were first identifiedand received special education services during either Grades4 or 5. Finally, if children were not identified as LD duringany year, they were identified as nondisabled. After list-wisedeletion, the effective sample size for the two-level growthmodel was 10,096 students measured at a total of 50,480 timepoints over the course of the five waves of data collection.Of these 10,096 students, 334 (3.3%) were identified as LDduring kindergarten or Grade 1, 499 (4.9%) during Grades2 or 3, and 359 (3.6%) during Grades 4 or 5. Characteristicsare provided in Table 1 for the full sample and separately forstudents in each of the four LD status subgroups.
Missing Data
A primary concern with longitudinal research is partic-ipant attrition. Fortunately, hierarchical linear modeling(HLM) can accommodate missing data at a given time pointquite easily. The multilevel model for change allows forvarying numbers of waves of data collection and individu-alized collection schedules (Singer & Willet, 2003). HLMuses all available data to estimate individual growth trajec-tories for the outcome (level 1, within-child level) usingmaximum-likelihood estimates. However, cases were auto-matically deleted from analysis by HLM if there were missingdata at level 2 (between-child level). This analytic samplediffered from the full sample of kindergartners in the ECLS-K by ethnicity. The analytic sample contained fewer AfricanAmerican students (11% vs. 15.1%) and more Asian or Pa-cific Islanders (8.0% vs. 6.4%) than did the full sample of
Dow
nloa
ded
by [
Uni
vers
ity o
f T
oron
to L
ibra
ries
] at
05:
44 1
7 O
ctob
er 2
014

150 The Journal of Educational Research
TA
BL
E1.
Des
crip
tive
Stat
isti
cs:
Mea
nsan
dSt
anda
rdD
evia
tion
s,by
Lea
rnin
gD
isab
ility
Stat
usSu
bgro
up.
Full
sam
ple
(N=
10,0
96)
Earl
y-em
ergi
ngLD
(N=
334)
Emer
ging
LD(N
=49
9)La
te-e
mer
ging
LD(N
=35
9)N
on-L
D(N
=8,
904)
Var
iabl
eM
SDM
SDM
SDM
SDM
SD
Mat
hsc
ore
atK
entr
y18
.73
6.80
14.2
24.
1714
.25
4.56
14.6
23.
8319
.39
6.87
Mat
hsc
ore
atK
spri
ng26
.55
8.62
18.9
05.
2319
.54
6.20
20.6
45.
5727
.57
8.51
Mat
hsc
ore
atG
rade
1sp
ring
42.4
09.
2633
.93
10.2
034
.31
9.47
33.9
48.
6243
.65
8.58
Mat
hsc
ore
atG
rade
1sp
ring
82.1
518
.34
68.0
117
.30
68.7
416
.64
66.8
016
.21
84.2
217
.65
Mat
hsc
ore
atG
rade
5sp
ring
109.
6722
.46
92.5
322
.20
92.1
720
.86
90.3
621
.63
112 .
2521
.42
SES
−0.0
20.
81−0
.33
0.73
−0.3
40.
73−0
.32
0.74
0.03
0.81
Gen
der(
mal
e=
1;%
)51
0.50
630.
4869
0.46
670.
4749
0.50
Whi
te(%
)59
0.49
660.
4859
0.49
530.
5059
0.49
Afr
ican
Am
eric
an(%
)11
0.32
120.
3215
0.35
140.
3411
0.31
His
pani
c(%
)18
0.38
130.
3421
0.41
200.
4018
0.38
Asi
anor
Paci
ficIs
land
er(%
)8
0.27
30.
162
0.13
80.
268
0.27
Ret
aine
d(%
)13
0.34
150.
3615
0.36
160.
3713
0.33
Perc
enta
geof
sam
ple
100
—3
—5
—4
—88
—
Not
e.M
ath
scor
es(2
5th
perc
enti
le)
at(a
)ki
nder
gart
enen
try,
14.2
7;(b
)ki
nder
gart
en,s
prin
g,20
.76;
(c)
Gra
de1,
spri
ng,3
7.72
;(d)
Gra
de3,
spri
ng,7
0.91
;and
(e)
Gra
de5,
spri
ng,9
8.17
.LD
=le
arni
ngdi
sabi
lity.
Dow
nloa
ded
by [
Uni
vers
ity o
f T
oron
to L
ibra
ries
] at
05:
44 1
7 O
ctob
er 2
014

The Journal of Educational Research 151
kindergartners in the ECLS-K. Further investigation showsthat the full sample and final sample are in the same range interms of SES and entering mathematics achievement, sug-gesting that the final sample includes a full range of studentsfrom different SES and academic backgrounds. However, thefindings from this study should not be generalized withoutcaution to the overall population of children who enteredU.S. kindergarten classes in 1998.
Measures
Mathematics assessments. Direct assessment in this studyis represented by children’s Item Response Theory (IRT)scale scores on an individually administered cognitive testin mathematics in the fall of kindergarten and spring ofkindergarten, Grade 1, Grade 3, and Grade 5. These scoresare comparable across students within a wave and also acrosswaves enabling comparison of children’s performance overtime. The kindergarten and Grade 1 mathematics assess-ments were designed to measure skills in conceptual knowl-edge, procedural knowledge, and problem solving. Approx-imately one half of the mathematics assessment consistedof questions on number sense and number properties andoperations. In Grades 3 and 5, the mathematics assessmentsaddressed these same content areas, with the easier formsfocusing on number sense, properties, and operations, andthe more difficult forms focusing on measurement, algebra,and geometry. A subset of items from the Grade 1 and 3assessments was included in the Grade 5 assessment in orderto link the previous assessments and the Grade 5 assess-ment for scaling purposes. Reliabilities of the IRT scaledscores ranged from .88 to .95 across all five rounds of assess-ment (Tourangeau, Nord, Le, Pollack, & Atkins-Burnett,2006).
Student background. In this analysis we measured and con-trolled student background with nine variables. They in-cluded a continuous measure of family SES. SES is a com-posite derived from the logarithm of five variables measur-ing family income, mother’s education, father’s education,mother’s occupational prestige, and father’s occupationalprestige measured during the first year of data collection(U.S. Department of Education, 2000). Child gender firstwas determined by researchers at the school-based assess-ment and then confirmed with items on the initial parentinterview. The variable name “male” replaced the originalname, “gender,” and was coded dichotomously (0 = girl and1 = boy). Three variables created for this analysis measuredminority status. A series of dummy-coded variables com-paring White children with African American, Hispanic,and Asian or Pacific Islander children were created. A se-ries of three dummy-coded variables were created for LDstatus comparing non-LD students with early-emerging LDstudents (identified for LD during either kindergarten orGrade 1), emerging LD students (identified for LD during
Grades 2 or 3), and late-emerging students (identified forLD during Grades 4 or 5). Finally, there was a variable toindicate whether the student had been retained a grade.Data collected in the fall of 1998 indicated whether thechild was in kindergarten for the first time or was repeatingkindergarten. In subsequent years, data were collected onthe child’s grade placement. If either source of informationindicated that the child had repeated a grade, the child wascoded as having been retained.
Statistical Analyses
The method of analysis used was two-level HLM with timetreated as level 1 and students as level 2 using full maximum-likelihood estimation. HLM provides a statistical approachappropriate for studying the structure and predictors of in-dividual growth (Bryk & Raudenbush, 1992). Applicationsof HLM to multiple time-point studies of individual changerepresent the individual growth through a two-level hier-archical model. At level 1, each student’s achievement isrepresented by an individual growth trajectory that dependson his or her own unique set of parameters. These individ-ual growth parameters become the outcome variables in alevel 2 model in which they depend on person-level charac-teristics. Therefore, the level 2 equations create a differentgrowth curve for each individual because the level 2 vari-able distinguishes individuals from each other. Because wewere interested in developmental change from fall of kinder-garten on, we centered the intercept at initial kindergartenassessment. The error terms (e) were assumed to be inde-pendent and normally distributed (Raudenbush & Bryk,2002). HLM 6 (Raudenbush, Bryk, Cheong, & Congdon,2004) was used to conduct the analysis. HLM 6 allows theuser to specify weights at each level, and we used NationalCenter for Education Statistics-constructed child-level lon-gitudinal weights throughout the analysis to account forunequal probability sampling and nonresponse in theECLS-K.
Level 1 variables included the mathematics scores at thefive time points as well as monthly time-varying growth rate.Therefore, the Level 1 model was
Y = π0 + π1 ∗ (time) + e (1)
where Y is the outcome, π0 is the intercept or kindergartenentry status parameter (where the model is centered), π1 isthe monthly mathematics slope or rate of change parameter,and e is the residual deviation of each time point from theestimated trajectory.
Student-level variables included gender, SES, minoritystatus, LD status, and grade retention. All variables that didnot have a meaningful zero value were grand-mean centered
Dow
nloa
ded
by [
Uni
vers
ity o
f T
oron
to L
ibra
ries
] at
05:
44 1
7 O
ctob
er 2
014

152 The Journal of Educational Research
at all levels in all analyses. Thus, the Level 2 models were
π1 = β00 + β∗01(male) + β∗
02(African American)
+β∗03(Hispanic) + β∗
04(Asian) + β∗05(SES)
+β∗06(early − emerging LD) + β∗
07(emerging LD)
+β∗08(late emerging LD) + β∗
09(retention) + r1
(2)
where male is the dummy variable for gender, African Amer-ican is the dummy variable identifying children as AfricanAmerican, Hispanic is the dummy variable identifying chil-dren as Hispanic, Asian is the dummy variable identifyingchildren as Asian or Pacific Islander, early-emerging LD rep-resents a dummy code for children identified as LD eitherduring kindergarten or Grade 1, emerging LD representsa dummy code for children identified as LD either duringGrades 2 or 3, late-emerging LD represents a dummy codefor children identified as LD either during Grades 4 or 5,retention is the dummy variable for grade retention, and r1
is the error term.We used the Multilevel Article Review Checklist devel-
oped by Dedrick et al. (2009) to assess if the four centralissues derived from their methodological literature on mul-tilevel modeling were addressed in our study. The items listedon the checklist were used as guidelines for what issues toconsider in reporting model development and specification,data considerations, estimation procedures, and hypothe-sis testing and statistical inference. We followed their re-porting guidelines for multilevel modeling detailed in theirchecklist.
Results
Detailed descriptive statistics on all of the variables con-sidered in the analysis for each of the four LD status sub-groups are shown in Table 1. Differences between groupsof categorical data were analyzed by using chi-square tests,whereas multiple comparison tests were used in continuousdata for all student background variables. Univariate analy-sis revealed significant group differences regarding SES, F(3,10092) = 79.54, p < .001. Tukey post hoc comparisonsrevealed that all three groups of students with LD had sig-nificantly lower SES scores than the non-LD group, as in-dicated by the negative sign of the mean. Not surprisingly,there were significantly more boys identified and served forLD (p < .001 for all groups). A significantly greater percent-age of White students were identified for LD in the earlyprimary grades compared to non-LD students, χ2(1, N =9238) = 4.51. p < .05. A significantly greater percentageof African American students were identified for LD in theupper elementary school grades compared to both non-LDstudents, χ2(1, N = 9263) = 6.83. p < .01, and students withearly-emerging LD, χ2(1, N = 693) = 4.28, p < .05, whereasa significantly greater percentage of Hispanic students were
identified for LD in the later primary grades compared tostudents with early-emerging LD, χ2(1, N = 833) = 6.0,p < .05. Also, Asian or Pacific Islander students were morelikely to be identified for LD in upper elementary schoolcompared to both students with early-emerging LD, χ2(1,N = 693) = 4.80, p < .05, and students with emerging LD,χ2(1, N = 858) = 6.96, p < .01. In addition, a significantlyfewer percentage of Asian or Pacific Islander students wereidentified as both students with early-emerging LD, χ2(1,N = 9238) = 4.61, p < .05, and students with emergingLD, χ2(1, N = 9403) = 7.54, p < .01, compared to non-LDstudents. A significantly greater percentage of students withearly-emerging LD, χ2(1, N = 9238) = 9.30, p < .01, andstudents with emerging LD, χ2(1, N = 9403) = 7.62, p < .01,were retained a grade level compared to non-LD students.
Initial Status
Tables 2 and 3 present the final model for linear math-ematical growth over the first 6 years of school as a func-tion of time (Level 1) and student-level variables (Level 2).The results indicated that at the beginning of kindergarten,the mathematics score for a non-African American, non-Hispanic, non-Asian or Pacific Islander, non-LD girl was19.15. After controlling for the other variables in the model,lower levels of mathematics achievement were already evi-dent at kindergarten entry for all subgroups of students iden-tified as having LD during the elementary school grades.Early-emerging LD students entered school with mathemat-ics scores that were approximately seven points lower thanother students whereas emerging LD students’ mathematicsscores were approximately six points lower and late-emergingLD students’ mathematics scores were approximately fivepoints lower, respectively. Students from higher SES back-grounds had higher initial mathematics scores (γ 05 = 2.84).African American (γ 02 = −2.16), Hispanic (γ 03 = 2.88),and Asian or Pacific Islander (γ 04 = 1.34) students begankindergarten with lower mathematics scores than other stu-dents. The mathematics scores of boys and students whowere retained a grade were not statistically different fromthose of other students at kindergarten entry.
Predicting Mathematics Growth
The mathematics trajectory slope measured the amountof mathematics growth for each month of instruction. Al-though students made gains in mathematics over time, stu-dents with LD performed lower than non-LD students af-ter controlling for other variables. As seen in Table 2,on average, a non-African American, non-Hispanic, non-Asian or Pacific Islander, non-LD girl gained approxi-mately 1.45 points per month. After controlling for otherpredictors, the slope coefficient for students with early-emerging LD versus other students was −0.29, t(10060) =
Dow
nloa
ded
by [
Uni
vers
ity o
f T
oron
to L
ibra
ries
] at
05:
44 1
7 O
ctob
er 2
014

The Journal of Educational Research 153
TABLE 2. Final Model of Mathematics Growth Across the First 6 Years of School
Variable Coefficient SE t p
Fixed effectIntercept 19.15 0.06 312.69 .000∗∗∗
Male 0.07 0.12 0.60 .547African American −2.16 0.19 −11.20 .000∗∗∗
Hispanic −2.88 0.16 −17.70 .000∗∗∗
Asian or Pacific Islander −1.34 0.27 −4.92 .000∗∗∗
SES 2.84 0.09 32.49 .000∗∗∗
Early-emerging MLD −7.00 0.29 −23.75 .000∗∗∗
Emerging MLD −6.00 0.24 −24.61 .000∗∗∗
Late-emerging MLD −5.28 0.30 −17.49 .000∗∗∗
Retained −0.10 0.18 0.59 .554Mathematics growth
Intercept 1.45 0.00 589.53 .000∗∗∗
Male 0.08 0.01 16.36 .000∗∗∗
African American −0.17 0.01 −18.36 .000∗∗∗
Hispanic –0.03 0.01 −4.45 .000∗∗∗
Asian or Pacific Islander 0.02 0.01 2.53 .012∗
SES 0.10 0.00 30.40 .000∗∗∗
Early-emerging MLD −0.29 0.02 −14.41 .000∗∗∗
Emerging MLD −0.24 0.01 −17.99 .000∗∗∗
Late-emerging MLD −0.26 0.02 −16.23 .000∗∗∗
Retained −0.01 0.01 −1.10 .272
Note. For all ts, df = 10060. LD = learning disability.∗p < .05. ∗∗∗p < .001.
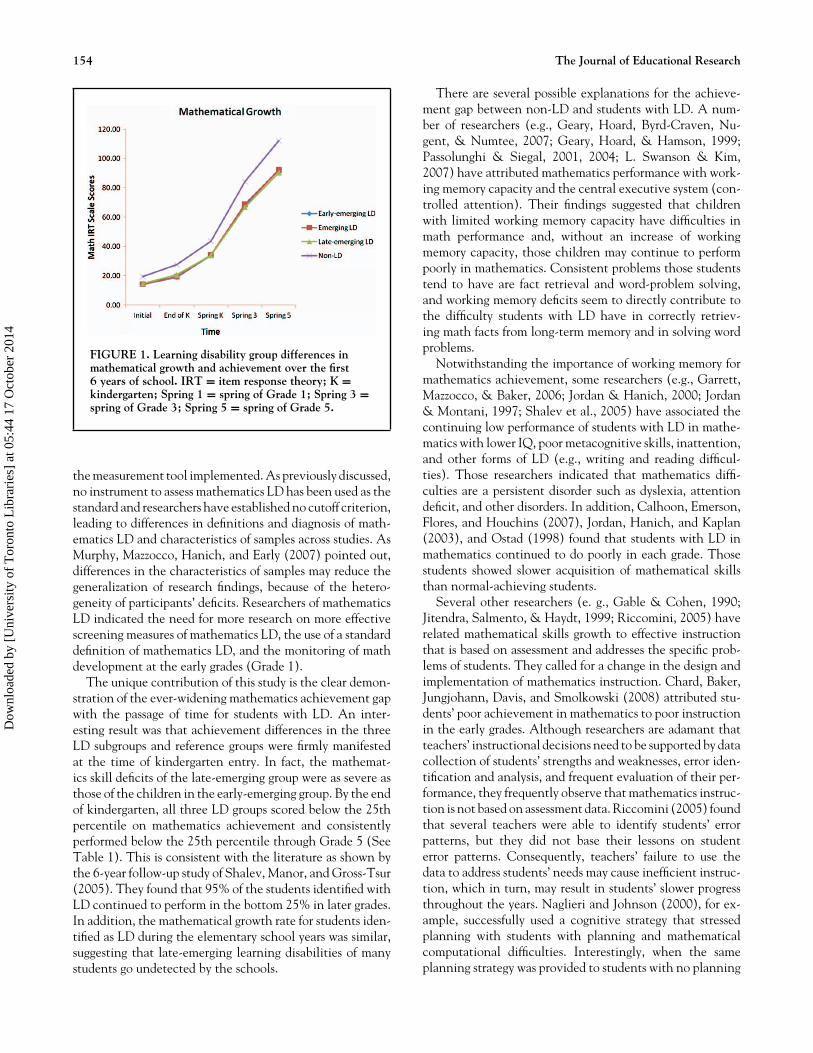
−14.41, p = .000, for students with emerging LD it was−0.24, t(10060) = −17.99, p = .000, and for students withlate-emerging LD it was −0.26, t(10060) = −16.23,p = .000. Figure 1 displays the kindergarten through Grade5 mean Mathematics Tests IRT scores of children basedon the basis of their LD status. The mean scores of theMathematics Test of all groups increased. However, overtime the mean scores for students with LD remained con-sistently and substantially lower than the non-LD group,whereas the variability for all groups increased. Studentsfrom higher SES households experienced more rapid math-ematics growth (γ 15 = 0.10). The average mathematicalgrowth rate for African American (γ 12 = −0.17) and His-
TABLE 3. Random Effects for Full Model of MathematicGrowth
Randomeffect
Variancecomponent χ 2 p
Intercept (r0) 21.00 22897.30 .000∗∗∗
Mathematicslope (r1)
0.05 47691.54 .000∗∗∗
Note. For both intercept and mathematic slope, df = 10043.∗∗∗p < .001.
panic (γ 13 = −0.03) students were slightly lower than thoseof other students. Boys demonstrated greater growth in math-ematics than girls (γ 11 = 0.08). Even though Asian or Pa-cific Islander students begin kindergarten with slightly lowerscores, their mathematics performance grows at a slightlyfaster rate than other students (γ 14 = 0.02). Grade reten-tion was not a significant predictor of mathematical growth.The estimated correlation between rate of growth and initialmathematics achievement status was positive (r = .55), in-dicating that students who had higher mathematics achieve-ment scores at kindergarten entry tended to also grow at asomewhat faster rate than those students with lower math-ematics achievement. There is a 40% reduction in betweenperson variance after adding the Level 2 predictors. Thus,about 40% of the variability of students’ initial mathematicsscores was explained by the predictors modeled.
Discussion
The results of this study resemble those reported in theliterature. We found a variation of students being diagnosedwith LD at different grade levels even though they had laggedbehind their peers since kindergarten. As in the presentstudy, Fuchs et al. (2007) and Mazzocco and Myers (2003)found similar fluctuations over time in the number of stu-dents who met or did not meet criteria for LD at differentgrades. This may be related to the setting of cut points and
Dow
nloa
ded
by [
Uni
vers
ity o
f T
oron
to L
ibra
ries
] at
05:
44 1
7 O
ctob
er 2
014
154 The Journal of Educational Research
FIGURE 1. Learning disability group differences inmathematical growth and achievement over the first6 years of school. IRT = item response theory; K =kindergarten; Spring 1 = spring of Grade 1; Spring 3 =spring of Grade 3; Spring 5 = spring of Grade 5.
the measurement tool implemented. As previously discussed,no instrument to assess mathematics LD has been used as thestandard and researchers have established no cutoff criterion,leading to differences in definitions and diagnosis of math-ematics LD and characteristics of samples across studies. AsMurphy, Mazzocco, Hanich, and Early (2007) pointed out,differences in the characteristics of samples may reduce thegeneralization of research findings, because of the hetero-geneity of participants’ deficits. Researchers of mathematicsLD indicated the need for more research on more effectivescreening measures of mathematics LD, the use of a standarddefinition of mathematics LD, and the monitoring of mathdevelopment at the early grades (Grade 1).
The unique contribution of this study is the clear demon-stration of the ever-widening mathematics achievement gapwith the passage of time for students with LD. An inter-esting result was that achievement differences in the threeLD subgroups and reference groups were firmly manifestedat the time of kindergarten entry. In fact, the mathemat-ics skill deficits of the late-emerging group were as severe asthose of the children in the early-emerging group. By the endof kindergarten, all three LD groups scored below the 25thpercentile on mathematics achievement and consistentlyperformed below the 25th percentile through Grade 5 (SeeTable 1). This is consistent with the literature as shown bythe 6-year follow-up study of Shalev, Manor, and Gross-Tsur(2005). They found that 95% of the students identified withLD continued to perform in the bottom 25% in later grades.In addition, the mathematical growth rate for students iden-tified as LD during the elementary school years was similar,suggesting that late-emerging learning disabilities of manystudents go undetected by the schools.
There are several possible explanations for the achieve-ment gap between non-LD and students with LD. A num-ber of researchers (e.g., Geary, Hoard, Byrd-Craven, Nu-gent, & Numtee, 2007; Geary, Hoard, & Hamson, 1999;Passolunghi & Siegal, 2001, 2004; L. Swanson & Kim,2007) have attributed mathematics performance with work-ing memory capacity and the central executive system (con-trolled attention). Their findings suggested that childrenwith limited working memory capacity have difficulties inmath performance and, without an increase of workingmemory capacity, those children may continue to performpoorly in mathematics. Consistent problems those studentstend to have are fact retrieval and word-problem solving,and working memory deficits seem to directly contribute tothe difficulty students with LD have in correctly retriev-ing math facts from long-term memory and in solving wordproblems.
Notwithstanding the importance of working memory formathematics achievement, some researchers (e.g., Garrett,Mazzocco, & Baker, 2006; Jordan & Hanich, 2000; Jordan& Montani, 1997; Shalev et al., 2005) have associated thecontinuing low performance of students with LD in mathe-matics with lower IQ, poor metacognitive skills, inattention,and other forms of LD (e.g., writing and reading difficul-ties). Those researchers indicated that mathematics diffi-culties are a persistent disorder such as dyslexia, attentiondeficit, and other disorders. In addition, Calhoon, Emerson,Flores, and Houchins (2007), Jordan, Hanich, and Kaplan(2003), and Ostad (1998) found that students with LD inmathematics continued to do poorly in each grade. Thosestudents showed slower acquisition of mathematical skillsthan normal-achieving students.
Several other researchers (e. g., Gable & Cohen, 1990;Jitendra, Salmento, & Haydt, 1999; Riccomini, 2005) haverelated mathematical skills growth to effective instructionthat is based on assessment and addresses the specific prob-lems of students. They called for a change in the design andimplementation of mathematics instruction. Chard, Baker,Jungjohann, Davis, and Smolkowski (2008) attributed stu-dents’ poor achievement in mathematics to poor instructionin the early grades. Although researchers are adamant thatteachers’ instructional decisions need to be supported by datacollection of students’ strengths and weaknesses, error iden-tification and analysis, and frequent evaluation of their per-formance, they frequently observe that mathematics instruc-tion is not based on assessment data. Riccomini (2005) foundthat several teachers were able to identify students’ errorpatterns, but they did not base their lessons on studenterror patterns. Consequently, teachers’ failure to use thedata to address students’ needs may cause inefficient instruc-tion, which in turn, may result in students’ slower progressthroughout the years. Naglieri and Johnson (2000), for ex-ample, successfully used a cognitive strategy that stressedplanning with students with planning and mathematicalcomputational difficulties. Interestingly, when the sameplanning strategy was provided to students with no planning
Dow
nloa
ded
by [
Uni
vers
ity o
f T
oron
to L
ibra
ries
] at
05:
44 1
7 O
ctob
er 2
014

The Journal of Educational Research 155
difficulties, students evidenced little improvement in theircomputation skills. Thus, effective, data-driven, evidence-based features of instruction of main concepts of mathe-matics (e.g., number sense) are critical to the growth ofmathematics skills (D. P. Bryant et al., 2008).
The findings of this study pose challenges for the responseto intervention (RTI) and the aptitude and achievementmethods for identifying LD. Students in this data set whowere identified early performed no better than late-identifiedstudents on mathematics measures at Grade 5, despite smallinitial differences at kindergarten entry. This finding un-derscores the need for early identification combined withfrequent assessment of progress and responsive instruction.As Gersten et al. (2005) pointed out, instruction should beeffective and focused on areas of deficit.
The trajectories of mathematics achievement of studentswith LD speak to the need for ongoing assessment of chil-dren’s acquisition of mathematical concepts in the early el-ementary years. Opponents of the traditional aptitude andachievement discrepancy approach for identifying LD arguethat children must wait to fail before intervention can occur(Fuchs & Fuchs, 2007). Advocates of RTI, a component ofIDEA 2004, assert that teachers no longer would have towait for students to fail before they could receive services.However, the results of this study pose challenges for boththe RTI and the aptitude and achievement methods for iden-tifying students with LD. This finding underscores the needfor early identification combined with frequent assessmentof progress and responsive instruction.
The Relationship of SES, Gender, Ethnicity, and Retention toMathematics Growth and Achievement
Not surprisingly, the results of this study show that stu-dents from higher SES, nonminority, boys, and students whohad higher scores at kindergarten entry tended to experi-ence more rapid growth than did minority students, girls,and lower SES students. These findings suggest that (a) SESoften has a negative impact on students’ school readinessand academic achievement (Berliner, 2006; Griffin, Case, &Siegler, 1994; Hart & Risley, 1995), (b) poverty is associatedwith minority students’ growth in mathematics (Blackorby& Wagner, 2005; Jordan et al., 2003; Msall, Avery, Msall, &Hogan, 2007; Smith, Brooks-Gunn, & Klebanoc, 1997), (c)teaching practices do not address the learning needs of girlsand of minority students in the classroom (Gist & King,2008), and (d) retention is not an effective interventionfor students with LD (Barnett et al., 1996; Jimerson, 2001;Jimerson et al., 2002).
Our results reflect the literature on the characteristics ofstudents with LD previously discussed in this article. Stu-dents with LD usually come from lower SES backgrounds,belong to minority groups, and have been retained a grade.Gender did not play a role in the recognition of LD, but wasassociated with mathematics growth. Our findings clearlysuggest the influence of the environment by indicating that
minority students started kindergarten with lower scores andtheir growth rate was smaller than the other students (exceptfor Asian or Pacific Islander students), and students fromhigher SES showed more rapid growth. Our results mirrorthe literature (see Jimerson et al., 2002; Jordan et al., 2003;Shalev et al., 2005). This indicates the need for additionalservices directed at minority students with and without LDto assure adequate progress over time.
Limitations
There are several limitations to the generalizability andvalidity of the conclusions that can be drawn from this study.First, other variables that were not included in the presentmodels may be better predictors of mathematics growth ormay explain the observed relationships among the includedvariables and mathematics growth. Most important, becausethis was a correlational study, it is impossible to draw causalinferences from the results of the study. Therefore, any stu-dent effects reported in this study are correlational in nature,and manipulation of the variables used in this study may ormay not produce similar results.
Although the ECLS-K began with a representative sam-ple of students, many students moved, missed assessments,changed schools, or could not be located, thus creating miss-ing data. In addition, at the school level, some administratorsand special education teachers neglected to complete thestudent record abstract and special education teacher ques-tionnaire or refused to respond to certain questions. Thiscreated missing data on whether a student was identified asLD. Missing data at both the student and school levels mayaffect the representativeness of the present sample, and thisconstitutes the largest limitation of the present investiga-tion. Finally, one of the costs of using a large database, suchas the ECLS-K, is that there is no information about the typeof LD, the severity of the LD, the number of years receivingspecial education services, or how the LD was diagnosed.Despite these limitations, the present study provides valu-able information about students’ mathematics growth andachievement over the elementary school years.
Conclusion
The results of this study complement previous work onthe developmental course of LD. Longitudinal studies onmathematics (e.g., Shalev et al., 2005) and reading (e.g.,Francis et al., 2005) show that LDs are persistent. We foundthat many students with LD in math went undetected untilthe late elementary grades when they had being consistentlyperforming in the low 25% through Grade 5. Among ourpredictor variables, retention was the only variable that didnot predict growth in mathematics. These results suggest theneed for better identification measures of math learning dif-ficulties and challenge researchers and educators to developand implement effective teaching strategies and curricula.
Dow
nloa
ded
by [
Uni
vers
ity o
f T
oron
to L
ibra
ries
] at
05:
44 1
7 O
ctob
er 2
014

156 The Journal of Educational Research
REFERENCES
Ackerman, P. T., & Dykman, R. A. (1995). Reading-disabled students withand without comorbid arithmetic disability. Developmental Neuropsychol-ogy, 11, 351–371.
Augustyniak, K., Murphy, J., & Phillips, D. K. (2005). Psychological per-spectives in assessing mathematics learning needs. Journal of InstructionalPsychology, 32, 277–286.
Barbaresi, W. J., Katusic, S. K., Colligan, R. C., Weaver, A. I., & Jacobsen,S. J. (2005). Math learning disorder: Incidence in a population-basedbirth cohort, 1976–1982, Rochester, Minn. Ambulatory Pediatrics, 5, 281–289.
Barnett, K. P., Clarizio, H. F., & Payette, K. A. (1996). Grade retentionamong students with learning disabilities. Psychology in the Schools, 33,285–293.
Berch, D. B. (2005). Making sense of number sense: Implications for chil-dren with mathematical disabilities. Journal of Learning Disabilities, 38,333–339.
Berliner, D. C. (2006). Our impoverished view of educational research.Teachers College Record, 108, 945–995
Blackorby, J., Chorost, M., Garza, N., & Guzman, A. M. (2005). Theacademic performance of elementary and middle school students withdisabilities [Electronic version]. In J. Blackorby, M. Wagner, R. Cameto,E. Davies, P. Levine, L. Newman, C. Marder, & C. Sumi (Eds.), Engage-ment, academics, social adjustment, and independence: The achievements ofelementary and middle school students with disabilities (pp. 49–70). MenloPark, CA: SRI International. Retrieved from http://www.seels.net
Blackorby, J., & Wagner, M. (2005). Students with disabilities in ele-mentary and middle school: Progress among challenges. In J. Blackorby,M. Wagner, R. Cameto, E. Davies, P. Levine, L. Newman, C. Marder,& C. Sumi (Eds.), Engagement, academics, social adjustment, and inde-pendence: The achievements of elementary and middle school students withdisabilities (pp. 105–116). Menlo Park, CA: SRI International. Retrievedfrom http://www.seels.net.
Blair, C., & Scott, K. G. (2002). Proportion of LD placements associatedwith low socioeconomic status: Evidence for a gradient? The Journal ofSpecial Education, 1, 14–22.
Bryant, B. R., Bryant, D. P., Kethley, C., Kim, S. A., Pool, C., & Seo,Y. J. (2008). Preventing mathematics difficulties in the primary grades:The critical features of instruction in textbooks as part of the equation.Learning Disability Quarterly, 31, 21–35.
Bryant, D. P., Bryant, B. R., & Hammill, D. D. (2000). Characteristicbehaviors of students with LD who have teacher-identified math weak-nesses. Journal of Learning Disabilities, 33, 250–254.
Bryk, A. S., & Raudenbush, S. W. (1992). Hierarchical linear models. Thou-sand Oaks, CA: Sage.
Butterworth, B. (2005). Developmental dyscalculia. In J. I. D. Campbell(Ed.), Handbook of mathematical cognition (pp. 455–467). New York, NY:Psychology Press.
Calhoon, M. B., Emerson, R. W., Flores, M., & Houchins, D. E. (2007).Computational fluency performance profile of high school studentswith mathematical disabilities. Remedial and Special Education, 28, 292–303.
Chard, D. J., Baker, S. K., Jungjohann, K., Davis, K., Smolkowski, K. (2008).Preventing early mathematics difficulties: The feasibility of a rigorouskindergarten mathematics curriculum. Learning Disability Quarterly, 31,11–20.
Child Trends DataBank. (n.d.). Learning disabilities. Retrieved fromhttp://www.childtrendsdatabank.org/indicators/65LearningDisabilities.cfm
Dedrick, R. F., Ferron, J. M., Hess, M. R., Hogarty, K. Y., Kromrey, J. D.,Lang, T. R., . . . Lee, R. S. (2009). Multilevel modeling: A review ofmethodological issues and applications. Review of Educational Research,79, 69–102.
Denton, K., & West, J. (2002). Children’s reading and mathematics achieve-ment in kindergarten and first grade (NCES 2002–125). Washington, DC:U.S. Department of Education.
Francis, D. J., Fletcher, J. M., Stuebing, K. K., Lyon, G. R., Shaywitz, B. A.,& Shaywitz, S. E. (2005). Psychometric approaches to the identificationof learning disabilities: IQ and achievement scores are not sufficient.Journal of Learning Disabilities, 38, 98–110.
Fuchs, L. S., Compton, D. L., Fuchs, D., Paulsen, K., Bryant, J. D., &Hamlett, C. L. (2005). The prevention, identification, and cognitivedeterminants of math difficulty. Journal of Educational Psychology, 97,493–513.
Fuchs, L. S., & Fuchs, D. (2007). A model for implementing responsivenessto intervention. Teaching Exceptional Children, 39, 14–20.
Fuchs, L. S., Fuchs, D., Compton, D. L., Hamlett, C. L., & Seethaler,P. M. (2007). Mathematics screening and progress monitoring at firstgrade: Implications for interventions. Exceptional Children, 73, 311–330.
Fuchs, L. S., Fuchs, D., & Prentice, K. (2004). Responsiveness to math-ematical problem-solving instruction: Comparing students at risk formathematics disability with or without risk of reading disability. Journalof Learning Disabilities, 37, 293–303.
Gable, R. A., & Cohen, S. S. (1990). Errors in arithmetic. In R. A. Gable &J. M. Hendrickson (Eds.), Assessing students with special needs (pp. 30–45).New York, NY: Longman.
Garcia, A. I., Jimenez, E., & Hess, S. (2006). Solving arithmetic wordproblems: An analysis of classification as a function of difficulty in chil-dren with and without arithmetic LD. Journal of Learning Disabilities, 39,270–281.
Garmezy, N. (1993). Children in poverty: Resilience despite risk. Psychiatry,56, 127–136.
Garmezy, N., & Masten, A. S. (1986). Stress, competence, and resilience:Common frontiers for therapist and psychopathologists. Behavior Ther-apy, 17, 500–521.
Garrett, A. J., Mazzocco, M. M. M., & Baker, L. (2006). Development ofthe metacognitive skills of prediction and evaluation in children withand without math disability. Learning Disabilities Research and Practice, 2,77–88.
Geary, D. C. (1993). Mathematical disabilities: Cognitive, neuropsy-chological and genetic components. Psychological Bulletin, 114, 345–362.
Geary, D. C. (2004). Mathematics and learning disabilities. Journal of Learn-ing Disabilities, 37, 4–15.
Geary, D. C., Hoard, M. K., Byrd-Craven, J., Nugent, L., & Numtee,C. (2007). Cognitive mechanism underlying achievement deficits inchildren with mathematical learning disability. Child Development, 78,1343–1359.
Geary, D. C., Hoard, M. K., & Hamson, C. O. (1999). Numerical andarithmetical cognition: Patterns of functions and deficits in children atrisk for a mathematical disability. Journal of Experimental Child Psychology,74, 231–239.
Gersten, R., Jordan, N. C., & Flojo, J. R. (2005). Early identification and in-terventions for students with mathematics difficulties. Journal of LearningDisabilities, 38, 293–304.
Gist, E. A., & King, M. (2008). Different, not better: Gender differences inmathematics learning and achievement. Journal of Instructional Psychol-ogy, 35, 43–53.
Griffin, S. A., Case, R., & Siegler, R. S. (1994). Rightstart: Providing thecentral conceptual prerequisites for first formal learning of arithmetic tostudents at risk for school failure. In K. McGilly (Ed.), Classroom lessons:Integrating cognitive theory and classroom practice (pp. 24–49). Cambridge,MA: MIT Press.
Gross-Tsur, V., Manor, O., & Shalev, R. S. (1996). Developmental dyscal-culia: Prevalence and demographic features. Developmental Medicine andChild Neurology, 38, 25–33.
Harry, B., & Anderson, M. G. (1994). The disproportionate representationof African-American males in special education programs: A critique ofthe process. Journal of Negro Education, 63, 602–619.
Hart, B., & Risley, T. R. (1995). Meaningful differences in the everydayexperience of young American children. Baltimore, MD: Brooks.
Herring, W. L., McGrath, D. J., & Buckley, J. A. (2007). Demographic andschool characteristics of students receiving special education in the elementarygrades. Washington, DC: National Center for Education Statistics.
Individuals with Disabilities Education Act Amendments of 2004, Pub. L.No. 108–446, 20 U.S.C 1400 (2004).
Jimerson, S. R. (2001). Meta-analysis of grade retention research: Impli-cations for practice in the 21st century. School Psychology Review, 30,313–330.
Jimerson, S. R., Anderson, G. E., & Whipple, A. D. (2002). Winningthe battle and losing the war: Examining the relation between graderetention and dropping out of high school. Psychology in the Schools, 39,441–457.
Jitendra, A. K., Salmento, M. M., & Haydt, L. A. (1999). A case analysisof fourth-grade subtraction instruction in basal mathematics programs:Adherence to important instructional design and criteria. Learning Dis-ability Research and Practice, 14, 69–79.
Dow
nloa
ded
by [
Uni
vers
ity o
f T
oron
to L
ibra
ries
] at
05:
44 1
7 O
ctob
er 2
014

The Journal of Educational Research 157
Jordan, N. C. (1995). Clinical assessment of early mathematics disabilities:Adding up the research findings. Learning Disabilities Research & Practice,10, 59–69.
Jordan, N. C., & Hanich, L. B. (2000). Mathematical thinking in second-grade children with different forms of LD. Journal of Learning Disabilities,33, 567–578.
Jordan, N. C., & Hanich, L. B., & Kaplan, D. (2003). A longitudinalstudy of mathematical competencies in children with specific mathemat-ics difficulties versus children with comorbid mathematics and readingdifficulties. Child Development, 74, 834–850.
Jordan, N. C., & Montani, T. O. (1997). Cognitive arithmetic and problemsolving: A comparison of children with specific and general mathematicsdifficulties. Journal of Learning Disabilities, 30, 624–634.
Kavale, K.A., & Forness, S. R. (2000). What definitions of learning disabil-ity say and don’t say: A critical analysis. Journal of Learning Disabilities,33, 239–256.
Kovas, Y., Haworth, C. M. A., Petrill, S. A., & Plommin, R. (2007). Math-ematical ability of 10-year-old boys and girls: Genetic and environmentaletiology of typical and low performance. Journal of Learning Disabilities,40, 554–567.
Lee, J., Grigg, W., & Donahue, P. (2007). The Nation’s Report Card: Reading2007 (NCES 2007–496). Washington, DC: National Center for Educa-tion Statistics.
Lerner, J., & Johns, B. (2009). Learning disabilities and related mild disabilities:Characteristics, teaching strategies, and new directions (11th ed.). Boston,MA: Houghton Mifflin.
Lewis, C., Hitch, G. J., & Walker, P. (1994). The prevalence of specificarithmetic difficulties and specific reading difficulties in 9- to 10-year-old boys and girls. Journal of Child Psychology and Psychiatry, 35, 283–292.
Mazzocco, M. M. M. (2005). Challenges in identifying target skills for mathdisability screening and intervention. Journal of Learning Disabilities, 38,318–323.
Mazzocco, M. M. M., & Myers, G. F. (2003). Complexities in identifyingand defining mathematics learning disability in the primary school ageyears. Annuals of Dyslexia, 53, 218–253.
McLeskey, J., & Grizzle, K. L. (1992). Grade retention rates among studentswith learning disabilities. Exceptional Children, 58, 548–554.
Mercer, C. D., & Miller, S. P. (1992). Teaching students with learningproblems in math to acquire, understand, and apply basic math facts.Remedial and Special Education, 13, 19–35.
Miller, S. P., & Mercer, C. D. (1997). Educational aspects of mathematicsdisabilities. Journal of Learning Disabilities, 30, 47–56.
Msall, M. E., Avery, R. C., Msall, E. R., & Hogan, D. P. (2007). Dis-tressed neighborhoods and child disability rates: Analyses of 157,000school-age children. Developmental Medicine & Child Neurology, 49,814–817.
Murphy, M. M., Mazzocco, M. M. M., Hanich, L. B., & Early, M. C.(2007). Cognitive characteristics of children with mathematics learningdisability (MLD) vary as a function of the cutoff criterion used to defineMLD. Journal of Learning Disabilities, 40, 458–478.
Naglieri, J. A., & Johnson, D. (2000). Effectiveness of a cognitive interven-tion in improving arithmetic computation based on the PASS theory.Journal of Learning Disabilities, 33, 591–597.
National Council of Mathematics Educators. (2004). Principles & standardsfor school mathematics. Retrieved from http://www.nctm.org/standards
National Mathematics Advisory Panel. (2008). Foundations for success: Thefinal report of the National Mathematics Advisory Panel. Washington, DC:U.S. Department of Education.
No Child Left Behind Act of 2001, Pub. L. No. 107–110, 20 U.S.C. 6301(2002).
Ostad, S. A. (1998). Developmental differences in solving simple arith-metic word problems and simple number-fact problems: A comparison ofmathematically normal and mathematical disabled children. Mathemati-cal Cognition, 4, 1–20.
Passolunghi, M. C., & Siegel, L. S. (2001). Short-term memory, workingmemory, and inhibitory control in children with difficulties in arith-metic problem solving. Journal of Experimental Child Psychology, 80,44–57.
Passolunghi, M. C., & Siegel, L. S. (2004). Working memory and access tonumerical information in children with disability in mathematics. Journalof Experimental Child Psychology, 88, 348–367.
Raudenbush, S. W., & Bryk, A. S. (2002). Hierarchical linear models: Appli-cations and data analysis methods (2nd ed.). Thousand Oaks, CA: Sage.
Raudenbush, S., Bryk, A., Cheong, Y. F., & Congdon, R. (2004). HLM6: Hierarchical linear and nonlinear modeling. Lincolnwood, IL: ScientificSoftware International.
Reschly, D. J. (1997). Disproportionate minority representation in general andspecial education: Patterns, issues, and alternatives. Des Moines, IA: DrakeUniversity, Mountain Plains Regional Resource Center. Retrieved fromERIC database. (ED415632)
Riccomini, P. J. (2005). Identification and remediation of systematic errorpatterns in subtraction. Learning Disability Quarterly, 28, 233–242.
Roderick, M., Nagaoka, J., Bacon, J., & Easton, J. Q. (2000). Update: End-ing social promotion—Passing, retention, and achievement among promotedand retained students, 1995–1999. Chicago, IL: Consortium on ChicagoSchool Research.
Shalev, R. S., & Gross-Tsur, V. (2001). Developmental dyscalculia. Pedi-atrics Neurology, 24, 337–342.
Shalev, R. S., Manor, O., & Gross-Tsur, V. (2005). Developmental dyscal-culia: A prospective six-year follow-up. Developmental Medicine and ChildNeurology, 47, 121–125.
Singer, J. D., & Willett, J. B. (2003). Applied longitudinal data analysis. NewYork, NY: Oxford University Press.
Smith, J. R., Brooks-Gunn, J., & Klebanoc, P. K. (1997). Consequences ofliving in poverty for young children’s cognitive and verbal ability andearly school achievement. In G. J. Duncan & J. Brooks-Gunn (Eds.),Consequences of growing up poor (pp. 132–189). New York, NY: SageFoundation.
Swanson, H. L., & Jerman, O. (2006). A selective meta-analysis of theliterature. Review of Educational Research, 76, 249–279.
Swanson, L., & Kim, K. (2007). Working memory, short-term-memory,and naming speed as predictors of children’s mathematical performance.Intelligence, 35, 151–168.
Tourangeau, K., Nord, C., Le, T., Pollack, J. M., & Atkins-Burnett, S.(2006). Early childhood longitudinal study kindergarten class of 1998–99(ECLS-K), Combined user’s manual for the ECLS-K fifth-grade data filesand electronic codebooks (NCES 2006–032). Washington, DC: NationalCenter for Education Statistics.
U.S. Department of Education. (1998). Twentieth annual report to Congresson the implementation of the Individuals with Disabilities Education Act.Washington, DC: Author. Retrieved from ERIC database. (ED424722)
U. S. Department of Education. (2000). ECLS-K restricted access studentabstract data files. Washington, DC: Author.
Van Luit, H. E. H., & Schopman, E. A. M. (2000). Improving early numer-acy of young children with special needs. Remedial and Special Education,21, 27–40.
Werner, E. E. (1993). Risk, resilience, and recovery: Perspectives fromthe Kauai Longitudinal Study. Developmental and Psychopathology, 5,503–515.
AUTHORS NOTE
Sharon Judge is the Associate Dean of the Darden Col-lege of Education at Old Dominion University in Norfolk,Virginia. Prior to this appointment, she was a Professor andCoordinator of the doctoral program in Special Educationin the College. Before coming to Old Dominion Univer-sity in 2006, she was Professor of Special Education at theUniversity of Tennessee for 12 years. She has been a con-sistent recipient of external grants; the most recent includea U.S. Department of Education Teacher Quality Partner-ship grant. She has published numerous articles, chapters,and a book in the areas of assistive technology, professionaldevelopment, and children with special needs.
Silvana M. R. Watson, PhD, is an Associate Professor ofSpecial Education at Old Dominion University in Norfolk,Virginia. Her current research interests are cognition andlearning, instructional strategies for students with learningdisabilities and English language learners.
Dow
nloa
ded
by [
Uni
vers
ity o
f T
oron
to L
ibra
ries
] at
05:
44 1
7 O
ctob
er 2
014