longitudinal profile -...
TRANSCRIPT
Stream Habitat Measurement Techniques Day 2: Stream Survey
Longitudinal Profile
Longitudinal Profile Overview
Longitudinal Profile Instructions
Plan and Profile Diagram of Longitudinal Profile, Figure A-7
Sample Longitudinal Profile Survey Notes, Table A-4
Longitudinal Profile Survey Forms
Copyright © 2013 Wildland Hydrology
Stream Habitat Measurement Techniques Day 2: Field Day
1
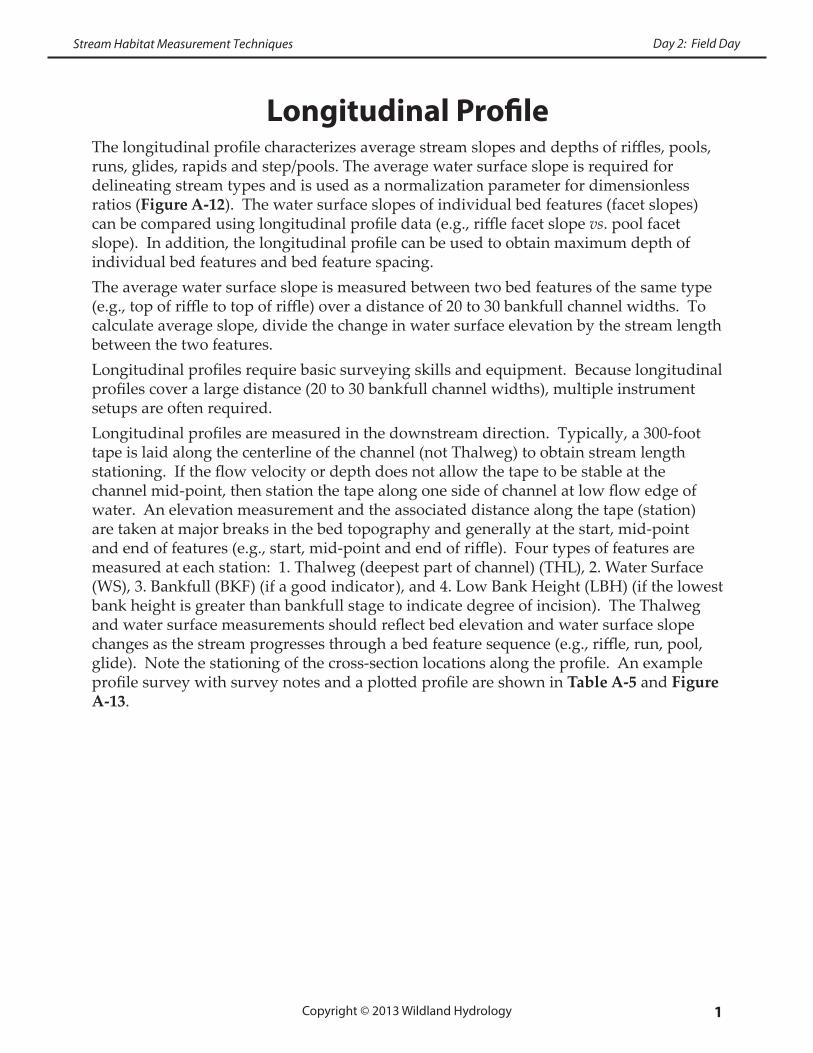
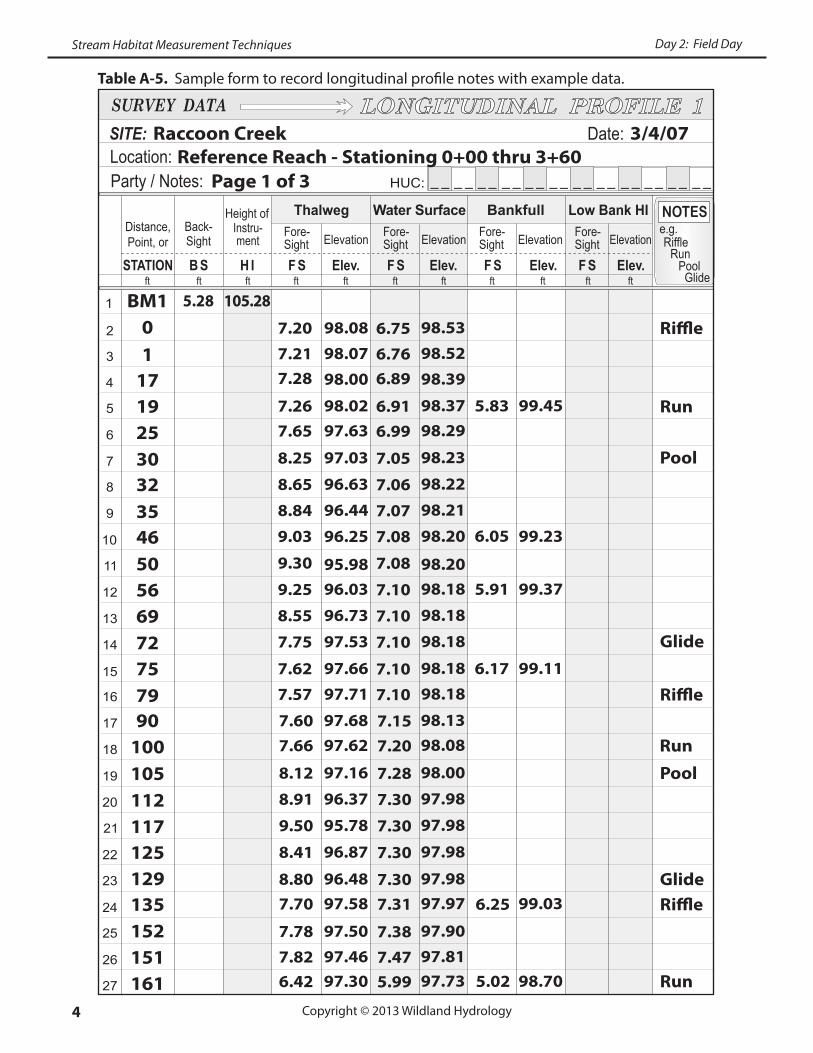
Longitudinal ProfileThelongitudinalprofilecharacterizesaveragestreamslopesanddepthsofriffles,pools,runs,glides,rapidsandstep/pools.Theaveragewatersurfaceslopeisrequiredfordelineatingstreamtypesandisusedasanormalizationparameterfordimensionlessratios(Figure A-12).Thewatersurfaceslopesofindividualbedfeatures(facetslopes)canbecomparedusinglongitudinalprofiledata(e.g.,rifflefacetslopevs.poolfacetslope).Inaddition,thelongitudinalprofilecanbeusedtoobtainmaximumdepthofindividualbedfeaturesandbedfeaturespacing.Theaveragewatersurfaceslopeismeasuredbetweentwobedfeaturesofthesametype(e.g.,topofriffletotopofriffle)overadistanceof20to30bankfullchannelwidths.Tocalculateaverageslope,dividethechangeinwatersurfaceelevationbythestreamlengthbetweenthetwofeatures.Longitudinalprofilesrequirebasicsurveyingskillsandequipment.Becauselongitudinalprofilescoveralargedistance(20to30bankfullchannelwidths),multipleinstrumentsetupsareoftenrequired.Longitudinalprofilesaremeasuredinthedownstreamdirection.Typically,a300-foottapeislaidalongthecenterlineofthechannel(notThalweg)toobtainstreamlengthstationing.Iftheflowvelocityordepthdoesnotallowthetapetobestableatthechannelmid-point,thenstationthetapealongonesideofchannelatlowflowedgeofwater.Anelevationmeasurementandtheassociateddistancealongthetape(station)aretakenatmajorbreaksinthebedtopographyandgenerallyatthestart,mid-pointandendoffeatures(e.g.,start,mid-pointandendofriffle).Fourtypesoffeaturesaremeasuredateachstation:1.Thalweg(deepestpartofchannel)(THL),2.WaterSurface(WS),3.Bankfull(BKF)(ifagoodindicator),and4.LowBankHeight(LBH)(ifthelowestbankheightisgreaterthanbankfullstagetoindicatedegreeofincision).TheThalwegandwatersurfacemeasurementsshouldreflectbedelevationandwatersurfaceslopechangesasthestreamprogressesthroughabedfeaturesequence(e.g.,riffle,run,pool,glide).Notethestationingofthecross-sectionlocationsalongtheprofile.AnexampleprofilesurveywithsurveynotesandaplottedprofileareshowninTable A-5andFigure A-13.
Copyright © 2013 Wildland Hydrology
Stream Habitat Measurement Techniques Day 2: Field Day
2
Longitudinal Profile Instructions1. Setuptheinstrumentwithaclearlineofsighttoabenchmark.Thefirstsetupshouldreference(backsight)abenchmark(BM)ofknownelevation.Approximatethenumberandlocationofeachsetupneededbasedonpotentialline-of-sightlimitations.Theinstrumentshouldbeplacedatanelevationhigherthanthehighestfeaturerequiredforthesurvey.
2. Backsight(BS)thebenchmark(placetherodonthebenchmarkandobtainarodreading).Determinetheheightoftheinstrument(HI).HI=BMelevation+BSrodreading.
3. Startingattheupstreamendofthereach,positiona300-foottapealongthecenterlineofthechannelifflowpermitsoralongedgeofwatertoobtainstreamlengthstationing.
4. PlacetherodattheThalwegatstation0onthetape.Obtaintherodreadingandrecordthevalueintheforesight(FS)columnasshowninTable A-5.Recordwatersurface,bankfullandlowestbankheightmeasurements(iflowestbankheightisgreaterthanbankfullstage)perpendiculartothetapeatstation0asshowninFigure A-12.(Note: LBHinFigure A-12atstation0+00isthesameasBKF).
5. Continuethesamesequencedownstreamtothestart,mid-pointandendofmajorbedfeaturesandrepeatthesamemeasurementsatthenewstations.
6. Atcross-sectionintersectionlocations,notethedistance(station)onthelongitudinalprofiletape.Whenusingmultipleinstrumentsetups,takeameasurementontopofbothcross-sectionendpointstoobtaincommonelevationsofthecross-sectionandlongitudinalprofile.
7. Profileyourentirereach(20to30bankfullchannelwidthsisnormallyusedasaminimumlongitudinalprofilelengthguideline).
8. Plotthelongitudinalprofile(Figure A-13).9. Plotthecross-sectionlocationandthecorrespondingbankfullelevationonthelongitudinalprofile(Figure A-13).
10.Drawalinethroughthewatersurfacedatapointsofthesamebedfeature(e.g.,topofriffletotopofriffle)torepresenttheaveragewatersurfaceslope.Drawabest-fitlinethroughthebankfulldatapoints.
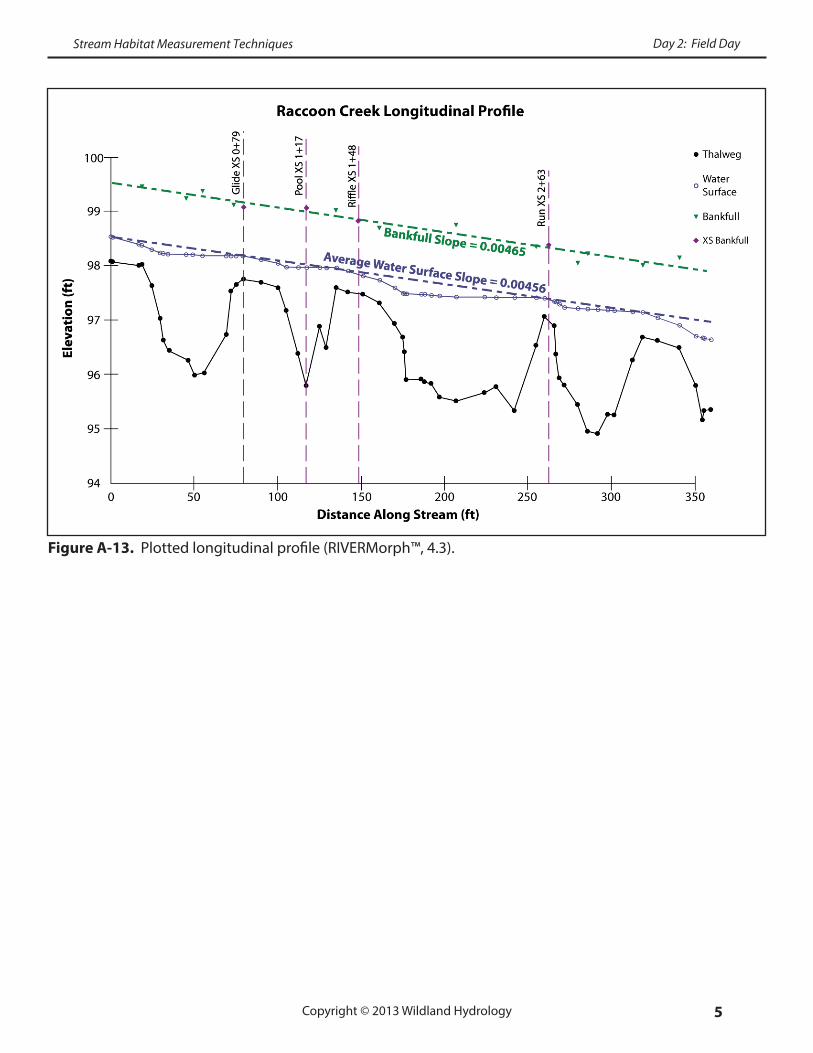
11.Determinetheaveragewatersurfaceslopeandenterintoforms(Worksheet A-1andWorksheet A-3).DeterminebankfullslopeandenterintoWorksheet A-2. Note: The averagewatersurfaceslopeandthebankfullslopeshouldbeparallel.
Copyright © 2013 Wildland Hydrology
Stream Habitat Measurement Techniques Day 2: Field Day
3
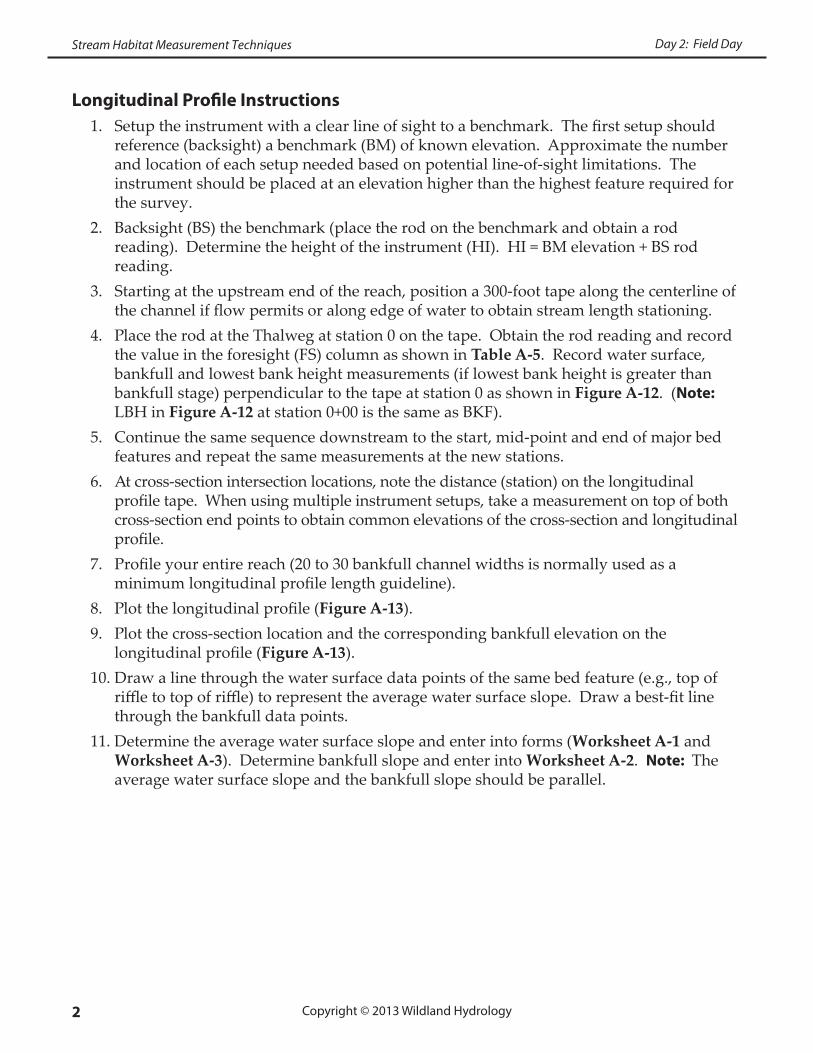
Figure A-12. Plan and profile views of a longitudinal profile indicating slope and bed feature measurement locations. Note: Stationing distance in this example is measured along right edge of water (REW).
Average Water Surface Slope (S): Elevationofwatersurfaceoverstreamlengthatthesamepositionabovebedfeaturesforseveralriffle/poolorstep/poolsequences(e.g.,elevationdifferencefromthetopofriffletotopofnextriffleoverthelengthofthestream).Thisvaluewillnormallyapproximatetheaveragebankfullslope.Average Bankfull Slope (Sbkf):Theelevationdifferenceofbankfullindicatorsalongthestreamlength.Theelevationdifferencesareobtainedfromabest-fitlinedrawnbetweenbankfullindicatorsalongthelongitudinalprofile,whichisgenerallyparallelandsimilartotheaveragewatersurfaceslope(S).
Copyright © 2013 Wildland Hydrology
Stream Habitat Measurement Techniques Day 2: Field Day
4
SITE:Location:
Date:
Party / Notes:
Distance, Back-Sight
Fore-Sight
Height ofInstru-mentPoint, or
STATION B S H I F S Elev.ftft ftftft
1
2
3
4
7
10
14
18
5
8
11
15
19
21
25
23
27
6
9
13
17
12
16
20
22
26
24
NOTES
LONGITUDINAL PROFILE 1SURVEY DATA
HUC: _ _ _ _ _ _ _ _ _ _ _ _ _ _ _ _ _ _ _ _ _ _ _ _
F S Elev.ftft
F S Elev.ftft
Fore-Sight
Fore-Sight
Elev.F S
Fore-Sight
ft ft
Elevation Elevation Elevation Elevation
Glide
e.g.Riffle
RunPool
Thalweg Water Surface Bankfull Low Bank HI
Raccoon Creek
Page 1 of 3
3/4/07Reference Reach - Stationing 0+00 thru 3+60
191710
253032
Ri�e
504635
566972
5.83
6.05
5.91
6.17
6.25
5.02
98.0898.0798.00
98.0297.63
97.03
96.6396.4496.25
95.9896.0396.73
97.53
97.6697.71
97.6897.62
97.1696.37
95.78
96.87
96.4897.58
97.5097.4697.30
99.45
99.23
99.37
99.11
99.03
98.70
Run
Pool
Glide
757990
100105112117125129135152151161
Ri�e
RunPool
GlideRi�e
Run
7.207.217.28
7.267.65
8.25
8.658.849.03
9.30
9.258.55
7.75
7.627.57
8.41
9.50
8.918.12
7.667.60
8.807.70
7.787.826.42
98.5398.5298.39
98.3798.29
98.23
98.2298.2198.20
98.2098.1898.18
98.18
98.1898.18
98.1398.08
98.0097.98
97.98
97.98
97.9897.97
97.9097.8197.73
6.756.766.89
6.916.99
7.05
7.067.077.08
7.08
7.107.10
7.10
7.107.10
7.30
7.30
7.307.28
7.207.15
7.307.31
7.387.475.99
5.28 105.28BM1
Table A-5. Sample form to record longitudinal profile notes with example data.
Copyright © 2013 Wildland Hydrology
Stream Habitat Measurement Techniques Day 2: Field Day
5
Figure A-13. Plotted longitudinal profile (RIVERMorph™, 4.3).
Copyright © 2013 Wildland Hydrology
Stream Habitat Measurement Techniques Day 2: Field Day
SITE:Location:
Date:
Party / Notes:
Distance, Back-Sight
Fore-Sight
Height ofInstru-mentPoint, or
STATION B S H I F S Elev.ftft ftftft
1
2
3
4
7
10
14
18
5
8
11
15
19
21
25
23
27
6
9
13
17
12
16
20
22
26
24
NOTES
LONGITUDINAL PROFILE 1SURVEY DATA
HUC: _ _ _ _ _ _ _ _ _ _ _ _ _ _ _ _ _ _ _ _ _ _ _ _
F S Elev.ftft
F S Elev.ftft
Fore-Sight
Fore-Sight
Elev.F S
Fore-Sight
ft ft
Elevation Elevation Elevation Elevation
Glide
e.g.Riffle
RunPool
Thalweg Water Surface Bankfull Low Bank HI
Copyright © 2013 Wildland Hydrology
Stream Habitat Measurement Techniques Day 2: Field Day
SITE:Location:
Date:
Party / Notes:
Distance, Back-Sight
Fore-Sight
Height ofInstru-mentPoint, or
STATION B S H I F S Elev.ftft ftftft
28
29
30
31
34
37
41
45
32
35
38
42
46
48
52
50
54
33
36
40
44
39
43
47
49
53
51
NOTES
LONGITUDINAL PROFILE 2SURVEY DATA
HUC: _ _ _ _ _ _ _ _ _ _ _ _ _ _ _ _ _ _ _ _ _ _ _ _
F S Elev.ftft
F S Elev.ftft
Fore-Sight
Fore-Sight
Elev.F S
Fore-Sight
ft ft
Elevation Elevation Elevation Elevation
Glide
e.g.Riffle
RunPool
Thalweg Water Surface Bankfull Low Bank HI