long‐termtransmission capacityplanning in a scenario ... · long‐termtransmission...
TRANSCRIPT

Long‐term transmission capacity planning in a scenario with high share variable renewable energies
Presenter: Stéphane Allard, G2Elab, Univ. Grenoble Alpes, France
Authors: Stéphane Allard, Silvana Mima, Vincent Debusschere,Tuan Quoc Tran, Patrick Criqui and Nouredine Hadj‐Saïd
1

2
Plan
I. ContextII. State of the art modelingIII. EUTGRID, a new transmission capacity planning moduleIV.Conclusions & perspectives
3
Climate‐energypolicies
(CO2 reduction)Fight against
global warmingNeed prospective studies :long‐term energy models
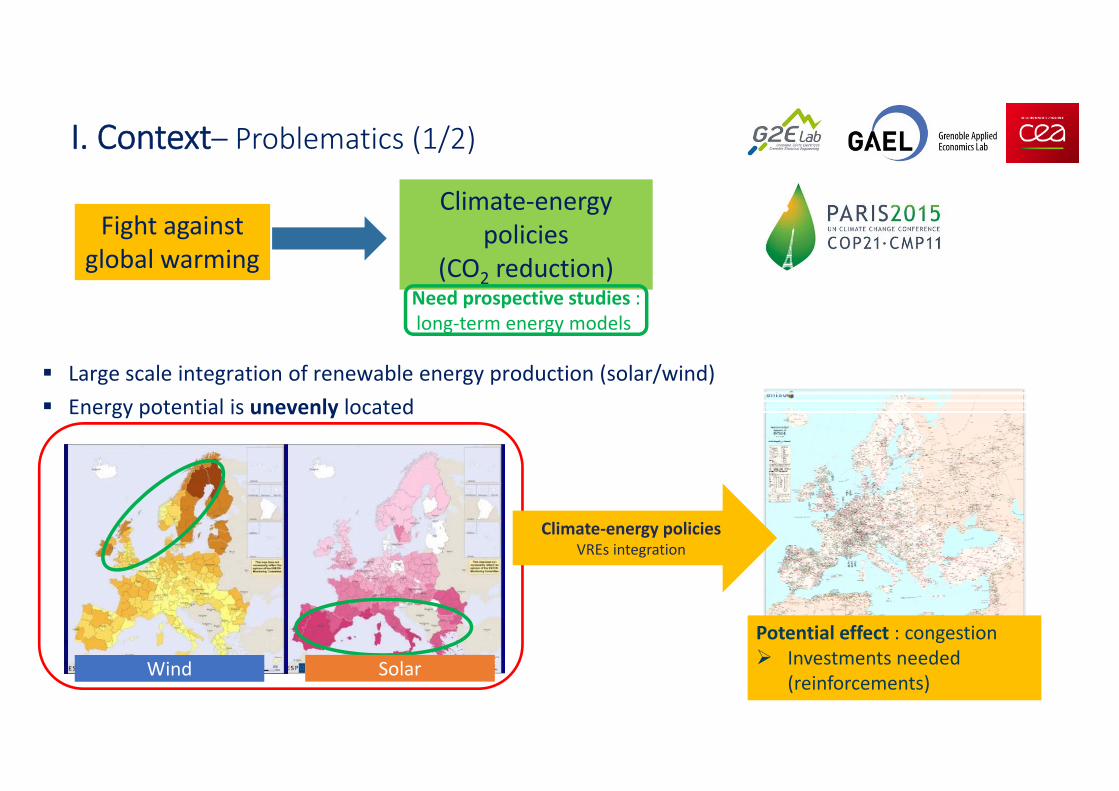
I. Context– Problematics (1/2)
Large scale integration of renewable energy production (solar/wind) Energy potential is unevenly located
Potential effect : congestion Investments needed
(reinforcements)
Climate‐energy policiesVREs integration
Wind Solar

4
Electrical grid must obey one fundamental law: • Production = Consumption all the time
Short‐term management (an hour):• Equalizes demand and supply facing accidents and local infrastructure
Long‐term planning (4 to 10 years):• Locates future bottlenecks at European level
Objective :Optimal interactions between different time‐steps :• Our focus
Insure investments in long‐term will help short‐term management
Short‐term24 hours optimization
Long‐termInvestments decisons
Congestion
Reinforcement in the grid
I. Context – Problematics (2/2)

5
Engineering models:• Short‐term management (ex: DIgSILENT)• Long‐term planning: (ex: ANTARES (RTE) ‐ Monte‐Carlo or ELMOD ‐ social welfare)
Long‐term energy models:• Few implement a power sector module• Ex: PRIMES (34 nodes, DC load flow, grid investments with NTC)
TIMES (35 nodes, DC load flow, grid investments with NTC)• POLES has been improved with EUCAD (24 nodes, transport model)
II. State of the art modeling
POLES* (developped since 1990)
• Used by European Union, Enerdata• Global (57 countries/regions)• Up to 2100• Many different energies
(electricity, gas, oil, etc)• Bottom‐up (45 explicit technologies)
*Prospective Outlook Long‐term Energy Systems

III. EUTGRID, a new transmission capacity planning module
POLESYEARN‐1
POLESYEARN+1
State of the power system
EUTGRID inputs
• Demand evolution• Costs evolution• Technical evolution• EUTGRID outputs
Investmentsdecisions
POLESYEAR N
DemandOperation Costs
Installed CapacitiesInterconnections capacitiesDispatchable consumptions
EUTGRID
Congestion : Decisons taken every 5 years(Grid investment mechanism)
Hourly productionHourly storageHourly imports/exportsProduction curtailmentUnserved loadInterconnections (reinforcement / new)
EUTGRID : EUropean Transmission GRid Investment and Dispatch→ optimizes total operating costs of the system taking into account constraints
1. Increases spatial division (more nodes per country [86 nodes – 24 countries] )2. Implementing loadflow (Grid characteristics)3. Grid investment mechanism based on nodal prices
6
7
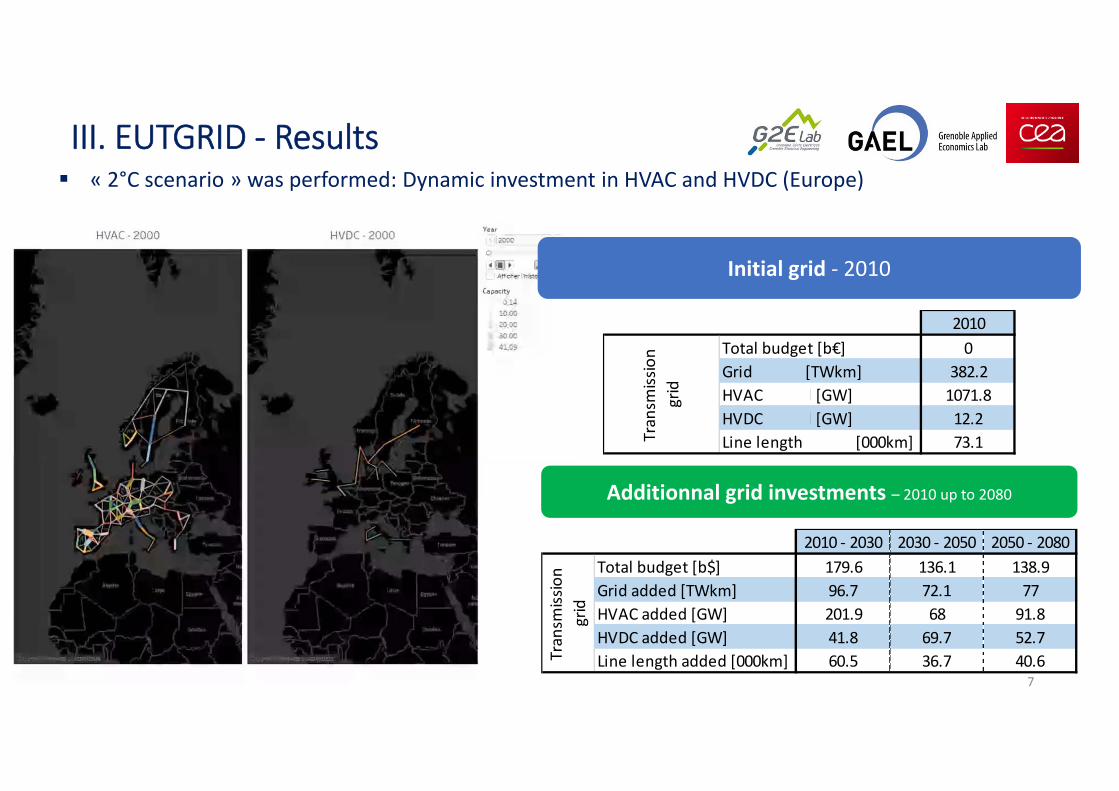
III. EUTGRID ‐ Results « 2°C scenario » was performed: Dynamic investment in HVAC and HVDC (Europe)
2010 ‐ 2030 2030 ‐ 2050 2050 ‐ 2080Total budget [b$] 179.6 136.1 138.9Grid added [TWkm] 96.7 72.1 77HVAC added [GW] 201.9 68 91.8HVDC added [GW] 41.8 69.7 52.7Line length added [000km] 60.5 36.7 40.6Tr
ansm
ission
grid
2010Total budget [b€] 0Grid added [TWkm] 382.2HVAC added [GW] 1071.8HVDC added [GW] 12.2Line length added [000km] 73.1Tr
ansm
ission
grid
Initial grid ‐ 2010
Additionnal grid investments – 2010 up to 2080

8
III. EUTGRID ‐ Results « 2°C scenario » : 3 different sub‐cases
1. Copper plate2. Grid investment mechanism implemented3. No grid investment after 2030
transmission grid investments from TYNDP 2014 (ENTSO‐E) are assumed to be done
Analysis of different indicators
9
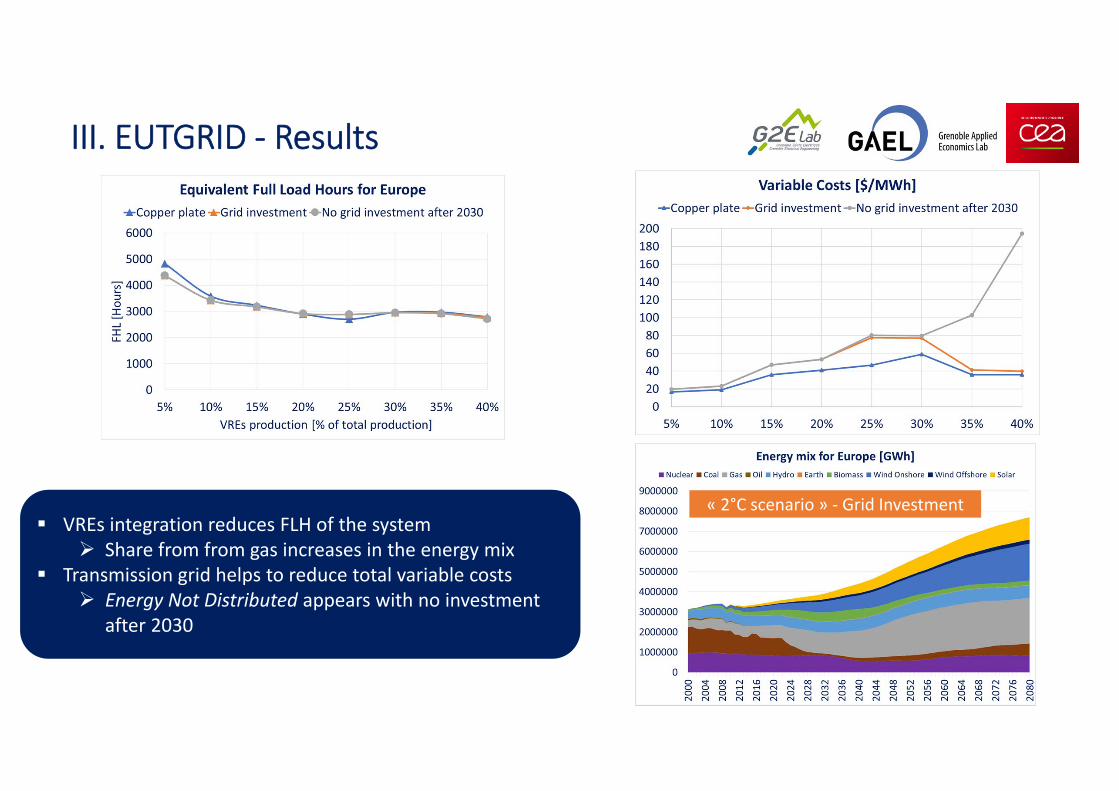
III. EUTGRID ‐ Results
VREs integration reduces FLH of the system Share from from gas increases in the energy mix
Transmission grid helps to reduce total variable costs Energy Not Distributed appears with no investment
after 2030
« 2°C scenario » ‐ Grid Investment

10
III. EUTGRID ‐ Results
With VREs integration, Curtailment, Storage and DemandResponse increase
Transmission Grid helps to reduce their use
11
IV. Conclusions & Perspectives
Realisations: EUTGRID coupled with POLES• Increases spatial division (VREs unevenly located)• Implementing loadflow (realistic power flows)• Grid investment mechanism (realistic decisions to reinforce the grid HVAC/HVDC)
Results: “2°C scenario” was performed• VREs integration reduces equivalent FLH for the system• Transmission grid helps to reduce operating costs• Transmission grid investment helps to reduce VREs curtailment• Storage & DR are needed in all sub‐scenarios
Perspectives:• A sensitivity analysis should be performed on different parameters
(such as costs HVAC/HVDC, costs of batteries, ROI)• Analysis of movements of VREs decentralization in the sub‐transmission
and distribution grids

12
Thank you for your attention!
Presenter: Stéphane Allard, G2Elab, Univ. Grenoble Alpes, France
Authors: Stéphane Allard123, Silvana Mima2, Vincent Debusschere1, Tuan Quoc Tran3, Patrick Criqui2 and Nouredine Hadj‐Saïd1
1G2Elab, Univ. Grenoble Alpes, France2GAEL, Univ. Grenoble Alpes, France3CEA ‐ INES, Univ. Grenoble Alpes, France

Initialization: Run a loadflow Save total costs
List for all lines: Transmission costs between nodes Costs of investments for HVAC/HVDC
G1
G2
100 MW
100 MW
C3200 MW
150 MW Maxi∆ €/
50 MW∆ €/
50 MW∆ €/
Lines Congestioncosts
HVAC investment
HVDC investment
G2-C3 15 €/MWh €€ €€€
G1-C3 10 €/MWh €€ €€€
G1-G2 5 €/MWh €€ €€€
45000€
Run a loadflow with: A capacity increase at highest congested line Choose cheapest technology Saves total costs
Grid Investment mechanism
Annex 1

Initialization: Run a loadflow Save total costs
Run a loadflow with: A capacity increase at highest congested line Choose cheapest technology Saves total costs
List for all lines: Transmission costs between nodes Costs of investments for HVAC/HVDC
Calculates ratio :
If ratio≤ reinforcement is accepted
If ratio> line is removed from the list
G1
G2
33,33 MW
166,67 MW
C3200 MW
150 + 20 MW Maxi∆ €/
3,33 MW∆ €/
30 MW∆ €/
4166,67€Lines Congestion
costsHVAC investment
HVDC investment
G2-C3 15 €/MWh €€ €€€
G1-C3 10 €/MWh €€ €€€
G1-G2 5 €/MWh €€ €€€
45000€
Grid Investment mechanism
Annex 1

Drivers for VREs installation
15
Historic installed capacities (2000 – 2015)
• Precise spatial location and historical data are missing• Potential does not seem to be the 1st driver for installation :
Potential (Available Surface, Energetic) Population density Exclusion zones (ie protected areas)
SolarWind on‐shore
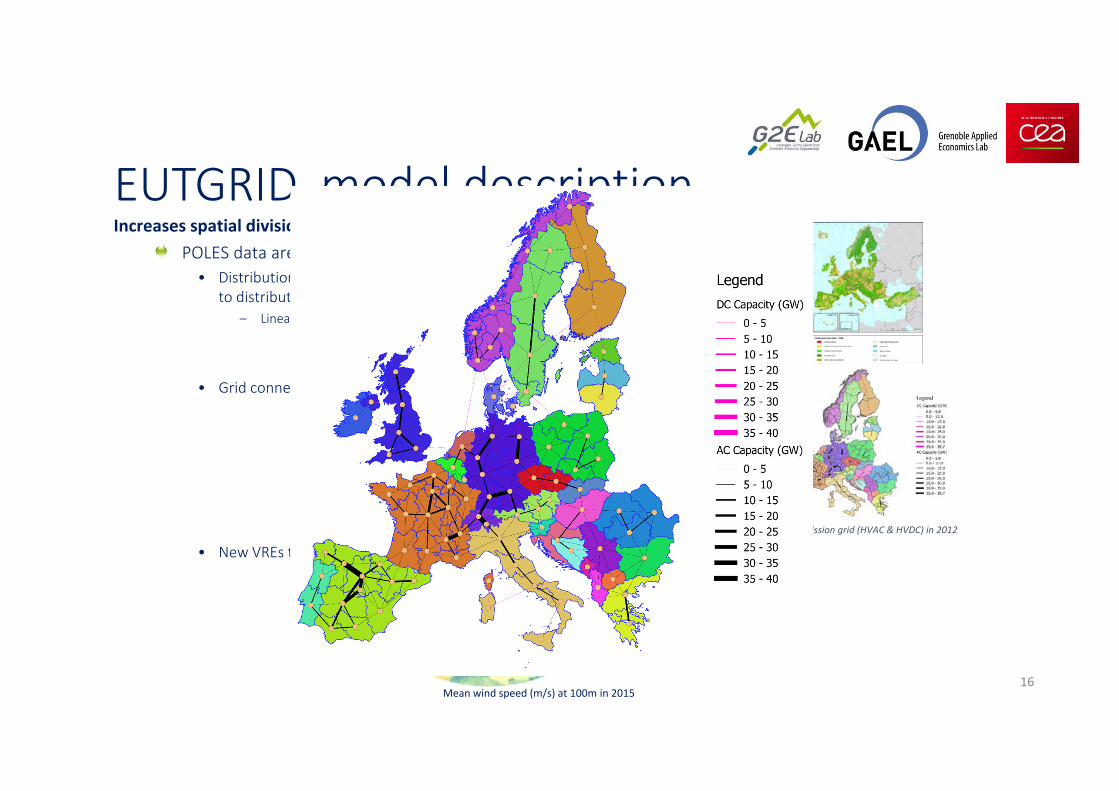
EUTGRID, model description
16
Increases spatial division – Input data preparationPOLES data are available per country• Distribution keys were determined
to distribute installed capacities amongst the clusters– Linear combinations of parameters (ie population, available areas etc.)
• Grid connections between clusters
• New VREs typical days per cluster (winter/summer)(a) Georeferencing ENTSO‐E map 2012 (b) Aggregated transmission grid (HVAC & HVDC) in 2012
Aggregation
Mean wind speed (m/s) at 100m in 2015

HVAC/HVDC costs
17
∗ ∗ ∗ ∗ ∗
HVAC HVDC
[MW] 1700 1700
Transformer/Converter [k€/MW]
15 110
Investments costs [k€/km] 1300 1300
Capacity costs[k€/(km*MW)] 0,5 0,75
Rural Urban Mountain
1 1,38 2,05

18

19