longwall top coal caving method for barapukuria … · rock strata of a stage iii excavation mine...
TRANSCRIPT

International Journal of Scientific & Engineering Research, Volume 7, Issue 4, April-2016 285 ISSN 2229-5518
IJSER © 2016 http://www.ijser.org
Longwall Top Coal Caving Method for Barapukuria Coal Field, Dinajpur, Bangladesh.
Nadia Sultana Tarakki, Chowdhury Quamruzzaman, Mohammad Tofayal Ahmed, Md. Mizanur Rahman, Md. Badrul Alam, Chowdhury Rayhan
Abstract—The present research work deals with the coal extraction method for the Barapukuria Coal Field, Bangladesh. Various LTCC parameters, for example top coal failure behavior, strata caving mechanism, vertical stresses and abutment stresses, were evaluated for this mine using Examine2Dsoftware for the assessment of LTCC technology. The stress response of natural caving roof were studied, by using numerical simulation of LTCC mine excavation of Stage II and III associated with magnitudes and distribution contours of vertical stress (σ1), strength factor, subsidence, area of deformation and displacement of surrounding rock strata of a stage III excavation mine panel, fracturing and caving of top coal and overburden strata. The magnitudes and distribution contours of vertical stress (σ1) imply that the vertical stress is more obvious in the area just above the excavation panel ranging from 1.5 to 2 m at the bottom and roof of the panel. Above the easily cavable zone of 1.5m, there lies another zone of 2 to 2.5m, between stage II and III excavation panel, where strength factor is 1.06, which could be induced to cave with the help of hydrofracturing. According to the results, by considering all factors it was found that Longwall Top Coal Caving (LTCC) method would be a preferred and alternative method for mining in seam VI’s stage III of Barapukuria Coal Mine. It will increase recovery ratesup to 75%, which will contribute additional support to further new power plants. Index Terms—Barapukuria Coal Mine, Caving Nature, Deformation Vector, Failure Trajectory,LTCC, Maximum tensile Stress, Strength Factor and Vertical Stress.
————————————————————
1 INTRODUCTIONt present Bangladesh is facing severe energy crisis. Natu-ral gas is currently the major indigenous nonrenewable energy resource and 70-80% of power is produced by gas. As time continues, the need is increasing, so, gas
production has increased sharply over the last decade with the result that natural gas resources are likely to be exhausted, but there is no hope for new gas field discovery. Under such cir-cumstance, we need to focus on coal based power plant. Ac-cording to World Coal Institute (WCI, coal fact, 2008) (http://www.worldcoal.org), coal is the major fuel used for generating electricity worldwide. Coal provides 26% of global primary energy needs and generates 41% of the world's elec-tricity. We have 5 major coal fields, where the total in situ re-serves over 3258 million tons, but now only Barapukuria coal field is under production by the Barapukuria Coal Mining Company (BCMCL) authority, a Company of Petrobangla. At present production is running from its central part and the rest part is still untouched. The Barapukuria Coal Mine is the first coal mine in Bangladesh, discovered in 1985 by Geological Survey of Bangladesh (GSB). The Barapukuria Coalfield is situated within the Barapukuria village of Hamidpur union council under Parbatipur Thana, Dinajpur district, at a dis-tance of about 50 km southeast of Dinajpur town (Figure:1).
Geographically, the study area lies between latitudes 25°31/N to 25°35/N and longitude 88°57/E to 88°59/E, included in the survey of Bangladesh topographic sheet No. 78 C/14. It was started commercially with a production capacity of 1 million metric tons annually from coal seam VI of its total geological reserve 390 million tons, which is not sufficient.
Fig. 1. Location of the boreholes, major faults, and structural pattern of the Barapukuria Coal Basin, Dinajpur, Bangladesh (after Wardell Armstrong, 1991; Bakr et al., 1996).
A
———————————————— • Nadia Sultana Tarakki is currently pursuing Masters degree program in
Mining and Engineering Geology in University of Dhaka, Bangladesh, E-mail:[email protected]
• Dr. Chowdhury Quamruzzaman is professor of Mining and Engineering Geology, Department of Geology, University of Dhaka, Bangladesh. E-mail: [email protected] [email protected]
IJSER

International Journal of Scientific & Engineering Research, Volume 7, Issue 4, April-2016 286 ISSN 2229-5518
IJSER © 2016 http://www.ijser.org
2GEOLOGY OF THE BARAPUKURIA BASIN 2.1 Geology The Barapukuria Coal Basin is located in the Dinajpur Shield of Bangladesh and is surrounded by Himalayan Foredeep to the north, the Shillong Shield/Platform to the east, and the Indian Peninsular Shield to the west. The Garo-Rajmahal gap lies between the exposed Peninsular Shield and the Shillong Shield, which corresponds to a shallow buried basement ridge known as the Platform flank zone (Desikachar, 1974; Khan, 1991). Most of the Gondwana coal basins including Barapuku-ria, Phulbari, Khalaspir, Dighipara are located within the Bangladesh part of the Garo-Rajmahal gap (known as the ‘Rangpur Saddle’) (Uddin and Islam, 1992; Bakr et at., 1996; Islam and Islam, 2005).The stratigraphy of the Barapukuria Basin is given in table 1 (Wardell Armstrong, 1991; Bakr el al., 1996) which shows lithology and thicknesses of the data based on DOB (Deep Observation Borehole) and GDH (Geological Drill Hole). The basin is totally concealed by an unconforma-ble cover of between 100-220 m of the late Miocene/Pliocene DupiTila Formation.
TABLE 1 THE GENERALIZED STRATIGRAPHIC SUCCESSION OF THE
BARAPUKURIA COAL BASIN, DINAJPUR, BANGLADESH, BASED ON DOB (WARDELL ARMSTRONG, 1991) AND GDH (BAKR ET AL.,
1996).
There is a proven potential for groundwater flow from the Upper DupiTila into the Gondwana sandstones (Figure: 2). In
the north of the coal basin where the Lower DupiTilaaqui-clude is absent, the Gondwana sandstones are recharged at the Tertiary/Gondwana unconformity. Average transmissivity, specific yield, storage coefficient, and velocities were 1200m2/day, 25% to 30%, 0.0004, and 0.02m/day respectively
(Wardell Armstrong, 1991). Fig. 2. Structure, stratigraphy, and distribution of coal seams of the Barapukuria coal basin(Wardell Armstrong, 1991). Seams II, IV, V, and VI are clearly visible in Figures a, and. c. Seams I and III are not shown in these sections due to small-scale and variable thickness. These two seams are shown in Figure 5b (Seam III in DOB #9) and Figure 5c (Seam I and III in GDH #40). 2.2 Rock Mechanical Properties of theBarapukuriaCoal
Deposits
2.2.1 Overburden: Strata from the Bellow Seam V to the Top of the Seam VI
Uniaxial Compressive Strength tests on sandstones samples gave values ranging from 0.40 to 55.32 MPa indicating weak to moder-ately strong material. These values indicate that sandstones are generally weak to moderately strong and occasionally strong. Ten-sile strength tests carried out on the sandstone gave values ranging from 0.06 to 3.56 MPa. The shear strength values of sandstone range from 6.6 to 12.3 MPa indicating moderately weak rock. The mudstone sample gave a value of 45.3 MPa indicating moderately strong material. Values for Young’s Modulus, ranging from 1350 to 20630 MPa are relatively high. They indicate a low degree of elas-ticity and tendency to rarest deformation, suggesting that blocky caving would occur in an unsupported excavation (Wardell Arm-strong, 1991). 2.2.2 Seam VI Uniaxial Compressive Strengths for the coal ranged from 5.71 to 24.73 MPa (mean 13.67 MPa), indicating moderately weak to mod-erately strong material. Values for Young’s modulus ranged from
IJSER

International Journal of Scientific & Engineering Research, Volume 7, Issue 4, April-2016 287 ISSN 2229-5518
IJSER © 2016 http://www.ijser.org
3201 to 3239 MPa with a Poisson’s ration of 0.1919 to 0.2705 indicat-ing a low degree of elasticity and a tendency for caving to occur (Wardell Armstrong, 1991).
3 METHODOLOGY AND DATA ANALYSIS 3.1 Uniaxial Compressive Strength Test A total of 10 cubical specimens of 2.5x2.5x2.5 inch dimensions was prepared for this study. The Uniaxial Compressive Strength test was conducted according to ASTM D 5731. At first the breaking load was measured using the Point Load Tester(Figure: 3). Fromthe experiments, the UCS was calculated based on the equa-tion:
(1)
Where, P is the failure load, De2 is the equivalent core diameter, which can be calculated from the equation, where W is the smallest specimen width and D is the distance be-tween two platen contact points.
(a) (b) Fig. 3. (a) and (b) Modes of failure of the specimen
3.2 Potential Models for Assessment of Caving Behavior
The cavability classification of the coal measure rocks in for-mer Czechoslovakia (Zamarski, 1970) considered the average unbroken length of cores to categorize the roof in three types. Regular caving of strata is achieved if its unbroken core length is less than 10.5 cm (category II). Polish scientists (Pawlowicz, 1967) have developed rock quality index, L, to assess the cav-ing behaviour of strata:
L = 0.016Csd (2) where Cs is the in situ compressive strength of roof rock in kg/cm2, and d is the mean discernible thickness of immediate roof strata in cm. The above formula was improved by correlating the in situ strength test result with its uniaxial compressive strength (UCS) test result obtained in laboratory and establishing an
empirical relationship between the UCS of roof rock in labora-tory and mean discernible thickness of immediate roof (Bilin-ski and Konopko, 1973). The final equation was proposed as follows:
L = 0.0064C1.7K1K2K3(3)
where C is the UCS of roof rock measured on dry specimens in laboratory (kg/cm2); K1 is the in situ strength coefficient, which is 0.33 for sandstone, 0.42 for mudstone, and 0.5 for claystone or siltstone; K2 is the creep coefficient, which is 0.7 for sandstone and 0.6 for mudstone, clay stone or siltstone; K3 is the in situ water content coefficient, which is 0.6 for sand-stone, 0.4 for clay stone and mudstone. Based on the value of L, the roof is categorized in six groups having different values of allowable area of exposure shown in table 2. Good caving of strata is achieved up to a value of L equal to 130 (Class IV roof).
TABLE 2 CAVING INDEX VS. CAVING BEHAVIOR OF STRATA IN LTCC (BILINSKI
AND KONOPKO, 1973)
Values of UCS and roof quality index (L) of roof sandstone rock at depth 420m, coal from 426m and 434.8m are calculated by using equation (1) and (3) respectively and their nature of caving is estimated based on table 2 and shown in table 3:
TABLE 3 UCS, ROOF QUALITY INDEX, ROOF CATEGORY AND CAVING BEHAV-
IOR OF STRATA IN LTCC
IJSER

International Journal of Scientific & Engineering Research, Volume 7, Issue 4, April-2016 288 ISSN 2229-5518
IJSER © 2016 http://www.ijser.org
3.3 Mathematical Model of Stress Condition
3.3.1 Maximum Tensile Stress Obert and Duvall (1967) developed an equation, based on the-ory of plates (Timoshenko and Woinowsky-Krieger, 1959), for tensile failure of a gravity-loaded plate clamped on all edges, simulating the condition of failure of roof during main fall at a longwall face and computed the maximum tensile stress at failure: (4) where σmaxis the maximum tensile stress (MPa); β is the empir-ical constant (Table 4) based on ratio b/a (Timoshenko and Woinowsky-Krieger, 1959); b is the longer lateral dimension of the plate (m); a is the smaller lateral dimension of the plate (m); tp is the plate thickness (m); and γe is the effective unit weight of rock (MPa/m), which can be calculated by: (5) whereEi is the Young’s modulus of the ith rock layer, γ i is the unit weight of the ith rock layer, and ti is the thickness of the ith roof layer.
TABLE 4 VALUES OF Β FOR DIFFERENT VALUES OF B/A (TIMOSHENKO AND
WOINOWSKY-KRIEGER, 1959).
To calculate effective unit weight, thickness of ith layer is de-termined from Wardell Armstrong, 1991’s stratigraphy and coal seams sequences in DOB #9 of the Barapukuria Coal Ba-sin shown in figure 4. Fig. 4. Stratigraphy and coal seams sequences in DOB #9 of the Barapukuria Coal Basin, Dinajpur, Bangladesh (Wardell Armstrong, 1991).
To determine the value of σmax, the maximum tensile stress (MPa), a LTCC panel is taken of longer lateral dimension (b) 230m, smaller lateral dimension (a) 100m and 3m of plate thickness (tp) shown in figure 5 and the value of it is 15.12 MPa. According to table 4, the value of β is 0.0833. The unit weight (γ) of coal is 0.011MPa and sandstone is 0.024MPa and Young’s modulus of coal and sandstone is 3201MPa and 1350MPa respectively. The calculated value of effective unit weight from equation (5) is 0.908 MPa/m.
Fig. 5. Smaller and longer dimension of a LTCC panel
3.3.2 Vertical Stress Numerous analyses of stress conditions in-situ and further confirmations by numerical simulations, allowed for the ap-plication of a constitutive model. The model describes the changes of stress and deformation conditions in relation to the advancing speed of coal production and the distance from the longwall top coal caving face. A modified form also includes the impact of the speed of advancement of coal extraction. The distribution of stress in the goaf is presented by the following equation (Yavuz, H., 2004):
(6)
whereσx = vertical stress (MPa) at the distance of lx (m); σc = unconfined compressive strength (MPa); b = initial bulking factor; Sm = maximum surface subsidence (m); h = mining height (m); c3, c4 = coefficients dependence on the strata li-thology composition of the top layers; lx = distance from the longwall excavation face (m); and vx = longwall advancing speed (m/day). Maximum surface subsidence is expressed by the equation:
(7)
whereH = depth of mine exploitation working (m); γ = aver-age unit weight of top layer (kN/m3).
IJSER

International Journal of Scientific & Engineering Research, Volume 7, Issue 4, April-2016 289 ISSN 2229-5518
IJSER © 2016 http://www.ijser.org
TABLE 5 COEFFICIENTS OF THE LITHOLOGICAL COMPOSITION OF THE TOP
LAYERS (YAVUZ, H., 2004).
In the situation for UCS 17.8 MPa and 19.3 MPa c3 and c4 is 3.1 and 5 respectively and initial bulking factor is 4.52. The aver-age unit weight of top coal is 14 kN/m3. The vertical stress acting on stage II and stage III excavation panel of seam VI is calculated using equation (6) and (7), where, lx is 230m and vx is 4m/day and shown in table 6.
TABLE 6 VALUES OF VERTICAL STRESS FOR STAGE II AND III EXCAVATION.
At present in Barapukuria Coal Mine, seam VI has been excavated in two stages, stage I with Longwall method, where, 3m of coal is kept as top coal of 2.8m’s excavation. In stage II, 3 m coal is exca-vated with LTCC method with 3 m top coal. The conceptual model of next stage of excavation, stage III with LTCC method is 5m of top coal with 3m excavation panel. These concepts are illustrated in figure 6.
Fig. 6. Concept of longwall top coal caving (LTCC) method at third stage
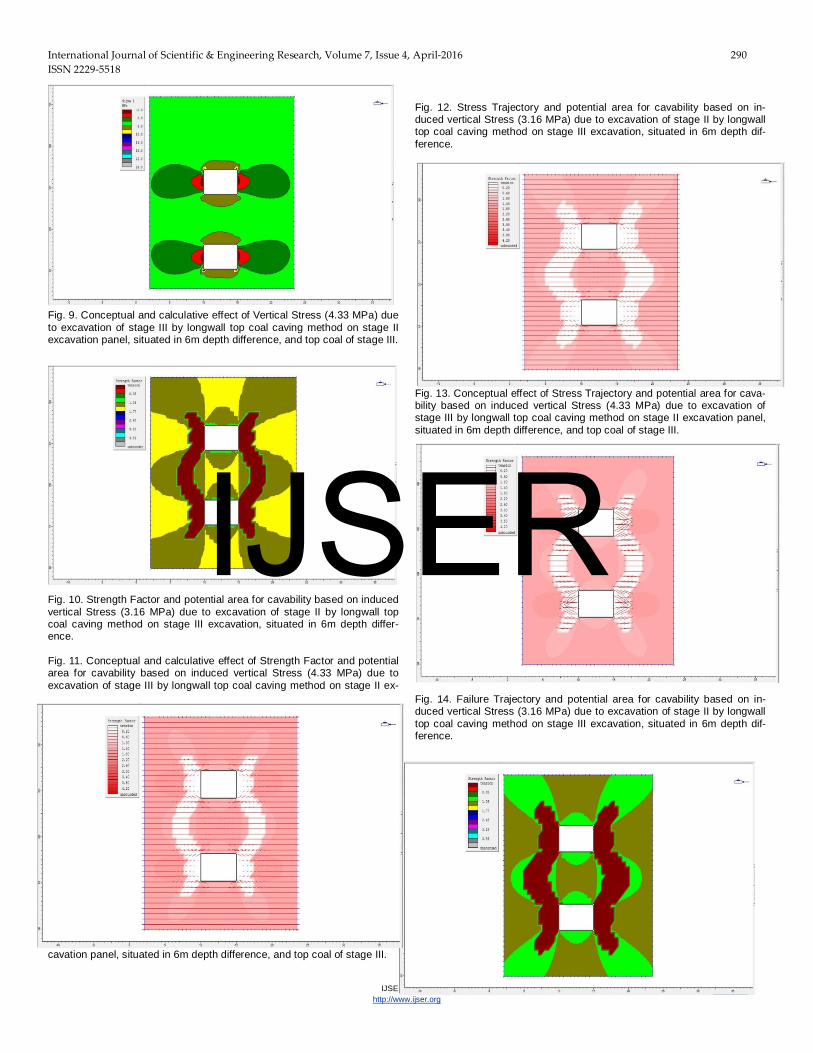
The conceptual models with the different pit depths/geological conditions were constructed using the Ex-amine2D program in order to investigate responses of ground/slope around the excavated area for the different sit-uations. In Barapukuria Coal Field, when the excavation was at stage II, the vertical stress acting on the excavation panel was 3.16 MPa and at stage III it is estimated that it will be 4.33MPa. Using Examine2D, vertical stress contour areas are created, from high stressed area to low stressed one around excavation panel. Based on it, Strength Factor contours are created which represent the ratio of the material strength, to the induced stress. Where the Strength Factor in Examine2D is less than one, this indicates that the material would fail or cave easily, under the given stress conditions.To support the projection of caving, Vector of Deformation, Stress Trajectory and Failure Trajectory at both stress 3.16 MPa and 4.33 are contracted. These projections are shown in the following fig-ures (figure7 to 17).
Fig. 7. Vertical Stress Contour (3.16 MPa) due to excavation of stage II by longwall top coal caving method.
Fig. 8. Effect of Vertical Stress (3.16 MPa) due to excavation of stage II by longwall top coal caving method on stage III excavation, situated in 6m depth difference.
IJSER
International Journal of Scientific & Engineering Research, Volume 7, Issue 4, April-2016 290 ISSN 2229-5518
IJSER © 2016 http://www.ijser.org
Fig. 9. Conceptual and calculative effect of Vertical Stress (4.33 MPa) due to excavation of stage III by longwall top coal caving method on stage II excavation panel, situated in 6m depth difference, and top coal of stage III.
Fig. 10. Strength Factor and potential area for cavability based on induced vertical Stress (3.16 MPa) due to excavation of stage II by longwall top coal caving method on stage III excavation, situated in 6m depth differ-ence. Fig. 11. Conceptual and calculative effect of Strength Factor and potential area for cavability based on induced vertical Stress (4.33 MPa) due to excavation of stage III by longwall top coal caving method on stage II ex-
cavation panel, situated in 6m depth difference, and top coal of stage III.
Fig. 12. Stress Trajectory and potential area for cavability based on in-duced vertical Stress (3.16 MPa) due to excavation of stage II by longwall top coal caving method on stage III excavation, situated in 6m depth dif-ference.
Fig. 13. Conceptual effect of Stress Trajectory and potential area for cava-bility based on induced vertical Stress (4.33 MPa) due to excavation of stage III by longwall top coal caving method on stage II excavation panel, situated in 6m depth difference, and top coal of stage III.
Fig. 14. Failure Trajectory and potential area for cavability based on in-duced vertical Stress (3.16 MPa) due to excavation of stage II by longwall top coal caving method on stage III excavation, situated in 6m depth dif-ference.
IJSER
International Journal of Scientific & Engineering Research, Volume 7, Issue 4, April-2016 291 ISSN 2229-5518
IJSER © 2016 http://www.ijser.org
Fig. 15. Conceptual Failure Trajectory and potential area for cavability based on induced vertical Stress (4.33 MPa) due to excavation of stage III by longwall top coal caving method on stage II excavation panel, situated in 6m depth difference, and top coal of stage III.
Fig. 16. Deformation Vector and potential area for cavability based on induced vertical Stress (3.16 MPa) due to excavation of stage II by longwall top coal caving method on stage III excavation, situated in 6m depth difference.
Fig. 17. Conceptual Deformation Vector and potential area for cavability based on induced vertical Stress (4.33 MPa) due to excavation of stage III by longwall top coal caving method on stage II excavation panel, situated in 6m depth difference, and top coal of stage III.
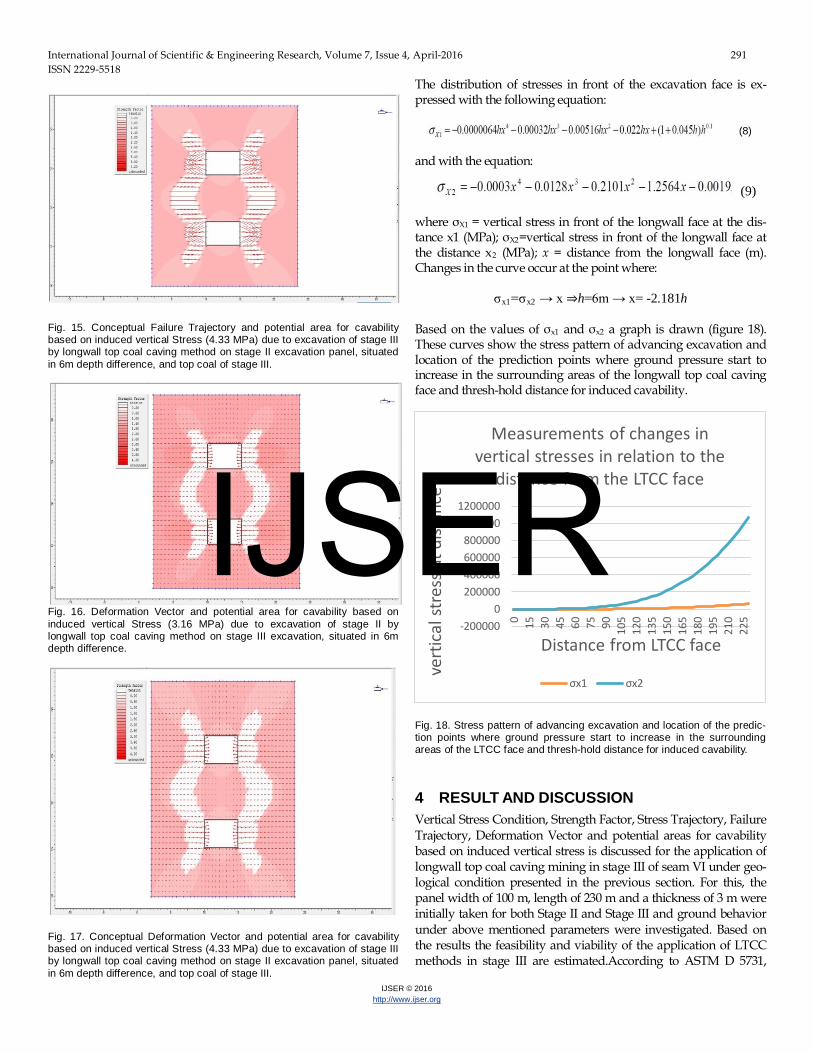
The distribution of stresses in front of the excavation face is ex-pressed with the following equation:
(8)
and with the equation: (9)
where σX1 = vertical stress in front of the longwall face at the dis-tance x1 (MPa); σX2=vertical stress in front of the longwall face at the distance x2 (MPa); x = distance from the longwall face (m). Changes in the curve occur at the point where:
σx1=σx2 → x ⇒h=6m → x= -2.181h Based on the values of σx1 and σx2 a graph is drawn (figure 18). These curves show the stress pattern of advancing excavation and location of the prediction points where ground pressure start to increase in the surrounding areas of the longwall top coal caving face and thresh-hold distance for induced cavability.
Fig. 18. Stress pattern of advancing excavation and location of the predic-tion points where ground pressure start to increase in the surrounding areas of the LTCC face and thresh-hold distance for induced cavability.
4 RESULT AND DISCUSSION Vertical Stress Condition, Strength Factor, Stress Trajectory, Failure Trajectory, Deformation Vector and potential areas for cavability based on induced vertical stress is discussed for the application of longwall top coal caving mining in stage III of seam VI under geo-logical condition presented in the previous section. For this, the panel width of 100 m, length of 230 m and a thickness of 3 m were initially taken for both Stage II and Stage III and ground behavior under above mentioned parameters were investigated. Based on the results the feasibility and viability of the application of LTCC methods in stage III are estimated.According to ASTM D 5731,
-2000000
200000400000600000800000
10000001200000
0 15 30 45 60 75 90 105
120
135
150
165
180
195
210
225
vert
ical
str
ess
at d
istan
ce X
Distance from LTCC face
Measurements of changes in vertical stresses in relation to the
distance from the LTCC face
σx1 σx2
IJSER

International Journal of Scientific & Engineering Research, Volume 7, Issue 4, April-2016 292 ISSN 2229-5518
IJSER © 2016 http://www.ijser.org
UCS of coal in stage II and III is 17.8 MPa and 19.3 MPa respective-ly. The roof of both stage II and III is of category III quality, with good caving nature (table 3).To investigate the top coal fracture evolution pattern, layers of the top coal starting from the top of the top coal to the bottom of the top coal for stage II and III were ana-lyzed. In most of the cases, the contour models in the figures sug-gest that the top coal would break easily.The mechanical properties of the top coal used in the analyses are: density 1,000 kg/m3; Pois-son’s ratio 0.25; tensile strength 0.5 MPa, cohesion 2 MPa, friction angle 50°, respectively. The distribution contours of major vertical stress (σ1) in the stage II (Fig. 7) of the simulation imply that, due to excavation the σ1 value was ranging from -1.95 MPa to 5.55 MPa around the excavation panel and immediate roof and floor, although the value gradually increased towards the roof and floor, respectively, in value ranging from 4.05 to 5.55 MPa.The conceptual model of after excavation of stage III shows that, effect of Vertical Stress (3.16 MPa) due to exca-vation of stage II by longwall top coal caving method on stage III excavation, situated in 6m depth difference (Fig. 8), indicates that highest stress acts up to 1.5 m from excavation face, values ranging from 4.50 to 6 MPa. Conceptual and calculative effect of Vertical Stress (4.33 MPa) due to excavation of stage III by longwall top coal caving method on stage II excavation panel, situated in 6m depth difference, and top coal of stage III in figure 9 indicated that due to third excavation, range of stressed area will increase from 1.5m to 2m and values range from 2 to 10 MPa on the immediate roof and floor. From Figure 7 to 9, assumption can be made that vertical stress acts strongly on the corners of the excavation and moderately strong in top coal up to thickness of 1.5 to 2 m in average, which is 25% of total mass in between of Stage II and stage III excavation. Figure 10 and 11 shows the conceptual and calculative effect of Strength Factor and potential area for cavability based on induced vertical Stress (3.16 MPa and 4.33 MPa respectively) due to excava-tion of stage III by longwall top coal caving method on stage II ex-cavation panel, situated in 6m depth difference, and top coal of stage III. Strength factor around the excavation zone was ranging from 0.35 to 0.86. As the strength factor is less than 1, it indicates there is high tendency to occur strata failure at the surrounding area of the excavation zone. From the Strength Factor contours and the Legend, it can be estimated that, due to stage III excavation, a region of failed material exists between the two excavations; there-fore the excavation would be unstable and mass from excavation face to approximately 1.5 m height will cave very easily, which is approximately 25% of total mass in between the excavation face. We know that if the strength factor is >1, this indicates that the ma-terial strength is greater than the induced stress. Figure 12 and 13 shows the conceptual effect of Stress Trajectory and potential area for cavability based on induced vertical Stress (3.16 MPa and 4.33 MPa respectively) due to excavation of stage III by longwall top coal caving method on stage II excavation panel, situated in 6m depth difference, and top coal of stage III. From the Stress Trajectory of figure, it is seen that stress trajectory is distorted along the left and right side of excavation and they become more distorted and widely dispersed with increasing vertical stress and
strength factor. From the Failure Trajectory in figure 14 and 15 and Deformation Vector in figure 16 and 17, it can be assumed that with increasing stress failure becomes more active and intense, and possibility for good caving increases and they create an inward arch type caving. In the case of stage III excavation of seam VI from the Failure Tra-jectory in figure 15 and Deformation Vector in figure 17, where coal strength is 19.3 MPa, it can be assumed that abutment stress due to 4.33 MPa vertical stress will work effectively up to approximately 1.5 m distance from excavation face, creating good caving. It will open fractures on top coal and will help to induce the second frac-ture set in another 2 to 2.5m. Stress pattern of advancing excavation and location of the predic-tion points where ground pressure start to increase in the sur-rounding areas of the LTCC face and thresh-hold distance for in-duced cavability is shown by a visual presentation of the results of measurements and numerical simulation of excavation in figure 18 of the LTCC face. The analysis of stresses and strains changes in the thick coal seam simulate the sublevel coal exploitation in large area showing that the steep increase of stresses, from the front of the excavation face to the end of excavation panel at 230m length, re-flecting natural conditions and the measured values. From the re-sults of this analyses it can be interpreted that behind the longwall excavation face, the stresses increase gradually and steadily and the thresh-hold distance for the initiation of caving in a longwall top coal caving panel is 6m and this is the point where the curves meet. No caving occurs before 6m and with increasing distance from LTCC face, stress also increases extensively and finally reaching to 1006664 MPa at 230m distance from face. As there is a strong rela-tion between vertical stress and strength factor, as stress increases caving becomes more easy and good cavability of top coal occur. From the results of calculations we can conclude that on longwall excavation face, which was moved ahead after 6m, as well as on both sides of the longwall panel, vertical compressive stresses in-crease significantly. Also, cavability becomes easier with increasing distance after 6m from the initial face with the rate of advancement 4 m/day. Furthermore, the results of present analyses show that a gradual increase of vertical stresses occurs up to 1.5 to 2m of roof and floor of excavation panel, where strength factor is low and possibility of fracturing and caving is high. As the excavation panel is rectangular in shape, the value of vertical stress is high at the corners and from the Failure Trajectory and Deformation Vector, it can be assumed that with increasing stress failure becomes more active and intense, and they create an inward arch type caving. The structure of Head gate and Tail gate will be distorted due to it.
5 RECOMMENDATION Few things need to consider for successful application of LTCC in the third stage of mining of seam VI:
1. Above the easily capable zone of 1.5m, there lies an-other zone of 2 to 2.5m, between stage II and III exca-vation panel, where the strength factor is 1.06, which
IJSER

International Journal of Scientific & Engineering Research, Volume 7, Issue 4, April-2016 293 ISSN 2229-5518
IJSER © 2016 http://www.ijser.org
could be induced to cave with the help of external fac-tor like blasting, hydro-fracturing, etc. In this case hy-drofracturing is proposed rather than blasting due to self-combustible coal of seam VI. It will increase re-covery rates up to 75%.
2. The structure of Head gate and Tailgate will be dis-torted due to increasing stress and the possibility of failure in the corners of the panel. At present timber support is provided in the gates Stage II excavation panel, but as stress will increase due to stage III exca-vation, timbering will not be adequate here and me-tallic support is recommended here.
3. The height of top coal of stage III is recommended to be 5m instead of stage II’s 3m height. This will in-crease the quality of caving and the size of fractured coal.
4. Extraction of thick coal seams can cause significant disturbance to the surface and can create large ground cracks even subsidence. Due to stage II extrac-tion 9.34m subsidence will occur and when stage III will be excavated, it is predicted that more 8.85 m will be subsided. This subsided area can be utilized by us-ing it for fish cultivation, which will be more econom-ic than normal cash crop cultivation.
6 CONCLUSION By considering the in situ geological, geometrical and geo-technical conditions in advance of a LTCC face a numerical simulation is developed to aid in the assessment of LTCC in a new mining oper-ation at stage III. With 2D numerical simulations of longwall top coal caving production by a mathematical model based on the analyses of simulations using Examine2D software, calculations of vertical stress was obtained at the stage II and stage III excavation, contributed to better understanding of complex top caving pro-cesses which actually occur in the excavated area. Compared stress distribution with stage II excavation shows that vertical stress change gradually from the excavation face to the top coal. The ver-tical stress is more obvious in the area just above the excavation panel ranging from 1.5 to 2 m at the bottom and roof of the panel. Above the easily cavable zone of 1.5m, there lies another zone of 2 to 2.5m, between stage II and III excavation panel, where strength factor is 1.06, which could be induced to cave with the help of ex-ternal factor. In this case hydrofracturing is proposed rather than blasting due to self-combustible coal of seam VI. The results re-vealed that the deeper the excavation panel depth, the more stress concentration around the panel and it is more significant in weak geological conditions. It is found that the panel width of 100 m and length of 230m is appropriate for stage III excavation with 3m pan-el height and 5m height of top coal. Extraction of thick coal seams can cause significant disturbance to the surface and can create large ground cracks even subsidence. Due to stage II extraction 9.34m subsidence will occur and when stage III will be excavated, it is predicted that more 8.85 m will be subsided. This subsided area can be utilized by using it for fish cultivation, which will be more economic than normal cash crop cultivation. According to the re-
sults of a series of numerical analyses and simulation, it was found that longwall top coal caving with metallic supports rather than timbering in Head gate and Tail gate can be employed for the weak and thick coal seams of stage III excavation. This can be effective method for diminishing ground disturbance and subsidence in order to improve mine safety and to maximize coal recovery.It is a well realized fact that there is no appropriate option than LTCC technology for working coal seams at depths of stage III excavation to meet the huge demand of coal. The successful introduction of the LTCC mining method in Bangladesh will enhance the produc-tion rate and financial benefit. Moreover, Barapukuria Coal mining company, practicing the LTCC method with high production rate, it appears that the LTCC will be the right choice for thick coal seam rest of the coal basins in Bangladesh. In-depth and more scientifi-cally valid study should made using advanced approaches availa-ble for this purpose for a complete resolution of all relevant con-cerns.
REFERENCES [1] Wardell Armstrong, 1991. Techno-Economic Feasibility Study of
Barapukuria Coal Project (unpubl.), Dinajpur, Bangladesh. [2] Simsir, F., and Ozfirat, M. K., 2008. Determination of the most effec-
tive longwall equipment combination in longwall top coal caving (LTCC) method by simulation modeling. International Journal of Rock Mechanics & Mining Sciences 45, 1015–1023.
[3] Islam, M.R., and Shinjo, R., 2009. Numerical simulation of stress dis-tributions and displacements around an entry roadway with igneous intrusion and potential sources of seam gas emission of the Barapukuria coal mine, NW Bangladesh. International Journal of Coal Geology (article in press).
[4] Bilinski A, Konopko W. Criteria for choice and use of powered sup-ports. In: Proceedings of the symposium on protection against roof falls, Katowice; 1973. Paper No. IV-1.
[5] Cai, Y, Hebblewhite, B, Onder, Xu, B, Kelly, M, Wright, B, and Kra-emer, I, (2003), Application of Longwall Top Coal Caving to Austral-ian Operations, ACARP Report 1137F.
[6] Zhongming, J. (2006), Theory and Technology of Top Coal Caving Mining (translation).
[7] Humphries, P, and Poulsen, B, (2007), Longwall Top Coal Caving Application Assessment in Australia, ACARP Report for project C130187.
[8] Trueman R, Lyman G, Callan M, Robertson B. Assessing longwall support-roof interaction from shield leg pressure data. Mining Tech-nology (Transaction of Institute of Mining and Metallurgy, Section A) 2005; 114:A176e84.
[9] Zhang D. Ground pressure control of face with fully-mechanized sub-level caving mining. Private communication; 2003.
[10] Poulsen BA. Evaluation of software code UDEC for modelling top coal caving in an Australian environment. CSIRO exploration and mining report 1115F; 2003.
[11] Xie GX, Chang JC, Yang K. Investigations into stress shell characteris-tics of surrounding rock in fully mechanized top-coal caving face. Int J Rock Mech Min Sci 2009; 46:172–81.
[12] Zhongming J, et al. Study on movement of top coal and roof strata at LTCC face in Wangzhuan Mine, coal no. 1; 1992.
[13] Zhou Y, Li H, Zhai X, Su C. Simulated material modelling and analy-sis of the overburden strata movement in top coal caving mining. In: Proceedings of the 20th international conference on ground control in mining, 2001.
[14] Wilson, A.H., “Stress, Stability in Coal Ribsides and Pillars,” Proc. 1st Conf. Ground Control in Mining, 1981.
[15] Aitmatov, I.T., Baiterekov, A.B., and Beknazorov, T.S., “State of stress in rocks when ore bodies are worked by the longwall slicing system,” Izv. Akad. NaukKirg. SSR, No. 2 (1974), pp. 472-480.
IJSER