look who’s talking now sem exchange, fall 2008 october 9, 2008 1 montgomery college keyword...
TRANSCRIPT

Look Who’s Talking Now SEM Exchange, Fall 2008
October 9, 20081
Montgomery College
Keyword Spotting Using Crosscorrelation Engineering Expo Banquet 2009
05/08/09
Keyword Spotting Using Crosscorrelation
Presenters:Bathiya Senevirathna
Roshan Rajeev
Advisor:Dr. Uchechukwu Abanulo
Montgomery College Speech Processing
Laboratory

Look Who’s Talking Now SEM Exchange, Fall 2008
October 9, 20082
Montgomery College
Keyword Spotting Using Crosscorrelation Engineering Expo Banquet 2009
05/08/09
Research Goal
Applications of Research
Method
Results
Demo
Presentation Outline
Presenters:Bathiya Senevirathna
Roshan Rajeev
Advisor:Dr. Uchechukwu Abanulo
Montgomery College Speech Processing
Laboratory
Look Who’s Talking Now SEM Exchange, Fall 2008
October 9, 20083
Montgomery College
Keyword Spotting Using Crosscorrelation Engineering Expo Banquet 2009
05/08/09
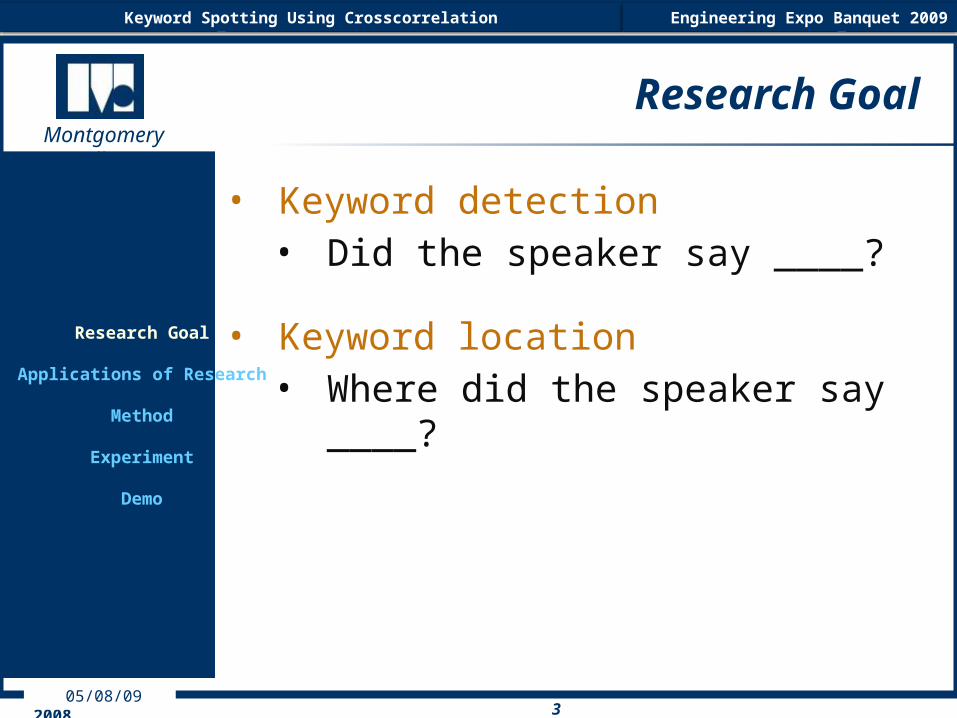
Research Goal
• Keyword detection• Did the speaker say ____?
• Keyword location• Where did the speaker say ____?
Research Goal
Applications of Research
Method
Experiment
Demo
Look Who’s Talking Now SEM Exchange, Fall 2008
October 9, 20084
Montgomery College
Keyword Spotting Using Crosscorrelation Engineering Expo Banquet 2009
05/08/09
Applications of ResearchResearch Goal
Applications of Research
Method
Experiment
Demo
Look Who’s Talking Now SEM Exchange, Fall 2008
October 9, 20085
Montgomery College
Keyword Spotting Using Crosscorrelation Engineering Expo Banquet 2009
05/08/09
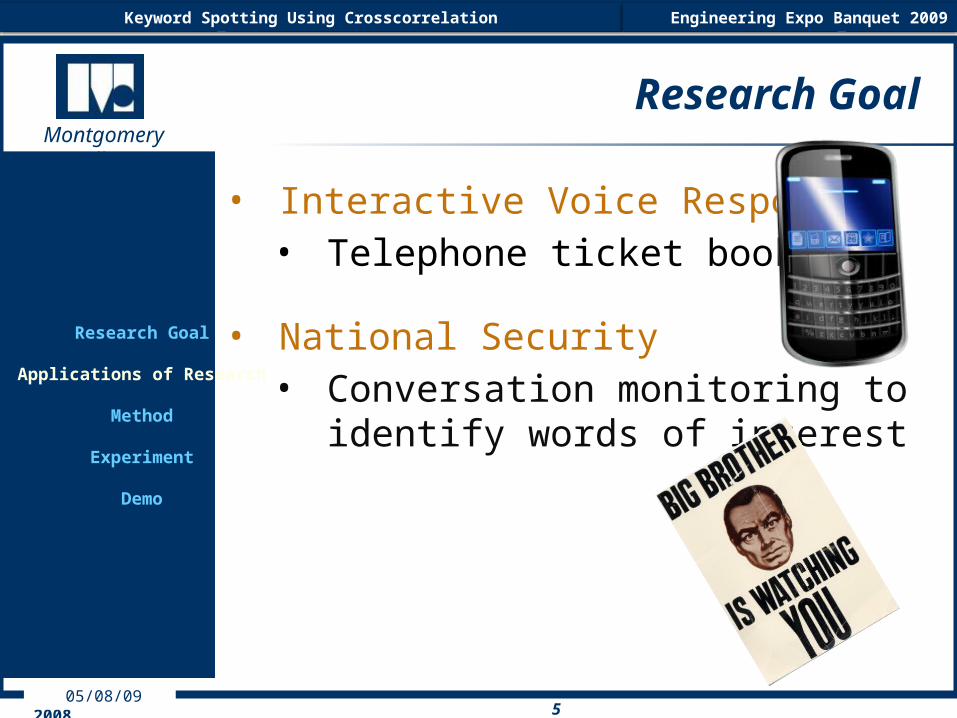
Research Goal
• Interactive Voice Response• Telephone ticket booking
• National Security• Conversation monitoring to identify
words of interest
Research Goal
Applications of Research
Method
Experiment
Demo

Look Who’s Talking Now SEM Exchange, Fall 2008
October 9, 20086
Montgomery College
Keyword Spotting Using Crosscorrelation Engineering Expo Banquet 2009
05/08/09
MethodResearch Goal
Applications of Research
Method
Experiment
Demo

Look Who’s Talking Now SEM Exchange, Fall 2008
October 9, 20087
Montgomery College
Keyword Spotting Using Crosscorrelation Engineering Expo Banquet 2009
05/08/09
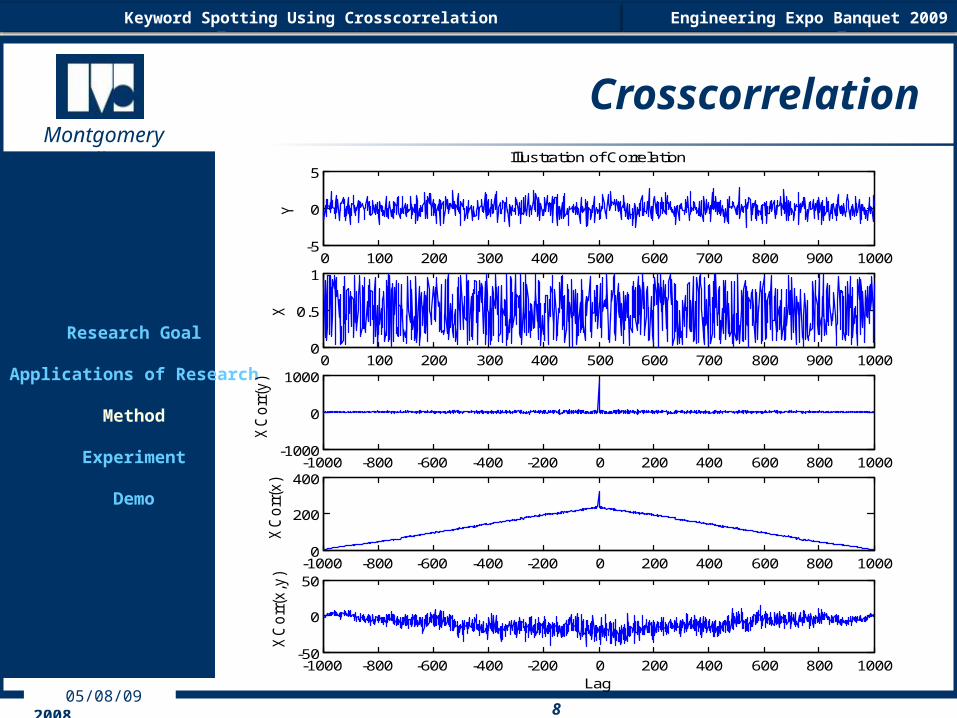
Crosscorrelation
• Measure of similarity between two signals• Two signals compared by
• Sliding one signal by a certain time lag• Multiplying both the overlapping regions
• Repeating the process and adding the products until there is no more overlap
• If both signals are exactly the same, there’s a maximum peak at the time = 0, and the rest of the correlation signals tapers off to zero
Research Goal
Applications of Research
Method
Experiment
Demo
0 1 2 3 4 501234567
Are
a O
verla
p
Look Who’s Talking Now SEM Exchange, Fall 2008
October 9, 20088
Montgomery College
Keyword Spotting Using Crosscorrelation Engineering Expo Banquet 2009
05/08/09
Research Goal
Applications of Research
Method
Experiment
Demo
0 100 200 300 400 500 600 700 800 900 1000-5
0
5
Y
Illustration of Correlation
0 100 200 300 400 500 600 700 800 900 10000
0.5
1X
-1000 -800 -600 -400 -200 0 200 400 600 800 1000-1000
0
1000
XC
orr
(y)
-1000 -800 -600 -400 -200 0 200 400 600 800 10000
200
400
XC
orr
(x)
-1000 -800 -600 -400 -200 0 200 400 600 800 1000-50
0
50
Lag
XC
orr
(x,y
)
Crosscorrelation

Look Who’s Talking Now SEM Exchange, Fall 2008
October 9, 20089
Montgomery College
Keyword Spotting Using Crosscorrelation Engineering Expo Banquet 2009
05/08/09
Research Goal
Applications of Research
Method
Experiment
Demo
Typical Cross-Correlation Results
0 2000 4000 6000 8000 10000 12000 14000-1
-0.5
0
0.5
1O
bser
ved
Seg
men
t
0 2000 4000 6000 8000 10000 12000 14000-1.5
-1
-0.5
0
0.5
1
Key
wor
d
0 2000 4000 6000 8000 10000 12000 14000-1.5
-1
-0.5
0
0.5
1
Nor
mal
ized
Cro
ss-c
orre
latio
n
Sample
0 2000 4000 6000 8000 10000 12000 14000-0.5
0
0.5
Obs
erve
d S
egm
ent
0 2000 4000 6000 8000 10000 12000 14000-1.5
-1
-0.5
0
0.5
1
Key
wor
d
0 2000 4000 6000 8000 10000 12000 14000-1
-0.5
0
0.5
1
Nor
mal
ized
Cro
ss-c
orre
latio
n
Sample
Keyword Match No Match
See any differences??
Look Who’s Talking Now SEM Exchange, Fall 2008
October 9, 200810
Montgomery College
Keyword Spotting Using Crosscorrelation Engineering Expo Banquet 2009
05/08/09
Research Goal
Applications of Research
Method
Experiment
Demo
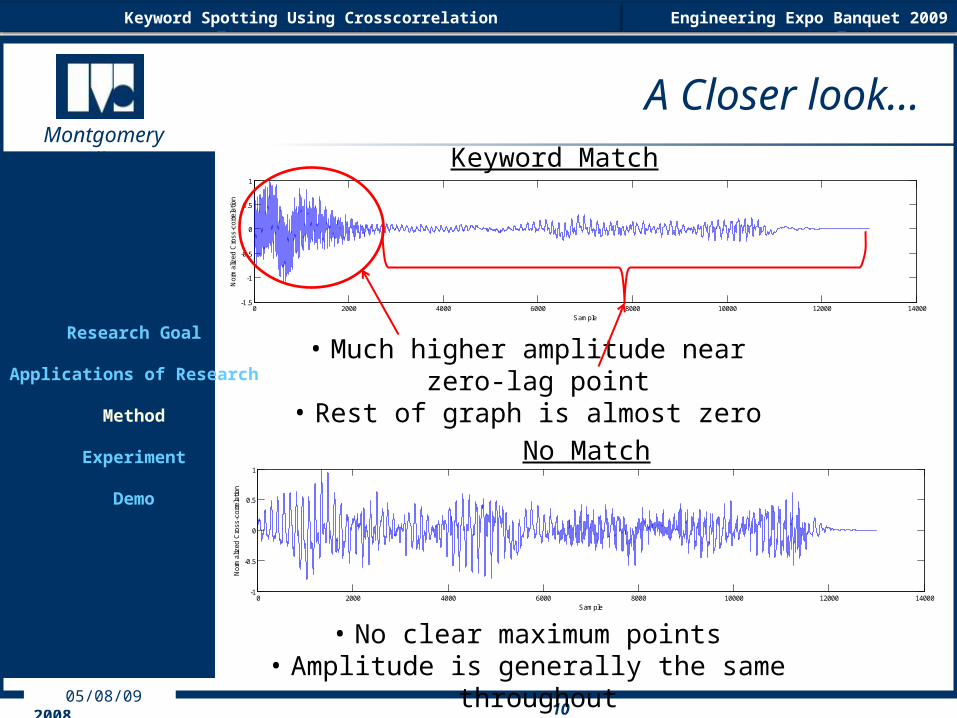
A Closer look…
0 2000 4000 6000 8000 10000 12000 14000-1
-0.5
0
0.5
1
Obs
erve
d S
egm
ent
0 2000 4000 6000 8000 10000 12000 14000-1.5
-1
-0.5
0
0.5
1
Key
wor
d
0 2000 4000 6000 8000 10000 12000 14000-1.5
-1
-0.5
0
0.5
1
Nor
mal
ized
Cro
ss-c
orre
latio
n
Sample
• Much higher amplitude near zero-lag point• Rest of graph is almost zero
• No clear maximum points• Amplitude is generally the same
throughout
Keyword Match
0 2000 4000 6000 8000 10000 12000 14000-0.5
0
0.5
Obs
erve
d S
egm
ent
0 2000 4000 6000 8000 10000 12000 14000-1.5
-1
-0.5
0
0.5
1
Key
wor
d
0 2000 4000 6000 8000 10000 12000 14000-1
-0.5
0
0.5
1
Nor
mal
ized
Cro
ss-c
orre
latio
n
Sample
No Match

Look Who’s Talking Now SEM Exchange, Fall 2008
October 9, 200811
Montgomery College
Keyword Spotting Using Crosscorrelation Engineering Expo Banquet 2009
05/08/09
Research Goal
Applications of Research
Method
Experiment
Demo
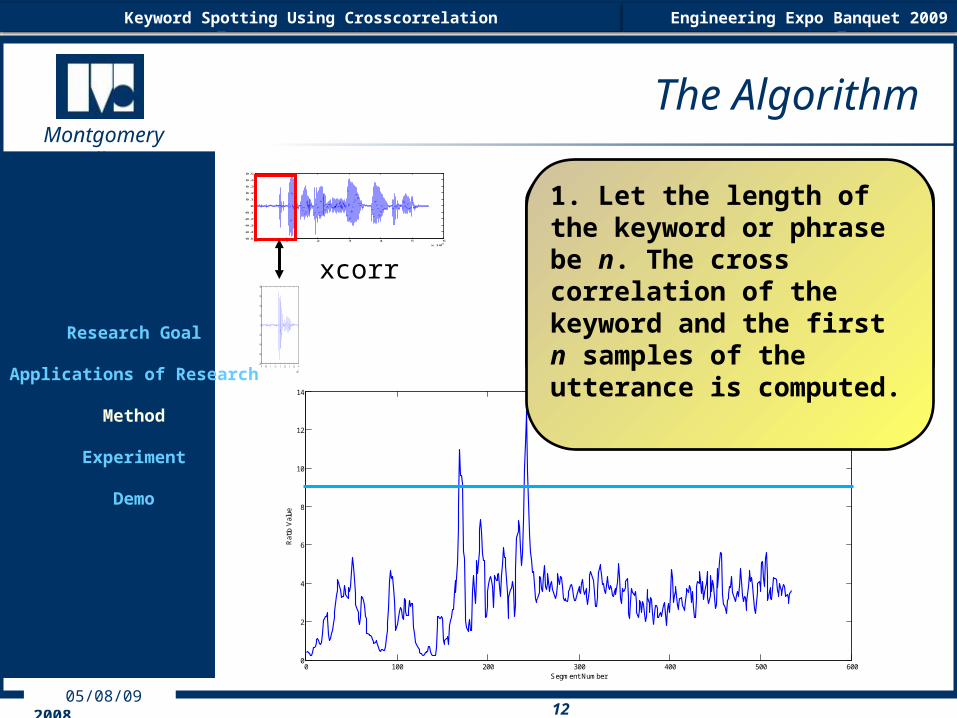
The Algorithm
0 2000 4000 6000 8000 10000 12000 14000-1
-0.5
0
0.5
1
Obs
erve
d S
egm
ent
0 2000 4000 6000 8000 10000 12000 14000-1.5
-1
-0.5
0
0.5
1
Key
wor
d
0 2000 4000 6000 8000 10000 12000 14000-1.5
-1
-0.5
0
0.5
1
Nor
mal
ized
Cro
ss-c
orre
latio
n
Sample
1.Find average of points in the first 10% of the samples
2.Find average of points in the last 90% of the samples
3.Compute the ratio of the two values. If n = the number of samples in the crosscorrelation graph:
Ratio =
Look Who’s Talking Now SEM Exchange, Fall 2008
October 9, 200812
Montgomery College
Keyword Spotting Using Crosscorrelation Engineering Expo Banquet 2009
05/08/09
Research Goal
Applications of Research
Method
Experiment
Demo
The Algorithm
0 1 2 3 4 5 6
x 104
-0.5
-0.4
-0.3
-0.2
-0.1
0
0.1
0.2
0.3
0.4
0.5
0 0.5 1 1.5 2 2.5 3 3.5 4
x 104
-0.8
-0.6
-0.4
-0.2
0
0.2
0.4
0.6
0.8
xcorr
0 100 200 300 400 500 6000
2
4
6
8
10
12
14
Rat
io V
alue
Segment Number
3. Shift observed portion by a small amount and repeat process
2. If a portion is reached where the calculated ratio is
above a defined minimum threshold then mark the location of the indices
1. Let the length of the keyword or phrase be n. The cross correlation of the keyword and the first n samples of the utterance is computed.

Look Who’s Talking Now SEM Exchange, Fall 2008
October 9, 200813
Montgomery College
Keyword Spotting Using Crosscorrelation Engineering Expo Banquet 2009
05/08/09
The ExperimentResearch Goal
Applications of Research
Method
Experiment
Demo

Look Who’s Talking Now SEM Exchange, Fall 2008
October 9, 200814
Montgomery College
Keyword Spotting Using Crosscorrelation Engineering Expo Banquet 2009
05/08/09
Research Goal
Applications of Research
Method
Experiment
Demo
Experiment
• Effectiveness of the algorithm in finding keywords in a speech utterance
• 8 speakers, mixed gender• Threshold varied from 6 to 15• Criteria:
• Hit: >50% of keyword length found in correct location
• False Alarm: 2 x length of keyword found in wrong location

Look Who’s Talking Now SEM Exchange, Fall 2008
October 9, 200815
Montgomery College
Keyword Spotting Using Crosscorrelation Engineering Expo Banquet 2009
05/08/09
Research Goal
Applications of Research
Method
Experiment
Demo
Criteria - Hits
0 0.5 1 1.5 2 2.5 3
x 104
-2
0
2
Act
ual L
ocat
ion
0 0.5 1 1.5 2 2.5 3
x 104
-2
0
2
0 0.5 1 1.5 2 2.5 3
x 104
-2
0
2
0 0.5 1 1.5 2 2.5 3
x 104
-2
0
2
Samples
Actual Location
Wrong Location Miss!
<50% of Word Found Miss!
>50% of Word Found Hit!

Look Who’s Talking Now SEM Exchange, Fall 2008
October 9, 200816
Montgomery College
Keyword Spotting Using Crosscorrelation Engineering Expo Banquet 2009
05/08/09
Research Goal
Applications of Research
Method
Experiment
Demo
Criteria – False Alarms
Actual Location (No Keyword)
>2x Keyword Length Found
False Alarm!
<2x Keyword Length Found
No False Alarm!
No Keyword FoundNo False Alarm!
0 0.5 1 1.5 2 2.5 3
x 104
-2
0
2
0 0.5 1 1.5 2 2.5 3
x 104
-2
0
2
0 0.5 1 1.5 2 2.5 3
x 104
-2
0
2
0 0.5 1 1.5 2 2.5 3
x 104
-2
0
2
Samples
Look Who’s Talking Now SEM Exchange, Fall 2008
October 9, 200817
Montgomery College
Keyword Spotting Using Crosscorrelation Engineering Expo Banquet 2009
05/08/09
Research Goal
Applications of Research
Method
Experiment
Demo
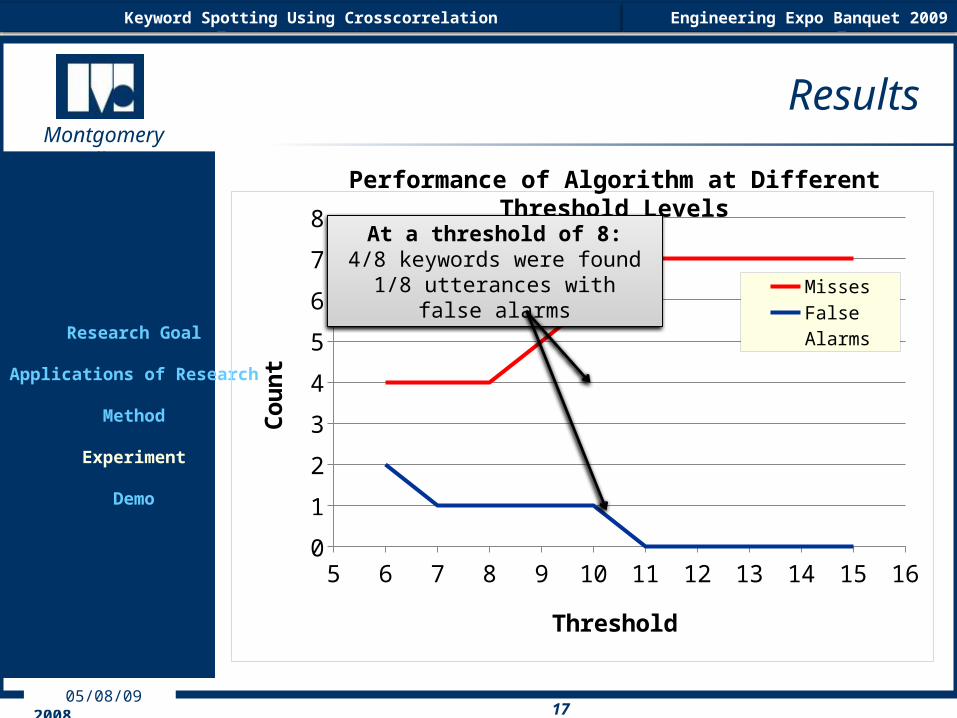
Results
5 6 7 8 9 10 11 12 13 14 15 160
1
2
3
4
5
6
7
8
Misses
False Alarms
Threshold
Co
un
t
Performance of Algorithm at Different Threshold Levels
At a threshold of 8:4/8 keywords were found
1/8 utterances with false alarms

Look Who’s Talking Now SEM Exchange, Fall 2008
October 9, 200818
Montgomery College
Keyword Spotting Using Crosscorrelation Engineering Expo Banquet 2009
05/08/09
Research Goal
Applications of Research
Method
Experiment
Demo
Summary
• Crosscorrelation is a versatile tool for keyword spotting
• This was just one example of a possible algorithm
• Further research to optimize performance

Look Who’s Talking Now SEM Exchange, Fall 2008
October 9, 200819
Montgomery College
Keyword Spotting Using Crosscorrelation Engineering Expo Banquet 2009
05/08/09
DemoResearch Goal
Applications of Research
Method
Experiment
Demo