lookingglass: a visual intelligence platform for tracking ...hdavulcu/fosint13a.pdf ·...
TRANSCRIPT

LookingGlass: A Visual Intelligence Platform for
Tracking Online Social Movements
Nyunsu Kim, Sedat Gokalp, Hasan Davulcu, Mark Woodward
School of Computing, Informatics, and Decision Systems Engineering,
Arizona State University
Tempe, USA
{nkim30, Sedat.Gokalp, hdavulcu, Mark.Woodward}@asu.edu
Abstract— We propose a multi-scale text mining methodology
and develop a visual intelligence platform for tracking the
diffusion of online social movements. The algorithms utilize large
amounts of text collected from a wide variety of organizations’
media outlets to discover their hotly debated topics, and their
discriminative perspectives voiced by opposing camps organized
into multiple scales. We utilize discriminating perspectives to
classify and map individual Tweeter's message content to social
movements based on the perspectives expressed in their weekly
tweets. We developed a visual intelligence platform, named
LookingGlass, to track the geographical footprint, shifting
positions and flows of individuals, topics and perspectives
between groups.
Keywords—Text mining; Multi-scaling; Social movements
I. INTRODUCTION
We propose a multi-scaling based methodology and a visual intelligence platform that represents an important step change in how we might observe and analyze radical social movements. Rather than placing external forms of analysis that color and tautological define what is ‘radical’ or not from an external perspective, we propose a more ontologically oriented approach. We seek to generate a methodology to allow the orientations of these movements to define themselves via their own discourse within their own universe and understanding of actions, rather than an external and potentially poorly calibrated analysis of what constitutes radical. Without this kind of fundamental reorientation to research of religiously or politically inspired social movements, we get the poor assumption based analysis that (incorrectly) predicts and champions ill-defined relationships between certain religious or political sects and violence, for example. With our reorientation of approach, we are more fundamentally able to examine such relationships in a way that should allow analysts to take other kinds of nuance and understanding into account.
Current technology for monitoring social media tracks keyword matching documents for names of known groups, individuals, and places. However, they cannot find the proverbial “needles in a haystack” corresponding to those individuals with radical or extremist ideas, connect the dots to identify their relationships, and their socio-cultural, political, economic drivers. Raw data in multiple modalities (e.g. tweets, blogs, and newswires) gushes like an uncapped oil well but existing technologies fail to provide comprehensive tools for
making-sense of the data and for seeing the bigger picture. LookingGlass is designed for real-time contextual analysis of complex socio-political situations that are rife with volatility and uncertainty. It is able to rapidly recognize radical hot-spots of networks, narratives and activities, and their socio-cultural economic, political drivers. Also, it is informed by highly trained area experts on the ground with social science and subject matter expertise as well as local cultural knowledge.
II. PROBLEM DEFINITION
One of the fundamental issues with interpretative and qualitative data collection and analysis has been the researchers’ bias while conducting the research. Goertz [1, 2] makes the crucial point that, in their enthusiasm for reifying complex sociological or political concepts, theorists and empiricists often focus too much on what a concept is, rather than on identifying the concept on a continuum, in order to assess when a concept is present versus when it is absent. In the social sciences, scaling is the process of measuring and ordering actors (subjects) with respect to quantitative attributes or traits (items). In the context of our project, both social movements (subjects) and their socio-economic, political, or religious beliefs, goals and practices (items) are mapped simultaneously on a set of scales via expert inputs and text mining algorithms. Recently we developed algorithms [3, 4, 5, 6] that utilize large amounts of multilingual text collected from a wide variety of organizations’ media outlets (e.g. web sites, blogs, news, RSS feeds, tweets, leaders’ speeches etc.) to (i) discover hotly debated topics relevant for a scale, and discriminative topic-specific perspectives voiced by opposing camps, (ii) next, we identify a subset of these discriminating perspectives with a very specific statistical pattern (probabilistic Guttman pattern [7]) that can be used to classify and rank any actor’s polarity and neutral-to-extreme position on a continuous scale at area expert-level accuracy, and finally, (iii) we utilize spatial-temporal analysis of real-time textual message feeds, from organizational RSS feeds and individuals’ Tweets to track the geographical footprint, hot spots, shifting positions and flows of individuals between groups.
III. MULTI-SCALE MODELING OF SOCIAL MOVEMENTS
Our modeling leverages social theory including Durkheim’s research on collective representations [8], Simmel’s work on conflict and social differentiation [9], Wallace’s writings on revitalization movements [10], and Tilly and Bayat’s studies on contemporary social movement theory [11, 12] to understand features shared by violent social and political movements and by those opposing them. Radicalism is the ideological conviction that it is acceptable and sometimes obligatory to use violence to effect profound political, cultural and religious transformations and to change the existing social order fundamentally. Radical movements have complex origins and depend on diverse factors that enable the translation of their radical ideology into social, political and religious movements [13, 14]. Crelinsten [15] states, “both violence and terrorism possess a logic and grammar that must be understood if we are to prevent or control them.” Binary labeling as counter-radical vs. radical does not capture the overlaps, movement and interactivity among these actors. We observe [6] that both counter-radical and radical movements in Muslim societies exhibit distinct combinations of discrete states comprising various social, political, and religious beliefs, goals, attitudes and practices, and their discriminating perspectives can be semi-automatically identified and mapped onto latent linear continuums or scales.
The model described below defines a seven dimensional possibility space within which diverse organizations, social movements, and individuals can be located. The variables are treated as continuous bipolar scales. Each scale is measured independently of the others. Social movements exhibit distinct combinations of discrete social, political, and religious beliefs, attitudes, and practices that can be mapped onto these latent linear scales. Scaling is a method for measuring and ordering entities based on their qualitative attributes.
The choice of scales relies on the work of a combination of American, European, African, and Southeast Asian scholars and the literature on similar movements in various regions. The variables are generalizations based on ethnographic research that involved observation of public events, extended interviews and informal conversations with leaders and rank and file members of organizations and movements, and discourse analysis. Field work findings and conventional discourse analysis provided input for automated discourse analysis conducted using methods relying on key words associated with each of the variables (described elsewhere). These automated methods analyzed more than fifty thousand local language documents obtained with the use of web-mining technology. The scales used in LookingGlass tools for characterizing Radical-Islamist and Counter-Radical Islamist movements are:
Epistemology: This refers to the ways in which religious groups interpret core texts. Foundationalism is at one end of a continuum. It fixes meaning in invariant, “literal” readings of core religious texts. Foundationalists claim that their readings are ahistorical and not influenced by cultural considerations. Constructivism is at the other end of the scale. It acknowledges that all variants of a religious tradition are constructed in historical, social, and cultural contexts and they can, and indeed must, change over time.
Proponents of this position maintain that to determine the meaning of a scriptural passage appropriate for a particular time, place, and culture, both the context of revelation and the context of exegesis must be considered.
Religious Diversity Tolerance: Exclusivists, who insist on universal adherence to their own beliefs and social norms and who claim exclusive possession of complete truth, are at one end. Pluralists, who understand difference as a social and religious good or theological pluralism, are at the other. An entity at the extreme pluralist end of the tolerance scale holds the view that all religions should be tolerated and that all are based on truths that transcend confessional and sectarian differences.
Change Orientation: Change orientation aims to capture the degree to which an entity wishes to effect social, political, and/or religious change. It is also a measure of the degree to which an individual or group attempts to influence others. Revitalization movements that seek to destroy the world as it is and rebuild it from scratch are at one end of the scale. Defenders of the social, political, and religious status quo are at the other.
Violence: Violence is defined broadly to include more than killing, inflicting physical injury, and destruction of property. Symbolic and discursive violence are included in this scale because they are often steps leading toward physical violence. They can cause havoc, especially when the manipulation of symbols and discourse is purposively articulated to provoke adversaries, demonize opponents, incite mobs to action, or to provide justifications for the “necessity of violence.” Unlike physical violence that can be seen and clearly understood for what it is, symbolic and discursive violence are not necessarily self-evident; hence both require knowledge of their contexts to identify them and assess their real and potential danger. Dehumanization, demonization, and the desecration of sacred places and objects are among the most common and provocative forms of symbolic violence committed in contexts of ethnic and religious conflict.
Violence Ideology scale represents the degree to which an entity supports or rejects violence as a matter of principle. Though some of the movements scaled rely on reasoned argumentation appealing to concepts of justice and oppression in addition to, or in place of narratives. At one end are those who would support any type of violence; at the other are pacifists who are ideologically committed to nonviolence. A lack of violent rhetoric is insufficient to classify an organization as pacifist if the organization is silent in the face of others’ violence violent acts and violent rhetoric.
Violence Engagement scale measures the degree to which an entity engages in any type of violence including symbolic or discursive violence. At one end of the continuum are those who have explicitly claimed responsibility for violent acts. At the other end are those who have never engaged in any type of violence.

IV. LOOKINGGLASS TOOLS AND METHODS
A. Graphical Scaling Tool
We designed an intuitive, easy-to-use graphical tool for
defining multiple scales, so that area experts may populate
them with polarities and positions of known social movements
from a certain region. A snapshot of such a graphical scaling
tool is shown in Figure 1, which marks the positions and
polarities of 23 groups from Indonesia on the seven scales
described above.
B. Multi-Lingual Topic Detection
We utilized on-line topic detection [16] in text corpus. We asked area-experts to scan detected topics and associate them with the scales that they are relevant. For example, a partial list of relevant topics for a Political Change scale for Indonesia include: {sharia, family law, corruption, democracy, election, secularism, state, constitution, justice}.
C. Discriminative Perspective Mining
The more challenging aspect of textual analysis is
discriminating perspective mining in debates between the
opposing camps on a scale. A debate is a formal discussion on
a set of related topics in a forum, in which opposing arguments
are put forward. For example, a debate on education might
comprise opposing perspectives, such as “secular, multi-
cultural education” vs. “religious, sharia based education”. In
this step, our focus is the development of an automated
perspective mining algorithm, which would contribute to the
understanding of features (i.e. social, political, cultural,
religious beliefs, goals, and practices) shared by one side of a
debate, and by those opposing them. We formulate the
perspective mining problem in a general structured sparse
learning framework [17]. In particular, the logistic regression
formulation fits our application, since it is a dichotomous
classification problem:
∑ (
)) | |
In the formula above, ai is the vector representation of the
ith document, wi is the weight assigned to the ith document (wi
=1/m by default), and A=[a1, a2, …, am] is the document
keyword matrix, yi is the polarity of each document based upon
the scale polarity of the actor that the document belongs to, and
the unknown xj , the j-th element of x, is the weight for each
keyword, λ>0 is a regularization parameter that controls the
sparsity of the solution, |x|1= Σ|xi| is 1-norm of the x vector. We
use the SLEP1 sparse learning package that utilizes gradient
descent approach to solve the above convex and non-smooth
optimization problem. The keyword phrases with non-zero
values on the sparse x vector yield the discriminant
perspectives based on their polarity (positive or negative).
Following table displays radical perspectives for fivetopics.
Figure 2. Radical Perspectives for Topics
1 http://www.public.asu.edu/~jye02/Software/SLEP/
Figure 1. Graphical Scaling Tool

D. Response Tables of Social Movements
A response table is calculated based on the normalized
frequency with which actors mention various perspectives, as
indicated by keywords. The median frequency of each
perspective is selected as a threshold. Actors and normalized
perspective frequencies are used to build a dichotomous [0/1]
response matrix. A sample partial response table for the
Violence Ideology scale is presented in Figure 3.
E. Rasch Modeling
A true Guttman scale is deterministic, i.e. if an actor
subscribes to a certain perspective, then it must also agree
with all lower order perspectives on the scale. Of course,
perfect order is rare in the social world. The Rasch [18] model
provides a probabilistic framework for Guttman scales to
accommodate incomplete observations and measurement
error. We employ the Rasch model to measure the abilities of
actors on a latent scale, alongside the difficulties of
perspectives on the same scale. By definition, the location of
an item (difficulty) on a scale corresponds to the actor location
(ability) at which there is a 0.5 probability of a response. Once
item locations are scaled, then actor locations are measured on
the scale using the EM-method for joint Maximum Likelihood
Estimation [19]. The following figure (Figure 4) is the radical
actor-perspective map displaying the location of
discriminating perspective (items) as well as the distribution
of actors (subjects) along a Violence Ideology scale:
Figure 4. A Violence Ideology Scale for Radical Actors
F. Micro Level Analysis of Groups and Individuals
The utilization of the logistic regression formulation
presented in Section IV. C provides a classification model [20]
between different polarities of a scale -- by checking the
polarity of (xT.ai) where x
T corresponds to the weights of the
discriminant perspectives relevant to a scale, and ai is the
keyword vector of each Tweeter’s weekly message content.
Using the discriminating perspectives, we can not only detect
if a message or a collection of messages from a Tweeter maps
to one polarity or another polarity of a scale (e.g. radical or
not-radical), but also if a message or a messenger classifies as
a follower of one of the known social movement’s rhetoric or
ideology. In our 10-fold cross-validation-based experiments
with 37,000 web pages downloaded from web sites of 23
Islamic organizations (10 radical and 13 non-radical) from
Indonesia, we observed that the linear formulation-based
message classifier, with discriminative perspectives as its
features, achieves over 98% accuracy for predicting the
corresponding polarity of documents. Furthermore, we
observed that logistic formulation-based classifier achieves
over 83% accuracy for predicting the corresponding source (a
particular Islamic organization) of a document. Combined
with longitudinal analysis of an individual’s messages (such as
those that can be observed on Twitter, message boards, blogs,
or in chat rooms), we can determine (i) shifts of individuals
from the status of unaffiliated to affiliated of one of the known
social movements (SM), (ii) growth and shrinkage drivers (i.e.
types of events and narratives) of SMs, and (iii) influential
followers of SMs. In the following section we describe the
design of a real-time dashboard, named LookingGlass (see
Figure. 5), to display all types of flows and hot spots of
Tweeters between radical (red) and non-radical (green) SMs,
their popular keywords, hash tags, event mentions, and media
sources driving their weekly shifts.
Figure 5. A Real-Time Dashboard for Visualizing Shifts and their Flows
Figure 3. Response Table of Radical Actors on Violence Ideology perspectives
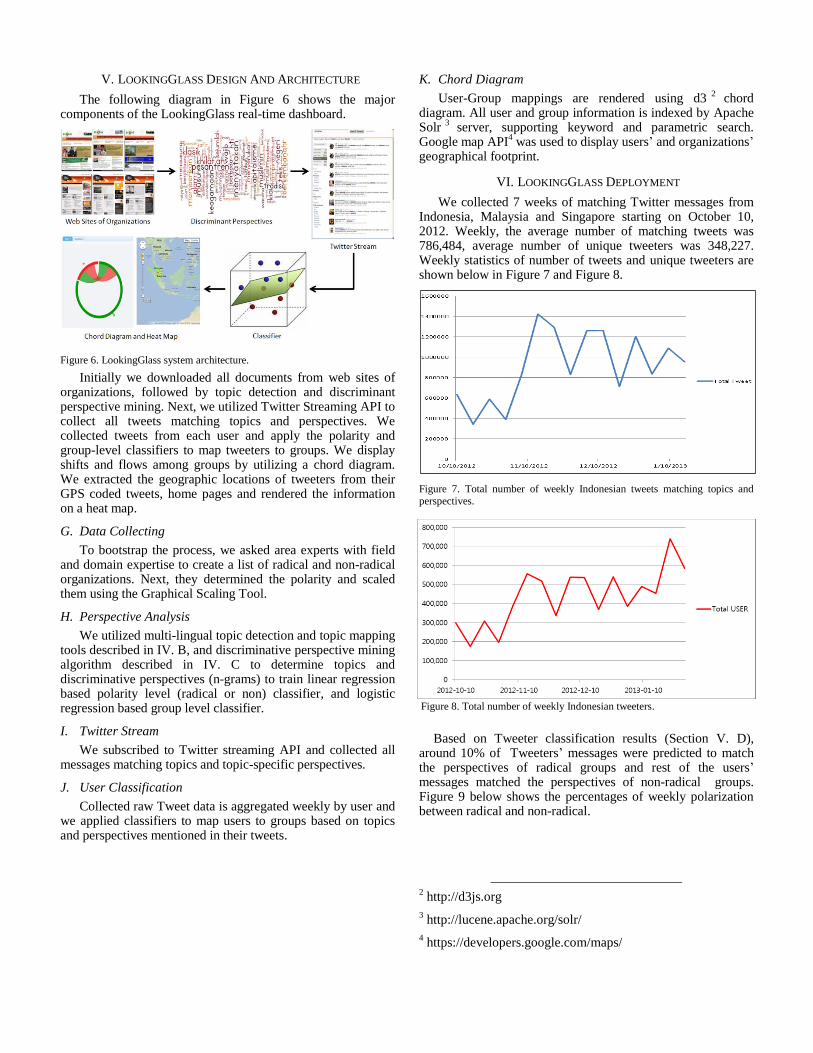
Figure 8. Total number of weekly Indonesian tweeters.
V. LOOKINGGLASS DESIGN AND ARCHITECTURE
The following diagram in Figure 6 shows the major components of the LookingGlass real-time dashboard.
Figure 6. LookingGlass system architecture.
Initially we downloaded all documents from web sites of organizations, followed by topic detection and discriminant perspective mining. Next, we utilized Twitter Streaming API to collect all tweets matching topics and perspectives. We collected tweets from each user and apply the polarity and group-level classifiers to map tweeters to groups. We display shifts and flows among groups by utilizing a chord diagram. We extracted the geographic locations of tweeters from their GPS coded tweets, home pages and rendered the information on a heat map.
G. Data Collecting
To bootstrap the process, we asked area experts with field and domain expertise to create a list of radical and non-radical organizations. Next, they determined the polarity and scaled them using the Graphical Scaling Tool.
H. Perspective Analysis
We utilized multi-lingual topic detection and topic mapping tools described in IV. B, and discriminative perspective mining algorithm described in IV. C to determine topics and discriminative perspectives (n-grams) to train linear regression based polarity level (radical or non) classifier, and logistic regression based group level classifier.
I. Twitter Stream
We subscribed to Twitter streaming API and collected all messages matching topics and topic-specific perspectives.
J. User Classification
Collected raw Tweet data is aggregated weekly by user and we applied classifiers to map users to groups based on topics and perspectives mentioned in their tweets.
K. Chord Diagram
User-Group mappings are rendered using d32
chord diagram. All user and group information is indexed by Apache Solr
3 server, supporting keyword and parametric search.
Google map API4 was used to display users’ and organizations’
geographical footprint.
VI. LOOKINGGLASS DEPLOYMENT
We collected 7 weeks of matching Twitter messages from Indonesia, Malaysia and Singapore starting on October 10, 2012. Weekly, the average number of matching tweets was 786,484, average number of unique tweeters was 348,227. Weekly statistics of number of tweets and unique tweeters are shown below in Figure 7 and Figure 8.
Figure 7. Total number of weekly Indonesian tweets matching topics and perspectives.
Based on Tweeter classification results (Section V. D), around 10% of Tweeters’ messages were predicted to match the perspectives of radical groups and rest of the users’ messages matched the perspectives of non-radical groups. Figure 9 below shows the percentages of weekly polarization between radical and non-radical.
2 http://d3js.org
3 http://lucene.apache.org/solr/
4 https://developers.google.com/maps/

In order to detect shifts, we utilized the Rasch Model scaling of organizations discussed in Section IV. E. Figure 10 below shows the polarities of the radical and non-radical lists of organizations we analyzed, and their rankings from neutral-to-extreme positions on both sides. For instance, if a tweeter’s messages were classified to a radical organization during a previous week, and following week the same tweeter’s messages were classified to a non-radical organization, then we labeled the user’s shift as “counter-radicalized”. Similarly, if a tweeter’s messages were classified to a non-radical group, or to a radical group of a lower caliber during an earlier week, and then the same user’s messages were classifier to a radical group of a higher caliber during the following week then we labeled the user’s shift as “radicalized”. The polarity and rankings of organizations, and two possible shift directions are as shown below in Figure 10.
Weekly opinion shift trends for 7 weeks are shown in Figure 11. An average percentage of radicalized opinion shifts was around 15%, average percentage of counter radicalized opinion shifts was 70%, and approximately 15% of users preserved their previous weekly positions. During weeks 6 and 7 percentage of radicalized shifts jumped above 20% due to corruption related debates.
VII. LOOKINGGLASS USE SCENARIOS
In this section, we present three scenarios to demonstrate different features of the LookingGlass platform. All scenarios are drawn from real social movements and Tweeter streams.
1) A Protest Event highlighted by Non-Affiliated Radicals.
If a Tweeter’s weekly message content gets classified as
“Radical”, but the user does not classify to one of the known
radical groups by the group level classifier, then we label that
user as “Unaffiliated Radical”. A similar reasoning also
applies to detect “Unaffiliated Counter-Radicals”.
a) An event was among the most popular tweets of 370
Unaffiliated Radicals between Oct.10.2012 and Oct.17.2012.
b) The event was a salafi student protest and the violent
reaction by the security forces against them at North Sulawesi,
Indonesia.
c) This “radicalizing” event can be detected by selecting
the “Unaffiliated Radical” segment on the chord diagram and
checking the popular URL’s mentioned in their tweets.
Clicking on the corresponding URL pops-up the article titled
“Demo Cagub, Polisi Hajar Mahasiswa” from its original
media source http://sindikasi.inilah.com/. (Figure 12)
Figure 12. Event based users’ opinion tracking
2) A Radical Group’s Local Followers.
a) Clicking on one of the radical groups on the chord
diagram shows the geographic footprint of their followers.
b) A group of followers were detected at “The Tun
Dr.Ismail International School of Johor”, in Padang Tengku,
Malaysia.
Figure 10. Weekly opinion shifts in tweets.
Figure 11.Weekly radicalized / counter radicalized shifts - percentages. Figure 9. Weekly radical and non-radical polarities of Tweeters.

c) We show the Tweeter home pages of two followers
in Figure 13. One of tweeters on the followers list, is the
official twitter account of the organization itself highlighing
their Khilafah goals. Another one of the tweeters on the
followers list, talks about protests, jihad, mujahideen and
displays the image of a militia group on the background image
of the Tweeter page.
3) A Radical Group’s Transnational Followers.
a) Selecting another radical group on the chord diagram,
reveals a group of followers exchanging messages from
Singapore, Malaysia, and Indonesia.
b) One of the popular URLs shared among these
transnational group of tweeters is an article on a missile attack
into Israeli territory by a terrorist organization.
c) Following figure (Figure 14) shows the selected
organization on the Chord Diagram, one of the popular articles
exchanged among followers, and its orginal media source.
Figure 14. A Radical Group’s transnational followers.
ACKNOWLEDGMENT
This research was supported by US DoDs Minerva Research Initiative Grant N00014-09-1-0815, Project leader: Prof. Mark Woodward, Arizona State University, and the project name is “Finding Allies for the War of Words: Mapping the Diffusion and Influence of Counter-Radical Muslim Discourse”.
REFERENCES
[1] G. Goertz, Social science concepts : a user’s guide, Princeton, NJ:
Princeton University Press., 2006.
[2] G. Goertz and J. Mahoney, "Two-Level Theories and Fuzzy-Set Analysis," Sociological Methods Research, vol. 33, pp. 497-538, 2005.
[3] H. Davulcu, S. Ahmed, S. Gokalp, H. Temkit, T. Taylor, M. Woodward and A. Amin, “Analyzing Sentiment Markers Describing Radical and Counter-Radical Elements in Online News,” in IEEE Symposium on Social Intelligence and Networking (SIN-10), pp. 335-340, 2010.
[4] S. Tikves, S. Banerjee, H. Temkit, S. Gokalp, H. Davulcu, A. Sen, S. Corman, M. Woodward, R. I. and A. Amin, “A System for Ranking Organizations using Social Scale Analysis,” in Proc. of the International Symposium on Open Source Intelligence & Web Mining (OSINT-WM), 2011.
[5] S. Tikves, S. Gokalp, M. Temkit, S. Banerjee, J. Ye and H. Davulcu, "Perspective Analysis for Online Debates," Proceedings of International Symposium on Foundation of Open Source Intelligence and Security Informatics (FOISINT-SI), 2012.
[6] S. Tikves, S. Banerjee, H. Temkit, S. Gokalp, H. Davulcu, A. Sen, S. Corman, M. Woodward, I. Rohmaniyah and A. Amin, " A System for Ranking Organizations Using Social Scale Analysis," Social Network Analysis and Mining Journal, Vols. ISSN (Print) 1869-5450 - ISSN (Online) 1869-5469, pp. 1-16, 2012.
[7] L. Guttman, “The basis for scalogram analysis,” Measurement and prediction, vol. 4, pp. 60-90, 1950.
[8] E. Durkheim, “The cultural logic of collective representations,” in Social theory the multicultural and classic readings , Wesleyan University: Westview Press, 2004, pp. 90-99.
[9] G. Simmel, Sociological Theory, New York: McGraw–Hill, 2008.
[10] A. Wallace, “Revitalization Movements,” American Anthropologist, vol. 58, pp. 264-281, 1956.
Figure 13. A Radical Group’s local followers

[11] A. Bayat, Making Islam Democratic: Social Movements and the Post-Islamist Turn, Stanford University Press, 2007.
[12] C. Tilly, Social Movements, Boulder, Colorado, USA: Paradigm Publishers, 2004.
[13] G.-M. J., "The rhetoric and reality: radicalization and political discourse," International Political Science Review, vol. 33, no. 5, pp. 556-567, 2012.
[14] G.-M. J., "The rhetoric and reality: radicalization and political discourse," International Political Science Review, vol. 33, no. 5, pp. 556-567, 2012.
[15] R. Crelinsten, "Analysing terrorism and counter-terrorism: A communication model," Terrorism and Political Violence, vol. 14, p. 77–122, 2002.
[16] L. AlSumait, D. Barbara and C. Domeniconi, "On-line LDA: Adaptive Topic Models for Mining Text Streams with Applications to Topic Detection and Tracking," in Eighth IEEE International Conference on Data Mining (ICDM '08), 2008.
[17] J. Liu, J. Chen and J. Ye, "Large-scale sparse logistic regression," in Proceedings of the 15th ACM SIGKDD international conference on Knowledge Discovery and Data Mining, 2009.
[18] D. Andrich, Rasch models for measurement, Sage, 1988.
[19] Y. Pawitan, In all likelihood: statistical modelling and inference using likelihood., Oxford University Press, 2001.
[20] R. Tibshirani, "Regression shrinkage and selection via the lasso," Journal of the Royal Statistical Society Series B, vol. 58, no. 1, pp. 267-288, 1996.