los angeles county prevention initiative demonstration ... supports • many networks helped...
TRANSCRIPT

1
Los Angeles County Prevention Initiative Demonstration Project (PIDP): The Role of Evaluation in Fostering Innovation Presentation for the LA Partnership for Child Welfare Evaluation Summit (August 29, 2011) Presenters: Jacquelyn McCroskey, Peter J. Pecora, Jaymie Lorthridge and Todd Franke , representing the PIDP evaluation team. Other Evaluation Team Members: Christina (Tina) A. Christie, Dreolin Fleischer and Erica Rosenthal.
Prevention Initiative Demonstration Project
“The thing that we are focusing on is to reconnect
people to the fact that they are part of a community that is serving a family, rather than individual
agencies.” Lead Agency
2

Outline
1. Overview of PIDP 2. Evaluation study research design 3. Persons served 4. Relationship-based Protective Factors Survey findings 5. New child safety and permanency outcomes as
measured by agency CWS/CMS data 6. Promising practice strategies
3
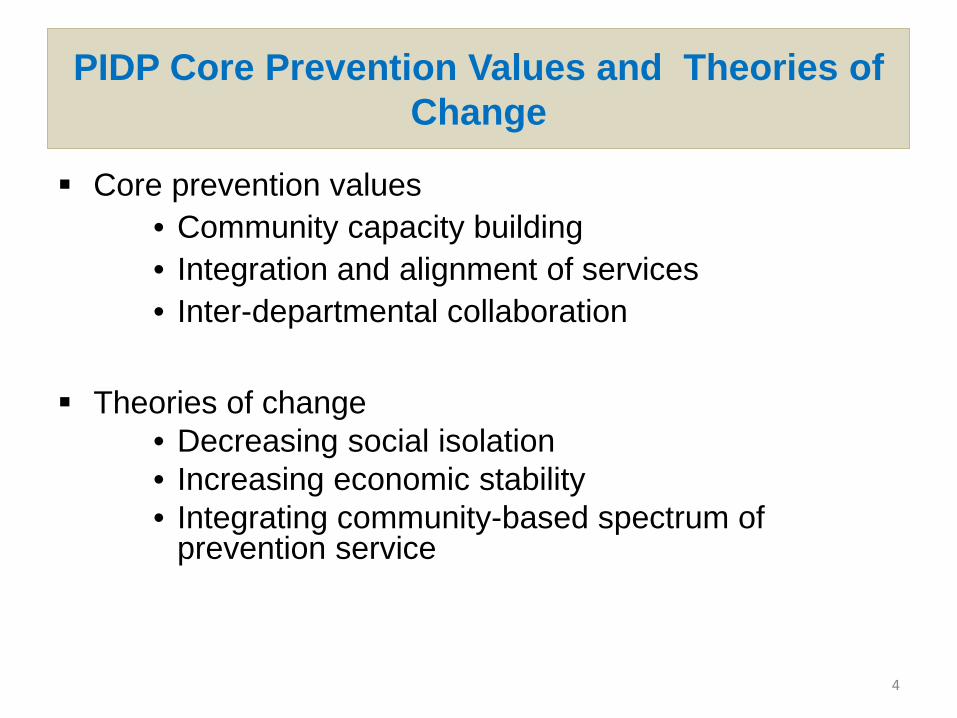
PIDP Core Prevention Values and Theories of Change
Core prevention values • Community capacity building • Integration and alignment of services • Inter-departmental collaboration
Theories of change
• Decreasing social isolation • Increasing economic stability • Integrating community-based spectrum of
prevention service
4

Goals of the PIDP Evaluation
Evaluate collaborative strategies and efforts among residents, Community-based organizations, county departments and other government entities and businesses.
Evaluate strategies and initiatives to determine “best
practices” for potential countywide replication. Use evaluation results to better align contracted
prevention-oriented program funding streams with the needs of children and families
5

Overall Study Design
(1) Assess network development;
(2) Track changes within DCFS offices/ and relationships b/w DCFS offices and community partners;
(3) Gather data from participating families;
(4) Assess promising approaches;
(5) Test outcomes for children;
(6) Examine interactions and synchronicity of multiple prevention-oriented strategies.
6

Year Two Evaluation Findings
• Parent-reported changes
• Effectiveness as measured by CWS-CMS data
• Detailed descriptions of activities in each SPA
7

Persons Served
SPA (LA Geographic
Areas)
DCFS Clients
Community Residents (Non-
DCFS) TOTAL
SPA 1 147 467 614 SPA 2 445 2,173 2,618 SPA 3 281 491 772 SPA 4 121 2,284 2,405 SPA 5 51 74 125 SPA 6 597 3,723 4,320 SPA 7 58 1,528 1,586 SPA 8 691 4,834 5,525 Unduplicated Count of Persons Serviced
2,391 15,574 17,965
8
Economic Supports
• Many networks helped vulnerable families with job training and job placements. Some SPA networks implemented a county-wide campaign to help families access Earned Income Tax Credit (EITC) and Volunteer Income Tax Assistance (VITA). This generated nearly $4.4 million in income tax refunds for low-income parents across the County by the end of April 2009.
• ASK Centers in SPA 6 trained and placed nearly 300
residents in the workforce and provided pro bono legal services to over 1000 residents
9

Social Supports
• PIDP parents in all SPAs reported that they had greater involvement in their community, more desire to engage in community activities, and felt less lonely or isolated.
• Scale scores for the Relationship-based Protective
Factors Survey follow.
10

F1: Social Support (N=138)
2.40
3.18 3.23
0
1
2
3
4
5
T1r T2 T3
Mea
n R
atin
g
Rating Scale: 1- “Not at all” 2- “1-2 times/wk” 3- “About 1 time a week” 4- “Several Times a week” 5- “About every day”
11

F2: Personal Empowerment (N=141)
2.44
3.23 3.23
0
1
2
3
4
T1r T2 T3
Mea
n R
atin
g
Rating Scale: 1- “Not at all” 2- “Sometimes true” 3- “Often true” 4- “Always true”
12

F3: Economic Stability/Economic Optimism (N=134)
2.472.80 2.88
0
1
2
3
4
T1r T2 T3
Mea
n R
atin
g
Rating Scale: 1- “Not at all” 2- “Sometimes true” 3- “Often true” 4- “Always true”
13

F4: Quality of Life (N=145)
3.253.76 3.79
0
1
2
3
4
5
6
7
T1r T2 T3
Mea
n R
atin
g
Rating Scale: 1- “Strongly agree” 2- “Mostly agree” 3- “Slightly agree” 4- “Neutral” 5- “Slightly disagree” 6- “Mostly disagree” 7- “Strongly disagree
14

Quality of Life- Single Item (N=131)
64.75
76.30 74.56
0
15
30
45
60
75
90
T1r T2 T3
Mea
n R
atin
g
15
Rating Scale: 0 – “No quality of life to 100- “Perfect quality of life”

F5: Immediate and Extended Family Support (N=59)
9.59
9.4410.81
0
5
10
15
20
25
30
T1r T2 T3
Mea
n R
atin
g
Rating Scale: 6 Items are measured. Each Item has a range of 1 to 5. (1-”Not at all helpful” 2- “Sometimes helpful” 3- “Generally helpful” 4- “Very helpful” 5- “Extremely helpful”
The 6 items are then totaled and the range presented is 6-30. 16

F6: Professional Support (N=58)
9.57
13.55 13.98
0
5
10
15
20
25
30
Mea
n R
atin
g
T1r T2 T3
Rating Scale: 6 Items are measured. Each Item has a range of 1 to 5. (1-”Not at all helpful” 2- “Sometimes helpful” 3- “Generally helpful” 4- “Very helpful” 5- “Extremely helpful”
The 6 items are then totaled and the range presented is 6-30. 17
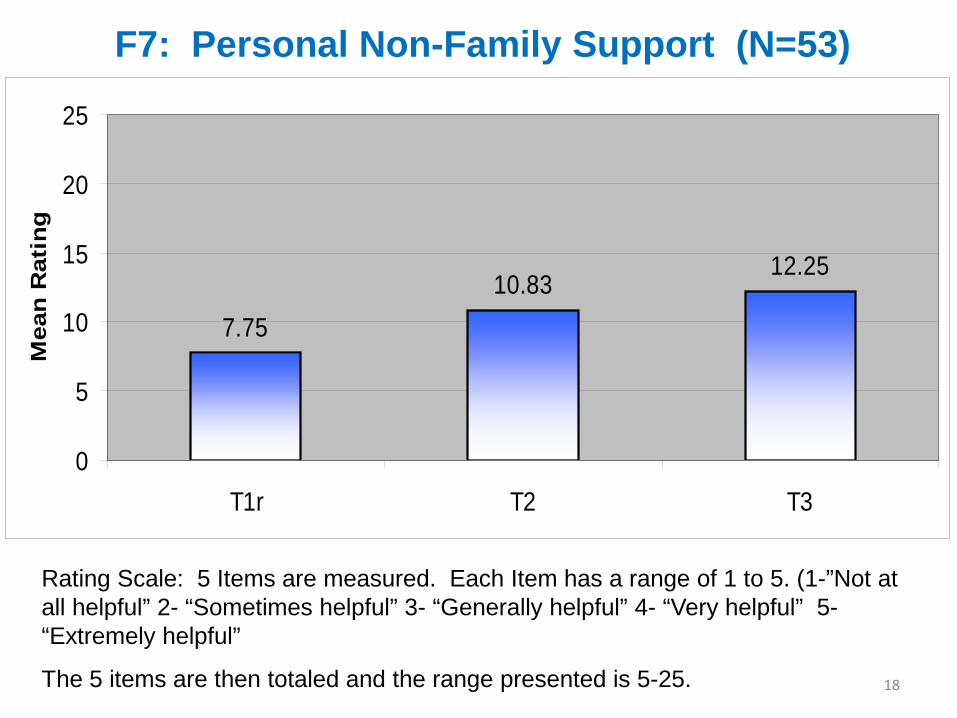
F7: Personal Non-Family Support (N=53)
7.7510.83
12.25
0
5
10
15
20
25
Mea
n R
atin
g
T1r T2 T3
Rating Scale: 5 Items are measured. Each Item has a range of 1 to 5. (1-”Not at all helpful” 2- “Sometimes helpful” 3- “Generally helpful” 4- “Very helpful” 5- “Extremely helpful”
The 5 items are then totaled and the range presented is 5-25. 18

F8: Successful Parenting (N=74)
5.17 5.36 5.55
0
1
2
3
4
5
6
7
Mea
n R
atin
g
T1r T2 T3
Rating Scale: 1- “Strongly agree” 2- “Mostly agree” 3- “Slightly agree” 4- “Neutral” 5- “Slightly disagree” 6- “Mostly disagree” 7- “Strongly disagree
19

F9: Parenting Challenges (N=67)
5.114.46 4.63
0
1
2
3
4
5
6
7
Mea
n R
atin
g
T1r T2 T3
Rating Scale: 1- “Strongly agree” 2- “Mostly agree” 3- “Slightly agree” 4- “Neutral” 5- “Slightly disagree” 6- “Mostly disagree” 7- “Strongly disagree
20

CWS/CMS Findings SD 1
Figure 5.1 – Pomona (SPA 3) Exits and Achievement of Legal Permanence
0%
20%
40%
60%
80%
100%
Percent Exiting Foster Care Percent Achieving Legal Permanency
54%
Comp.Group
67%
PIDP
81%
PIDP 58%
Comp.Group
N for PIDP: 110 N for Comparison Group: 200
21

CSW/CMS Findings SD 2
Figure 5.3 – Compton (SPA6) Re-Referrals to Child Protection Services
23%
Comp.Group
12%
PIDP0%10%20%30%40%50%60%70%80%90%
100%
N for PIDP: 130 N for Comparison Group: 150
22

CWS/CMS Findings SD 4
Figure 5.2 – South County and Torrance (SPA 8) Exits from Foster Care with Faith-Based Visitation Services
Percent Exiting from Foster Care Percent Achieving Legal Permanency
55%
Comp.Group
71%
PIDP
69%
PIDP50%
Comp.Group
0%
20%
40%
60%
80%
100%
N for PIDP: 79 N for Comparison Group: 100
23

Promising child maltreatment prevention strategies for future replication across
Los Angeles County
• Social connections strategies such as Neighborhood Action Councils and family resource centers, such as the ASK Centers.
• Parent economic empowerment strategies such as career counseling, job training, job placement, pro bono legal services and the EITC and VITA programs.
• Faith-Based Parent Visitation Centers for parents with
children in foster care.
24

Continued: Promising child maltreatment prevention strategies for future replication
across Los Angeles County
• The combination of Cultural Brokers and Parent Advocates into a case management team approach (strategies that include community residents and parents who have been served by the child welfare system)
25

Special Notable Approaches by Community
• Economic Development (VITA in SPA 4, EITC in all SPAs)
• Neighborhood Action Councils (NACs in SPAs 2, 4, 7, 8)
• Family Resource Centers (ASK Centers in SPA 6)
• Family Visitation Centers (SPA 8)
• Shared Leadership in Action Programs and Parents Anonymous® Adult and Children’s Groups (SPA 3)
• Cultural Brokers & Parent Advocates (SPA 3)
26

Recommendations Included
1. Assure that contracting processes are aligned with desired goals, outcomes, and processes.
2. Maximize drawdown from all possible matching funding sources and that it continue to explore synergies with the Chief Executive Office, other departments and private grant making.
3. The new estimated $58 million LA child abuse prevention and family support contract redesign process that will take affect in 2012 should incorporate the key PIDP strategies.

Innovation and Implications
• PIDP demonstrates the value of innovative braided community-based child abuse prevention strategies designed to meet local needs.
• Challenges in designing quasi-experimental and/or new
experimental design and measures for innovative approaches.
• How to evaluate when communities (not departments or researchers) “own” the design?
28

References
Center for the Study of Social Policy. (2009). Strengthening Families
through early care and education. (Retrieved July 24, 2009 from hppt://www.strengtheningfamilies.net/index.php/main_pages/protective_factors
Marts, E.J., Lee, R. McCroy, R. & McCroskey, J. (2008). Point of
engagement: reducing disproportionality and improving child and family outcomes. Child Welfare, 87(2),335-358.
29

Continued: References
McCroskey, J., Christie, T., Lorthridge, J., Chambers, R., Pecora, P. J., Azzam, T. , Fleischer, D., Rosenthal, E., Weisbart, A., Custodio, C., Franke, T., Nunn, P., Carter, S., Yoo, J., Bowie, P. &Wold, C. (2009). Prevention Initiative Demonstration Project (PIDP): Year one evaluation summary report. Los Angeles: Casey Family Programs. Retrieved from http://www.casey.org/Resources/Publications/pdf/pidp_fr.pdf
McCroskey, J., Christie, T., Pecora, P. J., Lorthridge, J., Chambers, R.,
Franke, T., Azzam, T., Fleischer, D., Williams-Carter, S., Fleischer, D., Rosenthal, E., Weisbart, A., Custodio, C., Smith, S., Nunn, P., Hahn, R. and Yoo, J. (April 2009). Building communities and connecting the dots: Preliminary evaluation findings from the Los Angeles County Prevention Initiative Demonstration Project. Seattle, WA: Casey Family Programs. Interim report.
30

Continued: References
Pecora, P. J., McCroskey, J., Christie, T., Lorthridge, J., Chambers, R., Franke, T., Azzam, T., Fleischer, D., & Williams-Carter, S. (2008). Midcourse lessons learned from the Los Angeles County Prevention Initiative Demonstration Program (PIDP): Early successes, innovative partnerships, and the challenges that lie ahead. Seattle, WA: Casey Family Programs.
Reynolds, A. J., & Robertson, D. L. (2003). School-based early
intervention and later child maltreatment in the Chicago longitudinal study. Child Development 74, (1), 3–26.
31

PIDP Contact Information
Report compiled by Dr. Jacquelyn McCroskey, Dr. Todd Franke, Dr. Christina (Tina) A. Christie, Dr. Peter J. Pecora, Jaymie Lorthridge, Dreolin Fleischer, and Erica Rosenthal. For more information about this evaluation report, please contact: Dr. Peter J. Pecora ([email protected]) or Dr. Jacquelyn McCroskey ([email protected]). For more information about the LA Prevention Initiative and Demonstration Project, please contact: Patricia S. Ploehn, LCSW ([email protected]) or Norma Doctor Sparks, J.D., M.S.W. ([email protected])