los angeles. u.s.a. - ucl - london's global … slums reports: the case of los angeles, usa...
TRANSCRIPT

I. INTRODUCTION: THE CITY
A. URBAN CONTEXT
1. National OverviewThe preamble to the federal 1949 U.S. Housing Act
states: The Congress declares that the general welfare andsecurity of the Nation and the health and living stan-dards of its people require housing production andrelated community development sufficient to remedy theserious housing shortage, the elimination of substan-dard and other inadequate housing through the clear-ance of slums and blighted areas, and the realization assoon as feasible of the goal of a decent home and a suit-able living environment for every American family, thuscontributing to the development and redevelopment ofcommunities and to the advancement of the growth,wealth, and security of the Nation.
While this goal has been met for approximatelyseventy per cent of the nation’s households – primarilythose with upper and moderate incomes – the remain-der – many of whom live in poor rural communities andin inner city areas – lack adequate housing. The UnitedStates has a total population of nearly 249 millionpersons who inhabit an area of 9.8 million square kilo-metres. While America has some of the best housingin the world, some face living conditions similar to thosein developing nations.
The City of Los Angeles is the second largest city inthe U.S. (see Table 1). Compared to its closest rivals,
New York and Chicago, Los Angeles is notable forhaving a relatively low population and housing density.This is due largely to the Los Angeles region’s growththrough suburbanization, when low-density singlefamily dwellings began to dominate urban form.Nonetheless, contrary to popular images, less than fortypercent of residents own their own home, a lower ratethan Chicago. Los Angeles has a much larger Latinopopulation than either of its two rival cities and approxi-mately the same percentage of Asians as New YorkCity. In addition to being an economic gateway to thePacific Rim, Los Angeles is a primary entry point forinternational migration and the metropolitan area withthe greatest level of ethnic diversity in the nation.
2. The History of Los AngelesThe history of Los Angeles reveals that the region has
long been an area of ethnic diversity, rapid economicand population growth, and conflicts over vitalresources and infrastructure. In 1769 30,000 NativeAmericans lived in Southern California, clusteringaround locations where water and game were plentiful.One settlement, Yang-na, was home to the Gabrielenosand near present day downtown Los Angeles. ASpanish mission was eventually built on this site as partof a chain that stretched along the California coast. In
The case of
Los Angeles. U.S.A.by Neal Richman, Ph.D. and Bill PitkinContact:Neal Richman, Ph.D. and Bill PitkinUCLA Advanced Policy Institute3250 Public Policy Building, Box 951656Los Angeles CA 90095-1656 USATel. +310-825-0577, +310-825-5435 Fax. +310-206-9105E-mail: [email protected]
Sou
rce:
CIA
fact
book

Urban Slums Reports: The case of Los Angeles, USA
1781, New Spain’s governor of California founded ElPueblo del la Reina de Los Angeles with 44 colonists.As Mexico gained its independence from Spain, aMexican plaza grew around the mission, but by 1830,only 770 inhabitants resided there. Some of this popu-lation were mixed race with African bloodlines, so thecity is described as having a long multi-ethnic history.
California was annexed to the United States in 1850,after the Mexican-American war, and the state legisla-ture officially incorporated the City of Los Angeles. Thepopulation of Los Angeles at this point had only doubledwith just 20 percent of the residents being identified asof “American ancestry”. The economic hierarchy wasone of Mexican landowners, workers, and Indian slaves.Significant migration from the Midwest and east coastbegan when the transcontinental railroad was extendedto Los Angeles in 1876. City boosters raised the fundsto get the Southern Pacific railroad line brought downfrom San Francisco and then linked the inland city ofLos Angeles with tracks leading to the port in SanPedro. Chinese and others who worked on building therail lines were part of an imported underclass thatlaboured and lived in segregated residential areas
In the 1880s the Santa Fe Railroad built a competingline, with a direct connection between Los Angeles andChicago, and the two rail lines began a rate war thatreduced travel cost to one dollar per person. The City’sChamber of Commerce marketed a Southern California“paradise” as a way to lure mid-Westerners to the areaand promote rapid land speculation. However, theboom led to a large bust when subdivided parcels didnot sell. In 1888, the County Tax Assessor countedsixty ghost towns in the area.
The discovery and extraction of oil in 1892 began toprovide the economic underpinning of rapid develop-ment and trade for the area. These oil boomtownsdotted the coastal plains and hillsides of Los Angelesand each needed its own local workforce. Some incor-porated as separate cities to control the extraction ofwealth through company towns. When the US gainedcontrol of the Philippines in 1898 at the end of theSpanish American War, the Los Angeles port at SanPedro began to assume a more important strategic rolefor the national government, followed by additional
federal funds for improving public infrastructure.Longshoreman and other port workers began to congre-gate in the area, setting the stage for concentrations ofhousing for the poor in the harbour area. The downtownrailway stop is adjacent to Los Angeles’s Skid Rowwhere the tenement buildings at one time housedmanpower for the transportation hub and its local ware-houses.
The semi-arid coastal plain, and large inland valleysthat make up the Los Angeles basin did not containsufficient local water resources to support the majormetropolitan centre that civic boosters sought to create.In 1913 a water reclamation project in the Mono Lakeregion on the eastern slope of the Sierra Mountains wascaptured by Los Angeles interests and led to the build-ing of a state wide canal. Access to surplus water wasa major incentive for independent cities to merge withLos Angeles in its drive for growth, and annexation hasproduced a strangely shaped city. Figure 1 shows theareas that were incorporated by the City, at its northernsection, the large valley above the Santa MonicaMountains, and at its southern tail a narrow “tail” of landthat leads to the Los Angeles Port. The Los AngelesAqueduct still carries water 250 miles south without theuse of a pumping station.
In the 1920s Los Angeles’s industrial sector began togain momentum, tripling in size over the decade.However with the coming of the Great Depression, theprice of oil plummeted and so too went the city’seconomic base. During the depression, anti-immigrantfeelings rose to the surface, affecting the response tonot only people of colour, but even low-income, whitemigrants from the East. Civic leaders even laid plansfor a “Bum Blockade” to keep desperate indigents fromtravelling to the region in search of opportunity. Notuntil 1939, one decade later, did the city economyrecover to pre-Depression levels.
In the late 1930s, growth in the local aviation industryand “Hollywood” movie production began to set thestage for rapid economic expansion during World WarII. Increasingly, the region produced ships, planes,steel, and the associated machinery of war. With menat war, women began to enter the labour force inincreasing numbers, taking manufacturing jobs in areas
Table 1. Comparisons between Los Angeles, New York and Chicago
CityArea in Square
KmPopulation
OccupiedHousing
Units
OccupiedHousingDensity*
%Renter
%African
American
%Latino
%Asian
Los Angeles 1,215 3,694,820 1,275,412 1,049 61.4% 11.2% 46.5% 10.0%
New York 800 8,008,278 3,021,588 3,777 69.8% 26.6% 27.0% 9.8%
Chicago 520 2,896,016 1,061,928 2,042 56.2% 36.8% 26.0% 4.3%
Source: 2000 U.S. Census * Occupied Units per Square Km.
2

ownership financing. Additionally, former servicemenhad access to even lower interest “G.I. loans” to helpthem become homeowners. However, these benefitsdid not reach the ethnic minority communities in thedowntown area, the Eastside and South Central LosAngeles. Specific underwriting criteria for mortgageloans, coupled with restrictive covenants, allowed fordiscriminatory lending practices. These policiessupported “white flight” from the inner city and increasedracial segregation in the growing metropolis. Concurrentreductions in public transit isolated the poor, makingthem increasingly dependent on local services andemployment opportunities.
More than fifty years ago, Charles Abrams an archi-tectural critic, described the other Los Angeles, far fromthe dream of suburban homeownership:
Did I say slums? Los Angeles has not slums — to speak of… Every year tons of copy go out from this county seat of makebelieve — never a word about slums… But behind the palmtrees are grim four-story wooden structures affording a miser-able shelter to tens of thousands of families. One in every six
3
where they had previously had noopportunities. The port at San Pedrowas a critical point of departure for thePacific Fleet. Hollywood played animportant cultural and ideological role,raising morale among the troops andthose at home.
Heightened patriotism sometimestook on racialist expressions.Approximately 40,000 Japanese-Americans were dislocated from theirhomes and communities in LosAngeles County and moved intoinland internment camps for the dura-tion of the war. African Americanscame to occupy many of their homesin Little Tokyo. At the urging of thelocal newspaper, servicemenstationed in Los Angeles went on arampage in 1943, attacking youngLatino and African-American men,especially those dressed in the stylishzoot suits of the era.
By 1945 Los Angeles was in posi-tion to assume national and globalprominence. A steady steam offederal resources came into the areafor aerospace and missile design andproduction during the decades of the“cold war” between the US and theSoviet Union. An expanding commer-cial airline industry also utilized localtechnical expertise. The region wasable to address its population growththrough building a web of high-speedfreeways, linking suburban subdivi-sions to employment opportunities. This new trans-portation system ploughed through lower incomecommunities where the cost of acquiring right of waywas low and political opposition, primarily from African-Americans and Latinos, was weak. Boyle Heights, aprimarily Mexican-American community, lies at the heartof this network and suffered disproportionately from theeffects of residential displacement as new transporta-tion barriers erected obstacles to community life.
Much of the city’s housing stock was recorded withrestrictive racial covenants, prohibiting sale to African-Americans and sometimes other ethnic groups, Jews,Chinese, and Mexicans. This system provided theframework for enduring racial/ethnic segregation, espe-cially of the African-American community in SouthCentral Los Angeles (DeGraaf, 1970).
The infrastructure of post-World War II Los Angeleswas highly dependent on a variety of federal subsidies.Funds from the National Highway Association financedthe building of freeways, and a system of federal mort-gage insurance provided access to affordable home-
Figure 1: The Growth of the City of Los Angeles, 1781-1977
UNDERSTANDING SLUMS: Case Stud ies fo r the G loba l Repor t on Human Set t lements 2003

Urban Slums Reports: The case of Los Angeles, USA
of Los Angeles city buildings is substandard, according to thelast census… In one wooden tenement I saw a single hot-water faucet servicing some seventy-two families, a conditionoutlawed in New York City fifty years ago. (1950, p. 177)
Around this period, the City established theCommunity Redevelopment Agency (CRA/LA), dubbedby local activists, the “Chicano (Mexican-American)Removal Agency.” This new governmental entity vigor-ously began to acquire and assemble land in the down-town and adjacent areas through the power of eminentdomain for larger corporate interests. The CRA remainsthe primary mechanism for addressing “blight” in LosAngeles.
Watts, an African-American community in SouthCentral Los Angeles was the locus of civil unrest in1965 where arson and looting expressed both local andnational frustrations (see Figure 1). Los Angeles wasone of the U.S. cities that burned in the 1960s as aresult of anger at the slow progress in race relationsand the lack of equal economic opportunities. In 1970,three outbreaks in the Mexican American East LosAngeles community were met by a highly sophisticatedLos Angeles Police Department that had honed theirskills in controlling urban “riots.”
In 1973, with the end of the Vietnam War and thebeginnings of power shift to the Oil Producing andExporting Countries (OPEC), the national and globaleconomies began to shift from Western dominance.Japanese exports grew rapidly and the U.S. began toexperience heightened political and economic vulnera-bility. Population shifted from the so-called “Snowbelt”to the “Sunbelt” as old industries closed down or movedto the less unionised environs of the South andSouthwest.
Los Angeles, with its reliance on federal investmentin military contracts, has been referred to as the“Gunbelt.” The peak of these contract dollars was in1985, and federal resources began to plummet after1989 as the Cold War drew to a close. Replacing theloss in higher paying engineering jobs was growth inthe low wage sectors of clothing manufacturing andservice based industries, like tourism. This paralleledthe growing Pacific Rim migration from Latin Americaand Asia.
The largest urban uprising in U.S. history took placein Los Angeles in 1992 and was centred in the disin-vested communities identified in this research. Whilethe incipient event dealt with police brutality towards anAfrican-American man, the civil unrest was apparent inmany areas of the city that lacked employment oppor-tunities, adequate retail services, and decent affordablehousing. Participants were primarily Latino andAfrican-American and many of the victims were Koreanshop owners who were among the only retailers toinvest and serve these disinvested communities.
The migration of whites from Los Angeles intensifiedduring the period after the civil unrest; but the LosAngeles economy began to diversify and reboundduring the late 1990s. While employment rates wereup, poverty did not decline. Rather, a shift to low wagesector employment and now a steady stream of recentimmigrants to occupy these jobs appears to be a endur-ing pattern in the city. Rents have risen sharply in poorcommunities as the poor choose overcrowding ratherthan homelessness. The high level of use of these resi-dential structures increases processes of decay anddeterioration. The growth in poverty is likely to continueas well as the growth in disinvested areas over thecoming decade.
3. The Physical City The City of Los Angeles is located on the southwest-
ern coast of the United States, approximately 190 kilo-metres north of the U.S.-Mexico border. The citycovers a large geographic area, approximately 1,215square kilometres. Figure 2 shows how large LosAngeles is compared to many other U.S. cities. Thereare approximately 3,000 inhabitants per square kilome-tre in the city, ranking Los Angeles as the sixth densestcity in the U.S. The city contains three majorgeographic areas: the San Fernando Valley to thenorth, the Los Angeles basin to the middle and south,and the Santa Monica Mountains that divide the two
Figure 2: Comparative dimension of the city of Los Angeles
4
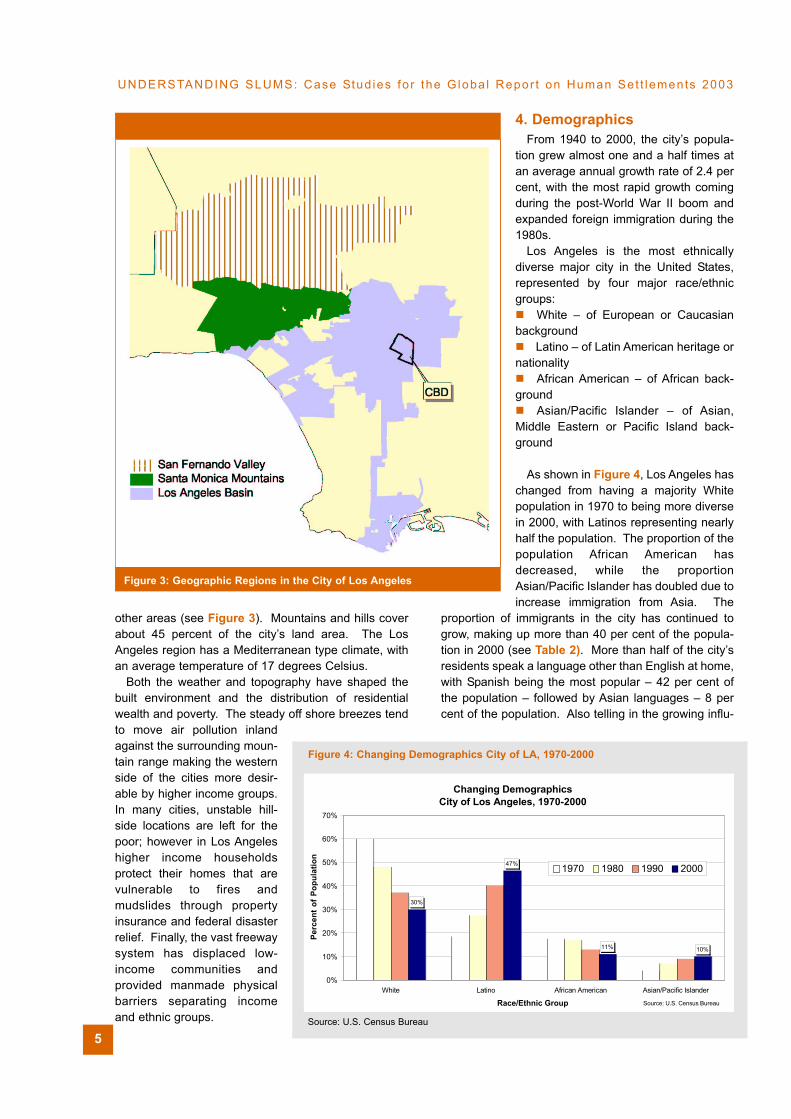
other areas (see Figure 3). Mountains and hills coverabout 45 percent of the city’s land area. The LosAngeles region has a Mediterranean type climate, withan average temperature of 17 degrees Celsius.
Both the weather and topography have shaped thebuilt environment and the distribution of residentialwealth and poverty. The steady off shore breezes tendto move air pollution inlandagainst the surrounding moun-tain range making the westernside of the cities more desir-able by higher income groups.In many cities, unstable hill-side locations are left for thepoor; however in Los Angeleshigher income householdsprotect their homes that arevulnerable to fires andmudslides through propertyinsurance and federal disasterrelief. Finally, the vast freewaysystem has displaced low-income communities andprovided manmade physicalbarriers separating incomeand ethnic groups.
4. Demographics From 1940 to 2000, the city’s popula-
tion grew almost one and a half times atan average annual growth rate of 2.4 percent, with the most rapid growth comingduring the post-World War II boom andexpanded foreign immigration during the1980s.
Los Angeles is the most ethnicallydiverse major city in the United States,represented by four major race/ethnicgroups:
White – of European or Caucasianbackground Latino – of Latin American heritage or
nationalityAfrican American – of African back-
groundAsian/Pacific Islander – of Asian,
Middle Eastern or Pacific Island back-ground
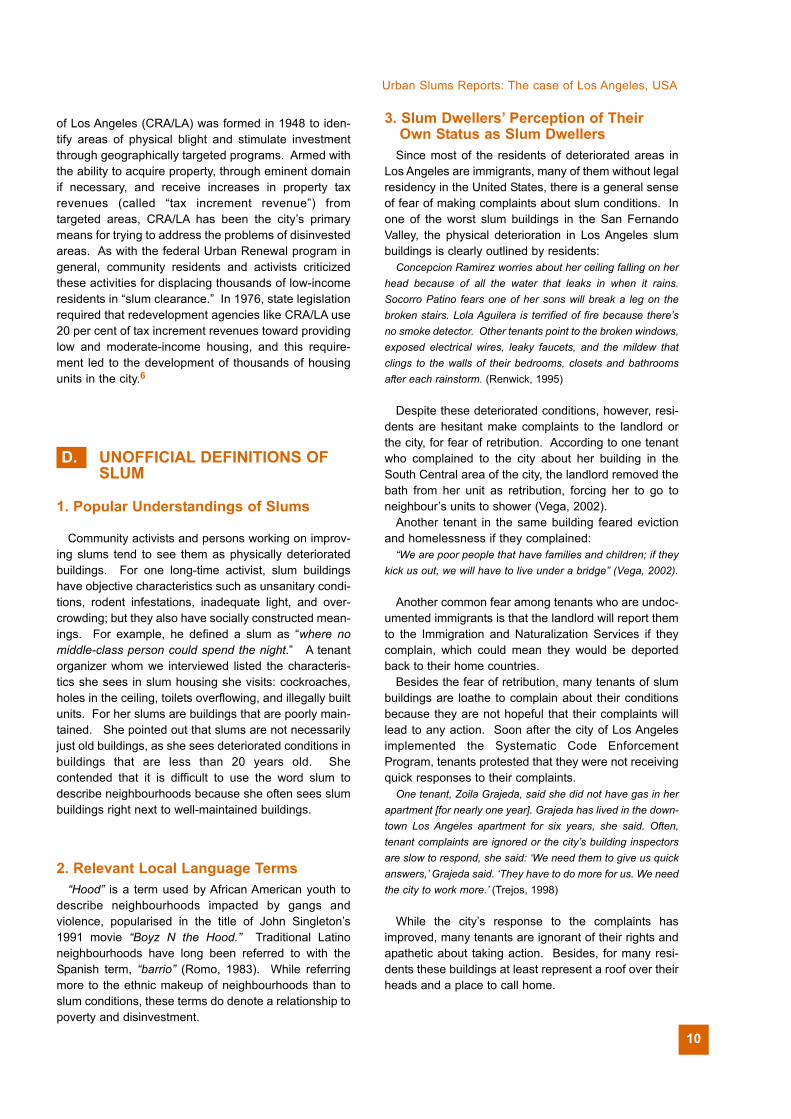
As shown in Figure 4, Los Angeles haschanged from having a majority Whitepopulation in 1970 to being more diversein 2000, with Latinos representing nearlyhalf the population. The proportion of thepopulation African American hasdecreased, while the proportionAsian/Pacific Islander has doubled due toincrease immigration from Asia. The
proportion of immigrants in the city has continued togrow, making up more than 40 per cent of the popula-tion in 2000 (see Table 2). More than half of the city’sresidents speak a language other than English at home,with Spanish being the most popular – 42 per cent ofthe population – followed by Asian languages – 8 percent of the population. Also telling in the growing influ-
Figure 3: Geographic Regions in the City of Los Angeles
5
UNDERSTANDING SLUMS: Case Stud ies fo r the G loba l Repor t on Human Set t lements 2003
Figure 4: Changing Demographics City of LA, 1970-2000
Changing Demographics City of Los Angeles, 1970-2000
30%
47%
11% 10%
0%
10%
20%
30%
40%
50%
60%
70%
White Latino African American Asian/Pacific Islander
Race/Ethnic Group
Perc
ent
of P
opul
atio
n
1970 1980 1990 2000
Source: U.S. Census Bureau
Source: U.S. Census Bureau

6
Urban Slums Reports: The case of Los Angeles, USA
ence of immigrants in Los Angeles is that the number ofnaturalized citizens has grown from 1990 to 2000,allowing these residents to vote in local, state, andfederal elections. This trend will likely continue, asLatinos, the largest immigrant group, tend to be youngerthan the other ethnic groups (see Table 3).
Los Angeles is also distinctive from many U.S. citiesin housing tenure, as the majority of its residents arerenters. Whereas 66 per cent of housing units in theUnited States – and 50 per cent of units in the nation’scentral city areas – are owner-occupied, less than 40per cent of Los Angeles households own their ownhomes. Homeownership in the city increased slightlyduring the post-World War II period, but began todecrease after 1960. With continued population growthand a decrease in new housing construction, residentswere left to compete for rental units, leading to severeovercrowding. While less than 10 per cent of housingunits in the city were overcrowded in 1960, about aquarter of all housing units in the city today are over-crowded, the majority of these being “severely over-crowded”1.
In the United States, homeownership is described as acritical component of the “American Dream,” as it repre-sents the primary means of acquiring equity and wealtheven for middle class residents and there are significanttax advantages afforded to homeowners. Renters tendto have lower incomes than owners, pay a higher propor-tion of income toward housing costs, and are more likelyto live in substandard conditions. In Los Angeles, nearlytwo-thirds of renters have annual incomes underUS$30,000, compared to less than 30 per cent of home-owners (see Table 4). About 26 per cent of renters livebelow the poverty line, compared to just 10 per cent ofhomeowners. More than half of renters in the city spendmore than 30 per cent of their income on housing,compared to less than a third of homeowners. Rentersare more likely than homeowners to live in substandardconditions, as shown by Table 5.
5. The Urban Economy The economy of Los Angeles is one of the largest and
most diverse in the United States. Los Angeles Countyis the top manufacturing area in the U.S., accounting formore than 10 per cent of the nation’s production in awide variety of sectors, and the combined Port of LosAngeles and Long Beach processes the highest volumeof port trade in the country (City of Los Angeles, 2001).The Los Angeles economy has evolved from relying onthree traditional industries – aerospace, entertainmentand tourism – to having a more diverse economic basein growing sectors such as business and managementservices, health and bio-medical services, internationaltrade, and high technology.2 The services sectoraccounts for a third of employment in the Los Angelesarea, followed by wholesale and retail trade – 22 per
Table 2: Immigrant Population, City of Los Angeles
% of Population
1990 2000
Foreign Born 38.4% 40.9%
Naturalized Citizens 9.8% 13.8%
Speak non-English Language at Home 49.9% 57.8%
Spanish 35.3% 41.7%
Asian and Pacific Island languages 7.7% 8.2%
Source: 1990 and 2000 U.S. Census, Table DP-2
Table 3: Ethnicity by Age, City of Los Angeles
Ethnic Group % under 18 years of age
Latino 35.5%
White 15.2%
African American 26.9%
Asian/Pacific Islander 17.8%
Source: 2000 U.S. Census, Table PL-4
Table 4: Household Income by Tenure, City of LA
Household Income Renter Occupied
Owner Occupied
Less than $15,000 32.1% 14.3%
$15,000 to $29,999 30.7% 14.8%
$30,000 to $49,999 20.2% 14.7%
$50,000 to $79,999 12.0% 18.6%
$80,000 or more 5.1% 37.7%
Total 100.0% 100.0%
Source: 1999 American Housing Survey for LA-Long BeachMetropolitan Area
Table 5: Substandard Housing Conditions, City of LA
Substandard Conditions RenterOccupied
OwnerOccupied
Signs of rodents in last 3 months 11.0 % 5.7%
Open cracks or holes (interior) 8.5% 5.8%
Broken plaster or peeling paint (int) 6.1% 2.8%
Severe physical problems 7.1% 1.5%
Moderate physical problems 9.5% 3.1%
Source: 1999 American Housing Survey for Los Angeles-Long BeachMetropolitan Area

cent – and manufacturing - 15 per cent (City of LosAngeles, 2001).
The economic growth as the city came out of reces-sion during the late 1990s did not extend to all parts ofthe city. Seven years after the 1992 civil unrest and inthe middle of the economic boom, there was a 37 percent decline in the numbers of jobs in the neighbour-hoods affected by the unrest despite the fact that thenumber of inhabitants was essentially unchanged(Drayse and Flaming, 2001). Countering trends in otherparts of California and the rest of the nation, medianhousehold income in the City of Los Angeles decreasedin real terms by 6 per cent during the economic expan-sion from 1990 to 2000 and the poverty rate rose by 3per cent. Researchers attribute these surprising trendsto the fact that much of the employment growth in LosAngeles during the decade was in low-skill, low-wagejobs (Hong et al., 2002). Another important economictrend in Los Angeles has been the growth of informalwork, in which a largely undocumented immigrant work-force provides goods and services outside the purviewof government regulation. Estimates of the informalsector range from 9 to 29 per cent of all jobs in the area,representing a large group of workers unprotected bylabour laws and billions of dollars in lost revenue for thestate (Cleeland, 2002).
6. Governance The framework for governance in Los Angeles can be
traced back to Progressive Era reforms during the earlytwentieth century. Civic reformers rallied around a newmunicipal progressivism, believing that it woulddecrease corruption and the politicising of governmentaladministration. Races for elected office would be “non-partisan.” The number of elected officials would be mini-mized while administrative oversight functions weretransferred to “citizen commissions” which arecomposed of those appointed by the elected officials.To prevent a concentration of power, the city’s executiveauthority was structured as a weak Mayor, who had tolargely depend on cooperation from the fifteen repre-sentatives on the City Council. These council represen-tatives have the ability to collectively reshape their elec-toral districts to conform to their desires for re-election.
The result of this governance framework has been tosupport historic power structures by elites in ways thatare not visible to the population-at-large. Minoritieshave been largely excluded from elected offices longafter they had the numerical ability to be represented,especially Latinos who challenged electoral districtingthrough the courts. Given the necessity for raisingsubstantial funds to run an effective campaign in largedistricts, real estate developers and powerful businessgroups continue to have the political upper hand.
The City of Los Angeles is embedded within theCounty of Los Angeles, where five elected representa-
tives are responsible for addressing the needs of apopulation that currently exceeds 9 million persons. TheCounty is the administrative centre for services thatassist the poor, general relief, health coverage, supportfor the disabled.
In the late 1990s a “Charter Reform” initiative gainedground in an attempt to create an approach to gover-nance with more accountability and opportunities forparticipation. The position of Mayor was strengthenedso that Department heads now serve at the executive’sdiscretion. A new addition is the establishment of“neighbourhood councils” that are to encourage moredirect participation by community residents. However,for many in the city, such reforms are seen as “too little,too late.” A secession movement has gripped the city,with the San Fernando Valley, the harbour area andHollywood each taking steps to establish separatemunicipal autonomy.
Finally, while the trends with regard to greater voterregistration and participation by immigrants fromMexico, Latin America, and Asia is encouraging, asizable section of the Los Angeles population are stillunable to participate in elections. These are often resi-dents who are in the city without documentation, whohave not met the requirements for naturalisation, or whochoose to keep their status as foreign national ratherthan sacrifice their original citizenship. Many of theseare families with children in the school system andpeople who are very dependent on the effective deliveryof public services.
II. SLUMS AND POVERTY
B. TYPES OF SLUMS
1. Types
Slums in Los Angeles exist both as individual build-ings and as neighbourhoods. Disinvested buildings aredeteriorated physically and may in some cases belocated next to buildings that are well maintained. Forthe purpose of this report, however, we focus on disin-vested neighbourhoods, which share the following char-acteristics: (1) deteriorated physical housing conditions;(2) low levels of resident income; and (3) low levels ofprivate investment and property maintenance.3
Figure 5 shows where property tax delinquency ishighest.4 While not all of the buildings in these neigh-bourhoods are necessarily slum buildings, these areareas with low levels of resident income, private invest-ment and property maintenance, meaning that they arethe areas with the most likelihood for containing slums.The particular urban form of these areas, namely thedensity of units and size of buildings, has implications
UNDERSTANDING SLUMS: Case Stud ies fo r the G loba l Repor t on Human Set t lements 2003
7

for the type of interventions that can be applied to alle-viate slum conditions. Therefore, we have defined fivetypes of disinvested neighbourhoods in Los Angeles:5
Low-density Disinvested Areas: Neighbour-hoodswith primarily single-family and duplex housing (1-2units) Mid-density Disinvested Areas: Neighbourhoodswith primarily mid-density housing (3-19 units) High-density Disinvested Areas: Neighbour-hoodswith primarily multifamily housing (20 units or more) High-density (Skid Row): A 50 block area in theEastern part of Los Angeles’s central businessdistrict that has a high level of homeless residentsand single-room occupancy hotels. Mixed-density Disinvested Areas: Neighbour-hoods in which neither high, mid and low-densitybuildings are dominant
2. Location and AgeThis typology is useful because these disinvested
areas exhibit some differences in the nature of the livingconditions and may require different remedies as well.
Urban Slums Reports: The case of Los Angeles, USA
High-density disinvested areas tend tohave the city’s oldest (pre 1930s), tene-ment-style housing stock, often of brickconstruction with poor light and air circu-lation. These neighbourhoods tend tobe located near the central part of thecity, just to the west of the CBD (seeFigure 6). Mid-density disinvestedareas contain mostly post-World War IImultifamily dwellings that face problemsof shoddy construction and deferredmaintenance. These neighbourhoodsare concentrated to the west of the CBD,with scatterings in the each section ofthe city. Low-density disinvested areasfrequently are marked by informal hous-ing units, such as converted garages,makeshift additions, and other residentattempts to expand liveable space at thelowest cost. In line with the preferencefor single-family housing in Los Angeles,this disinvestment neighbourhood typeis the largest, especially in the southcentral and eastern parts of the city.Land ownership in such low densityareas tend to be highly fragmented,making it difficult to assemble propertiesfor comprehensive redevelopment.Mixed-density neighbourhoods show acombination of these building/propertytypes within their environs and are scat-tered throughout the city.
3. Population Size and CharacteristicsDisinvested neighbourhoods, as defined in this report,
encompass approximately 20 per cent of the area of theCity of Los Angeles and are home to about 43 per centof the city’s population (see Table 6). All of the disin-vested areas have higher population densities than the
8
Table 6: Population of Disinvested Areas, City of LosAngeles
Source: 2000 U.S. Census
Type of DisinvestedNeighbourhood Population Persons per
square km.% of City’sPopulation
Low-Density 690,406 5,787 18.7%
Mid-Density 302,425 6,698 8.2%
High-Density 229,543 11,312 6.2%
High-Density (Skid Row) 3,477 6,181 0.1%
Mixed-Density 356,302 6,181 9.6%
TOTAL 1,582,153 5,925 42.8%
Figure 5: Tax Delinquency, City of Los Angeles, 2001

UNDERSTANDING SLUMS: Case Stud ies fo r the G loba l Repor t on Human Set t lements 2003
Figure 6: Disinvested Neighbourhoods, City of LA
Table 7: Gender and Age in Disinvested Areas, City of
Source: 2000 U.S. Census
Type of Disinvested
Neighbourhood
% Population
Female
%Population Under18 years of Age
Low-Density 50.8% 35.2%
Mid-Density 50.7% 32.2%
High-Density 46.8% 25.9%
High-Density (SkidRow) 37.2% 8.7%
Mixed-Density 49.5% 29.4%
TOTAL 49.9% 31.9%
Table 8: Ethnicity in Disinvested Areas, City of LA
Type ofDisinvested
NeighbourhoodLatino White African
AmericanAsian/Pacific
Islander
Low-Density 68.2% 3.1% 24.2% 3.2%
Mid-Density 65.6% 7.0% 17.9% 7.4%
High-Density 59.3% 13.9% 6.5% 18.0%
High-Density(Skid Row) 24.2% 24.2% 32.8% 29.7%
Mixed-Density 61.8% 14.5% 9.8% 11.1%
TOTAL 64.9% 8.0% 17.2% 8.0%
Source: 2000 U.S. CensusNote: Figures for each neighbourhood type do not total 100% becausesmall proportions of the population were “other” or “multi-race.”
9
citywide average of 3,000 persons per square km, and,not surprisingly, high-density areas have the mostpersons per square km. Nearly half of the residents ofslum neighbourhoods live in low-density areas, reflect-ing the high proportion of single-family dwellings in thecity. In most of the slum neighbourhood types, thegender breakdown and age of residents is similar tothat in the city as a whole. In Skid Row, however, lessthan 30 per cent of the residents are female and lessthan 10 per cent of residents are under the age of 18,reflecting a high number of homeless male adult resi-dents (see Table 7).
Compared to the ethnicity breakdown for the city asa whole, Latinos and African Americans are over repre-sented in slum neighbourhoods, while Asians areslightly under-represented and Whites are notablyunder represented (see Table 8). Overall, nearly twothirds of slum neighbourhood residents are Latino,compared to only a quarter of Skid Row residents.African Americans are the most common ethnic group inSkid Row, and about a quarter of residents of low-density slum neighbourhoods are African American,reflecting their historic presence in South Central LosAngeles. While Asians do not encompass much of thepopulation in low and mid-density slum areas, they areover represented in high-density slum areas, likely dueto their concentration in high-density areas such asKoreatown and Hollywood. Asians are also over repre-sented in Skid Row, probably due to this areas proxim-ity to the Little Tokyo neighbourhood.
C. OFFICIAL DEFINITIONS OF SLUMS
1. Definitions and Their Predominant Use
Official use of the word “slum” to describe deterio-rated housing conditions in the City of Los Angeles hasgenerally been used in reference to disinvested build-ings, not neighbourhoods. For example, the City has aSlum Housing Abatement Task Force that is chargedwith documenting buildings with the most egregioushousing code and health and safety violations and pros-ecuting their owners. In 1997, the “Blue RibbonCitizens’ Committee on Slum Housing” formed toaddress worsening housing conditions in the city, result-ing in a major reform in the city’s code enforcementefforts. In general, however, the city has not officiallyused the term “slum.”
Probably the most important official terminology usedto describe neighbourhoods with deteriorated physicaland social conditions is “blight.” In line with UrbanRenewal policies encouraged by the U.S. federalgovernment, the Community Redevelopment Agency
of Los Angeles (CRA/LA) was formed in 1948 to iden-tify areas of physical blight and stimulate investmentthrough geographically targeted programs. Armed withthe ability to acquire property, through eminent domainif necessary, and receive increases in property taxrevenues (called “tax increment revenue”) fromtargeted areas, CRA/LA has been the city’s primarymeans for trying to address the problems of disinvestedareas. As with the federal Urban Renewal program ingeneral, community residents and activists criticizedthese activities for displacing thousands of low-incomeresidents in “slum clearance.” In 1976, state legislationrequired that redevelopment agencies like CRA/LA use20 per cent of tax increment revenues toward providinglow and moderate-income housing, and this require-ment led to the development of thousands of housingunits in the city.6
D. UNOFFICIAL DEFINITIONS OF SLUM
1. Popular Understandings of Slums
Community activists and persons working on improv-ing slums tend to see them as physically deterioratedbuildings. For one long-time activist, slum buildingshave objective characteristics such as unsanitary condi-tions, rodent infestations, inadequate light, and over-crowding; but they also have socially constructed mean-ings. For example, he defined a slum as “where nomiddle-class person could spend the night.” A tenantorganizer whom we interviewed listed the characteris-tics she sees in slum housing she visits: cockroaches,holes in the ceiling, toilets overflowing, and illegally builtunits. For her slums are buildings that are poorly main-tained. She pointed out that slums are not necessarilyjust old buildings, as she sees deteriorated conditions inbuildings that are less than 20 years old. Shecontended that it is difficult to use the word slum todescribe neighbourhoods because she often sees slumbuildings right next to well-maintained buildings.
2. Relevant Local Language Terms“Hood” is a term used by African American youth to
describe neighbourhoods impacted by gangs andviolence, popularised in the title of John Singleton’s1991 movie “Boyz N the Hood.” Traditional Latinoneighbourhoods have long been referred to with theSpanish term, “barrio” (Romo, 1983). While referringmore to the ethnic makeup of neighbourhoods than toslum conditions, these terms do denote a relationship topoverty and disinvestment.
Urban Slums Reports: The case of Los Angeles, USA
3. Slum Dwellers’ Perception of Their Own Status as Slum Dwellers
Since most of the residents of deteriorated areas inLos Angeles are immigrants, many of them without legalresidency in the United States, there is a general senseof fear of making complaints about slum conditions. Inone of the worst slum buildings in the San FernandoValley, the physical deterioration in Los Angeles slumbuildings is clearly outlined by residents:
Concepcion Ramirez worries about her ceiling falling on herhead because of all the water that leaks in when it rains.Socorro Patino fears one of her sons will break a leg on thebroken stairs. Lola Aguilera is terrified of fire because there’sno smoke detector. Other tenants point to the broken windows,exposed electrical wires, leaky faucets, and the mildew thatclings to the walls of their bedrooms, closets and bathroomsafter each rainstorm. (Renwick, 1995)
Despite these deteriorated conditions, however, resi-dents are hesitant make complaints to the landlord orthe city, for fear of retribution. According to one tenantwho complained to the city about her building in theSouth Central area of the city, the landlord removed thebath from her unit as retribution, forcing her to go toneighbour’s units to shower (Vega, 2002).
Another tenant in the same building feared evictionand homelessness if they complained:
“We are poor people that have families and children; if theykick us out, we will have to live under a bridge” (Vega, 2002).
Another common fear among tenants who are undoc-umented immigrants is that the landlord will report themto the Immigration and Naturalization Services if theycomplain, which could mean they would be deportedback to their home countries.
Besides the fear of retribution, many tenants of slumbuildings are loathe to complain about their conditionsbecause they are not hopeful that their complaints willlead to any action. Soon after the city of Los Angelesimplemented the Systematic Code EnforcementProgram, tenants protested that they were not receivingquick responses to their complaints.
One tenant, Zoila Grajeda, said she did not have gas in herapartment [for nearly one year]. Grajeda has lived in the down-town Los Angeles apartment for six years, she said. Often,tenant complaints are ignored or the city’s building inspectorsare slow to respond, she said: ‘We need them to give us quickanswers,’ Grajeda said. ‘They have to do more for us. We needthe city to work more.’ (Trejos, 1998)
While the city’s response to the complaints hasimproved, many tenants are ignorant of their rights andapathetic about taking action. Besides, for many resi-dents these buildings at least represent a roof over theirheads and a place to call home.
10

According to one tenant of the San Fernando Valleyslum building:
We just want to stay here and have them fix what’s here. Formany of us, this is all we know as home and we don’t want toleave. But we do want things to change. (Renwick, 1995)
E. OFFICIAL DEFINITIONS OF POVERTY
1. Definitions and Their PredominantUseThe U.S. Census Bureau, based on methodology
developed in the 1960s, sets the official threshold forpoverty in the United States. This methodology deter-mines the market value of a basic nutritional diet andthen, assuming that food should represent a third ofhousehold income, multiplies that figure by three todetermine the poverty threshold. The current methodol-ogy also accounts for the number of adults and childrenin households and is adjusted annually to account forinflation. The threshold for a family of four in 2000 wasUS$17,463. According to the U.S. Census Bureau’sCurrent Population Survey, 11 per cent of the nation’spopulation was poor in 2000.
2. Changes to Definitions Over TimeThe methodology for determining the official poverty
threshold in the U.S. has not been changed since it wasdeveloped almost forty years ago. This methodology,however, has come under considerable criticism (seethe next section).
F. UNOFFICIAL DEFINITIONS OF POVERTY
1. Popular Understandings of Poverty
Researchers and advocates have criticized the officialdefinition of poverty for several reasons. First, it doesnot account for the fact that today food does not repre-sent a third of costs for low-income families, as costs forchild care, housing, and health care have increasedmore quickly than the cost of food. A national group ofresearchers using an alternative methodology account-ing for food, housing and clothing costs found that thepoverty rate would be 25 per cent greater using thismethodology (Citro and Michael, 1995). The officialmethodology has also been criticized for not reflectingregional differences within the U.S., which impacts bothincome and costs of living. Some analysts prefer tomeasure poverty relative to incomes in the region, for
example as half the median family income for that area.In a state like California where living costs are relativelyhigh, the poverty threshold using this methodologywould be US$26,347, almost double the official povertyline (Reed and Van Swearingen, 2001). Othersconstruct family budgets using local data on the cost ofliving to calculate poverty thresholds. LAANE, a LosAngeles-based advocacy and research centre,proposes a “Needs-Based Poverty Level” at 200 percent of the federal poverty level, which would beapproximately US$33,000 in 1998 for a family of four(More et al., 2000).
According to a recent national poll, the popularperception of residents of the U.S. corresponds to thesealternative measures of poverty. The poll revealed thatalmost 70 per cent of residents felt that a family of fourrequires a household income of US$35,000 to survive,while 92 per cent said that it would require at leastUS$25,000.7 A long-time advocate for the poor in LosAngeles whom we interviewed provided an interestingdefinition of poverty: “lacking the necessary resourcesto have the opportunities that most people take forgranted.”
2. The Poor’s Perception of their Own Poverty
See sections D and J.
G. THE ORIGINS OF THE TYPES OF SLUM IDENTIFIED
1. Social, Economic and Political Forces that have Formed and Removed Slums, by Type
Structural changes have exacerbated the problem ofcommunity disinvestment in Los Angeles: globalisation,international migration, and de-industrialisation.Globalisation has affected both urban and ruraleconomies in nations along the Pacific Rim. Throughuse of new technologies linked to mass-based farming,many traditional agricultural communities now struggleto meet their subsistence needs and have fewer marketopportunities. Migration to urban centres in thesenations has occurred even when employment opportu-nities are insufficient to meet the rising number of inter-nal jobseekers. Globalisation has also meant the world-wide distribution of images of American life through theHollywood “dream machine”.
Seeking to improve their lives, both documented andundocumented immigrants frequently see Los Angelesas the port of entry to the resources and opportunities ofthe U.S. These newcomers arrive to the largest metro-politan area on the Western edge of the continent and
UNDERSTANDING SLUMS: Case Stud ies fo r the G loba l Repor t on Human Set t lements 2003
11

quickly discover that few opportunities are available forhousing that they can afford. They must quickly secureemployment in either the informal economy or, if theyare fortunate, minimum wage jobs. Informal sector jobsinclude work as street vendors and day labourers,including under-paid domestic work in higher incomeareas. For those who have family or friends in LosAngeles, their first home is often a deteriorated flat inover-crowded conditions as they seek to establish afoothold. Those without such contacts may be home-less or share accommodations with those they meet inthe informal sector.
Many communities in Los Angeles, most notably PicoUnion/Westlake have served as point of entry, providingopportunities for immigrant economic and social mobil-ity. However, as the shortage of housing increases resi-dential costs, immigrants quickly discover that they areunlikely to easily leave the dense, overcrowded condi-tions in the poorest neighbourhoods. Moreover, whileearlier migrants to the area found employment in majorindustries with union agreements, or at minimum, jobladders. Because of the de-industrialisation of LosAngeles, newcomers are fortunate to secure dead-endlow-wage jobs in janitorial work, hotel and restaurantservices, the garment industries, and other forms oflight manufacturing.
Groups of these workers may share overcrowdeddwellings together, so that they can move from family-based locations. Private rental owners often know thatthey can exploit the housing needs of undocumentedmigrants who fear legal intervention. These residentsalso do not have access to any public housing subsi-dies. They congregate in the low rent housing areas ofthe city, as conditions worsen through both over-utilisa-tion of the flats and inadequate code enforcement.
The low density of dwellings in the city makes thedevelopment of good mass transit solutions difficult,inhibiting access to employment by the poor, who areless likely to own automobiles. Moreover, without suchtransportation systems, communities fight against rede-velopment that increases density, auto traffic, pollutionetc. As some neighbourhoods decline economicallyand physically, marginal communities try to establishbarriers against the spread of low cost housing, furtherexacerbating the lack of sufficient decent affordablealternatives. Many neighbourhoods are concerned thatany form of rental housing will bring in lower incomegroups, crime, and thereby decrease local propertyvalues. The term “NIMBY”—Not In My Back Yard—isoften applied to such sentiments.
While workers from Latin America and Asia areprimary occupants in older, high-density, tenementhousing stock, unemployed persons with psychiatricdisabilities including substance abuse are also repre-sented especially in the high-rise buildings in the SkidRow area. Many of the single-family dwellings in SouthCentral, the Eastside and the northeast part of the San
Urban Slums Reports: The case of Los Angeles, USA
Fernando Valley have absentee owners; however,some indicators suggest a rising number of acquisitionsby Latino owner occupants. Many of the immigrants asthey become stabilized, bring entrepreneurial skills anda desire for property ownership into these disinvestedareas. Most will require some form of governmentalassistance if they are to acquire these properties suchas low payment subordinated loans from governmentagencies. The City Council has sought to avoid theissue of “garage housing” and the construction of livingspace built without permits because these activitieswhile producing substandard dwellings have addressedunmet housing needs.
Much of the mid-density disinvested housing, espe-cially in the San Fernando Valley, is located on commer-cial corridors and has escaped public attention unlessthe outside facades are visibly deteriorated. Sincedeferred maintenance is often the problem in theseareas, the Systematic Code Enforcement Program willhopefully encourage owners to make necessary repairs(see section O.)
Historically, “slum removal” has largely been carriedout through large public infrastructure projects such asfreeway development or the establishment of redevel-opment areas that enable the government to acquireproperties by eminent domain. In such instances, thedisinvested areas are removed but the poor face signif-icant additional social costs, struggling to relocate intoother nearby communities.
2. The Social, Political and Economic Advantages of the Slums to the City
The primary advantage of disinvested areas to thecity is that they concentrate households in poverty,segregating this segment of society away from middleand upper class communities (Davis, 1992). First, thisprocess of segregation enables the city to focus moreefficiently its various policing functions, including thesocial agencies that manage the poor and, of course,those involved with controlling criminal behaviour. TheLos Angeles Police Department is notorious for havingtwo faces to the public: one of protection for affluentneighbourhoods and one of retribution for poor and low-income areas.
12

H. DATA AVAILABLE ON THE CITY’S SLUM
1. Maps
Figure 7 shows both the Disinvested Areas we havecalculated (i.e. "unofficial slums") and CRA Project Areasand Empowerment Zones (i.e. "official slums"; Note:empowerment zones are explained in section N.2.)
2. Census DataAbout half of the residential structures in all slum
areas in the city are low-density (1 or 2 units), matchingthat in the city as a whole. Obviously, the prevalence of1 or 2-unit buildings varies along slum neighbourhoodtype, ranging from more than 70 per cent in low-densityslum neighbourhoods to less than 7 per cent in high-density slum areas and Skid Row (see Table 9). Thevast majority of residents in slum areas are renters,more than three quarters in all neighbourhood typesexcept for low-density. This is not surprising given thehigh cost of real estate in Los Angeles. Even in low-
One will likely find a higher level of public service (e.g.tree trimming, road improvements) outside of the disin-vested areas than within them. Moreover, in exchangefor the right to build, private developers in Los Angelesare often required to upgrade adjacent public infrastruc-ture — water and sewer connections, alleyways, etc.Since development is concentrated in wealthier areas,so too are corresponding improvements in transporta-tion, public utilities and other municipal systems.
Because disinvested areas are seen as having crime,poor educational opportunities, and lacking in services,homebuyers and renters with sufficient resources seekhousing in other areas. Moving into better neighbour-hoods often entails the payment of a premium. Suchprocesses increase speculation and profit taking inwealthier areas. A separate market has developedaround properties in the disinvested areas wherelenders charge higher rates if they lend, and whereowners extract profit on properties that are occupied bythose with the fewest choices.
UNDERSTANDING SLUMS: Case Stud ies fo r the G loba l Repor t on Human Set t lements 2003
Figure 7: Disinvested Neighbourhoods (i.e.
“unofficial slums”) and CRA ProjectAreas and Empowerment Zones
(i.e. “official slums”; City of LA
13

density slum neighbourhoods, where the potential forhomeownership should be the greatest, only a third ofunits are owner-occupied.
I. DATA AVAILABLE ON POVERTYIN THE CITY
1. Maps
Figure 8 shows the distribution of income across theCity of Los Angeles, according to 1999 estimates (note:2000 census data on poverty and income will be avail-able in September 2002). The map illustrates that resi-dents in the central and southern regions of the city, aswell as in pockets of the San Fernando Valley, tend tobe low-income, in line with the maps of the disinvestedneighbourhood types.
2. Census DataAccording to the 2000 U.S. Census, 22 per cent of
the population and 18 per cent of families in the City ofLos Angeles live below the federal poverty threshold.These rates are much higher than the state of Californiaas a whole, where 14 per cent of the population 11 percent of families are poor. While in many parts of theU.S. poverty has decreased over the past decade, thenumber of poor residents in Los Angeles increased by24 per cent from 1990 to 2000. (see Table 10)
Poverty in Los Angeles is especially acute amongfemale-headed households, children, and immigrants.The poverty rate for female-headed households isalmost double that for all families. More than 30 percent of all children in the city are poor, and more than40 per cent of children in female-headed householdslive below the poverty line. Although Latinos make upless than half of the total population, more than two-thirds of the poor in Los Angeles County are Latino,many of them recent immigrants.8 Using an alternativedefinition of the poverty threshold, researchers from aLos Angeles-based research centre estimated that over43 per cent of people in Los Angeles County were poorin the late 1990s and that Latino workers are five-and-a-half times more likely to be poor than white workers(More et al., 2000, pp. 10, 19).
Urban Slums Reports: The case of Los Angeles, USA
Type of DisinvestedNeighbourhood
Residential Buildings
% 1 or 2 units % Renter Occupied
Low-Density 71.9% 62.2%
Mid-Density 27.1% 85.5%
High-Density 6.8% 92.8%
High-Density (Skid Row) 0.8% 90.1%
Mixed-Density 28.4% 83.8%
TOTAL 50.7% 77.4%
Table 9. Units in Structure and Renter Occupancy inDisinvested Areas, City of Los Angeles
Source: 1990 and 2000 U.S. Census
Table 10. Poverty in the City of Los Angeles, 2000
%Poor
Persons 22.1%
Children under 18 years 30.3%
All Families 18.3%
With related children under 18 25.3%
Families with female householder 32.7%
With related children under 18 42.2%
Source: 2000 U.S. Census, Table DP-3
Figure 8: Household Income, City of LA
14

III. SLUMS: THE PEOPLE
J. WHO LIVES IN SLUMS? 1. Short Stories and Key Events in Lives
of Typical Slum Households, IncludingFemale-Headed
Residents of disinvested areas in Los Angeles areoverwhelmingly Latino, and many are immigrants.Coming to the United States in hopes of greater oppor-tunities for work and education for their children, theyoften find they must work endless hours just to pay rentand other costs. Because wages are low and housingcosts high, they often depend on social networks to finda place to live. As explained by a Latino garmentworker, this often means overcrowding into units withothers:
Most sewing machine workers live together. We eithershare an apartment or a house. That is the only way we canmake ends meet. We have to help each other out. Forinstance, I am currently living with another family. It’s the onlyway I can provide for my family. (More et al., 2000, p. 5)
Immigrant workers also often end up being sociallyisolated beyond their immediate living and work envi-ronment, as explained by a female Korean immigrant:
“We are like a squirrel in a cage, having to run in a treadmill.This is how I see the immigrant workers – not knowing what’savailable for them outside this cage, what the outside world islike…..When we work from dusk to dawn, speaking onlyKorean, we have no time to develop skills, like learningEnglish, and we don’t know the laws or our rights.” (More etal., 2000, p. 26)
2. Aspirations, Plans and the Barriers to their Fulfilment
Many residents of disinvested neighbourhoods aspireto take advantage of the many benefits of homeowner-ship in the U.S. and participate in “the AmericanDream.” Long-term mortgages and many governmentand lending programs designed to encourage home-ownership among low-income residents make it possi-ble for some to purchase homes and build equity.However, achieving this dream is especially difficult inLos Angeles, where real estate is among the mostexpensive in the nation. The divide between dreamsand reality is articulated by a Latino garment worker:
Most people think they will work for two or three years, thensave enough to buy a piece of land and build a house. But thatusually never happens. Their hopes and dreams are shat-tered. (More et al., 2000, p. 20)
Poor residents also hope to secure well-paying workso that they can improve their living situations. Much ofthe employment growth during the 1990s was in low-paying service jobs, however, forcing the working poor
to have multiple jobs and long hours. A service workerat the Los Angeles Airport describes the challenges shefaces, as housing consumes about half of her monthlyincome:
“As a single mother earning minimum wage, I had to make alot of choices. I got my [bimonthly] check for four hundredthirty-some dollars and my rent is four twenty-five. With onecheck I would pay for rent, and with the other I had to pay mybills. Sometimes I would have to ask my landlord if I could owefifty dollars until the end of the month because I had to pay formy son’s school.” (More et al., 2000, p. 12)
K. THE HOUSEHOLE INDICATORS FOR WOMEN-HEADED AND OTHER HOUSEHOLDS
1. Household Types and their Percentage
More than two-thirds of households in disinvestedneighbourhoods are families, and 40 per cent aremarried families. Not surprisingly, the Skid Row neigh-bourhood has the lowest proportions of families andmarried families, while the low-density type has thehighest. (see Table 11)
2. Income As shown in Table 12, half of households in disin-
vested areas have annual incomes of less thanUS$25,000 and almost 80 percent have incomes lessthan US$50,000. Higher density areas tend to bepoorer than lower density areas.
3. Household SizeAs shown in Table 11, there are on average 3 persons
per household in disinvested areas. Households in low-
UNDERSTANDING SLUMS: Case Stud ies fo r the G loba l Repor t on Human Set t lements 2003
Table 11: Household Characteristics in DisinvestedAreas, City of Los Angeles
Type ofDisinvested
Neighbourhood
Personsper
household
% ofHouseholds
that areFamilies
% ofHouseholds
that are MarriedFamilies
Low-Density 3.76 76.8% 43.7%
Mid-DensitY 3.25 69.4% 38.5%
High-Density 2.79 54.3% 33.3%
High-Density(Skid Row) 2.94 18.0% 13.4%
Mixed-Density 3.07 64.1% 38.6%
TOTAL 3.32 68.2% 39.5%
Source: 2000 U.S. Census
15

density neighbourhoods tend to be larger than those inhigh-density neighbourhoods, reflecting the fact thatlow-density buildings tend to be larger than high-densityapartment buildings.
4. Occupancy ratios As shown in Table 11, there are 3.32 persons for
every household in all the disinvested areas. This isgreater than the citywide figure of 2.89. High-densityareas have the highest mean persons per householdamong disinvested neighbourhood types, while low-density have the highest.
L. COSTS OF LIVING IN SLUMS
1. Rental Rates
While the majority of rental units in the City of LosAngeles are under the Rent Stabilization Ordinance(RSO), which restricts the amount that rents can beincreased each year, tenant organizers told us thatmany owners raise rents in excess of these controls.Many times this is due to ignorance of the RSO restric-tions, but sometimes owners do this because they knowthat tenants’ options are limited and are not like tocomplain to the city.
2. Availability of housing financeResidents of disinvested areas have less access to
traditional banking and lending services. As shown inFigure 9, bank branches in the city tend to be locatedoutside of disinvested areas, except for those in andnear the CBD. The lack of banking services is espe-
Urban Slums Reports: The case of Los Angeles, USA
cially stark in the low-density disinvested neighbour-hoods in South Central Los Angeles. Without readyaccess to traditional lending service, many residents ofthese neighbourhoods – especially those without legalresidency – are forced to turn to check cashers andpayday lenders – which charge exorbitant interest ratesand fees – for their small credit needs.
For larger loans, such as for housing finance, resi-dents of disinvested areas are most likely to receiveloans from high-cost “subprime” lenders (see Figure
10; see also Pitkin and Richman, 2001).Subprime lending grew rapidly during the 1990sin the U.S., allowing many people with poor credithistories to gain access to mortgage loans butalso creating higher costs and risks for theseborrowers, who tend to be ethnic minorities andlow income. In 1999, nearly 20 per cent of refi-nance loans in disinvested areas in Los Angeleswere made on the subprime market, compared toonly 10 per cent in the rest of the city.
Table 12: Household Income in Disinvested Areas, City of Los Angeles
Type ofDisinvested
Neighbourhood
<$25,000
$25,000-$50,000
$50,000-$75,000
$75,000-$100,000
>$100,000
Low-Density 49.7% 28.5% 11.5% 6.5% 3.8%
Mid-DensitY 51.4% 29.3% 10.2% 5.3% 3.9%
High-Density 56.5% 27.2% 8.5% 4.3% 3.5%
Mixed-Density 47.9% 29.3% 11.2% 6.6% 5.0%
Skid Row 82.3% 12.2% 1.9% 1.1% 2.5%
TOTAL 50.7% 28.6% 10.6% 5.9% 5.9%
Source: Geolytics 1999 estimate
Figure 9: Disinvested Areas Bank Branches, City ofLos Angeles
16

3. Psychological trauma Because of the dearth of educational and economic
opportunities in Los Angeles’s disinvested neighbour-hoods, many young people are attracted to participat-ing in youth gangs, which provide a sense of cama-raderie and power for youth with very limited lifeoptions. According to the Los Angeles PoliceDepartment, there are more than 400 gangs in the city,which commit more than 50,000 crimes every year. In2001, gangs were responsible for 3,500 felonyassaults, almost 3,000 robberies, and 346 homicides.9
4. Financial Expenditures for Typical Slum Household
As in many other cities in the U.S., residents of low-income areas in Los Angeles have less direct accessto large grocery stores and supermarkets, whichgenerally provide greater supply and cheaper pricesthan smaller grocers (Shaffer, 2002). In the mid-1990sRLA conducted a survey of residents of those areasaffected by the 1992 civil unrest, and they identifiedthe quality supermarkets as the most pressingconsumer need in the area (CSLA, 2002). Whereasthere was a supermarket for every 7,795 persons inLos Angeles County, there was one supermarket forevery 16,751 persons in neighbourhoods affected bythe 1992 civil unrest (RLA, 1995). RLA, an organiza-tion formed to spur economic recovery after the civilunrest, identified a 135-square kilometre target areafor developing more supermarkets and secured agree-ments from supermarket companies to build 30 newstores in the area. Today, however, only 18 of thesenew stores have been built, and there has been a netgain of only one supermarket in thearea (Shaffer, 2002).
5. Increased Risk ofDisplacement or EvictionBecause residents of disinvested
neighbourhoods in Los Angeles tendto live in deteriorating housing condi-tions, they are at risk of beingdisplaced or evicted. In the case ofillegal constructions, for example,they are sometimes forced to movefrom these dwellings. Moreover,slum buildings can have severestructural problems, as happened inthe collapse of a 24-unit apartmentbuilding in the Echo Park neighbour-hood in December 2000 (Hontz,2001; see Figure 11.
UNDERSTANDING SLUMS: Case Stud ies fo r the G loba l Repor t on Human Set t lements 2003
Figure 10: Subprime Refinance Lending, City of LosAngeles, 1999
Figure 11: Collapse of building in Eco-Park, December 2000
17

M. ASSETS AVAILABLE TO SLUM DWELLERS
1. Social Capital Religious institutions play an important role in building
social capital within disinvested communities. The threeprimary non-white ethnic groups – African American,Latino, and Asian – depend on churches and temples aslocations for spiritual support, information exchangeand, sometimes, collective action. Ethnic-based organ-izations, such as Mexican hometown associations orAfrican-American civil rights groups, also help build soli-darity. Sports leagues for both men and children createplaces for contacts and networking.
While Los Angeles has many powerful homeownersassociations in affluent neighbourhoods, it is difficult tofind their counterpart in disinvested areas. In addition tothe lack of resources for these efforts, lower incomeimmigrants in these areas do not see themselves ashaving full political rights and they face linguistic andcultural barriers to full participation. Efforts at cross-community tenant organizing have been largely indecline since the establishment of rent stabilization atthe end of the 1970s. ACORN, a national organizationinvolved in expanding the power of the poor, has beguna new round of issue-based organizing in poor commu-nities of Los Angeles, focusing on such issues as“predatory lending” and the status of renter securitydeposits.10
Perhaps the most encouraging sign in the develop-ment of social capital is the unionisation of low-wageworkers in Los Angeles, especially visible in the historic“Justice for Janitors” campaign. Using civil protest andpublic marches, the cause of the janitors in commercialoffice buildings received widespread support even fromwealthier communities. Similar efforts to empower serv-ice workers in the hotel and restaurant industries havefaced obstacles based on the decline in tourism in thecity after the September 11 terrorist attacks in the U.S.
2. Financial Capital Consolidation in the banking industry, supported by
the use of new information technologies, has led to asteady decline in branches of mainstream financial insti-tutions within disinvested areas. Concurrently thesecommunities witness a rise in a secondary, high-cost“credit system”, including a rapid growth in check cash-ing agencies, payday lenders, pawn shops, and retailersproviding merchandise on a “rent-to-own” basis.Increasingly, financial services appear to be bifurcatingwhere the choice for residents in disinvested communi-ties is between higher cost mainstream credit products(subprime loans) or reliance on the unregulated creditoptions available from the local storefronts.
Many immigrants send financial remittances to theirfamilies back in their home countries, rather than build-
Urban Slums Reports: The case of Los Angeles, USA
ing savings and investments for their own personaladvancement. In these international financial transac-tions, poor families often pay high transaction fees forthe electronic transfer of funds. The African-Americancommunity has over the years created its own insur-ance companies and even financial institutions thatprovide loans for both commercial and residentialdevelopment: Broadway-Federal, Founders, andFamily Savings banks. However, the power of thisgroup wanes as the percentage of the African-Americanpopulation declines. These trends point to an overallreduction in access to finance and mainstream bankingservices in disinvested communities.
3. Human Capital Immigrant communities have often brought with them
strong familial ties. Small retailers have all of the familymembers working to keep the store profitable, orcontributing to housing payments. In response, finan-cial institutions have changed underwriting standardsfor business and mortgage loans. For example, FannieMae – the largest secondary mortgage marketpurchaser – now includes the incomes of extendedfamily members such as aunts, uncles and cousins inestimating maximum household payments.Entrepreneurship in these communities takes manyforms, ranging from the informal and illegal sale of foodon the sidewalks to pooling investments and creatingethnic-based business partnerships. The greatestthreat to human capital development in these commu-nities is a largely deficient public education system withpoor facilities and under-trained teaching staff, inca-pable of significantly expanding opportunities for thenext generation. The trend is towards a decline in thedevelopment of human capital because many of theimmigrants have low levels of formal education, andinadequate access to health and education services forthemselves and for their children.
4. Physical Capital Some African-American families in the South Central
area of Los Angeles have owned their homes throughmuch of the post World War II period and are the bene-ficiaries of substantial property appreciation if they havenot heavily refinanced to pull out capital for unmetneeds. Increasingly, however, many of these single-family properties are owned by absentee landlords,rather than by new owner-occupants.
As many who dwell in disinvested areas rely onpublic transit to reach employment opportunities, a steptowards economic advancement is often associatedwith the acquisition of an automobile. Such a purchaserepresents a significant investment, and the high ratesof auto-theft in these communities place these vehicles
18

at significant risk. Since housing, the primary repositoryfor physical capital development, is increasingly unaf-fordable for lower income residents, the trend in secur-ing physical assets points downward.
5. Supportive Public Policy Since the Johnson administration’s “War on Poverty”
during the 1960s, the federal government has not madethe eradication of poverty or slums a priority. One findsa steady reduction in public assistance to the poor atevery level of government over the subsequent years.During the unprecedented national economic boom ofthe 1990s, federal “welfare reform” was instituted.These policies placed time limits on access to familysupport payments and increased requirements forparents with dependent children to enter the workforce,even at poverty level wages.
Responsibilities for the poor and upgrading disin-vested communities have devolved to local govern-ment. Recent signs are somewhat encouraging, suchas the establishment of the Systematic CodeEnforcement Program and city council approval to builda municipal housing trust fund for rehabilitation and newaffordable housing. Still, these reforms on their owncannot transform the problems of disinvested areas.Both programs face a city government in deep fiscalcrisis post September 11. While recent city actions holdsome promise, the trend in public policy does not indi-cate that the welfare of capital deprived communities isstrengthening.
IV. SLUMS AND POVERTY: THE POLICIES
N. POLICIES AND ACTIONS TAKEN TO IMPROVE SLUMS AND ALLEVIATE POVERTY
1. Locational Targeting
Federal, state and local housing and communitydevelopment programs target resources to both lowerincome areas and towards lower income households.In general, both result in similar outcomes because ofthe economic segregation of Los Angeles. For exam-ple, since most higher income communities oppose lowcost housing, all of these resources tend to be investedin communities with large low-income populations.
Approximately 70 per cent of the federal CommunityDevelopment Block Grant (CDBG) funds that areprovided to the City of Los Angeles must be used foractivities that benefit low- and moderate-income
persons. Additional activities may instead meet one ofthe following national objectives for the program:“prevention or elimination of slums or blight, communitydevelopment needs having a particular urgencybecause existing conditions pose a serious and imme-diate threat to the health or welfare of the community.”Like CDBG, federal HOME funds can support the reha-bilitation or development of affordable housing and arefrequently used in lower income communities, eventhough neighbourhood targeting is not required.11
The State of California requires the Regional Councilof Governments to develop a Regional Housing NeedsAssessment that estimates the amount of new andreplacement housing that each governmental entitymust facilitate to address unmet market demands.12
The results of this assessment are incorporated in tolocal Housing Elements of the General Plan that outlineways of preserving or expanding the existing housingstock to meet the estimated shortfall.
The State of California authorizes designatedRedevelopment Agencies to identify areas as blighted,utilize powers of eminent domain and recapture therising value of taxes within the area. This program hasbeen used to displace low-income residents for whatmunicipal leadership has determined to be redevelop-ment to “highest and best” use. A portion of theseresources, not to be less than twenty percent of the totalis to be invested in the establishment of affordablehousing. In Los Angeles, redevelopment has beenused to remove low rent housing and to build “replace-ment housing,” much of this housing has not been at thesame levels of affordability and is not monitored forcontinued occupancy by low-income households.
The centrepiece program for funding rehabilitationand new development of affordable housing are federaland state Low Income Housing Tax Credit programsthat provides returns to investors who invest equitycapital into housing that is affordable to households withincomes no greater than 60 percent of the Countymedian. Since the competition for these resources ishigh, gaining additional competitive application pointsrequires private developers to target those censustracts with a higher incidence of poverty.
The Home Mortgage Disclosure Act (HMDA) requirescertain mortgage lending institutions to report the race,gender, income, and location of loan applicants tofederal regulators. Such public disclosure enablesresearchers and community activists to track the lend-ing record of lenders and to contest banking mergerswhen one or more of the parties have not been meetingthe credit needs of the communities in which they havebeen located. These federal requirements in theCommunity Reinvestment Act (CRA) have been a vehi-cle to put pressure on private investment, especially inhome lending, to address the credit needs in under-served, typically lower income, communities.13
UNDERSTANDING SLUMS: Case Stud ies fo r the G loba l Repor t on Human Set t lements 2003
19

Urban Slums Reports: The case of Los Angeles, USA
2. Socio-Economic Targeting: Official National, Regional and City Policies and Programmes to Eradicate or Alleviate Poverty
The federal government works with selected govern-ments to establish Empowerment Zones/EnterpriseCommunities that provide a combination of targeted taxbenefits, low interest loans and some grants to supportneighbourhood revitalisation efforts. These efforts mayinclude job development, business technical assis-tance, training and education programs, and improvingaccess to childcare, healthcare and public transporta-tion to promote economic and social improvements.The Los Angeles Empowerment Zone is linked as wellto a California State Enterprise Zone and the City of LosAngeles Tax Free Zone, covering approximately 50square kilometres throughout the city.
The most notable program from the EmpowermentZone (EZ) has been the establishment of the LosAngeles Community Development Bank that is widelyviewed as a failure, as it has been largely unsuccessfulin creating new jobs in the areas affected by the civilunrest.14 The Bank was created to provide access tocapital to business and other economic development inventures that the private sector did not want to support.Large investments that were made are in manyinstances unlikely to achieve full cost recovery.
Low-income families may be eligible for directeconomic support from a variety of federal, state andlocal programs. These include: SSI (SupplementalSecurity Income) for persons with disabilities; TANF(Temporary Assistance for Needy Families); GeneralRelief, support for indigent individuals and households;Medicaid, health coverage for the poor; Food Stamps,to supplement household resources for nutrition;Section 8 housing allowances, rent subsidies that coveronly about one third of eligible renter households.
3. Non-Governmental InterventionsThere are various types of NGOs that have a role in
addressing the slum housing issue: Those that work onthe consumer-side of the problem—organise renters,address poverty issues through advocating for incomesupports and help persons with physical and psycholog-ical disabiliities, including substance abuse. Those whoproduce housing are either countywide or regional non-profit developers or community development corpora-tions that have local residents on their board of directors.
Three tenant organizing groups in Los Angeles seekto address slum housing: Inquilinos Unidos, theCoalition for Economic Survival and ACORN. Theirwork ranges from advocacy and legal support to anemphasis on expanding tenant rights to affordable anddecent living conditions through public policy changes.
Shelter Partnership Inc. and the L.A. Coalition toStop Hunger and Homelessness focus on the needsof the very poorest residents in Los Angeles, those thatare homeless or at a risk of homelessness. Theapproaches used include public education, technicalassistance, public policy analysis, community actionand advocacy.
The Centres for Independent Living seek toaddress the needs of persons with disabilities who areoften among the most vulnerable of low-income groups.They work on increasing accessibility to decent andaffordable housing, employment and necessary serv-ices. Many other groups work on the needs of thehomeless and those with multiple diagnoses, includingHIV, substance abuse, and severe mental illness.
The Southern California Association for Non-Profit Housing (SCANPH) is the trade association foraffordable housing producers. Many in the membershipare involved in rehabilitating substandard housing or inbuilding new subsidised dwellings in lower incomecommunities. SCANPH has also been at the forefront ofrecent housing advocacy campaigns, such as theestablishment of the $100 Housing Trust Fund in theCity of Los Angeles (Dreier and Candaele, 2002).
Los Angeles has few community development corpora-tions that fit the model that has been dominant in easternand mid-western U.S. cities. The affordable housingmovement was slow to take root in Los Angeles andfound a home much faster in San Francisco where theCDC movement resembles more closely its easterncounterparts. First, L.A. has a long ignoble history oftreating affordable housing as a leftist threat to free-enter-prise, e.g. the Chavez Ravine public housing project thatbecame linked to the Red Scare in the late 1950s.Moreover, as we have noted, the scale of Los Angeles,the recent arrival of its residents, and their residentialmobility makes it difficult to sustain the kind of communityorganising efforts that one finds in east coast cities.
The non-profit housing organisations in LA are morelikely to have a professional board and a focus on tech-nical aspects of housing finance and packaging, andless likely to have an ongoing community building focus.In part, this emerges from the real economic challengesof building affordable housing when land costs areamong the highest in the nation, and incomes of manyfamilies, especially immigrants, among the very lowest.In the east coast one finds in cities like Clevelandcommunity development corporations that assume adiversified portfolio of activities, serving both moderateand low income households. In part, these groups canundertake this range of housing activities because landcosts are so low due to residential abandonment thatthey can build dwellings without deep public subsidies.This is not the case in Los Angeles where it is difficult toproduce a new or rehabilitated dwelling unit for lessthan $120,000 in any neighbourhood.
20

Finally, when political leadership has been mostneeded in L.A., it has been most absent. On the eastcoast one can find enlightened corporate leaders whoview their industries as reliant on a well-housed work-force. In such instances, such leaders have supportedand invested in philanthropic, community developmentactivities as far back as the settlement house era at theturn of the twentieth century. In Los Angeles where thedominant industry is media and entertainment, few lead-ers have emerged with the same breadth of vision.Rather, the media titans are primarily interested inWashington D.C. where issues of censorship, copyrightcontrol and global marketing are addressed. Moreover,just as the non-profit housing movement was taking rootin Los Angeles in the early 1990s, Richard Riordan waselected Mayor and he quickly became a key opponentto growth in the CDC sector. He drained the city’s hous-ing resources, shifting them to what were termed“economic development projects’. The campaign for the$100 million trust fund is only now trying to re-establishand strengthen those groups that survived this period ofsevere funding drought and political animosity.
O. THE IMPACTS OF THESE EFFORTS
1. Success Stories and Potential Best Practices
Probably the most important success story withregard to slum housing is the effort to reform multifam-ily building code enforcement in the City of Los Angelesduring the late 1990s. In the U.S., building codeenforcement is one of the most important strategies thatmunicipalities can utilize to ensure safe, habitable hous-ing. If designed to be flexible, not rigid, code enforce-ment can play a role in remedying and preventing slumconditions (Ross, 1997).
In 1997, a group of community leaders and politicalactivists came together to discuss the growing problemof deteriorated housing conditions in the Los Angelesarea. They quickly caught the attention of local govern-mental officials, who commissioned the group the “BlueRibbon Citizens’ Committee on Slum Housing” andappointed additional members to the panel. The 22-person committee included public interest attorneys,religious leaders, academics, real estate developers,executives of local non-profit organizations, and othercivic leaders. The committee met throughout the firsthalf of 1997 and first examined some of the statisticsthat were being assembled by UCLA’s NeighbourhoodKnowledge Los Angeles (NKLA) Project team. TheCommittee also oversaw research by UCLA studentsinto the current housing code enforcement activities inLos Angeles. On the heels of an article in the Los
Angeles Times that documented the horrible conditionsof the worst apartment buildings in the city, the commit-tee issued its first report in July, a scathing review of theCity of Los Angeles’s Department Building and Safety.
In this report, the committee outlined the scope ofthe “slum housing problem” in Los Angeles, reviewedthe code enforcement program at Building and Safety,and proposed recommendations for substantiallyreforming code enforcement in the City. Using datafrom sources such as the U.S. Census Bureau’s 1990Census and American Housing Survey (AHS), as wellas from the City’s Rent Escrow Account Program(REAP), the report argued that a substantial amount ofLos Angeles’s rental housing is substandard, resulting insevere health, economic and social consequences tothe City. The current code inspection program, accord-ing to the report, was incapable of addressing the “slumhousing problem” because it was complaint-driven andwas a very low priority for the city’s Department ofBuilding and Safety. Building and Safety dedicated agreater amount of staff and resources to inspecting newresidential constructions, which just happened toprovide a substantial part – more than 50% - of theDepartment’s budget. The committee recommendedrevamping code enforcement in the City by moving to“routine, periodic inspections of all rental housing”funded by rental surcharges.
The release of the report prompted an immediatereaction, and support for the committee’s call to radi-cally reform code enforcement in the city quickly gainedground. The Los Angeles Times, several days after thereport was issued, editorialised that the Mayor and CityCouncil had to “get tough on negligent landlords” andwelcomed the “new interest in eradicating slum hous-ing,” (LAT, 1997 August 3). Less than two months later,the City Council’s Ad Hoc Committee on SubstandardHousing unanimously approved a plan to create a unitin the city dedicated to routine inspections of apart-ments (Tobar, 1997 September 18). The plan passedthe City Council on an 11-1 vote on November 12th(Tobar, 1997 November 13). The Times called this the“most important anti-slum reform in Los Angeles history”and the Mayor of Los Angeles declared when signingthe ordinance that “every human being in the city hasthe right to live in quality housing” (Tobar, 1998 July 15).
Implementation of the program has faced a variety ofchallenges. A group representing apartment ownerssought to stop the program through the courts. TheCalifornia State Supreme court eventually dismissedthis lawsuit. Also, collecting the monthly fee of $1 perunit for inspections was difficult, and these resourceswere insufficient to cover the cost of inspecting all rentalunits within three years, so additional funding from thecity was necessary. Collecting and managing data oninspections was a challenge, but the program began tocount on a Management Information System thatenabled inspectors to collect data on hand-held comput-
UNDERSTANDING SLUMS: Case Stud ies fo r the G loba l Repor t on Human Set t lements 2003
21

ers that automatically produces notices and reports.The information that is collected by inspectors is nowbeing transferred to the NKLA website (see section P.3.)to fully inform the community of the condition of its rentalhousing stock.
A map showing buildings that have had a high numberof code violations is displayed in Figure 12, revealingthat substandard housing conditions in Los Angeles arenot limited to just one area of the city. With these newtools and added transparency, however, the inspectorsare reporting that approximately 90 per cent of the land-lords are complying by making the required repairs.Thus, approximately $450 million dollars in private fundshave been invested in substandard housing over the
past four years, most of which is located within the disin-vested areas that were identified in this research.
2. Reasons for successes and failuresOne important reason for this successful code
enforcement reform was the strength of the partnershipin the stages of policy development as well as imple-mentation. Rather than beginning reform within govern-ment, the genesis was among Los Angeles leadershipdedicated to change and their ability to mobilize univer-sity-based research to build their analysis and recom-mendation. Grassroots groups mobilized for the publichearings and tenant representatives agreed to anincreased cost of $1 per unit per month to fund thecomprehensive inspections. A government-university
Urban Slums Reports: The case of Los Angeles, USA
partnership developed tools for increasing efficiencyand targeting inspection work, as well as an informationsystem for a network of NGOs hired by the city to serveas mediators between tenants and landlords (moreinformation in section P.3. below).
As noted above, SCEP experienced several chal-lenges and setbacks during its first several years. Muchof this was undoubtedly due to the normal challenges ofinitiating a completely new and comprehensive enforce-ment program in a bureaucracy such as the city. Amongother tasks, the housing department had to find, hire,train and manage 50 qualified inspectors, develop poli-cies and guidelines, oversee development of an infor-mation system to manage the inspections, and ensurecompliance with their orders for repair. In addition tothese normal challenges, SCEP suffered from overtpolitical opposition, especially from the landlord associ-ation, which provided legal disputes. According to someof the reformers and designers of the program, theMayor at the time and other municipal departmentsemployed subtle tactics to sabotage SCEP, such as notbeing upfront about resources that were committed tothe program or clear about the division of labour onenforcement activities in the city.
3. Lessons Learned:
a. Importance of context
Participants in the slum housing reform effort noted therole that the representatives from the Roman CatholicChurch played in the initiation of the Blue RibbonCommittee, as the chair of the committee was anesteemed Catholic educator and several members werealso prominent Catholics. This allowed them to put pres-sure on the Mayor, who, despite not being completelysupportive of the reform, was influenced as a Catholic bythe local Cardinal as well as the political reality of therising number Latin American Catholics in his jurisdic-tion. Unfortunately, the power of the Catholic Church tobring influence on such social issues may be waning dueto the national crisis around child molestations.
Similarly, the growing power of the labour movementprovided an important ally in the struggle to improvehousing conditions for local workers. When the CitizensSlum Housing Committee report was issued to thepress, leading the charge was both the Cardinal and thedirector of the Los Angeles County Federation ofLabour, Miguel Contreras. Los Angeles County has ledthe nation in reaching out to new labourers of foreignorigin. While the U.S. labour movement has a longhistory of being very nativist and xenophobic, LosAngeles has demonstrated that one of the best way torevitalise and expand labour organising is through work-ing with the most exploited workers, those of foreignorigin. The national AFL-CIO has changed its policiesaround undocumented workers to reflect lessons
Figure 12: Substandard Multifamily Housing, City of Los Angeles
22

learned in Los Angeles. No longer are these recentimmigrants seen as a threat to domestic wages, butrather as the future of labour organising.
The Los Angeles model has had two very importantcomponents. First, it has focused on place-basedsectors of the economy that would incur significantcosts if they tried to relocate. These industries includejanitorial services, hotel and restaurant workers, andthose that provide governmental services, usuallythrough private contracting. Important gains have beenmade for example in unionising health care workerswho assist people with disabilities in their home.
The second component of the local labour strategy hasbeen to combine industry organising with communityorganising. The Los Angeles Alliance for a New Economy(LAANE) has led to a successful “living wage” campaignthat requires all city contractors to pay workers more thanthe minimum wage to ensure that they can support theirfamilies. The same labour-backed organisation has alsoled negotiations on large development projects to ensure1) that future employees on site will have living wagesalaries and 2) that the project developer provide fundingsupport for local parks and affordable housing programs.Labour organising also occurs through Mexican home-town associations and soccer leagues, using informalnetworks as a vehicle for providing information on workerrights to collective representation. As the demographicsof Los Angeles has changed, it is clear to many othermiddle and higher income groups that the future of the cityis increasingly dependent on its ability to assimilate inter-national immigrants by providing new economic andsocial opportunities. The impressive political campaignby Antonio Villaraigosa for the Mayor of Los Angelesspeaks to the potential power of these new emergingcoalitions of labour, community and progressive middleincome households. It still remains to be seen whetherthis new constellation of power can emerge.
b. Importance of enablementOutreach groups have helped residents in disinvested
communities advocate for inspections of their dwellings.The City of Los Angeles decided to model its codeenforcement program on that of the City of San Francisco.In that city, teams composed of tenant rights advocatesand the local landlord representatives served to promotecommunication between conflicting interests in problemproperties, and seek voluntary compliance with health andsafety standards. The implicit threat was that the city willmandate repairs if the landlord and renters cannot reachagreement on the needed improvements.
Unfortunately in Los Angeles, the local landlord asso-ciation fought the efforts to legislate a new codeenforcement program, using the court system to blockimplementation. Given this relationship, it was very diffi-cult for the city to work in good faith cooperation withthese property owners. Hence, only tenant rightsgroups were hired by the city under contract to conduct
UNDERSTANDING SLUMS: Case Stud ies fo r the G loba l Repor t on Human Set t lements 2003
outreach and negotiate agreements with owners.These groups included tenant organisers, legal aid soci-eties, and renters rights groups, and fair housinggroups; all were small non-profit organisations.
The performance of these outreach groups varied.Some were good at getting necessary inspections,others better at negotiating agreements. The size ofLos Angeles continued to be a challenge to manage,even as the city divided the groups among regions fortheir work. San Francisco is, by comparison, a smalland dense location. Also, the LA groups did not have afully orchestrated public information campaign, as didtheir counterparts in San Francisco.
This contract work is now shifting away from identifyingthe locations for inspections into organising renters inbuildings that remain without adequate repairs. In thesesituations tenants are encouraged to establish a collec-tive Rent Escrow Account, which enables them to depositrent into a jointly administered savings account ratherthan to an unresponsive landlord. Funds from theseaccounts can then pay for necessary housing improve-ments and cover the cost of maintaining utility service.
c. Importance of various types of capitalThe very small monthly tenant inspection fee ($1 per
unit per month) has leveraged a significant level ofprivate investment from local property owners.According the housing department, there were approxi-mately 300,000 housing units inspected during the firstfour years of the program. More ninety percent of thoseunits underwent improvements, representing an esti-mated investment in repairs of approximately $450million (or $1,500 per housing unit).
d. Importance of correct targeting Among the most regular users of the NKLA informa-
tion system (see section P.3. below) and its mappingtools are the SCEP inspectors.
P. DEMONSTRABLE COMMITMENT TO REGULAR MONITORING, FEEDBACK AND ADJUSTMENT OF POLICIES & PROGRAMMES
1. Budget commitmentsOver the past two decades, the only funds that could
be relied upon to address housing disinvestment havebeen federal revenue sharing dollars (e.g. CDBG andHOME). The City of Los Angeles, unlike Chicago orNew York, has never used its own resources, such asgeneral tax revenues, to make a continuing commitmentto housing improvement. The investment of substantialredevelopment funds were resources that were divertedfrom the County and were used to produce replacement
23

housing for affordable dwellings that were demolishedthrough public action.
Over the last few years, local government has begunto change its budgetary commitment to housing. SCEPis funded through a fee of $1 per unit per month to allproperty owners of rental housing who, in turn, areallowed to pass this fee on to their tenants. In 2002, anew Mayor promised to establish a municipal affordablehousing trust fund in the amount of $100 million tosupport preservation and production of lower costdwellings (Dreier and Candaele, 2002). While the gapin available affordable housing in the city will undoubt-edly not be met by these funds, the commitment repre-sents a promising trend.
2. Policy Commitments As chronicled at the beginning of this report, the
federal government made a broad policy commitment toproviding a “a decent home and a suitable living envi-ronment for every American family.” The goal is far fromrealized in Los Angeles. The federal governmentrequires each participating jurisdiction to produce a“Consolidated Plan” that describes the strategy forusing federal and local resources in an integratedmanner to address local needs.
As noted previously, the State of California’sDepartment of Housing and Community Developmentrequires the Southern California Association ofGovernments to complete a regional housing needsassessment that identifies the minimum amount of newhousing development that is required to address theneed for replacement and respond to growing demand.The City Planning Department has recently written a newHousing Element to the General Plan that incorporatesthe estimates from SCAG and identifies the location forhousing production within the municipal boundaries.
The City’s Rent Stabilization Ordinance requires aperiodic review of the housing market to determine if theneed for controlling rents before vacancy is stillrequired. The Rent Stabilization Ordinance restrictsannual rent increases for non-vacated flats while unoc-cupied dwellings can be rented at market rates.
The Systematic Code Enforcement Program has a goalof inspecting all rental properties with two or moredwellings within a three-year period. This goal will not beachieved and it is likely that two additional years will berequired to complete the remaining first-round inspections.
3. Commitment of NGOs to Monitoring Slum Conditions
The Neighborhood Knowledge Los Angeles (NKLA)project, sponsored by the University of California, LosAngeles, is the most comprehensive system for moni-toring the process of residential disinvestment in LosAngeles.15 It accomplishes this by assembling, inte-
Urban Slums Reports: The case of Los Angeles, USA
grating and mapping a wide variety of public databasesincluding code inspection records, tax delinquency, andmunicipal efforts to abate nuisances such as vacantproperties, and making these data sets and researchtools publicly available over the Web (see Figure 13 fora screen shot of a map and property information pageon NKLA). Users can enter an address of a slum build-ing and get detailed information on inspection informa-tion from SCEP, as well as find out whether the propertyhas any tax liens or has had any building permitsissued. NKLA receives approximately 10,000 hits eachday, and primary users include NGOs, community resi-dents, government staff, and university-basedresearchers. NKLA’s Neighborhood Early WarningSystem (LANews) is used by community organizationsand tenant advocates to document the history andextent of problem properties and to monitor localresponse to slum conditions. Researchers and stafffrom local government also use NKLA’s Policy Room toinvestigate the relationship between different propertyindicators and to track neighbourhood conditions.Databases are updated on regular cycles – someovernight and some quarterly or biannually – to ensure
that information remains reasonably current. One outgrowth of NKLA’s work on assembling admin-
istrative data set from local government and allowingusers to query them over the Web has been a series ofinitiatives to work with NGOs on community-createddata sets. Through the Inter-Active Mapping LosAngeles (I AM LA) application on the website, NKLAallows community groups to add data points to NKLA’sproperty data base and interactive maps through webforms. Members of community organizations log on thewebsite and enter data about properties in their neigh-bourhood in a simple six step web form, even uploadingphotographs of the properties. This data is then view-able on the website to the broader public both in listsand on interactive maps, where users can click on
Figure 13: Data available on the web
24

points to see photos and descriptions of the properties.Several organizations have used the application todevelop electronic inventories of community assets andresources that can assist with redevelopment efforts.One NGO, Community Coalition, has used I AM LA toenter data on properties with nuisance activities (e.g.prostitution and substance abuse) that they are monitor-ing. This allows Community Coalition members to moreefficiently track nuisance activity and governmentresponse to their requests for intervention, and itprovides an interactive means for presenting the scopeof nuisance activities in their community.16 This use ofthe Web has expanded the notion of what data consti-tutes knowledge about neighbourhoods to include theperspectives of community residents, not just datacollected by government agencies.
An important corollary to the NKLA system is a TenantOutreach Information System that assists local NGOs inensuring that properties with building violations areinspected under the city’s Systematic Code EnforcementProgram (SCEP). A major impetus for the slum housingreform that led to the establishment of a systematicinspection program for apartment buildings was that thecity’s previous code enforcement program made it verydifficult to lodge complaints about slum conditions.Therefore, designers of SCEP called for the city to workwith local NGOs to serve as liaisons between tenants,property owners and the housing department. To meetthat objective, the city entered into outreach contractswith several community-based organizations, whichreceive complaints from tenants on a toll-free telephoneline and then do their own inspections of the propertiesbefore deciding whether to mediate an agreement withthe landlord or to refer the properties to the housingdepartment for a formal inspection. According to onetenant organizer who plays this intermediary role, theprogram gives the tenant advocates the opportunity toeducate landlords about their responsibilities and encour-ages property owners to respond to tenant complaintsand make necessary repairs. In order to manage theprogram, the city hired the NKLA team to design an infor-mation system to track case information on tenantcomplaints. The system is a secure website that allowsthe various organizations to enter intake information andinspection results into the data base, allowing the groupsto easily share information with one another. The systemalso provides a direct link to detailed property data onNKLA, including previous code inspection and complaintinformation. This allows the outreach groups to quicklyassess the history of properties and decide with whaturgency to respond to the current complaints.
The use of these information tools to document andmonitor slum conditions and mitigation strategies is notsomething that is, or has to be, limited to Los Angeles.NKLA was actually modelled on another system inChicago, and there are several examples of similarneighbourhood information projects from other cities
UNDERSTANDING SLUMS: Case Stud ies fo r the G loba l Repor t on Human Set t lements 2003
around the United States.17 Often, these projects repre-sent partnerships between local governments, commu-nity organizations, and universities, with each takingresponsibility for different aspects of the work.Governments usually provide data, principally informa-tion on properties and neighbourhoods as well asgeographic layers. Universities often provide technicalassistance, developing and hosting the websites andconducting research to aid in the application of thesystems. Community organizations provide users forthe systems who utilize them to conduct communityresearch and monitor property conditions. Bringing all ofthese pieces together and finding the resources neces-sary to develop these projects is not easy. However, asthese projects demonstrate, it is possible. Usually thegreatest challenge is in securing, integrating, and updat-ing data. Government cooperation is necessary, as iscoordination between the various project partners.
In contexts outside the developing world, there may beadditional challenges, such as a lack of technical infra-structure and data, as well as a political climate that doesnot contain freedom of information legislation as in theU.S. However, beginning on a small scale, such asputting up data from a neighbourhood survey on awebsite and then comparing that to official governmentdata, could show local government officials and fundingagencies how this type of system could be used as partof a slum upgrading strategy. It may help pacify fears oftransparency on the part of government and encourageagencies to invest in building the technical infrastructureof NGOs and neighbourhood organizations. Telecentres,which serve as low-cost access points for Internet serv-ices in many parts of the developing world, could be setup in neighbourhoods and NGO offices to give residentsaccess to the systems.18 Because web technologyallows for the website to be hosted anywhere, organiza-tions and universities in the developed world could beenlisted to provide technical assistance and host thesewebsites. Therefore, projects on the NKLA model couldsucceed in contexts where the following conditions exist:
at least some level of data about properties andneighbourhoods and, hopefully, geographic layers forinclusion in a Geographic Information System (GIS)
willingness by local partners to work together todevelop the scope of the system and oversee its imple-mentation and linkage to slum upgrading strategies
either the capacity to develop and maintain thesystem or the ability to bring in a partner that couldprovide these services
a network of users that will utilize the system to effectchange in local development and possibly collect datato upload to the system.
25

ENDNOTES
1 The U.S. Census Bureau defines a housing unit as “over-crowded” if there is more than one person per room (excludingbathrooms and including kitchens) in the unit and “severelyovercrowded” if there are more than 1.5 persons per room.The per cent of units overcrowded in Los Angeles increasedfrom 6.6 in 1990 to 7.5 in 2000, and the per cent of severelyovercrowded units increased from 15.7 to 18.1. 2 According to the Los Angeles Economic DevelopmentCorporation’s description of the region’s 14 base industries:<http://www.laedc.org/14industry.html> (Accessed May 31,2002)3 For the purpose of this report, we considered a neighbour-hood “disinvested” if (1) it had a tax delinquency rate of morethan 6 per cent of properties and (2) 30 per cent or more of itshouseholds were low-income, i.e. had less than $25,000annual income. We then divided the neighbourhoods bydensity as indicated in the text. We used $25,000 was used asa compromise proxy for “low-income” between the federalpoverty level ($17,463) on the low side and LAANE’s (More etal., 2000) estimation of “working poor” income ($34,000) on thehigh side. Tax delinquency serves as a proxy for both “deteri-orated physical conditions” (see footnote 4) and “levels ofprivate investment and property maintenance.” Because taxdelinquency represents a disinvestment in property by ownersand is highly correlated with property conditions, we believethat it represents a good measure for these characteristics.
4 Previous research in the U.S. has shown a strong relation-ship between property tax delinquency and deteriorated hous-ing conditions. For example, Krouk (1996) explored how oper-ational disinvestment is associated with decreased propertymaintenance and slum conditions in Los Angeles. 5 To identify disinvested neighbourhoods, we first selected thecensus tracts that met the characteristics outlined in footnote 3.We then divided the neighbourhoods by density as indicated inthe text to categorize them by type.6 From 1986 to 1997, CRA/LA provided financing for 5,875new units and 6,741 rehabilitated units. Source: J. EugeneGrigsby. 2001. Redevelopment’s Contribution to Housing inSouthern California. UCLA Advanced Policy Institute.
7 The poll was conducted by Lake Snell Perry & Associates forJobs for a Future, a Boston-based employment researchorganization. The margin of error is plus or minus threepercentage points. The results of the poll are available on Jobsfor a Future’s website: <http://www.jff.org/> (Accessed June22, 2002).8 According to the U.S. Census Bureau’s 1999 CurrentPopulation Survey. Cited in: Institute for the Study ofHomelessness and Poverty, June 2000, Just the Facts,<http://www.weingart.org/institute/research/facts/pdf/JusttheFacts_LA_Homelessness.pdf> (Accessed June 19, 2002).9 Gang and crime statistics can be found on the LAPD’swebsite: <http://www.lapdonline.com> (Accessed May 31,2002).10 See <http://www.acorn.org> for more background and infor-mation on ACORN.11 See the U.S. Department of Housing and UrbanDevelopment webpage for more information on CDGB<http://www.hud.gov/offices/cpd/communitydevelopment/programs/cdbg.cfm> and HOME <http://www.hud.gov/offices/cpd/affordablehousing/programs/home/> (Accessed June 21,2002).
Urban Slums Reports: The case of Los Angeles, USA
12 For information on the Regional Housing NeedsAssessment conducted by the Southern California Associationof Governments, which includes Los Angeles, see the HousingSouthern Californians website: <http://api.ucla.edu/rhna>13 See <http://www.ffiec.gov> for more information on HMDAand CRA.14 In 2002, the Bank received a negative review as part of anaudit from the U.S. Department of Housing and UrbanDevelopment, possibly being required to pay back loans fromthe federal government to establish it. See Romney, 2002.15 NKLA is on-line at: <http://nkla.ucla.edu>. See Krouk et al.,2000 for more background on NKLA and an assessment ofhow it compares to other neighbourhood information systems.For assessments of NKLA’s outcomes, see the evaluationdocuments on Publications page in the “Help” section of thewebsite: <http://nkla.ucla.edu/Help/Translator/NKLA-TOP-EvaluationReportDec2001.pdf> and <http://nkla.ucla.edu/Help/Translator/FinalTOPReport_API.pdf> 16 For more information on the I AM LA application and NKLA’swork with community-based organizations to add community-created data sets to the site, see: Karuri, 2000 and Pitkin andRattray, 2002. 17The system in Chicago is the Center for NeighborhoodTechnology’s Neighborhood Early Warning System<http://www.newschicago.org/>. Other projects include the 18Telecentre is a term used largely outside the U.S., where“community technology center” is a more popular term.Somos@Telecentros is a network of telecentres in LatinAmerica <http://www.telecentros.org/english/index.html>
One of the coordinating agencies of Somos@Telecentros hasa project called “Barrionet” in Ecuador that sets up telecentresin poor urban neighbourhoods to support local developmentefforts<http://www.barrionet.org>.
BIBLIOGRAPHY
Abrams, C (1950) February 25 ‘Rats among the Palm Trees.’The Nation 177-78.
Abu-Lughod, JL (1999) New York, Chicago, Los Angeles:America’s Global Cities. Minneapolis: University of MinnesotaPress.
Blue Ribbon Citizens Committee on Slum Housing (1991) July28 The Slum Housing Problem in Los Angeles and theDepartment of Building and Safety.
Banham, R (1971) Los Angeles: The Architecture of FourEcologies. Berkeley, California: University of California Press.
Caughey, J (1977) Los Angeles: Biography of a City. Berkeley,California: University of California Press.
Citro C and R Michael, editors (1995) Measuring Poverty: ANew Approach. Washington, DC: National Academy Press.
City of Los Angeles (2001) City of Los Angeles 2000 Economic& Demographic Information. Available at: <http://www.lacity.org/cao/econ0103.pdf> (Accessed May 2, 2002).
Cleeland, N (2002) May 6 ‘Off-the-Books Jobs Growing inRegion.’ Los Angeles Times.
CSLA (Center for the Study of Los Angeles ResearchCollection) (2002) ‘History: Rebuild L.A.
26

Collection.’ Loyola Marymount University Von der Ahe LibraryArchives & Special Collections, Collection Number CSLA-6.<http://lib.lmu.edu/special/csla/rla/rla_hist.htm> (AccessedMay 31, 2002).
Davis, M (1992) City of Quartz: Excavating the Future in LosAngeles. New York: Vintage Books
DeGraaf, L (1970) ‘The City of Black Angels: Emergence of theLos Angeles Ghetto, 1890-1930.’ Pacific Historical Review39:323-52.
Drayse M and D Flaming. (2001) South Los Angeles Rising:Opportunities for Economic Self-Sufficiency Ten Years Afterthe 1992 Civil Unrest. Economic Roundtable Briefing Paper.Available at: <http://www.economicrt.org> (Accessed May 31,2002).
Dreier, P and K Candaele (2002) April 15. ‘Housing: An LAStory.’ The Nation
Fears, D (1998) July 5 ‘Fed-Up Tenants Organize – and GetCity to Act.’ Los Angeles Times B-5.
Grigsby, J. Eugene. (2001). Redevelopment’s Contribution toHousing in Southern California. UCLA Advanced PolicyInstitute
Hong, P, M Dickerson, and N Cleeland (2002) May 15‘Southland’s Average Family Income Dropped in the ‘90s.’ LosAngeles Times.
Hontz, J (2001) March 2-8 ‘Digs of Doom: the story of life anddeath inside the Echo Park apartment house.’ LA Weekly.Available at: <http://www.laweekly.com.
Kahrl, W (1982) Water and Power: The Controversy Over LosAngeles’ Water Supply In The Owens Valley Berkeley, CA:University of California Press.
Karuri, JW (2000) Developing Youth As Assets In VernonCentral: Recommendations for Youth Mobilization and AssetMapping in a Los Angeles Community. UCLA Advanced PolicyInstitute. <http://nkla.sppsr.ucla.edu/Help/Translator/Asset_Mapping_Geci.pdf> (Accessed June 19, 2002).
Keil, R (1998) Los Angeles: Globalization, Urbanization andSocial Struggles., John Wiley and Sons, Chichester, UK
Krouk, D (1996) Tax Delinquency and Urban Disinvestment inLos Angeles. Master’s Thesis, UCLA Department of UrbanPlanning.
Krouk D, B Pitkin, and N Richman, (2000) ‘Internet-basedNeighborhood Information Systems: A Comparative Analysis.’In Community Informatics: Enabling Communities withInformation and Communication Technologies, edited by MGurstein, pp. 275-9. Hershey, PA: Idea Group.
LAT (Los Angeles Times). (1997 August 3.) ‘Say No toSlumlords.’ Los Angeles Times M-4
LAT (Los Angeles Times). (1997 November 14). ‘Stop SlumsBefore They Can Take Root.’ Los Angeles Times B-8.
McWilliams, C (1973) Southern California: An Island on theLand. Layton, Utah: Gibbs Smith
More, P, P Wagonhurst, J Goodheart, D Runsten, E Marcelli, PJoassart-Marcelli, and J Medearis (2000) The Other LosAngeles: The Working Poor in the City of the 21st Century. LosAngeles Alliance for a New Economy (LAANE). Available at:<http://www.laane.org> (Accessed June 10, 2002).
Pitkin, B and N Rattray (2002) ‘community Mapping forNeighborhood Knowledge in Los Angeles’. CommunityTechnology Review Winter/Spring: 15-17.<http://www.comtechreview.org/article_body_ws.asp?article_I
D=88> (Accessed June 19, 2002).
Pitkin, B and N Richman (2001) ‘Subprime Lending andNeighborhood Conditions in the City of Los Angeles.’ PaperPresented at 2001 ACSP Conference, Cleveland, Ohio, USA.<http://api.ucla.edu/pdf/subprime_paper.pdf> (Accessed June19, 2002).
Reed, D and R Van Swearingen (2001) ‘Poverty in California:Levels, Trends, and Demographic Dimensions’. CaliforniaCounts: Population Trends and Profiles Public Policy Instituteof California. 3 (3): 1-14.
Renwick, L (1995) March 19. ‘4 Blythe Street ApartmentBuildings Seen as Area’s Worst Housing.’ Los Angeles TimesB-1
Romney, L (2002) April 1. ‘Bank’s Woes Could Cost L.A.Millions; Probe: City may have to return Federal funds becauseof Community Development Bank’s failure to meet job-creationgoals.’ Los Angeles Times C-1.
Romo, R (1983) East Los Angeles: History of a Barrio. Austin:University of Texas Press.
Ross, HL (1997) ‘Housing Code Enforcement and UrbanDecline.’ Journal of Affordable Housing CommunityDevelopment Law 6(1): 29-46.
RLA (1995) Grocery Store Market Potential Study Rebuild LA.
Shaffer, A (2002) May Persistence Of L.A.’s Grocery Gap: TheNeed For A New Food Policy And Approach To MarketDevelopment. Center For Food and Justice, Urban andEnvironmental Policy Institute, Occidental College<http://departments.oxy.edu/uepi/cfj/resources/superrmar-kets02.pdf> (Accessed May 31, 2002).
Tobar, H (1997) September 18 ‘Council Panel OKs ApartmentInspection Plan.’ Los Angeles Times B-3
Tobar, H (1997) November 13 ‘City Council Approves Anti-Slum Housing Plan.’ Los Angeles Times A-1
Tobar, H (1998) July 15 Riordan Signs Law Cracking Down onSlums.’ Los Angeles Times B-1
Trejos, N (1998) December 20 ‘City Promises to Crack Downon Slumlords.’ Los Angeles Times B-3
Vega, M (2002) April 5 ‘Protestan contra ‘caserosinescrupulosos’’ La Opinión.
Waldinger, R and M Bozorgmehr, editors (1996) Ethnic LosAngeles. New York: Russell Sage Foundation.
UNDERSTANDING SLUMS: Case Stud ies fo r the G loba l Repor t on Human Set t lements 2003
27