loss and audible noise
TRANSCRIPT
RELATIONSHIP BElWEEN CORONA POWER
lOSS AND AUDIBLE NOISE
Michael Sean Engelbrecht
A dissertation submitted to the Faculty of Engineering, University of the
Witwatersrand, Johannesburg, in fulfillment of the requirements for the degree of
Master of Science in Engineering.
Johannesburg, 1997
llegree a....rarded with distinction on 30 .Tune T998
ABSTRACT
Results are reported on an initial investigation into corona power loss and its relationship
to corona initiated audible noise. The work has the goal of being able to accurately
predict the corona power loss, from a transmission line, from knowledge of the audible
noise on the line. Corona power loss and its relationship to corona current, applied
voltage and electric field is also exarr-ined.
Experiments were performed using two single phase, different diameter, corona cages.
Although the corona cage test results showed no correlation between corona initiated
broad band audible noise and corona power loss, a linear empirical relationship, with
excellent correlation, was found to exist between corona power loss and 100Hz Hum
(dBA above 20jlPa).
Results showed that, at the same magnitude of electric field, within the l h o different
diameter corona cages, the corona current is the same magnitude and the corona power
loss is proportional to the applied voltage.
ii
DECLARATION
I declare that this dissertation is my own, unaided work. It is being submitted for the
degree of Master of Science in Engineering in the University of the Witwatersrand,
Johannesburg. It has not been submitted before for any degree or examination in any other
university.
STRUCTURE OF DISSERTATION
This dissertation has been written in the form of fl concise paper with a large collection of
Appendices. The detailed literature survey; corona cage drawings; source code for
computed calculations; graphical illustrations of all corona power loss measurements;
and statistics used have been placed in these Appendices.
Iii

ACKNOWLEDGEMENTS
The author would like to thank the following people for their valuable contributions
towards this project:
Dr I Jandrell for his support and words of encouragement along the way.
Mr R Kelly tor assistance with the writing of MATLABTM code.
Dr A Phillips for his help with simulation of electric fields in co-axial arrangements.
using the MAXWELUM 3D FJeld Simulator.
Finally a special word of thanks to Prof Jan Reynders fur his guidance, words ofwisdom
and the opportunity afforded me to complete this project.
iv
TABLE OF CONTENTS
'pF.CLARATION
ABSTRACT ii
STRUCTURE OF DISSF.RTA TIO"-,,N-'-- ---'i"'ii
,ACKNOWLEDGEMENTS ________________ ~iy
LIST OF FIGURES vii
1) INTRODUCTION
2) BACKGROUND
2.1) CORONA POWER LOSS2.2) AUDlBLE NOISE
34
3) EXI'ERIMENTAL PIHlCEIHlRl<; . ___ 6
3.1) EXPERIMENTAL SET-UP3.2) METHOD
79
4) EXPERIMENTAL RESm ,TS tt
5) DISClJSSION OF RESULTS 22
6) CONCLUSIONS ------- 25
APPENDIX 1 : UTEIH TURE SURVEY
APPENDIX 2 : DIMENSIONED CORONA CAGE DRAWINGS
APPENDIX']: MATLARTMSOURCE CODE
APPENDIX 4 : CORONA POWER LOSS RESULTS ~ 300111m CORONA CAGE
APPENDIX::;: CORQNAJ~OWER I,OSS RESULTS ~ 4ROmm CORONA CAGE
APPF.NDlX 6: AUDIBLE NOISE WAVEFORMS
APPENDIX 7: STATISTICS USED
REFERENCES
vi
LIST OF FIGURES
Figure 1 : Section of Copper Conductor Indicating Corona Point Source on Surface
Figure 2 : Corona Cage Circuit Diagram
Figure 3 : Simulated Evfield Magnitude at a Single Corona Site - 300111111 Cage
(N" .malised to 1V)
Figure 4: Simulated Esfield Magnitude at a Single Corona Site - 480mm Cage
(Normalised to 1V)
Figure 5 : Current Measured Across 50Q Resistor at 27.9kV(rms) - 300mtll Cage
Figure 6: Current Measured Across 5l,,Q Resistor at 37.5kV(rms) - 480111111Cage
Figure 7 : 50Hz Component of Corona Current as Measured at Peak Voltages and
Equivalent Electric Fields, in Both Corona Cages
Figure 8: Corona Loss as a Function of Number of Corona Sources
Figure 9; 100Hz Hum (dBA above 20~lPa) as a l-unction or NUIJIL(;l of Corona Sfll1J'C't~S
Figure 10: Least Squares Trend of Corona Power Loss as a Function of 100Hz Hum
(dBA above 20~lPa) - 300111111 Cage
Figure 11 : Least Squares Trend of Con .ua Power Loss as a Function of 100Hz Hum
(dBA above 20~lPa) - 4dOmm Cage
Figure 12 : Corona Power Loss as a Function of 100Hz Hum (dBA above 20!lPa) -
Normalised to the 300111111Corona Cage
vii

1) INTRODUCTION
The breakdown of air ncar a transmission line, due to corona, generates heat, light,
audible noise and radio interference - all manifestations of the release of energy that must
be supplied by the utilities. This energy loss is termed corona power less and has, in
general, been found to be negligible in fair weather, as compared to its occurrence in foul
weather,
Corona po \Vei loss is of concern to the utilities as its generation can contribute
considerably to the cost of supplying elecu icity (7). It is therefore important that the
supply utility not only design. overhead lines to operate below the corona threshold but
also thai they have an accurate me hod of measuring or predicting corona power loss on
existing lines in service, in the interests of curbing corona activity.
Numerous studies into corona power )1)<;<; measurement and its prediction have been
undertaken and, arguably, the most significant of these has been the work carried out at
Project UHV. This research facility, sponsored by the .Jectric Research Council of the
United States, investigated the effects oftransmission line corona in order to provide
industry with basic data for the design of conductors for both EHV and UHV
transmission. Tests were performed in single phase corona test cages and results were
scaled by means of generation quantities (Appendix 1) to give meaningful results for
three phase transmission lines,
Measurements. undertaken at Project UHV (7), included investigating the relationship
between corona power loss and corona initiated audible noise. However, this work was
not taken further and the possibility of predicting the transmission line COlonapower
loss, from a knowledge of the audible noise 011 the line, was not explored.
The following project investigates not only the measurement of corona power lo.s but
also its relationship to corona initiated audible noise.
Tilt; work forms the initial stage of work to determme the corona power loss from a
transmission line, from a knowledge of the audible noise on the line. It is envisaged that
an empirical relationship exists between corona power loss and audible noise and this is
analyzed. Determination of an empirical relationship between the two entities would
allow for accurate prediction of corona power loss from transmission lines which are in
service.
Experimental work was carried out in the High Voltage Laboratory at the Umversity of
the Witwatersrand using two different diameter, single phase corona cages (Appendix 2).
Point sources were used to enhance the electric field on the conductor surface and
provide sources of corona activity.
The use of the two cages allowed for an investigation 111tOhow -':<lg.:diamerer affects
corona power loss from a conductor, Electric fields, of the same magnitude, were setup in
each cage and valuable information on the prooortionality of voltage to corona power
loss was obtained. This is especially important ill the design of'power transmission lines,
using single phase corona cage test facilities. with respect to designing below the corona
threshold.
In order to obtain electric fields of the same magnitude, in the respective cages, a 3-
dimensional finite element analysis package (20) was used for theoretical prediction of
the fields.

2) BACKGROUND
2.1) CORONA POWER LOSS
Corona power loss occurs on transmission line conductors when the voltage gradient in
the immediate vicinity of the conductor surface exceeds the breakdown strength of air
(8). The resulting discharge releases energy in various forms and this represents an
amount of energy that cannot be recovered by the supply utility.
It has been shown (8) that maximum calculated corona power loss can be of the same
order of magnitude or even higher than resistance losses. Bartnikas and McMahon (1)
list, as an example of appreciable corona power loss, the following: A three phase
overhead transmission line with a 10m Hat spacing and a conductor diameter of 42mm
may lose up to 2.SkW per kilometre at 3S0kV in dry weather. In wet weather the corona
loss can be as high as 44kW per kilometre. At 400kV, the same line loses 6kW per
kilometre, in dry weather, and 114kW per kilometre when wet.
From the above figures it is evident that corona power loss in tail' weather is negligible as
compared to the loss in foul weather. Indeed few fair weather corona loss results frori
Project URV are available and most conductors tested were mainly checked for foul
weather performance, Continuing in this vein, Gary and Clade (3) investigated the
predetermination of corona losses under rain and devised loss curves as a function of the
conductor surface gradient. This work showed good correlation between measured and
predicted transmission line power loss.
Aside from theoretical prediction it is evident, from the literature, that corona power loss
can accurately be measured with the use of single phase test cages (3,5,8). Values
obtained in this manner need to be scaled, by means of generation quantities (Appendix
1). in order to obtain meaningful results for three phase conditions.
2.2) AUDIBLE NOISE
Audible noise from transmission lim's occurs primarily in foul weather (7). In dr.'
conditions, the conductors usually operate below the corona inception level, and .,cry few
corona sources are present. In wet conditions. however, water drops collecting on h,,_'
conductors produce a number of corona discharges. each creating a burst of noise.
Corona initiated audible noise consists of two components, namely. a broad band
component and secondly, a low frequency pure tone. The low frequency pure tone occurs
at twice the power frequency i.e. 100Hz. and is due to the motion of positive and
negative ions around conductors carrying alternating current (7). This pure tope is .learly
illustrated by Comber et al (4) in sound measurements taken using an A-weighted sound
level.
A-weighting is a measurement technique used to take into account the fact that the
human ear is more sensitive in the mid-range of frequencies, f Ithough other weighting
functions exist, the A-weighted sound level, expressed in dBA. is by far the most
commonly used (19).
The range of pressure variations that the human ear can detect is extremely wide i.e. a
very loud sound can have as much as 1,000,000 times the rms sound pressure of a very
quiet sound. Therefore, for convenience, a compressed scale has oeen devised on the
basis of the logarithm of the sound pressure (Appendix 1). Unless otherwise explicitly
stated it is understood that the sound pressure is the rms sound pressure and that the
reference pressure is 20j.lPa.
As for corona initiated power .oss, prediction of audible noise has also been investigated
(14). Results obtained for the tl.eoretical model showed good agreement with measured
values.
Measurements regarding the prediction of corona power loss from a knowledge of the
audible noise on the line were not encountered in any of the literature. A relationship
between corona power loss and 120Hz Hum (dBA above 20~lPa) was however plotted for
a UHV test line (7) and this forms the basis for further investigation into possible
prediction of corona power loss from knowledge of the audible noise.
:5
3) EXPERIMENTAL PROCEDURE
The average corona power loss, for experimental purposes, was calculai _J using the
integral of the instantaneous voltage multiplied by the instantaneous corona current i.e.
t
p::::.L Iv.i.dtTo
, here : P = average power
T = period over which measurements were taken
v = instantaneous voltage
i .= instantaneous corona current
A digitising oscilloscope WWi used for the multiplication of the current and voltage
waveforms and to perform the necessary integration.
Corona current comprises a capacitive component and a 50Hz component. The 50HL
component of the corona current is the only component which contributes to the real
corona power loss. In previously conducted experiments (16,17) this component of the
current was filtered cut from the capacitive component and utilised in required
calculations.
In this experiment the integration of the instantaneous current and voltage ignores
components which do not contribute to the real power loss i.e,
1
p:::: _!_ f v.i. cit =- VI cos {}To
where: P rz: average power
T = period over which measurements were taken
V = r1115 voltage
I = fins current
6
e '" difference in phase angle between voltage and current
From the above theory it is clear that any capacitive current flowing in the circuit will not
contribute to the real power loss i.e. the difference in phase angle between the voltage
and capacitive current component is 90° and the equation sums to zero ll1 this case.
Harmonics, if present, contribute to the instantaneous value of both the current and
voltage. The above method ofpower measurement, therefore, automatically inc udeds the
influence of harmonics.
3.1) EXPERIMENTAL SET-UP
Measurements were taken using two solid aluminium cages, one of 300mm diameter and
the other of 480mm diameter, through which a copper conductor of 15111111 diameter was
strung, Points were soldered to the surface of the conductor and used as sources of corona
activity. A schematic of a length of the conductor is given below:
Figure 1 : Section of Copper Conductor Indicating Corona Point Source Oil Surface
The solid aluminium corona cages were erected in the high voltage laboratory such that
the circuit arrangement was that shown below:
7
9'1 2 .~ 6 5• e> ~'l
II7
3 84
-. • Co • ••
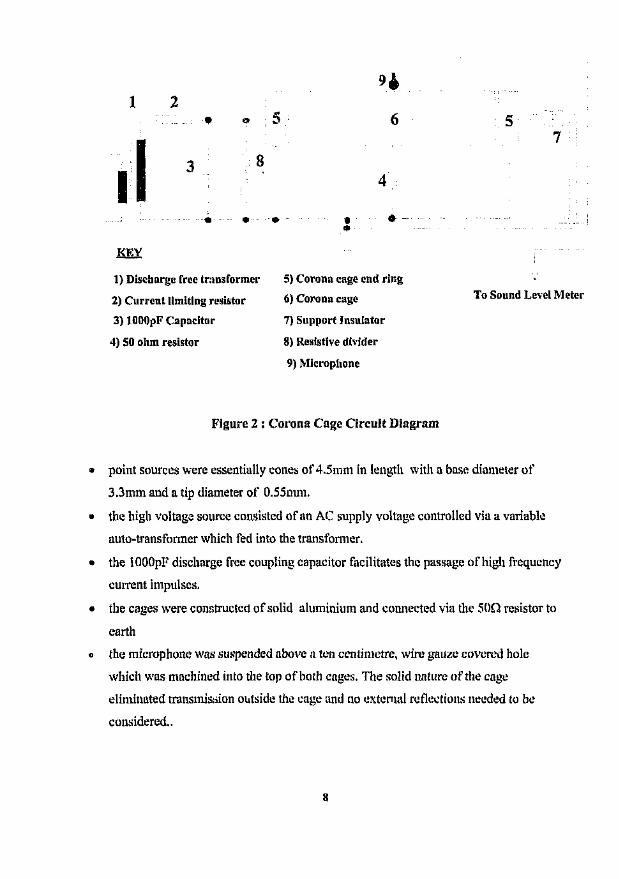
1) Discharge free transformer
2) Current limiting resistor
3) 1000IlF Capacitor
4) 50 ohm resistor
5) Corona cage end ring
6) Corona cage
7) Support Insulator
8) Resistive divider
9) Microphone
To Sound Level Meter
Figure 2 : Corona Cage Circuit Diagram
• point sources were essentially cones of 4.5111111 in length with a base diameter of
3.3mm and a tip diameter of 0.55111111.
• the high voltage source consisted of an AC supply voltage controlled via a variable
auto-transformer which fed into the transformer.
• the lOOOpFdischarge free coupling capacitor facilitates the passage of high frequency
current impulses.
• the cages were constructed of solid aluminium and connected via the 50n resistor to
earth
e the microphone was suspended above 11 ten centimetre, wire gauze covered hole
which was machined into the top of both cages. The solid nature of the cage
eliminated transmission outside the cage and no external reflections needed to be
considered ..
8
• u free Held 1" microphone in conjunction with a sound level meter was used as the
acoustic transducer and fed into the digitising oscilioscope.
,. a discharge free transfor 1 '1', with maximum output voltage of 50kV (r11l3),was used
as HV source for the 300ml . diameter cage.
(> a 140kV (rms) transformer was used as input for the 480mm diameter cage.
The voltage waveform applied to the set-up was measured using a 1000: 1 resistive
voltage divider which was input to a Tektronix TI)S 544A Digitising Oscilloscope. The
corona current was measured across the son resistor. The divider was calibrated using a
precision resistance measurement and the oscilloscope was calibrated using an internal
calibrator.
3.2) METHOD
Measurements followed the same procedure for both cages. Starting with a single j.oint
on the surface of the conductor, ten readings of the corona loss were taken at escalating
voltages. A measurement of the audible noise was made at the highest value of voltage
applied to the conductor, for each number of corona point sources i.e. corresponding to
the tenth reading of corona power loss.
The audible noise was measured by means of a microphone suspended above the corona
cage. This microphone was input to a sound level meter and the resulting \\ aveform was
input to the oscilloscope and saved to disk, for further manipulation. These readings were
repeated for up to ten points on the surface of the conductor. Prior to each measurement,
the microphone and sound level meter were calibrated usng the calibrator supplied with
the meter.
In order to obtain the corona power loss the input voltage waveform was multiplied by
the output voltage, as picked up across the 50n resistor, and the resulting waveform
integrated - all functions performed by the oscilloscope. The resulting waveform had to
I)
be further manipulated in order to obtain the corona power loss, and was saved to disk
and then downloaded to MATLABIM (Appendix 3). The waveform was divided by 50,
in order to obtain the correct value of corona current and then multiplied by 1000 to
compensate for the resistive voltage divider. Division of' the waveform by the period over
which the measurements were taken yielded a single value of corona power loss.
The audible noise waveform was also down loaded to MATLABTM (Appendix 3). A Fast
Fourier Transform was performed 011 the waveform in order to obtain the frequency
components of the measured signal. The resultar -veform was used to determine the
100 Hz Hum of the signal and this value was usc, _.representative ofthe audible noise
on the line i.e. the broad band noise was ignored for the purposes of tile experiment.
It is important to note that all waveforms, obtained from the oscilloscope, were sampled
at 250kHz and consisted of a record length of 15000 points.
10
4) EXPERIMENTAL RESULTS
Although the focus of the project was placed primarily on the relationship between
corona power loss and audible noise, the relationship between applied voltage and
electric field was also investigated. Measurements, within the two different diameter
cages, were required to be taken at the same electric field magnitudes. In order to achieve
this, theoretical prediction of the electric field, at the corona point source tip, was
performed using a 3-dimensional finite element package (20).
500r-----~~----~-------,-------.------~
50 -----r-----------r-"---------t-------~---r---------~-I I • I,
150
,,II I I I~----------r-----------r---------~-r-----------r-----------I I I II ,, ,___________ L L . L L _, , J I, ,II
450400350 -----------~-----------~-----------~-----------~-----------I I, ,
I I ,, I I I----------r-----------r-----------r-----~-----r-----------
, , I,,I I I I----------r---ft-------j-----------j-----------j-----------I I I II I I II I I t___________ L L L L _I I I I, ,
300250200
100
,----- .. - .... -- .. -- .. --~ ...... - .... - .. -- ...... -- ..... - ...... ------- .. - .... - .. ------, ,, ,, , ,I I t I--- ----·--r- ..---------r-----------T---------~-r-----------" ,
O~----,--~------~--·------~--------~------~o 20 40 60 80 100
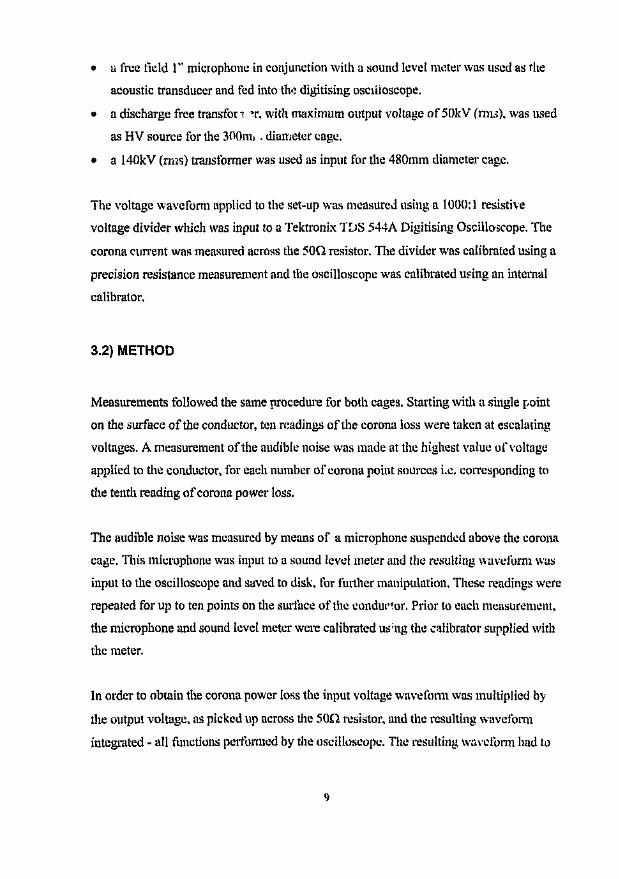
Figure 3 : Simulated E-field Magnitude at a Single Corona Site - 300mm Cage
(Normalised to IV)
Figure 3 indicates the theoretical prediction of the electric field magnitude. obtained for a
single corona point source located on an energised conductor. within the 300mm
diameter earthed corona cage.
II
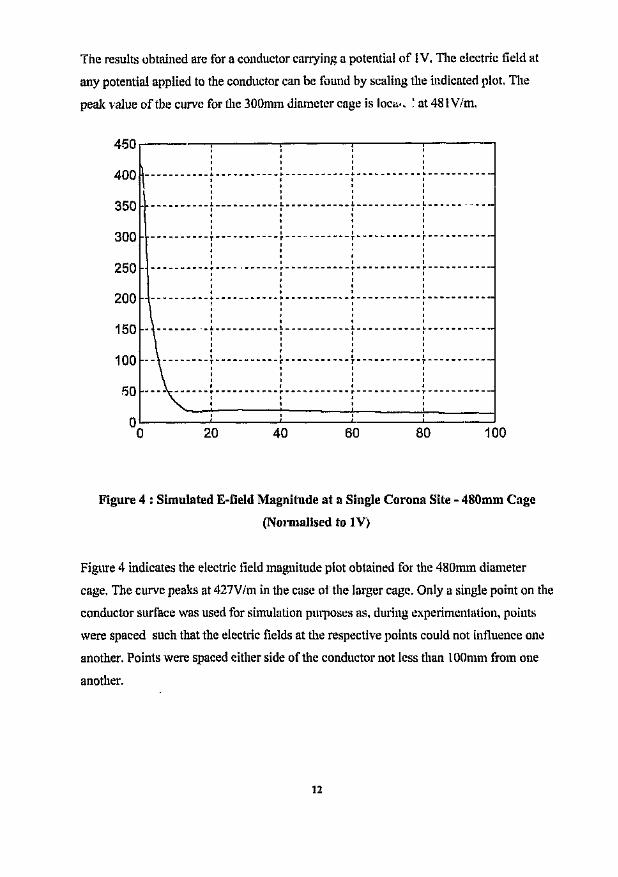
The results obtained are for a conductor carrying a potentia! of IV. The electric field at
any potential applied to the conductor can be found by scaling the indicated plot. The
peak value of the curve for the 300mm diameter cage is loca- 'at 481Vim.
450~: : : : lI I I I
400 -----------~-----------~-----------:-----------~-----------I I I II I I I
I I I I JI I I I350 ----------~-----------~-----------}-----------~-----.-----, ", ,, ,
300 ----------~-----------~--- ..-------}-----------~-----------, , ,, ,,, ,----------~---- ,------~-----------~-----------~-----------I I I 1• I I I, ,, ,----------~-----------~---------~-~---~-------~-----------, , ,, ,, ,I I I I_1 L 1 ~ u _
I I I I, , ,, ,, ,I I I I--------r-----------r-----------r-----------r-----------
'50
250200150
100
O~-------L------~--------~------~------~o 20 40 60 80 100
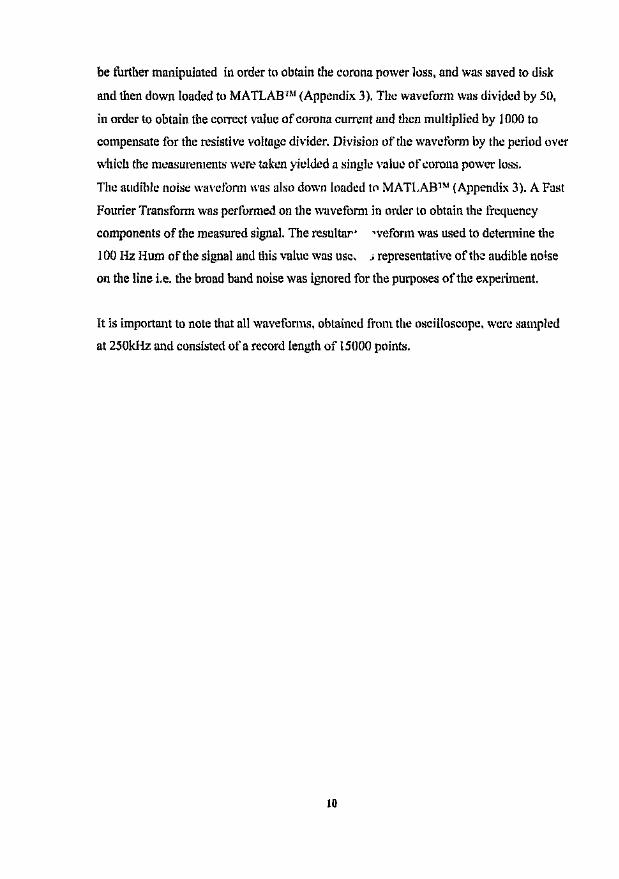
Figure 4 : Simulated E-field Magnitude at a Single Corona Site - 480mm Cage
(Normalised to 1V)
Figure 4 indicates the electric field magnitude plot obtained for the 480mm diameter
cage. The curve peaks at 427V/m in the case of the larger cage. Only a single point on the
conductor surface was used for simulation purposes as, during experimentation, points
were spaced such that the electric fields at the respective points could not int1uence on>!
another. Points were spaced either side of the conductor not less than 100111111 from one
another.
12
Significant corona initiated audible noise was observed in the 300mm diameter cage at
27.9kV(1111s)and this was chosen as a maximum voltage measurement value for this
cage. Similarly, a value of35.7kV(rms) was chosen for the 480mm diameter cage.
These chosen values of voltage give rise to electric field magnitudes of 19.0kViml11and
21.6kV/l11ll1in the respective cages, using the theoretically calculated curves above. This
results in a 12% difference in theoretical field magnitudes between the two cages.
Measurements, as indicated in Figure 7, show that the magnitudes of the corona current,
at 27.9kV(rms) and 35.7kV(rms) in the respective cages, are within 5% of one another.
Therefore it is assumed that if corona current magnitudes are equivalent, the electric field
magnitudes must be equivalent. Also, simulation results cannot be considered to be
completely accurate as small variations in the conductor alignment within the cages can
lead to differences in electric field magnitudes. A 12% difference could thus be accepted
for simulation results and the electric fields were considered to have the same magnitude
in the two cages, based on the knowledge of the equivalent corona current magnitudes.
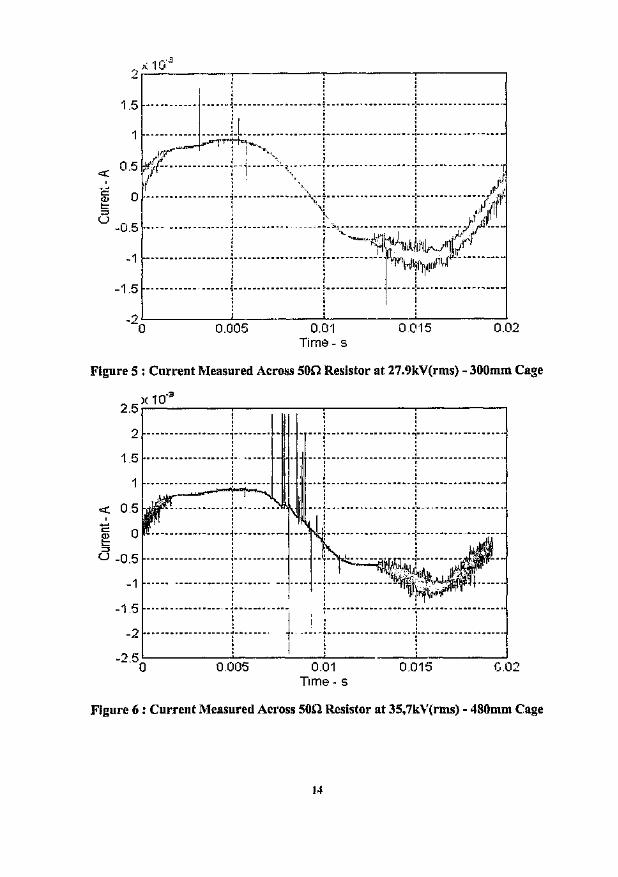
Total corona current was measured at the maximum voltages for the respective cages i.e,
27.9kV(lms) in the 300mm cage and 3S.7kV(1111S)in the 480n1111cage. Figure 5 and 6
indicate the measured current for both cages.
I3
..-} ;< '10":":
I 'I: , ,1.5 ....---.- ---1-"-'" "-i---- M - -- ..... ---" - f- - _..-- _. --- ..- --- ... -:-- -. - --_ ....--- .--- -.
I' ; ;
: I... ... --"1-- .._.-~_L.- ... -- ...... _~- - -;. .. -- - --_. --_ .. - --- -. -:-- - ... _>0_. - -- .. - --- ...
_.,~,,....n·1·~":ti··-·,,.! !i!.t ....~.. : i ~';'t,: :r I ',',' •0.5 !j,{---------------~--r -------'.:------i- - - - -- - - - -- -. - -- - - -:-- - - - -- - -- --- - --- -.
~ 1/ 'I· 1 ~ rlc I •• tr.·,~ 0 --- -- -------- --- --1----.- ----------·'\~t ----- -----------or -----------.i~\lflu -05 ..; __. .____ - -;·-~,--------------.-i---.------/tl--~-
: : '- -.~ • ,1-' iu I: rs ./-': : >'il lL'lIA,:IJ'I;I"-,J,Qflil-1 t- -- -- - -- -- - ----- --r' ----------.------r -----------f~rVIHlr~I'I~\TI'{- -- - -- ----
-'1 5 -- --------- ----- -1' --- ---. ---------. - i------------ i--- - --r--' --- -.- n
r; - ; : ;--0 0,005 00'1 0,015 0.02
Time - s
Figure 5 : Current Measured Across 50n Resistor at 27.9kV(rms) - 300mm Cage
2.5' l l l
1: :::::::::::::I :::::f: j!: I::::::::::::r::::::::::::l0 --------t« 0.5 ..·-r--·---------··---·-:---·----·----· ....--·,....c
~:::::>U -0.5
-1.5
° ----·-·----·------1-----------; I, :
- -- -. - ---- -' -.- - -- 1--' - -- -- - --1-- -- . -(r:-- ----~~(~~l;l~tl~"-,"-",-.-,----'1 ----- ----------.-~--.----- -- ---- --:---------------~ifW' -~ ._.__. ! ._ i- _. . :I~t-1~:'~~f-. _
I-2 ------------------"--.---- 1-
,
._ .. _ .. 1; --- .. - --.--- -:---.- .. --.- - .
,. ,.... _. 4 __ ... __ ... .... __ .. _ ••. ,__ .... .... __ ... ..., ,. ,, .- .-2,5L---------~~--------~'----------~'----------~° 0,005 001
Time - s0015 G,02
Flgure 6: Current Measured Across 50n Resistor at 35,7kV(rms) - 480mm Cage
14
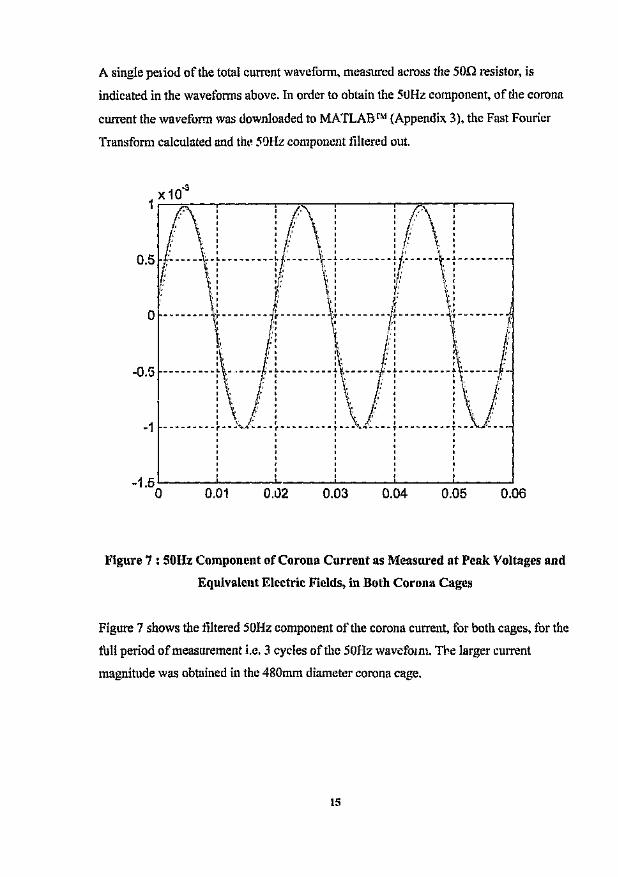
A single period of the total current waveform, measured across the son resistor, is
indicated in the waveforms above. In order to obtain the 50Hz component, of the corona
current the waveform was downloaded to MATLABTM (Appendix 3), the Fast Fourier
Transform calculated and the 50Hz component filtered out.
1 /~:\' '/\,' '[\''\ I I, \. I I (,P 1. I
.\: :{\: :r\:r t: :/'; \: : j:' \:O 5 t;~----_\c, - ~ - - - - - - - - - ~ ,,~ - - - - j~-: ---------:/',~-----\--: ---------• , I I . 1 I I' 1 I
" I I " \', I I , \., I
" 1\\ : : " \', : : i " :'; I I ~' \ I ~'; \ 1
> " : (" ~, : ;,' \. :
Ii" I " I' I Sf tl iO ' j! "I II "I-------- i:--------I~--------'\;--------~,;--------'\;--------T
\ i: I r: t I:'\" j: : \'" !i : ~~. j':I I ' 1 I \ , I I~- •
-O.G - - - - - - - - - ~ ",- ,- - - - '- ~- - - - - - - - - ~ "',-- - - - -p'- ~- - - - - - - - - ~~- - - - - -,.:-:', j':: : \\', i. :\'.I,I, 'I I, I I I I ,
", ,', '\' , '\. f,
i\/ i i~,l i i\/-1 - _.._ t" "''''',,4 r - - T"" • ,,' ,.,. - T T"" -\,. '- ..
-1.5 '-- __ --'--__ -"- __ ---' -'- __ ---1-__ ---1
o 0.01 0.02 0.03 0.04 0.05 0.06
Figure 7: 50Hz Component of Corona Current as Measured at Peak Voltages and
Equivalent Electric Fields, in Both Corona Cages
Figure 7 shows the filtered 50Hz component of the corona current, for both cages, for the
full period of measurement i.e, 3 cycles of the 50Hz waveform. The larger current
magnitude was obtained in the 480ml11diameter corona cage.
15
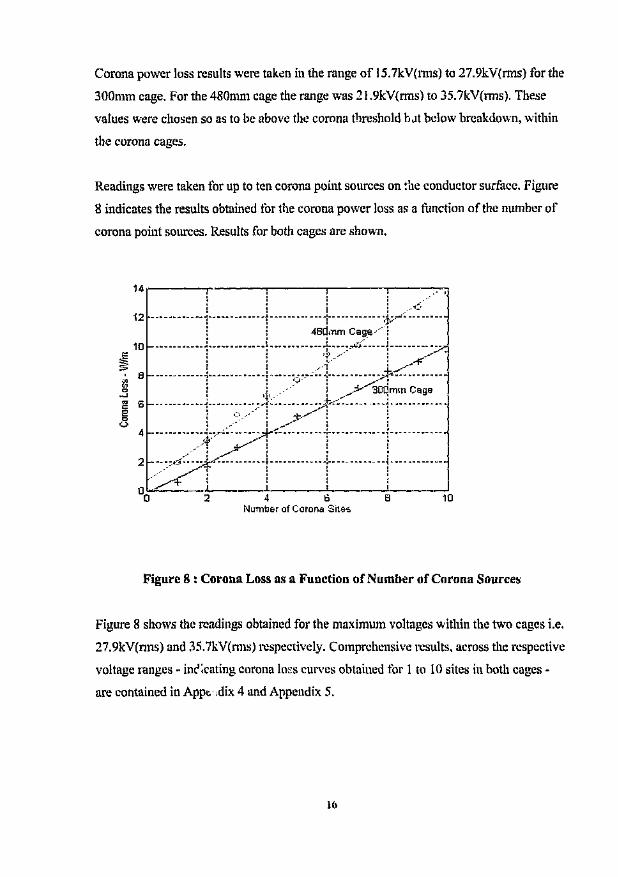
Corona power loss results were taken in the range of 15.7kV(I1115)to 27.9kV(nns) for the
300111111cage. For the 480mm cage the range was 21.9kV(rms) to 35.7kV(mls). These
values were chosen so as to be above the corona threshold b.it below breakdown, within
the corona cages.
Readings were taken for up to ten corona point sources on the conductor surface. Figure
8 indicates the results obtained tor the corona power loss as a function of tile number of
corona point sources. Results for both cages are shown.
12
10E~en 8<0'"...J'" 6c:::2'"(..)
4
2
00
14 -----r-----.------r----'----.----~-.,I , I I . -':'
~ _ .... w .... _ .... __ J .. .. .1 .. __ .. __ ....... __ .. ' __ .. __ .. ~ ~J .. .. __ .. __
: j 48Q,nm c~ge T.. _ __ '" '._ .. _ __ .. __ " .. __ .. __ .. __ .. __ .. 1_ __ .. _ __ __ ..
• '.' + - :. -~,'·r·-··- -..~ ...-,,--: . -. +_/...._.. -_ .. --- --1-""--" -- ....- ..-I'- -_ ..-~':~-.........-- -C"" -_ ..-- -...:-=,:"'::-T-__.. _.... _- .._-: ; ,- : .+" 300mm Cage..-_..-_..-_..-_~-....---__.._-,::r~---..-- ..-~~~;..~;..;.:-~-::.~-_- ~-.~J.---------_-
; jo/; :
-----------~-·t:'~.~~;-:.>t::·~-:-·-----"I'- - -- - -- - -- - -1- -- - - - --. ----:~.::;:_;;1::---.. ---·-i--·---- .. ---r------·----l·--------.--r 1...-_ . .
2 4 G 8 10Number of Corona SIt8S
Figure 8 : Corona Loss as a Function of Number of Corona Sources
Figure 8 shows the readings obtained for the maximum voltages within the two cages i.e.
27.9kV(n11s) and 35.7kV(rms) respectively. Comprehensive results, across the respective
voltage ranges - inr'icating corona loss curves obtained for 1 to 10 sites in both cages-
are contained in Appe .dix 4 and Appendix 5.
1(1
Maximum corona pover loss, obtained for the 300mm diameter cage at 27.9kV(nlls) was
9.63W, with ten ':010n" point sources on the (wHl"ctor surface. The corresponding
maximum loss; in thr 4S0m111diameter cage was 13.6.5W at 35.7kV(rms).
As can be seen, when the electric field magnitude is the same, in different diameter
corona cages. the corona power loss is significantly higher in the larger diameter cage
(Appendix 4 and 5).
A single measurement of audible noise was made per number of sites on the conductor
surface, for each cage. Measurements were made at the maximum voltages used for the
different cages i.e. each noise measurement was made at 27.9kV(rms) in the 300n1l11 cage
and each one at 35.7kV(rl11s) in the 480mn1 cage.
As indicated previously, the audible noise consists of a broad band component and low
frequency pure tones. The pure tone, at 100Hz, is distinctly higher in magnitude than
other frequencies (Appendix 6). Because the I ()()Hz HUIll value is ,0 distinct it was
decided to use only the magnitude of the sound wave idBA above 20~lPa) at this point as
representative of the audible noise from the COl ana point sources.
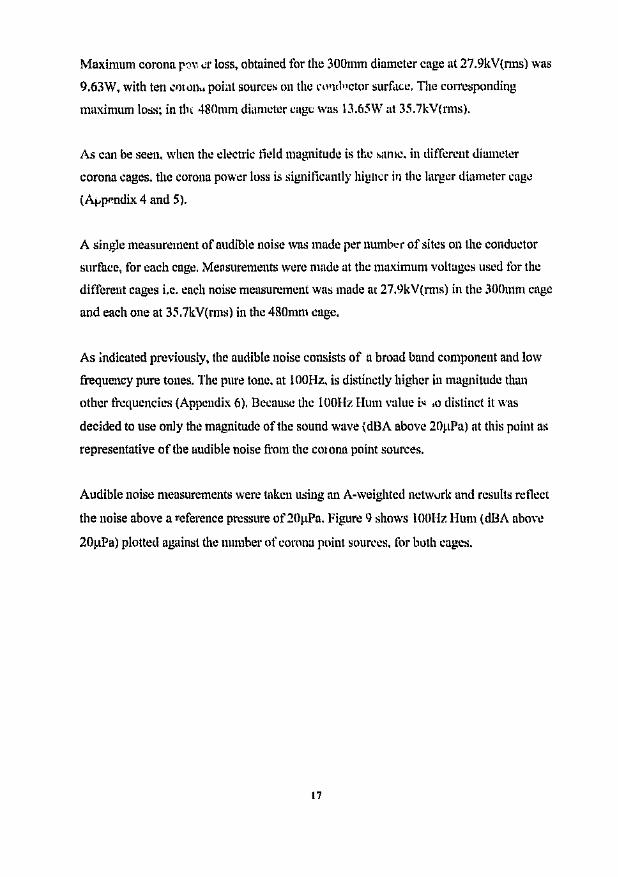
Audible noise measurements were taken using an A-weighted network and results reflect
the noise above a reference pressure of20~lPa. Figure 9 shows 100Hz Hum (dBA above
20~lPa) plotted against the number of corona point sources, for both cages.
17
~ 65::!C)('"""'4
~ 80-'"'co
!g 75
90 """ ...•.• ~ ~ .....• j .. , ·.. ·1· .:» ~,,"~i'::::·~'·'···l: : .: "480mrr Cage, 1 ._.. -- I ,~ _•••••;J;il::·~~;:f;'i~;;~tc·~.+·.·..
""'+""'~""""""':"""'-"'-T"-"'-"--':".- ., ., .
, I , I·_··-······:····_·······T···········r··_···-··'·r·····._.._..-~.._ -:-..~..-~.-.._ ": - - +::-..---..- i..-_..-..~- ..
1 3~ckground No!se i
en
:3 70z
60 .•... _. __-- .... --. ,----.-'.----" .--- .. ----.
.__ .l- __ .i-_
2 4__J___ ~i__----~
6810l~ur"b8r of Corona Sites
Figure 9 : 100Hz Hum (dBA above 20f.lPa) as a Function of Number of Corona
Sources
Figure 9 indicates the trend that the 100Hz Hum follows as the number of sites on the
conductor are increased.
The maximum 100Hz Hum obtained in the 300mm diameter cage was 86dBA -
corresponding to ten corona sites on the conductor surface. A maximum of 93dBA was
found in the 480111111diameter cage with nine corona point sources on the conductor
surface.
The background 100Hz Hum is also indicated on the plot. This value was obtained by
taking a noise measurement without the conductor, in the corona cage. energised. As can
be noted, the noise due to the corona is considerably louder than the background value.
Figure 10 and 11 show the 1OOH.,Hum (dBA above 10~lPa)plotted against the corona
power 1.0SS.
IS

Measurements of 100Hz Hum (dBA above 20~lPa) and corona power loss were taken at
voltages of 27.9kV(nlls) in the 300m111diameter cage and at 35.7kV(nns) in the 4~\(l111l11
diameter cage.
12
10
~8
.;,:g 6...J«sc[2<::> 4<,-,
2
~2
.~ n_____ ~ M_~_M_.·_~ ~ 4. ~ • _
! 1 1 : 1 ,~ 'f'-----~-----~.----~-----i-----~-----'~·- ~-----
l ~ : 1 ~ ,Q- "': ,
: : . . (~r , :....... - i' .......... i' " ........ ~......... i ...._.-~-...~....- - ..; ........ - ~..........
1 l L /t;: 1-----~-----r-----r -.- c·~·~r-----t - - - - . ~- - - . - t - - - - -: : .~....o : :
.. _ ...... L_ .. _ .. _L .. ~,_</:~.._......i......~..~....-....~..........i..........: : ~../(l; : : ; :
1 /~ : : : : :~,V • , , • , •
, , • L___l___~J_ _,_'_---'
~ m m 00 ~ M ffi ®1(JOH~Hurn· d8A ::ib(l'v~! :2tJUFI;:'I
Figure 10 : Least Squares Trend of Corona Loss as a Function of 100Hz Hum (dBA
above 20)lPa) - 300mm Corona Cage
. ,_ - - ~-.
'"c: : I :2 6 - - - - ~- - - -r --r ~'- -r ----r - - - -4 - - - - ~- - - -._,...:.:.- .... -;..- - - -\- ..- M -:- - .. - -
,..... I • I ,'0' •. - I • I I
2 ,- ~: i'----i- , , , , r - , - - i---,-i- - , , -o~--~--~--~----~--~--~--~--~~~ffi ro 00 m ~ ffi 00 00 ~ ~
100Hz Hum - dBA above 20uPa
- - - - ",- - - - -.. - - - ..,- .. - - -
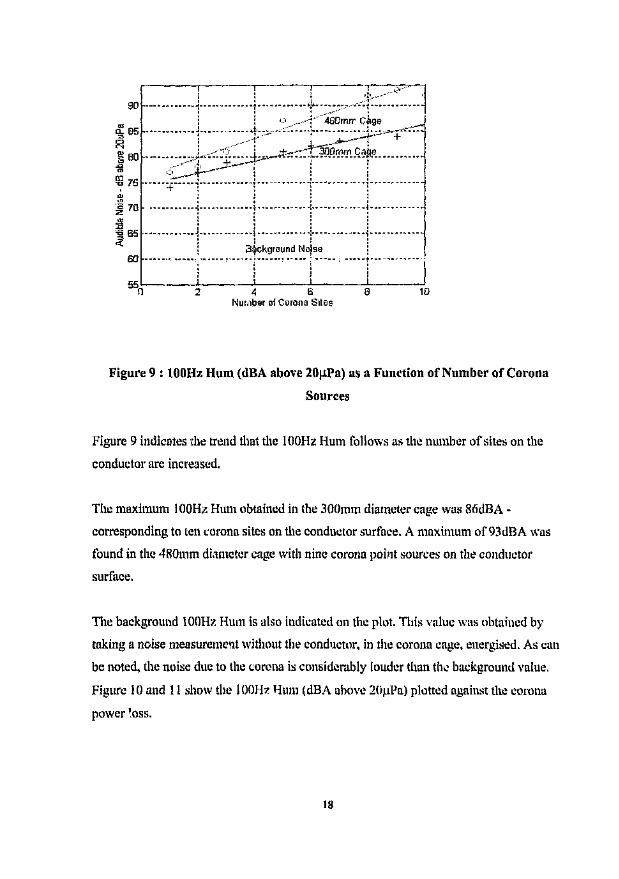
Figure 11 : Least Squares Trend of Corona Loss ,IS a Function of 100Hz Hum (dBA
above 20IlPa) - 480mm Corona Cage
The above plots indicate the trend followed by the two curves with a clearly linear
relationship evident between the two entities. Indeed, the correlation (Appendix 7) for the
300mm cage is r = 0.98 and for the 480111111cage is r = 0.95. There is thus a strong
positive relationship between the corona power loss and the 100Hz Hum.
The standard deviation, (Appendix 7) for the data, was also calculated and is giv, )Y
S = 2.9W/m for the 300null and S = 4.1 \VIm for the 480mm diameter cor01U1cage.
Sound pressure due to the corona varies inversely with the square root of distance away
from the line. i.c. for every doubling of distance the sound pressure decreases by .1dB (7).
Applying this theory to the results obtained yields the following:
20
Distance from line > 300mm (Microphone location for 300mm Cage)
.. Normalised distance for 480mm Cage :: ~~~ 0= 1.6
.. As the pressure varies with the inverse of the square root of distance away from the line we have:
[ l [. J2010g10
sound pressure '" 2010g10
. sound pressure _ 2 (dB)reference presssure x J1.6 lreference pressure
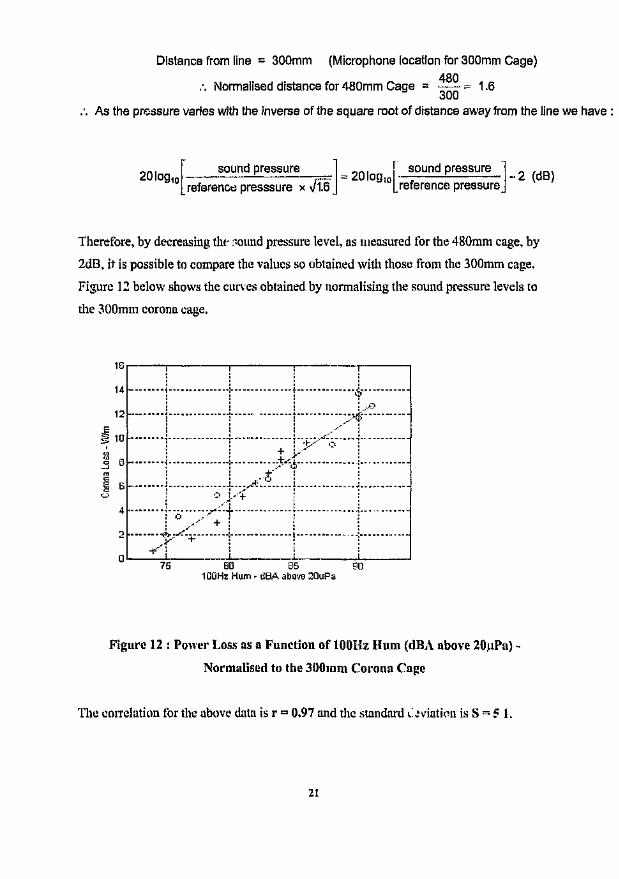
Therefore, by decreasing the sound pressure level, as measured for the 480111111cage, by
2dB, it is possible to compare the values so obtained with those from the 300m111cage.
Figure 12 below shows the curves obtained by normalising the sound pressure levels to
the 300mm corona cage.
16r-'--~--------~------~--------~-----'
14 .... , -- -.j .... ----------·i· --...... --.. -- j -----------. --~..._.-------I • • I .•.t)
12 ..~~~ -~.."M~"M" __ __ ;_ _M - -_ .. ~ ~ -_ .. - __~_~;-- .. -_ .. ~- .. --
~':·•••••••I•••·.•·••••••t ..•••:••£k<~~.!·.··•.•.j 6 -- .. L.---- .! ;.,+.:~r·'L --j --'0 4 ~,.j..:.~:::,~!,."+ I. .
2 ~' +. I .. ;-- .
o~ +~'·=:~ =:~ .__~:~__. lL- ~75 80 85 90
100Hz Hum- d8A above20uF'a
Figure 12 : Power Loss as a Function of 100Hz Hum (dBA above 20J.lPa)-
Normalised to the 300mm Corona Cage
The correlation for the above data is r =: 0.97 and the standard c.eviation is S =: ~ 1.
21
5) DISCUSSION OF RESULTS
Results obtained show clearly that the effects of corona increase with increasing corona
intensity. Corona power loss as a function of the number of corona point sources (Figure
8) follows this expected trend i.c, as the number of sources increases so too does the
corona power loss. Tile power loss trend curves obtained (Appendix 4 and 5), compare
favourably with results obtained in experiments of the same nature (8,9,1 7).
Similarly, the audible noise increases with an increase in the number of corona point
sources. The audible noise has been shown to consist of a high frequency component
which results in a crackling, frying or hissing noise (Appendix 6) (7). The second
component of the noise is a low frequency pure tone or 100Hz Hum (Appenuix 6). The
100Hz Hum was chosen as a representative value of audible noise due to the distinctness
of the noise at this frequency (Appendix 6).
Results are consistent with those found at Project UHV (7), at which tests were
performed in UHV corona cages. These data confirm that corona power loss and hU111 are
both caused by the cylindrical movement of ions in the electric field of the conductors.
The larger the number of ions, the larger will be both the power dissipated by their
movement and the variation in air pressure caused by their movement (7).
An excellent correlation was found between the corona power loss and 100Hz Hum.
From the calculation ofthe standard deviat :\ is evident that the corona loss data is not
spread over a wide range of values. Inste .: corona power loss increases in an
orderly, linear fashion as the audible noise increases.
From the curve showing values normalised to the 3()Ol1ltllcage (Figure 12) it is evident
that from knowledge of the audible noise on the line a reasonably accurate prediction of
the corona power loss can be determined.
22
Thus the experimental data, obtained using a corona test cage facility, can be used to
predict the corona power loss from a transmission line from a knowledge ofthe audible
noise, produced by the corona.
Although good results have been obtained under laboratory conditions, the tests need to
be further extended to include transmission lines, It is envisaged that, in the field, a
measure of the 100Hz Hum can be obtained by placing a microphone underneath a line in
service and then, by usc of an appropriate correction factor, as deduced from corona cage
testing, an aceurate prediction of the corona power loss can be made.
Results investigating the applied voltage and corona power loss relationship were based
on the use of the two different size corona cages. However. in practice, a single corona
test cage facility is usually used to test various conductor configurations (2,5,19). In the
case of the single cage test facility all test lines arc energised to a single value of electric
field, which is chosen to be below the fair weather corona inception field. Lines are then
artificially sprayed with water, simulating rain, and corona related measurements arc
taken.
A fixed electric fielu value is therefore chosen and all conductors are designed to operate
below this field strength. However, when testing dissimilar geometries in the same
corona cage, possibly also operating at different service voltages, it would be possible to
energise the different test lines with the same voltage, in order to obtain the pre-chosen
electric field.
Results obtained from this project have clearly shown that for the same electric field, and
consequently the same corolla current, the corona power loss is proportional to the
applied voltage i.e, at the same electric field, in different diameter corona cages, the
power loss is greater in the cage of larger diameter.
Corona power loss results for single test cage facilities, using different conductor
configurations, could thus yield the same corona power loss at the sallie electric fie Ill,
provided the same voltage is used to energize the line.
It is of importance to realize that similar test results can therefore be obtained for totally
different conductor configurations, even for lines operating at different service voltages.
This illustrates the importance of the use of conversion factors such as generation
quantities (6) for single corona cage test facilities, in order to obtain values which
approximate practical conditions.
24
6) CONCLUSiONS
Results have indicated that corona power loss, at equivalent electric field magnitudes in
different diameter corona cages. is proportional to the voltage applied to the conductor.
This indicates that loss can be scaled with voltage. for similar geometries, provided the
conductor surface fields remain the same. At equivalent electric fields, in different
diameter corolla cages. the corona current is comparable in magnitude and was measured
to within 5~o.
Single corona cage test facilities, testing dissimilar geometries which possibly also
operate at different service voltages, must ensure the usc of conversion factors such as
generation quantities in order to produce meaningful results.
Corona power loss and 100Hz Hum (dBA above 20~lPa) both increase with increasing
corona intensity i.e. as the voltage applied to the conductor increases so too does the
corona activity. Also, both entities increase as the number of corona point sources on the
conductor surface is increased.
It has been shown that, for a single phase corona cage. a linear empirical relationship
exists between corona power loss and 100Hz Hum. The statistical correlation between
corona power loss and 100Hz Hum (dBA above 20IlPa) was found to be r =: 0.98 and
r = 0.95 for the respective test cages, and r = 0.97 for results normalized to a single test
cage. Therefore, with suitable calibration. 100Hz - twice power frequency - Hum (dBA
above 20pPa) can be used to estimate corona power loss.
25
REFERENCES
1) Bartnikas R, McMahon EJ (1979). "Engineering Dielectrics VoU - Corona
Measurement and Interpretation", American Society for Testing and Materials, ASTM
Special Technical Publication 699, STP 699.
2) Brittan AC, Clarke EG, Konkel HE (1987). "Radio interference, corona losses, audible
noise and power frequency electric fields as factors in the design of Eskom 's 765kV
lines", Paper 3, Cigre Open Conference on EHV Transmission Systems. Johannesburg,
pp 3.1- 3.13.
3) Clade JJ, Gary CH (1970). "Predetermination of corona losses under rain:
Experimental interpreting and checking ofa method to calculate corona losses", IEEE
Trans. on Power apparatus and Systems, Vol. PAS 89, No 5/6.
4) Comber MG, Carberry RE, Chartier VL, Maruvada PS, Stewart JR (1982). "A
comparison of methods for calculating audible noise of high voltage transmission lines",
IEEE Trans. on Power Apparatus and Systems. Vol PAS-l 0 1, No.1 O.
5) Comber MG, Zaffanella (1973). "The use of single-phase overhead test lines and test
cages to evaluate the corona effects ofEHV and UHV transmission lines", IEEE Trans.
Paper T 73376-1 presented at IEEE PES Summer Meeting, Vancouver, B.C., Canada.
6) Comber MG, Zaffanella LE, Dena DW. "Transmission line reference book - 345 kV
and above. Chapter 4 - Corona phenomena on AC transmission lines", PI1169-204.
7) Comber MG, Zaffanella LE, Nigbor RJ. "Transmission line reference book - 345 kV
and above. Chapter 6 - Audible Noise", pp 267-318.
8) Comber MG, Zaffanella LE. "Transmission line reference book - 345 kV and above.
Chapter 7 - Corona Loss", PP 319-328.
9) Giao TN, Jordan JB (1968). "Modes of Corona Discharges in Air", IEEE Trans.on
Power Apparatus and Systems, Vo PAS-87. No.5. pp 1207-1215.
10) Heymann FG (1965). "Corona on wires in air", Trans, of SAlEK Vol. 56, Part 11.
11) Heymann FG (1966). "Corona on conductor bundles". Trans. of SAIEE. Vol. 57.
Part 11.
12) Heymann FG (1966). "Geleierbundels vir transmissielyne", Trans. of SAIEE, Vol.
57, Part 5.
13) Ianna F, Wilson GL, Bosack DJ (1973). " Spectral chracteristics of acoustic noise
from metallic protrusions and water droplets in high electric fields", IEEE Trans. Paper C
73 164-1 presented at IEEE PES Winter Meeting, Ne'WYork, N.Y.
14) Kirkham HiGajda WJ (i983). "A mathematical model of transmission line audible
noise. Part 1 and 2.", IEEE Trans. on Power Apparatus and System:', Vol PAS-I02. No.3.
15) Loeb LB (i965). "Electrical Coronas", Berkeley and Los Angeles University of
California ; ress.
16) Macfarlane J, Nku M (1994). "The measurement of power loss caused by corona
discharges on metallic hardware". University of the Witwatersrand. Department of
Electrical Engineering. Project No. 46P94.
17) Swift DA, Rodgerson JL. Brittan AC (1995). "Corona power loss from sharply
pointed components of transmission plant", Southern African Universities Power
Engineering Conference, Supplement to the Proceedi.igs of the Fifth Conference.

18) Vinh T, King JV (1987). "Stati : I analysis of audible noise and corona loss data
for a 10 conductor UHV bundle" ':'.FI nns. on Power Delivery. Vol. PWRD-2, No.I.
19) Vinh T, Shih CH, King JV, Roy WR (1985). "Audible Noise and Corona Loss
Performance of9-Conductor Bundle for UHV Transmission Lines", IEEE Trans. on
Power Apparatus and Systems. Vol. PAS-I04, No.IO, pp 2764-2770.
20) Maxwdl3D Field Simulator. Ansoft Corporation. Four Station Square, Suite 660.
Pittsburgh, PA 15219, Dec.1993.
21) MATLABTM for \lindows™ Ver. 4.2.c : The Mathworks, 21 Eliot Street, South
Natick. MA 01760, Oct 1994.

Author: Engelbrecht, Michael Sean.Name of thesis: Relationship between corona power loss and corona initiated audible noise.
PUBLISHER:University of the Witwatersrand, Johannesburg©2015
LEGALNOTICES:
Copyright Notice: All materials on the Un ive rs ity of th e Witwa te rs ra nd, J0 han nesb u rg Li b ra ry websiteare protected by South African copyright law and may not be distributed, transmitted, displayed or otherwise publishedin any format, without the prior written permission of the copyright owner.
Disclaimer and Terms of Use: Provided that you maintain all copyright and other notices contained therein, youmay download material (one machine readable copy and one print copy per page)for your personal and/oreducational non-commercial use only.
The University of the Witwatersrand, Johannesburg, is not responsible for any errors or omissions and excludes anyand all liability for any errors in or omissions from the information on the Library website.