louisiana electric generation and … electric generation and distribution utilities ... louisiana...
TRANSCRIPT

LOUISIANA ELECTRIC GENERATION AND DISTRIBUTION UTILITIES
AN UPDATED (2002) TABULATION OF LOUISIANA’S ELECTRIC POWER GENERATION FACILITIES
With
A COMPANION TABULATION OF INDEPENDENT POWER PRODUCER (IPP)
AND COGENERATION FACILITIES
Prepared by Bob Sprehe
THE TECHNOLOGY ASSESSMENT DIVISION
T. Michael French, P. E. Director William J. Delmar, Jr. P. E. Assistant Director
LOUISIANA DEPARTMENT OF NATURAL RESOURCES
SCOTT A. ANGELLE
SECRETARY
Baton Rouge June, 2005
This issue of Louisiana Electric Generation and Distribution Utilities, (2002) is funded 100% ($ ) with Petroleum Violation Escrow Funds as part of the State Energy Conservation Program as approved by the U. S. Department of Energy and the Department of Natural Resources. This public document was published at a total cost of $ . 100 copies of this public document were published in this first printing at a total cost of $ . the total cost of all printings of this document, including reprints is $ . This document was published by the Department of Natural Resources, P. O. Box 44156, Baton Rouge, LA 70804-4156, to promulgate the State Energy Conservation Plan developed under authority of P. L. 94-163. This material was printed in accordance with the standards for printing by state agencies pursuant to R. S. 43:31.

TABLE OF CONTENTS
LOUISIANA ELECTRIC GENERATION AND DISTRIBUTION UTILITIES
VOLUME 1 UPDATE (2002)
Page no. LIST OF TABLES ii LIST OF FIGURES iii LIST OF EXHIBITS iv ABBREVIATIONS AND CODES v - ix
DISCUSSION 1 - 12 EXHIBITS I Alphabetical Listing of Electric Power Distribution and Generation Utilities and Cogeneration Facilities in Louisiana (2002) 13 - 20 II Electricity Distribution Utilities in Louisiana (2002) 21 - 27 III Investor Owned Utilities in Louisiana (2002) 28 - 33 IV Publicly Owned Utilities in Louisiana with Generation Facilities (2002) 34 - 43 V Cogeneration Facilities in Louisiana (2002), Capacity and Energy Source 44 - 49 VI Cogeneration Facilities in Louisiana (2002), Age and Type Cogeneration 50 - 55 VII Jointly Owned Jointly Owned Electric Generating Plant in Louisiana (2002) 56 VIII Louisiana 2002 Net Generation by Type of Producer and Energy Source 57 - 58
i
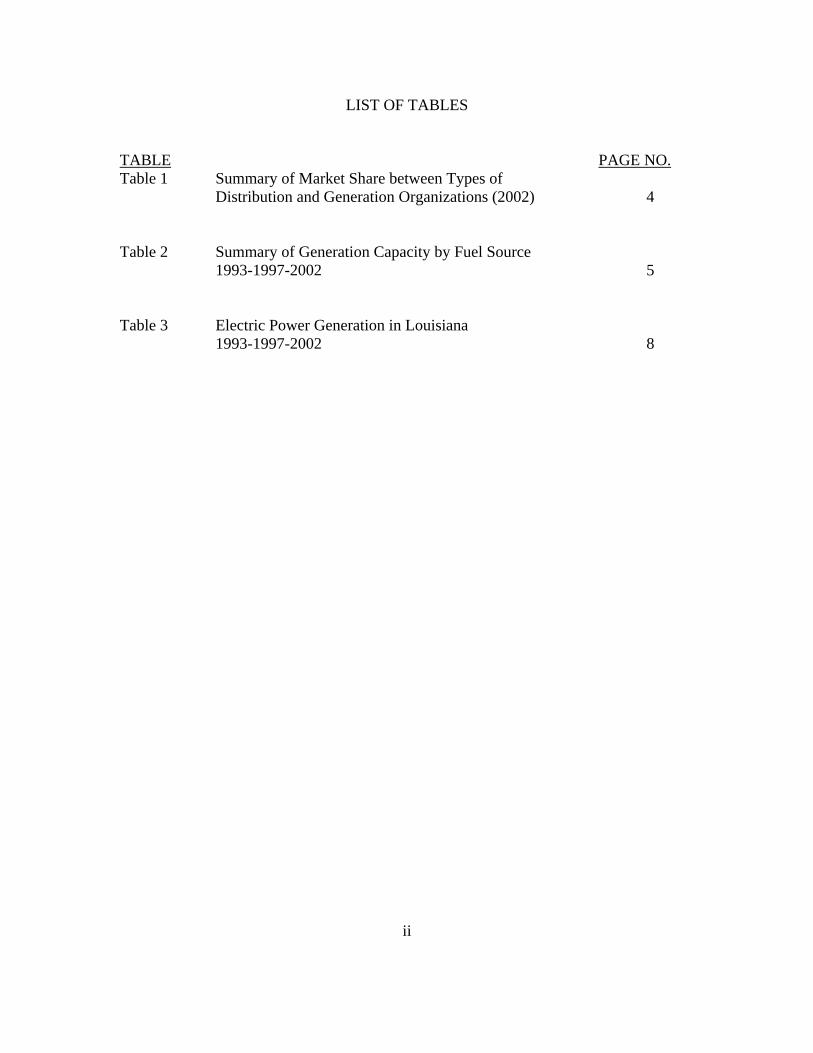
LIST OF TABLES
TABLE PAGE NO. Table 1 Summary of Market Share between Types of
Distribution and Generation Organizations (2002) 4
Table 2 Summary of Generation Capacity by Fuel Source 1993-1997-2002 5 Table 3 Electric Power Generation in Louisiana 1993-1997-2002 8
ii

LIST OF FIGURES
FIGURE PAGE NO. Figure 1 The Importance of Electricity to the Nation 2 Figure 2 The Importance of Electricity to the State of Louisiana 3 Figure 3 Schematic of Electric Power Generation in Louisiana 3 Figure 4 Schematic of Electric Power Distribution in Louisiana 4 Figure 5 The Majority of IPP and Cogeneration Capacity has
come on stream in the past 10 years 6.
Figure 6 An Aging Generation Plant in Louisiana’s Mainstay Utilities 6 Figure 7 An Aging Generation Plant among Publicly Owned Capacity 7 Figure 8 Louisiana Energy and Power Authority (LEPA) Member Cities 10 Figure 9 Louisiana Service Areas: Investor Owned Distribution Areas 11 Figure 10 Louisiana Service Areas: Association of Electric Cooperative
Distribution Areas 12
iii

LIST OF EXHIBITS
EXHIBITS PAGE NO. Exhibit I Alphabetical Listing of Electric Power Distribution and Generation Utilities and Cogeneration Facilities in Louisiana (2002) 12 - 19 Exhibit II Electricity Distribution Utilities in Louisiana (2002) 20 – 26 All Sectors 20 - 21 Industrial 22 - 23 Commercial 24 - 25 Residential 26 Exhibit III Investor Owned Utilities in Louisiana (2002) 27 – 32 Summary 27 CLECO 28 Entergy Gulf States 29 Entergy Louisiana 30 Entergy New Orleans 31 SWEPCO 32 Exhibit IV Publicly Owned Generation Plant 33 – 42 Summary 33 City of Alexandria 34 City of Lafayette 35 City of Minden 36 City of Morgan City 37 City of Natchitoches 38 City of Rayne 39 City of Ruston 40 Terrebonne Parish 41 LEPA 42 Exhibit V Cogenerators, Capacity and Energy Source 44 – 49 Exhibit VI Cogenerators, Plant Age, Type of Cogeneration 50 – 54 Exhibit VII Jointly Owned Utility Plant 56 Exhibit VIII Louisiana 2002 Net Generation By Type of Producer
and Energy Source 57-58
iv

ABBREVIATIONS AND NUMERIC CODES USED IN EXHIBITS
TYPE OF ELECTRIC POWER GENERATION
Sector Codes and Names
Sector Number Sector Name Explanation
1 Electric Utility Traditional regulated electric utility 2 NAICS-22 Non-Cogen Independent power producers which are not cogenerators 3 NAICS-22 Cogen Independent power producers which are cogenerators, but whose
primary business purpose is the sale of electricity to the public
4 Commercial NAICS Non-
Cogen Commercial non-cogeneration facilities that produce electric power are connected to the grid, and can sell power to the public
5 Commercial NAICS Cogen Commercial cogeneration facilities that produce electric power, are connected to the grid, and can sell power to the public
6 Industrial NAICS Non-Cogen Industrial non-cogeneration facilities that produce electric power, are connected to the grid, and can sell power to the public
7 Industrial NAICS Cogen Industrial cogeneration facilities that produce electric power, are connected to the grid, and can sell power to the public
v.
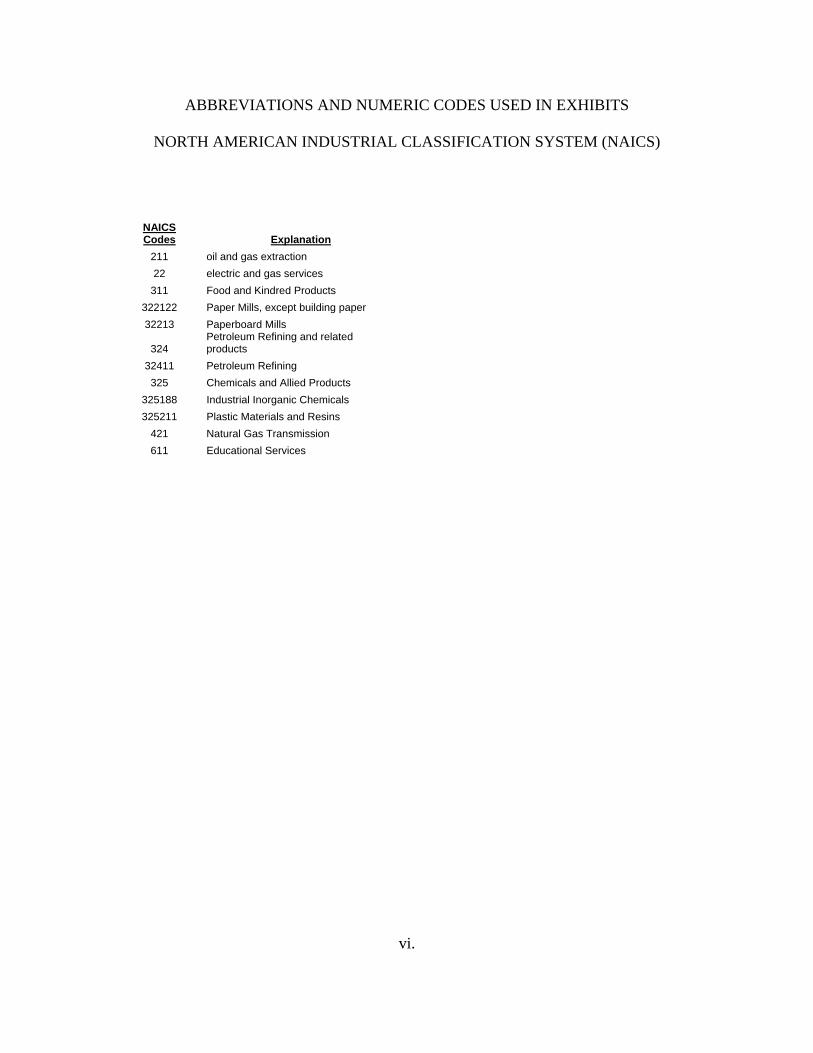
ABBREVIATIONS AND NUMERIC CODES USED IN EXHIBITS
NORTH AMERICAN INDUSTRIAL CLASSIFICATION SYSTEM (NAICS)
NAICS Codes Explanation
211 oil and gas extraction 22 electric and gas services
311 Food and Kindred Products 322122 Paper Mills, except building paper 32213 Paperboard Mills
324 Petroleum Refining and related products
32411 Petroleum Refining 325 Chemicals and Allied Products
325188 Industrial Inorganic Chemicals 325211 Plastic Materials and Resins
421 Natural Gas Transmission 611 Educational Services
vi.

ABBREVIATIONS AND NUMERIC CODES USED IN EXHIBITS
TYPE OF COGENERATION PRIME MOVER
Prime Mover Type Description
ST Steam turbine, including nuclear, geothermal, and solar steam (does not include combined cycle) GT Combustion (gas) Turbine includes jet engine design) IC Internal Combustion (diesel, piston) Engine CT Combined Cycle Combustion—Turbine part CA Combined Cycle—Steam part CS Combined Cycle Single Shaft (combustion turbine and steam turbine share a single generator) HY Hydraulic Turbine (includes turbines associated with delivery of water by pipeline) PS Hydraulic Turbine—Reversible (pumped storage) PV Photovoltaic WT Wind Turbine CE Compressed Air Energy Storage FC Fuel Cell OT Other
vii.

ABBREVIATIONS AND NUMERIC CODES USED IN EXHIBITS
ENERGY SOURCE CODES Fuel Energy Source Code Units Description
Fossil Fuels
Coal and Synfuel BIT tons Anthracite Coal and Bituminous Coal
LIG tons Lignite Coal SUB tons Sub-bituminous Coal WC tons Waste/Other Coal (includes anthracite culm,
bituminous gob, fine coal, lignite waste, waste coal)
SC tons Coal-based Synfuel, including briquettes, pellets, or extrusions, which are formed by binding
materials or processes that recycle materials
Petroleum Products DFO barrels Distillate Fuel Oil (Diesel, No. 1, 2, and 4 Fuel Oils
JF barrels Jet Fuel KER barrels Kerosene PC tons Petroleum Coke
RFO barrels Residual Fuel Oil (No. 5, 6, and Bunker C Fuel Oil)
WO barrels Waste/Other Oil (including Crude Oil, Liquid Butane, Liquid Propane, Oil Waste, Re-Refined
Motor Oil, Sludge Oil, Tar Oil, or
other petroleum based liquid wastes) Natural Gas and other Gases NG Mcf Natural Gas
BFG Mcf Blast Furnace Gas OG Mcf Other Gas PG Mcf Gaseous Propane
Nuclear
Nuclear NUC N/A Nuclear Fission (Uranium, Plutonium, Thorium)
Renewable Fuels Solid Renewable Fuels AB tons Agricultural Crop Byproducts/Straw/Energy Crops MSW tons Municipal Solid waste OBS tons Other Biomass Solids TDF tons Tire-derived Fuels WDS tons Wood/Wood Waste Solids (paper pellets, railroad ties, utility poles, wood chips, bark, and other wood waste solids) Liquid Renewable (Biomass) Fuels OBL barrels Other Biomass Liquids (specify) BLQ tons Black Liquor SLW tons Sludge Waste
WDL barrels Wood Waste Liquids excluding Black Liquor (BLQ)
(includes red liquor, sludge wood, spent sulfite
viii liquor, and other wood based liquids)
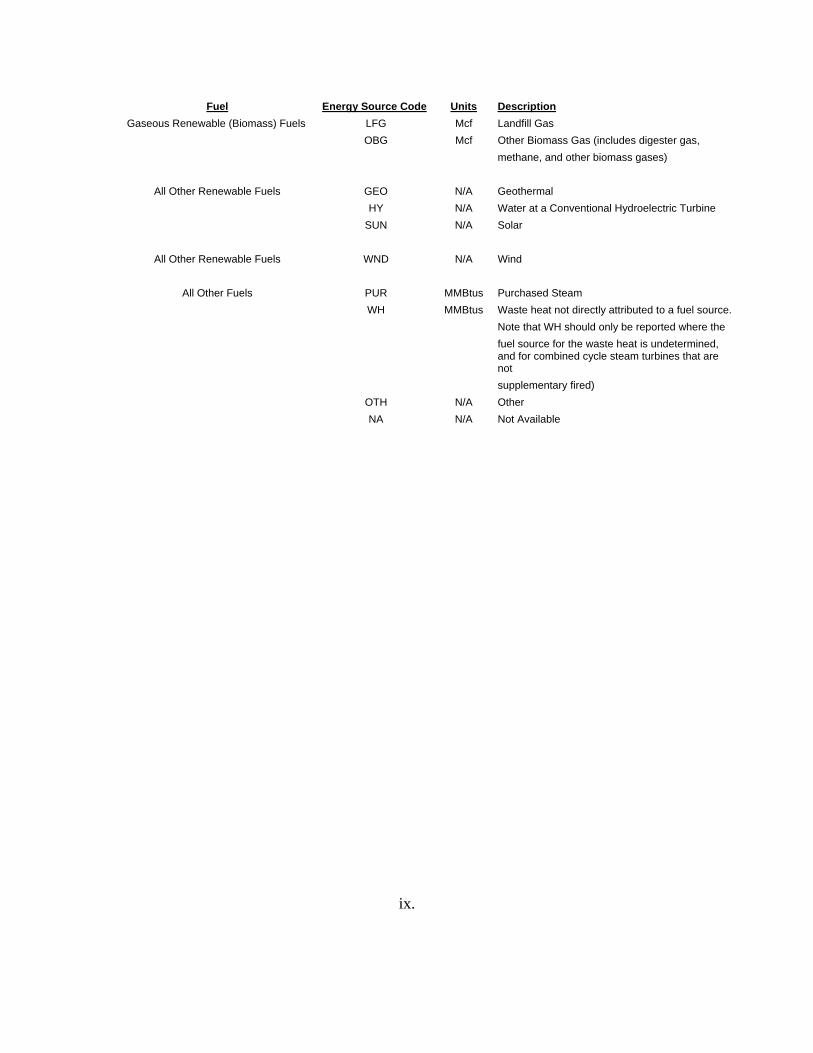
Fuel Energy Source Code Units Description Gaseous Renewable (Biomass) Fuels LFG Mcf Landfill Gas OBG Mcf Other Biomass Gas (includes digester gas,
methane, and other biomass gases)
All Other Renewable Fuels GEO N/A Geothermal HY N/A Water at a Conventional Hydroelectric Turbine SUN N/A Solar
All Other Renewable Fuels WND N/A Wind
All Other Fuels PUR MMBtus Purchased Steam WH MMBtus Waste heat not directly attributed to a fuel source. Note that WH should only be reported where the fuel source for the waste heat is undetermined,
and for combined cycle steam turbines that are not
supplementary fired) OTH N/A Other NA N/A Not Available
ix.
1
Louisiana Electric Generation and Distribution Utilities
An Updated (2002) Tabulation of Louisiana’s Electric Power Generation Facilities
With A Companion Tabulation of Independent Power Producers (IPPs)
and Industrial Cogeneration Facilities as of 2002
Discussion In 1994, 2 years following passage of the Energy Policy Act of 1992 (EPACT92), the Technology Assessment Division of the Department of Natural Resources (DNR) published a tabulation of Louisiana’s electric power generation firms, their early history, development, and status. That document was entitled “Louisiana Electric Utilities, Volume 1”. It would be an understatement to say that the electric power generation sector of the economy is suffering “convulsions” from the restructuring initiative unleashed by EPACT92. The subsequent patchwork of individual state Public Service Commission (PSC) regulatory actions, that have been adopted across the nation have left the country with a stalled deregulation initiative, a significant financial commitment to new natural gas power generation technology, a volatile natural gas price regime, natural gas supply uncertainty, huge financial write downs of power generation investments on the balance sheets of both regulated and unregulated firms, power blackouts that affect regions of states not just community localities, criminal behavior and market collusion among some power trading and marketing companies, bankruptcies of utilities, criminal indictments of corporate utility executives, the near bankruptcy of the State of California, soaring electric power prices, some states requiring disaggregating of integrated firms, some states allowing integrated operations, renewed dialogue about the environmental viability of coal and nuclear power generation in the nation’s future, a significant downgrading of the credit quality of the nation’s utilities in general, a disagreement between state PSCs and the Federal Energy Regulatory Commission (FERC) over regulation of transmission of electric power, who should regulate siting of new transmission facilities, and on and on. Needless to say any updated tabulation of electric power generation utilities is a “work in progress” under these situations. For example, since the publication of the 1994 report Cajun Electric Power Generation and Transmission Cooperative was placed in bankruptcy, eventually sold to an investor owned utility, that subsidiary then declared bankruptcy, and the units were again sold to other operators. CLECO expanded into IPP investments, encountered financial difficulties, and has now sold some of the IPP operations. Entergy expanded internationally and is now disposing of many of those assets. Cogeneration of electric power by industrial firms, both for internal process plant use and for the sale of excess power into the market, has grown rapidly since EPACT92. But now the volatility of natural gas prices, and the apparent uncertainty of domestic

2
natural gas supply, has driven many plants, particularly those utilizing natural gas in their processes, out of business here in the U.S. and toward relocation overseas where natural gas supply and labor are less costly. With so much electric power generation dependent on natural gas supply to IPPs and cogen facilities, both in Louisiana and nationally, the dependability of electric power generation becomes a legitimate public policy issue for the consuming public. Planning and financing of coal and nuclear fired power generation, to replace natural gas as a source of power generation, requires many years of preparation. In this update we tabulate the electric utilities and the cogeneration facilities available in the state as of 2002. All of this data was secured from the web site (http://www.eia.doe.gov) of the Energy Information Administration (EIA). Given the rate of change in the power generation sector even this data is a work in progress. Publication of actual generation data lags by several months, and is the subject of revision as respondents complete their filing requirements. In subsequent reports scheduled for 2004-2005, the Technology Assessment Division will address in more detail the previously enumerated issues (page 1) that are arising from the stalled deregulation initiative that followed enactment of EPACT92, as well as any subsequent legislation or regulation that may ensue. As of the end of June, 2004, new energy legislation has been stalled in the Congress of the United States. The issues become more complex the longer they remain unaddressed.
Figure 1 The Importance of Electricity to the Nation
The Nation's Economy is Dependent on a Dependable and Stable Supply of Electricity to Raise Living Standards (1990-2003)
y = 3.8401x - 4680.3R2 = 0.9833
$0
$2,000
$4,000
$6,000
$8,000
$10,000
$12,000
2,500 2,700 2,900 3,100 3,300 3,500 3,700 3,900 4,100
Billions kilow atthours (kw h)
Rea
l $20
00 G
DP
Source: Bureau of Economic Analysis; EIA ELECTRICITY GENERATION DATA

3
Figure 2
The Importance of Electricity to the State of Louisiana
Availablity of Electricity is Critical for State Economic Growth and Rising Living Standards (1990-2001)
y = 0.0015x + 9348.5R2 = 0.8161
$0
$20,000
$40,000
$60,000
$80,000
$100,000
$120,000
$140,000
55,000,000 60,000,000 65,000,000 70,000,000 75,000,000 80,000,000 85,000,000
Megawatthours Consumption in Louisiana
Gro
ss S
tate
Pro
duct
$M
M19
96
The Organization of Generation and Distribution in Louisiana
Louisiana’s investor owned and publicly owned utilities both generate and distribute electric power to the consumer. Prior to its bankruptcy filing, Cajun Generation and Transmission (G&T) Coop served its distribution cooperatives. The survivor entity to Cajun now serves as an IPP. The cooperative distribution entities remain as distribution utilities within Louisiana. As in most industrial states, cogeneration of both heat for processes and power generation for internal consumption, as well as for sale to the transmission network, has become more economic with rising natural gas prices. In 2002 nearly 42% of generating capacity in the state came from IPPs and cogen.
Figure 3 Schematic of Electric Power Generation in Louisiana
Source: Bureau of Economic Analysis; EIA ELECTRICITY GENERATION
Louisiana Electric Power Generation
Investor Owned Generation
Publicly Owned Generation
Independent Power Producer and Combined
Heat and Power Generators

4
Figure 4
Schematic of Electric Power Distribution in Louisiana
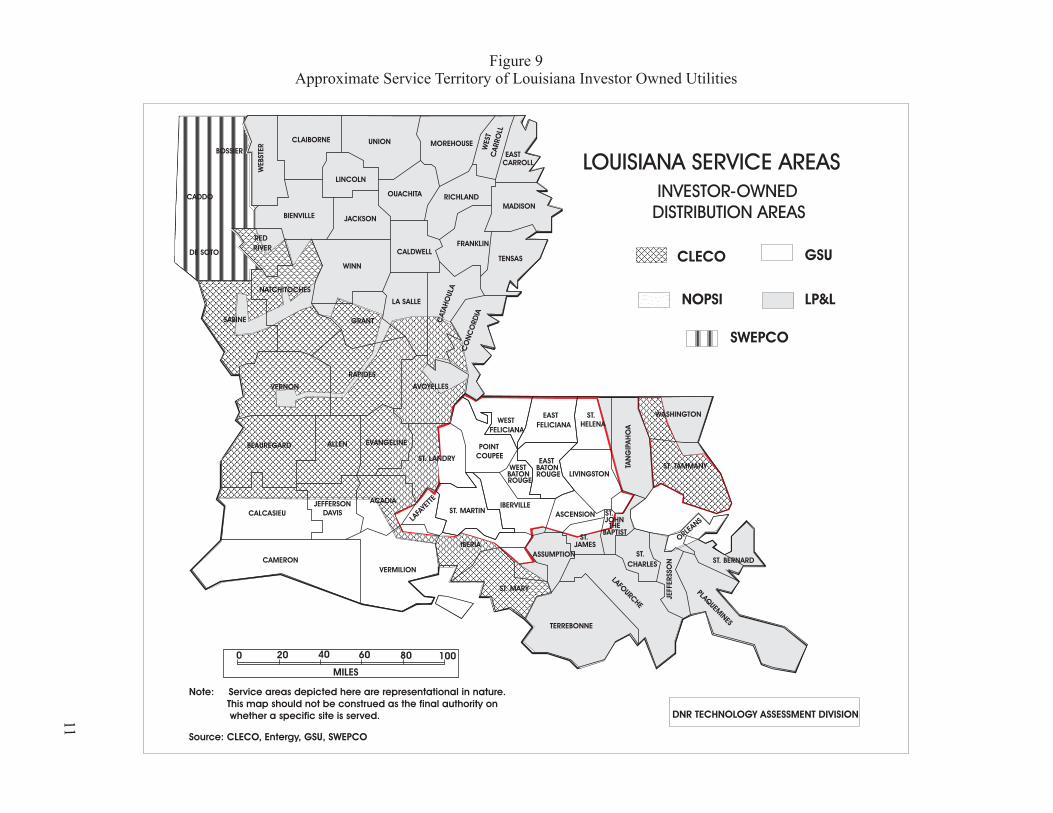
Investor owned utilities continue to dominate the Louisiana market place with nearly 75% of the customers, 85% of power sales, and 55% of the electric power generation facilities.
Table 1 Summary of Market Share between Types of Distribution and Generation Organizations
(2002)
Distribution & Generation Distribution & Generation % Number of Revenue Sales Generating Number of Revenue Sales Generating
Consumers ($000's) (000 kwh) Capacity
MW Consumers Capacity Investor-Owned 1,598,991 $4,000,861 67,844,289 14,134.8 75.75% 84.29% 85.60% 55.16% Cooperative 359,391 $477,054 7,233,854 0.0 17.03% 10.05% 9.13% 0.00% Publicly Owned 152,386 $268,485 4,182,846 822.0 7.22% 5.66% 5.28% 3.21% IPPs, Cogen 0 0 0 10,667.6 0 0 0 41.63% 2002 Totals 2,110,768 $4,746,400 79,260,989 25,624.4 100.00% 100.00% 100.00% 100.00%
Source: EIA ELECTRICITY GENERATION DATA Natural gas retains its role as the dominant source of fuel for electric power generation in the state. Natural gas provides 40% of the aggregate electric generating capacity, and up to 75% when dual fuel capacity is considered. Most dual fuel capacity power generation combines the ability to interchange distillate or diesel fuel, and natural gas. Natural gas, of course, dominates the IPP and cogeneration applications.
Louisiana Electric Power Distribution
Investor Owned Distribution
Publicly Owned Distribution
Cooperative Electric Power Distribution

5
Table 2
Summary of Generation Capacity by Fuel Source
Annual
Growth
Rate 1993-2002 % Share 1993 1997 2002 % 1993 1997 2002 Coal 3,343 3,453 1,723 -7.1 17.00% 16.90% 6.70% Petroleum 16 16 16 0.0 0.10% 0.10% 0.10% Natural Gas 1,811 1,910 1,735 -0.5 9.20% 9.40% 6.80% Dual Fired 9,709 9,689 8,689 -1.2 49.50% 47.50% 33.90% Nuclear 2,006 2,011 2,071 0.4 10.20% 9.90% 8.10%
Total Electric Utilities 16,885 17,079 14,233 -1.9 86.00% 83.70% 55.50% Coal 8 8 1,730 81.8 0.00% 0.00% 6.70% Petroleum 0 6 46 NM 0.00% 0.00% 0.20% Natural Gas 1,652 2,285 8,724 20.3 8.40% 11.20% 34.00% Other Gases 10 27 62 22.7 0.10% 0.10% 0.20% Dual Fired 378 290 451 2.0 1.90% 1.40% 1.80% Hydroelectric 182 182 192 0.6 0.90% 0.90% 0.70%
Other
Renewables 487 517 170 -11.0 2.50% 2.50% 0.70% Other 21 21 24 1.6 0.10% 0.10% 0.10%
Total IPPs & Combined 2,739 3,337 11,399 17.2 14.00% 16.30% 44.50% Heat & Power Coal 3,351 3,461 3,453 0.3 17.10% 17.00% 13.50% Petroleum 16 22 62 16.2 0.10% 0.10% 0.20% Natural Gas 3,463 4,195 10,458 13.1 17.60% 20.50% 40.80% Other Gases 10 27 62 22.7 0.10% 0.10% 0.20% Dual Fired 10,087 9,980 9,140 -1.1 51.40% 48.90% 35.70% Nuclear 2,006 2,011 2,071 0.4 10.20% 9.90% 8.10% Hydroelectric 182 182 192 0.6 0.90% 0.90% 0.70%
Other
Renewables 487 517 170 -11.0 2.50% 2.50% 0.70% Other 21 21 24 1.6 0.10% 0.10% 0.10%
Total Electric Industry 19,624 20,416 25,633 3.0 100.00% 100.00% 100.00% Source: EIA ELECTRICITY GENERATION DATA

6
Figure 5
The Majority of IPP and Cogen Capacity (nearly 45%) has come on stream in the past 10 years.
The Majority of Cogen Capacity in Louisiana is Less Than 10 Years in Age
0%5%
10%15%20%25%30%35%40%45%50%55%60%
0-10 21 - 30 21-30 31-40 41-50 >50
Age, Category of Years
% o
f Cog
en C
apac
ity
Age of Cogen Facility
Source: EIA ELECTRICITY GENERATION DATA However, the same cannot be said for the investor and publicly owned utilities (nearly 55% of generating capacity). Nearly 80% of the investor owned capacity is over 20 years in age; and nearly 95% of the publicly owned capacity is over 20 years in age.
Figure 6 An Aging Generation Plant in Louisiana’s Mainstay Utilities
Nearly 80% of Louisiana's Investor Owned Utility Generating Capacity is over 20 Years in Age
0%
5%
10%
15%
20%
25%
30%
35%
40%
0-10 21 - 30 21-30 31-40 41-50 >50
Age, Category of Years
% o
f Gen
erat
ing
Capa
city
Utility Plant Age
Source: EIA ELECTRICITY GENERATION DATA

7
Figure 7 An Aging Generation Plant among Publicly Owned Capacity
Nearly 95% of Louisiana's Publicly Owned Utility Plant Exceeds 20 Years in Age
0%5%
10%15%20%25%30%35%40%45%50%55%
0-10 21 - 30 21-30 31-40 41-50 >50
Age, Category of Years
% o
f Gen
erat
ing
Plan
t Cap
acity
Publicly Owned Utility Plant Age
Source: EIA ELECTRICITY GENERATION DATA Generation of Electric Power In the aggregate, 50% of Louisiana’s electric power generation relies on natural gas as its fuel source. Nearly 23% comes from coal fired generation; and nearly 18% from nuclear power.

8
Table 3
Electric Power Generation in Louisiana, 1993-1997-2002 (MWHs) Annual
Growth
Rate
1993-2002 % Share
1993 1997 2002 % 1993 1997 2002 Coal 19,365,873 20,952,995 12,258,694 -5.0 24.50% 25.30% 12.90% Petroleum 1,837,844 645,547 68,460 -30.6 2.30% 0.80% 0.10% Natural Gas 23,750,752 26,010,452 25,085,994 0.6 30.10% 31.40% 26.40% Other Gases 0 0 203,484 NM 0.00% 0.00% 0.20% Nuclear 14,398,103 13,511,008 17,305,328 2.1 18.20% 16.30% 18.20%
Total Electric Utilities 59,352,572 61,120,002 54,921,960 -0.9 75.20% 73.80% 57.80% Coal 45,855 54,126 9,792,212 81.5 0.10% 0.10% 10.30% Petroleum 1,649,723 1,640,597 1,796,076 0.9 2.10% 2.00% 1.90% Natural Gas 12,604,472 14,566,110 22,814,854 6.8 16.00% 17.60% 24.00% Other Gases 700,587 1,088,279 1,294,140 7.1 0.90% 1.30% 1.40% Hydroelectric 1,231,946 1,035,961 891,441 -3.5 1.60% 1.30% 0.90%
Other
Renewables 2,674,066 3,138,770 2,862,791 0.8 3.40% 3.80% 3.00% Other 716,315 177,799 597,490 -2.0 0.90% 0.20% 0.60%
Total IPPs & Combined 19,622,964 21,701,640 40,049,003 8.2 24.80% 26.20% 42.30% Heat & Power
1993 1997 2002 % 1993 1997 2002 Coal 19,411,728 21,007,121 22,050,906 1.4 24.60% 25.40% 23.20% Petroleum 3,487,567 2,286,144 1,864,536 -6.7 4.40% 2.80% 2.00% Natural Gas 36,355,224 40,576,562 47,900,848 3.1 46.00% 49.00% 50.40% Other Gases 700,587 1,088,279 1,497,624 8.8 0.90% 1.30% 1.60% Nuclear 14,398,103 13,511,008 17,305,328 2.1 18.20% 16.30% 18.20% Hydroelectric 1,231,946 1,035,961 891,441 -3.5 1.60% 1.30% 0.90%
Other
Renewables 2,674,066 3,138,770 2,862,791 0.8 3.40% 3.80% 3.00% Other 716,315 177,799 597,490 -2.0 0.90% 0.20% 0.60%
Total Electric Industry 78,975,536 82,821,642 94,970,963 2.1 100.00% 100.00% 100.00% Source: EIA ELECTRICITY GENERATION DATA Municipal Power Authorities in Louisiana There are 22 cities in Louisiana that own their own independent municipal power distribution systems (see Exhibit II). There are three (3) legislatively authorized power authorities that provide an ownership vehicle for the joint generation of electric power for Louisiana residents and firms. The Louisiana Energy and Power Authority (LEPA) was created as a political subdivision of the State of Louisiana in 1979 pursuant to Title 33 of the Louisiana Revised Statutes of 1950. LEPA is a non-profit, joint action agency working to provide its member communities with firm, stable sources of electricity at the lowest possible cost

9
(LEPA Mission Statement). Eighteen (18) Louisiana municipalities are currently members of LEPA. They are identified on the following map (Figure 8). LEPA owns a 20% undivided interest, under a the Joint Ownership Agreement, in a 530 MW coal fired steam electric generating plant, the Rodemacher Unit No. 2, located near Boyce, Louisiana. CLECO holds a 30% ownership interest, and the Lafayette Public Power Authority (LPPA) owns the remaining 50%. LEPA operates and is responsible for the maintenance of many of the participating municipality power generating systems, and dispatches load for its members from its central control center in Lafayette. The Lafayette Public Power Authority (LPPA) is a political subdivision of the State of Louisiana created by the City Council of Lafayette. It was created in 1977 for the purpose of owning and operating public electric power projects and purchasing and selling electric power. As noted above, LPPA owns 50% of the Rodemacher No. 2 unit.
The Sabine River Authority of Louisiana (SRAL) was created by the Louisiana Legislature in 1950. The mission of the Sabine River Authority of Louisiana, consistent with Louisiana Revised Statutes 38:2321, et. seq., and with Article 48 of the Federal Power Commission License, Project 2305, is to provide for economic utilization and preservation of the waters of the Sabine River and its tributaries by promoting economic development, irrigation, navigation, improved water supply, drainage, public recreation, and hydroelectric power for the citizens of Louisiana. Each Texas and Louisiana Authority own 50% of the hydroelectric power plant. The physical location of the plant is entirely in Texas. All generating statistics are reported in Texas. Power is sold to Entergy Gulf States, CLECO, and Entergy Louisiana.

10
Figure 8
Louisiana Energy and Power Authority Member Cities
Source: BBR Creative, Lafayette; Charles East Marketing, Baton Rouge; and LEPA Joint Ownership in Generating Plant As noted above, there is joint ownership of generating plant among utilities in Louisiana. This joint ownership, while not extensive, is detailed in Exhibit VII.
EASTWEST
CADDO
BOSSIER
WEBSTE
R
CLAIBORNE
LINCOLN
UNION MOREHOUSE
CARROLL
CARRO
LL
WEST
EAST
EAST
WESTFELICIANA
MADISON
RICHLAND
FRANKLIN
TENSAS
OUACHITA
CALDWELL
JACKSONBIENVILLE
DE SOTO
NATCHITOCHES
LA SALLE
WINN
RED
RIVER
SABINE GRANT
RAPIDES
VERNON
BEAUREGARD
WASHINGTON
ST. TAMMANYLIVINGSTON
ORL
EANS
ST. BERNARD
PLAQUEM
INES
TERREBONNE
LAFOURC
HE
JEFFERSSO
N
ST.
CHARLES
CALCASIEU
CAMERON
VERMILION
JEFFERSON
DAVIS
ACADIA
AVOYELLES
ALLEN EVANGELINE
ST. LANDRY
ST. MARTIN
LAFA
YETT
E
IBERIA
ST. MARY
ASSUMPTION
ST.JAMES
IBERVILLE
ASCENSION
BATONBATON ROUGEROUGE
ST.
HELENA
TAN
GIP
AH
OA
POINT
COUPEE
CATA
HO
ULA
CO
NC
ORD
IA
ST.
THEJOHN
BAPTIST
0 20 4060
80 100
MILES
60
Note: Service areas depicted here are representational in nature.
This map should not be construed as the final authority on
whether a specific site is served. DNR TECHNOLOGY ASSESSMENT DIVISION
CLECO GSU
NOPSI LP&L
SWEPCO
INVESTOR-OWNED
DISTRIBUTION AREAS
LOUISIANA SERVICE AREAS
Source: CLECO, Entergy, GSU, SWEPCO
FELICIANA
Figure 9Approximate Service Territory of Louisiana Investor Owned Utilities
11
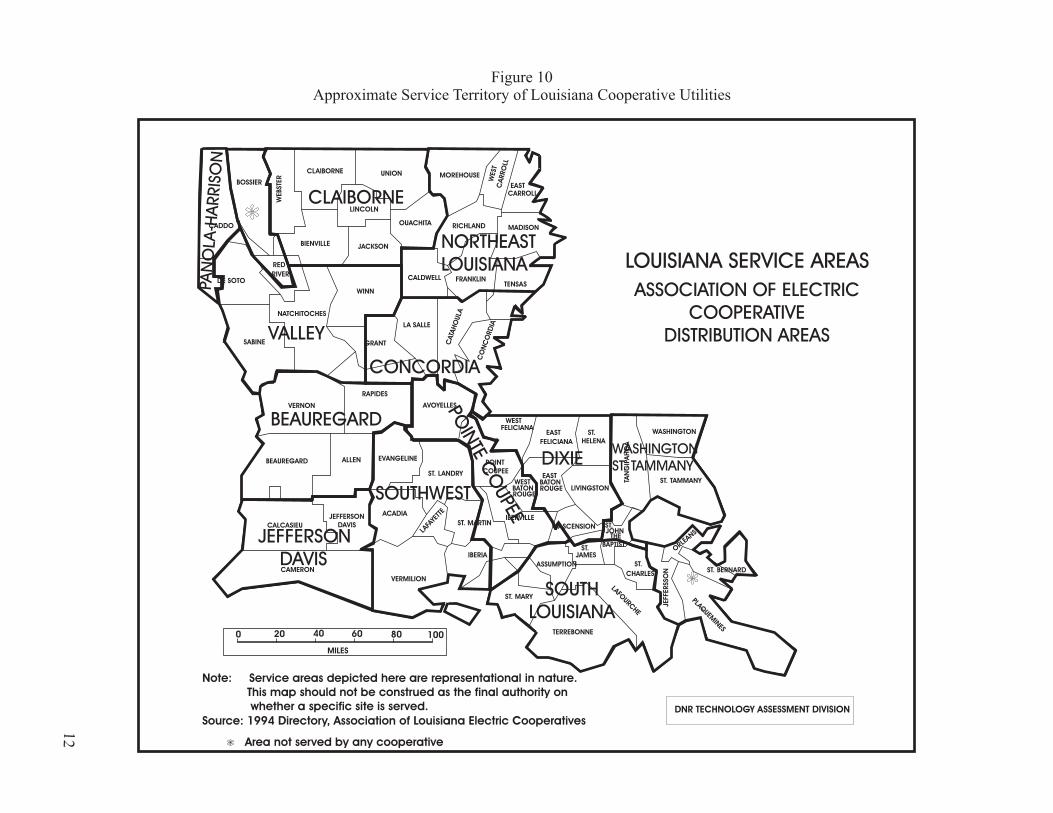
Note: Service areas depicted here are representational in nature.
This map should not be construed as the final authority on
whether a specific site is served.
LOUISIANA SERVICE AREAS
ASSOCIATION OF ELECTRIC
COOPERATIVE
DISTRIBUTION AREAS
EASTWEST
CADDO
BOSSIER
WEBSTE
R
CLAIBORNE
LINCOLN
UNION MOREHOUSE
CARROLL
CARRO
LL
WEST
EAST
EAST
WESTFELICIANA
FELICIANA
MADISONRICHLAND
FRANKLINTENSAS
OUACHITA
CALDWELL
JACKSONBIENVILLE
DE SOTO
NATCHITOCHES
LA SALLE
WINN
RED
RIVER
SABINE GRANT
RAPIDES
VERNON
BEAUREGARD
WASHINGTON
ST. TAMMANYLIVINGSTON
ORL
EANS
ST. BERNARD
PLAQUEM
INES
TERREBONNE
LAFOURC
HE
JEFFERSSO
N
ST.
CHARLES
CALCASIEU
CAMERON
VERMILION
JEFFERSON
DAVIS
ACADIA
AVOYELLES
ALLEN EVANGELINE
ST. LANDRY
ST. MARTIN
LAFA
YETT
E
IBERIA
ST. MARY
ASSUMPTION
ST.JAMES
IBERVILLE
ASCENSION
BATONBATON ROUGEROUGE
ST.
HELENA
TAN
GIP
AH
OA
POINT
COUPEE
CATA
HO
ULA
CO
NC
ORD
IA
ST.
THEJOHN
BAPTIST
0 20 4060
80 100
MILES
60
DNR TECHNOLOGY ASSESSMENT DIVISION
PA
NO
LA
-HA
RRIS
ON
CLAIBORNE
NORTHEAST
LOUISIANA
CONCORDIA
VALLEY
DIXIEWASHINGTON
ST. TAMMANY
SOUTH
LOUISIANA
BEAUREGARD
JEFFERSON
DAVIS
SOUTHWEST
PO
INTE
CO
UPEE
Area not served by any cooperative
Source: 1994 Directory, Association of Louisiana Electric Cooperatives
Figure 10Approximate Service Territory of Louisiana Cooperative Utilities
12

EXHIBIT IAlphabetical Listing of Electric Power Distribution and Generation Utilities and Cogeneration Facilities in Louisiana (2002)
(includes data from the 2001 database, plus units that entered commercial operation during 2002)
Company County Plant Name NAICS Prime MoverEnergy
Source 1 Sector
Nameplate Capacity (Megawatts)
Agrilectric Power Partners Ltd Calcasieu Agrilectric Power Partners Ltd 22 ST AB 2 12.1Agrilectric Power Partners Ltd Calcasieu Agrilectric Power Partners Ltd 22 ST AB 2 1.5Air Products & Chemicals Inc Orleans New Orleans 325188 GT NG 7 23.4Air Products & Chemicals Inc Orleans New Orleans 325188 ST NG 7 7.8Alexandria City of Rapides DG Hunter 22 ST NG 1 17.5Alexandria City of Rapides DG Hunter 22 ST NG 1 17.5Alexandria City of Rapides DG Hunter 22 ST NG 1 85Alexandria City of Rapides DG Hunter 22 ST NG 1 55BASF Corp Ascension Geismar 325 GT NG 7 35.7BASF Corp Ascension Geismar 325 GT NG 7 41.2Bayou Cove Peaking Power LLC Anoka Bayou Cove Peaking Power 22 GT NG 2 110Bayou Cove Peaking Power LLC Anoka Bayou Cove Peaking Power 22 GT NG 2 110Bayou Cove Peaking Power LLC Anoka Bayou Cove Peaking Power 22 GT NG 2 110Bayou Cove Peaking Power LLC Anoka Bayou Cove Peaking Power 22 GT NG 2 110Big Cajun 1 Peakers Pointe Coupee Big Cajun 1 Peakers 22 GT NG 2 128Big Cajun 1 Peakers Pointe Coupee Big Cajun 1 Peakers 22 GT NG 2 128Boise Cascade Corp-DeRidder Beauregard DeRidder Mill 322122 ST BLQ 7 61.5Borden Chemicals & Plastics Ascension Borden Chemicals Plastics Cogn 325 GT NG 7 26Borden Chemicals & Plastics Ascension Borden Chemicals Plastics Cogn 325 GT NG 7 38.8Borden Chemicals & Plastics Ascension Borden Chemicals Plastics Cogn 325 GT NG 7 38.8BP America Production Co Cameron Grand Chenier Gas Processing 211 ST NG 7 0.4BP America Production Co Cameron Grand Chenier Gas Processing 211 ST NG 7 0.5BP America Production Co Cameron Grand Chenier Gas Processing 211 ST NG 7 0.4BP America Production Co Cameron Grand Chenier Gas Processing 211 ST NG 7 0.5Calasieu Power LLC Calcasieu Calcasieu 22 GT NG 2 155Calasieu Power LLC Calcasieu Calcasieu 22 GT NG 2 165Calpine Corp Acadia Parish Acadia Power Station 22 CT NG 2 185Calpine Corp Acadia Parish Acadia Power Station 22 CT NG 2 185Calpine Corp Acadia Parish Acadia Power Station 22 ST NG 2 240Calpine Corp Acadia Parish Acadia Power Station 22 CA NG 2 240Calpine Corp Acadia Parish Acadia Power Station 22 CT NG 2 185Calpine Corp Acadia Parish Acadia Power Station 22 CT NG 2 185Chevron Oronite Co LLC Plaquemines Oak Point Cogen 325 GT NG 7 5Chevron Oronite Co LLC Plaquemines Oak Point Cogen 325 GT NG 7 5
Existing Electric Generating Units in the United States by State, Company and Plant, 2002
Source: EIA Electricity Historical Spreadsheets Technology Assessment Division, Department of Natural Resources 13

EXHIBIT IAlphabetical Listing of Electric Power Distribution and Generation Utilities and Cogeneration Facilities in Louisiana (2002)
Company County Plant Name NAICS Prime MoverEnergy
Source 1 Sector
Nameplate Capacity (Megawatts)
Chevron Oronite Co LLC Plaquemines Oak Point Cogen 325 GT NG 7 5Chevron Oronite Co LLC Plaquemines Oak Point Cogen 325 GT NG 7 5Chevron Oronite Co LLC Plaquemines Oak Point Cogen 325 GT NG 7 5CII Carbon LLC St Bernard CII Carbon LLC 22 ST PC 2 23CII Carbon LLC St Bernard CII Carbon LLC 22 ST PC 2 23CITGO Petroleum Corp Calcasieu CITGO Refinery Powerhouse 32411 ST OG 7 25CITGO Petroleum Corp Calcasieu CITGO Refinery Powerhouse 32411 ST OG 7 25CITGO Petroleum Corp Calcasieu CITGO Refinery Powerhouse 32411 ST OG 7 25Cleco Evangeline LLC Evangeline Evangeline 22 CT NG 2 188.7Cleco Evangeline LLC Evangeline Evangeline 22 CA NG 2 113.6Cleco Evangeline LLC Evangeline Evangeline 22 CA NG 2 243.1Cleco Evangeline LLC Evangeline Evangeline 22 CT NG 2 188.7Cleco Evangeline LLC Evangeline Evangeline 22 CT NG 2 188.7CLECO Power LLC De Soto Dolet Hills 22 ST LIG 1 720.7CLECO Power LLC St Mary Franklin 22 GT NG 1 10CLECO Power LLC Rapides Rodemacher 22 ST SUB 1 558CLECO Power LLC Rapides Rodemacher 22 ST NG 1 445.5CLECO Power LLC St Mary Teche 22 ST NG 1 24.9CLECO Power LLC St Mary Teche 22 ST NG 1 54.4CLECO Power LLC St Mary Teche 22 ST NG 1 348.5Colonial Sugar Refinery St James Colonial Sugar Refinery 311 ST NG 7 0.7Colonial Sugar Refinery St James Colonial Sugar Refinery 311 ST NG 7 1.7Colonial Sugar Refinery St James Colonial Sugar Refinery 311 ST NG 7 2.5Colonial Sugar Refinery St James Colonial Sugar Refinery 311 ST NG 7 2.5Dow Chemical Co Iberville CA II (Chlor Alkali II) 325188 CS NG 7 53Dow Chemical Co Iberville CA II (Chlor Alkali II) 325188 CS NG 7 53Dow Chemical Co Iberville Power and Utilities 325 CA WH 7 57Dow Chemical Co Iberville Power and Utilities 325 CA WH 7 90Dow Chemical Co Iberville Power and Utilities 325 CT NG 7 70Dow Chemical Co Iberville Power and Utilities 325 CT NG 7 125Dow Chemical Co Iberville Power and Utilities 325 CT NG 7 125Dow Chemical Co Iberville Power and Utilities 325 CT NG 7 70Dow Chemical Co Iberville Power and Utilities 325 CA WH 7 57Dow Chemical Co Iberville Power and Utilities 325 CA WH 7 88Dow Chemical Co-St Charles St Charles Parish St Charles Ops 325 CT NG 7 116Dow Chemical Co-St Charles St Charles Parish St Charles Ops 325 CA WH 7 10Dow Chemical Co-St Charles St Charles Parish St Charles Ops 325 CA WH 7 22Dow Chemical Co-St Charles St Charles Parish St Charles Ops 325 CT NG 7 9.6Dow Chemical Co-St Charles St Charles Parish St Charles Ops 325 CT NG 7 116
Source: EIA Electricity Historical Spreadsheets Technology Assessment Division, Department of Natural Resources 14
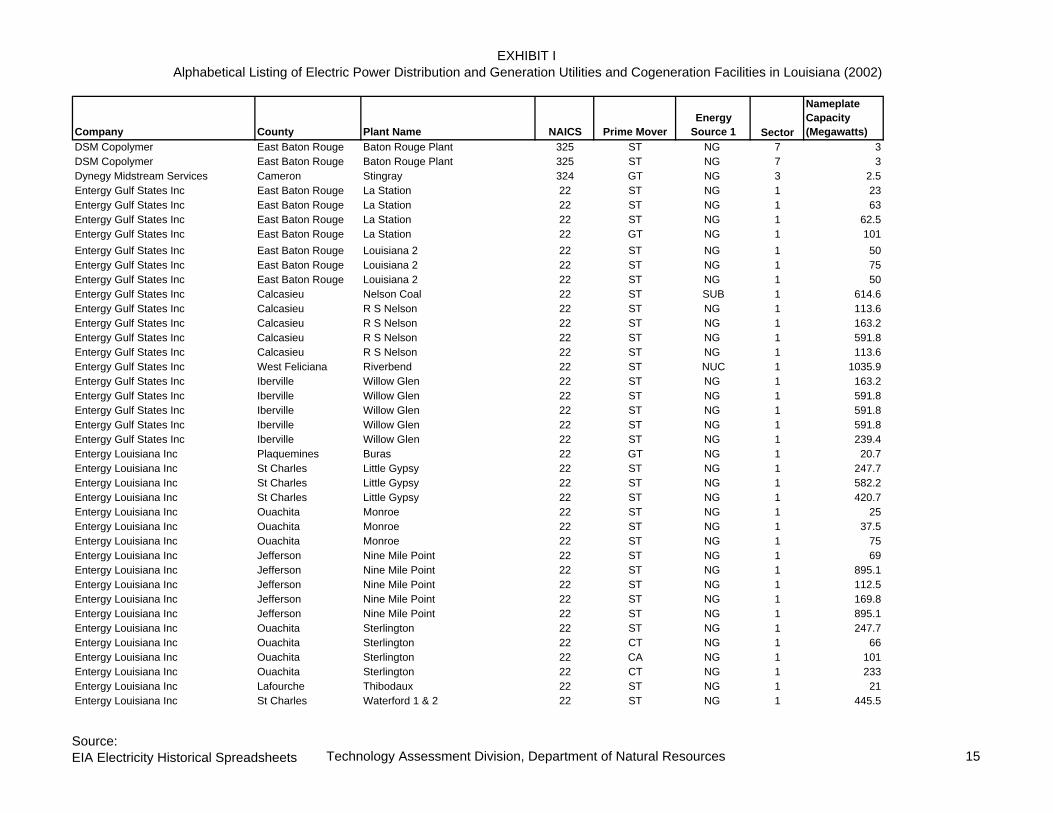
EXHIBIT IAlphabetical Listing of Electric Power Distribution and Generation Utilities and Cogeneration Facilities in Louisiana (2002)
Company County Plant Name NAICS Prime MoverEnergy
Source 1 Sector
Nameplate Capacity (Megawatts)
DSM Copolymer East Baton Rouge Baton Rouge Plant 325 ST NG 7 3DSM Copolymer East Baton Rouge Baton Rouge Plant 325 ST NG 7 3Dynegy Midstream Services Cameron Stingray 324 GT NG 3 2.5Entergy Gulf States Inc East Baton Rouge La Station 22 ST NG 1 23Entergy Gulf States Inc East Baton Rouge La Station 22 ST NG 1 63Entergy Gulf States Inc East Baton Rouge La Station 22 ST NG 1 62.5Entergy Gulf States Inc East Baton Rouge La Station 22 GT NG 1 101Entergy Gulf States Inc East Baton Rouge Louisiana 2 22 ST NG 1 50Entergy Gulf States Inc East Baton Rouge Louisiana 2 22 ST NG 1 75Entergy Gulf States Inc East Baton Rouge Louisiana 2 22 ST NG 1 50Entergy Gulf States Inc Calcasieu Nelson Coal 22 ST SUB 1 614.6Entergy Gulf States Inc Calcasieu R S Nelson 22 ST NG 1 113.6Entergy Gulf States Inc Calcasieu R S Nelson 22 ST NG 1 163.2Entergy Gulf States Inc Calcasieu R S Nelson 22 ST NG 1 591.8Entergy Gulf States Inc Calcasieu R S Nelson 22 ST NG 1 113.6Entergy Gulf States Inc West Feliciana Riverbend 22 ST NUC 1 1035.9Entergy Gulf States Inc Iberville Willow Glen 22 ST NG 1 163.2Entergy Gulf States Inc Iberville Willow Glen 22 ST NG 1 591.8Entergy Gulf States Inc Iberville Willow Glen 22 ST NG 1 591.8Entergy Gulf States Inc Iberville Willow Glen 22 ST NG 1 591.8Entergy Gulf States Inc Iberville Willow Glen 22 ST NG 1 239.4Entergy Louisiana Inc Plaquemines Buras 22 GT NG 1 20.7Entergy Louisiana Inc St Charles Little Gypsy 22 ST NG 1 247.7Entergy Louisiana Inc St Charles Little Gypsy 22 ST NG 1 582.2Entergy Louisiana Inc St Charles Little Gypsy 22 ST NG 1 420.7Entergy Louisiana Inc Ouachita Monroe 22 ST NG 1 25Entergy Louisiana Inc Ouachita Monroe 22 ST NG 1 37.5Entergy Louisiana Inc Ouachita Monroe 22 ST NG 1 75Entergy Louisiana Inc Jefferson Nine Mile Point 22 ST NG 1 69Entergy Louisiana Inc Jefferson Nine Mile Point 22 ST NG 1 895.1Entergy Louisiana Inc Jefferson Nine Mile Point 22 ST NG 1 112.5Entergy Louisiana Inc Jefferson Nine Mile Point 22 ST NG 1 169.8Entergy Louisiana Inc Jefferson Nine Mile Point 22 ST NG 1 895.1Entergy Louisiana Inc Ouachita Sterlington 22 ST NG 1 247.7Entergy Louisiana Inc Ouachita Sterlington 22 CT NG 1 66Entergy Louisiana Inc Ouachita Sterlington 22 CA NG 1 101Entergy Louisiana Inc Ouachita Sterlington 22 CT NG 1 233Entergy Louisiana Inc Lafourche Thibodaux 22 ST NG 1 21Entergy Louisiana Inc St Charles Waterford 1 & 2 22 ST NG 1 445.5
Source: EIA Electricity Historical Spreadsheets Technology Assessment Division, Department of Natural Resources 15

EXHIBIT IAlphabetical Listing of Electric Power Distribution and Generation Utilities and Cogeneration Facilities in Louisiana (2002)
Company County Plant Name NAICS Prime MoverEnergy
Source 1 Sector
Nameplate Capacity (Megawatts)
Entergy Louisiana Inc St Charles Waterford 1 & 2 22 ST NG 1 445.5Entergy Louisiana Inc St Charles Waterford 3 22 ST NUC 1 1199.8Entergy New Orleans Inc Orleans A B Paterson 22 ST NG 1 51.7Entergy New Orleans Inc Orleans A B Paterson 22 GT DFO 1 16Entergy New Orleans Inc Orleans A B Paterson 22 ST NG 1 81.2Entergy New Orleans Inc Orleans Michoud 22 ST NG 1 115.2Entergy New Orleans Inc Orleans Michoud 22 ST NG 1 582.2Entergy New Orleans Inc Orleans Michoud 22 ST NG 1 261.8Exxon Mobil East Baton Rouge Baton Rouge Cogen 32512 GT NG 7 422.1Exxon Mobil East Baton Rouge Baton Rouge Turbine 32512 GT NG 7 85.3Exxon Mobil Production Co Iberia Blue Water Gas 211 IC NG 7 0.6Exxon Mobil Production Co Iberia Blue Water Gas 211 IC NG 7 0.6Exxon Mobil Production Co Iberia Blue Water Gas 211 IC NG 7 0.6Exxon Mobil Production Co Iberia Blue Water Gas 211 IC NG 7 0.6Exxon Mobil Production Co Iberia Blue Water Gas 211 IC NG 7 0.6Exxon Mobil Production Co St Mary Garden City Gas 211 ST NG 7 0.6Exxon Mobil Production Co St Mary Garden City Gas 211 ST NG 7 0.6Exxon Mobil Production Co St Mary Garden City Gas 211 IC NG 7 0.1Exxon Mobil Production Co St Mary Garden City Gas 211 GT NG 7 0.8Exxon Mobil Production Co St Mary Garden City Gas 211 ST NG 7 0.6Exxon Mobil Production Co Jefferson Grand Isle Gas 211 IC NG 7 3Exxon Mobil Production Co Jefferson Grand Isle Gas 211 IC NG 7 3Exxon Mobil Production Co Jefferson Grand Isle Gas 211 IC NG 7 3First National Bank-Commerce Concordia Sidney A Murray Jr Hydro 22 HY WAT 2 24First National Bank-Commerce Concordia Sidney A Murray Jr Hydro 22 HY WAT 2 24First National Bank-Commerce Concordia Sidney A Murray Jr Hydro 22 HY WAT 2 24First National Bank-Commerce Concordia Sidney A Murray Jr Hydro 22 HY WAT 2 24First National Bank-Commerce Concordia Sidney A Murray Jr Hydro 22 HY WAT 2 24First National Bank-Commerce Concordia Sidney A Murray Jr Hydro 22 HY WAT 2 24First National Bank-Commerce Concordia Sidney A Murray Jr Hydro 22 HY WAT 2 24First National Bank-Commerce Concordia Sidney A Murray Jr Hydro 22 HY WAT 2 24Formosa Plastics Corp East Baton Rouge Formosa Plastics Corp 325211 GT NG 7 38.2Formosa Plastics Corp East Baton Rouge Formosa Plastics Corp 325211 GT NG 7 38.8Formosa Plastics Corp East Baton Rouge Formosa Plastics Corp 325211 GT NG 7 42.7Formosa Plastics Corp East Baton Rouge Formosa Plastics Corp 325211 ST NG 7 12Formosa Plastics Corp East Baton Rouge Formosa Plastics Corp 325211 ST NG 7 12Gaylord Container Corp Washington Gaylord Container Corp Bogalus 322122 ST NG 7 37Gaylord Container Corp Washington Gaylord Container Corp Bogalus 322122 ST NG 7 25Gaylord Container Corp Washington Gaylord Container Corp Bogalus 322122 ST NG 7 37.5
Source: EIA Electricity Historical Spreadsheets Technology Assessment Division, Department of Natural Resources 16

EXHIBIT IAlphabetical Listing of Electric Power Distribution and Generation Utilities and Cogeneration Facilities in Louisiana (2002)
Company County Plant Name NAICS Prime MoverEnergy
Source 1 Sector
Nameplate Capacity (Megawatts)
Georgia Gulf Corp Iberville Plaquemine 325188 GT NG 7 102Georgia Gulf Corp Iberville Plaquemine 325188 GT NG 7 102Georgia Gulf Corp Iberville Plaquemine 325188 GT NG 7 102Georgia-Pacific Corp East Baton Rouge Port Hudson 322122 ST BLQ 7 60IMC Phosphates Co St James Uncle Sam 325188 ST OTH 7 11IMC Phosphates Co St James Uncle Sam 325188 ST OTH 7 11International Paper Co Morehouse Louisiana Mill 322122 ST NG 7 21.8International Paper Co Morehouse Louisiana Mill 322122 ST NG 7 37.5IPC-Mansfield Mill Desota Mansfield Mill 32213 ST WDS 7 40IPC-Mansfield Mill Desota Mansfield Mill 32213 ST WDS 7 40IPC-Mansfield Mill Desota Mansfield Mill 32213 GT NG 7 25IPC-Mansfield Mill Desota Mansfield Mill 32213 ST WDS 7 30IPC-Pine Rapides Pineville Mill 32213 ST NG 7 25Jeanerette Sugar Co Inc Iberia Jeanerette Sugar Co Inc 311 ST AB 7 2.5Kaiser Aluminum&Chemical Corp Saint James Kaiser Aluminum 325188 GT NG 7 16Kaiser Aluminum&Chemical Corp Saint James Kaiser Aluminum 325188 GT NG 7 24.7Kaiser Aluminum&Chemical Corp Saint James Kaiser Aluminum 325188 ST NG 7 7.2Kaiser Aluminum&Chemical Corp Saint James Kaiser Aluminum 325188 ST NG 7 18.7Kaiser Aluminum&Chemical Corp Saint James Kaiser Aluminum 325188 ST NG 7 18.7Kaiser Aluminum&Chemical Corp Saint James Kaiser Aluminum 325188 GT NG 7 16Kaiser Aluminum&Chemical Corp Saint James Kaiser Aluminum 325188 GT NG 7 16Lafayette City of Lafayette Louis Doc Bonin 22 ST NG 1 53.9Lafayette City of Lafayette Louis Doc Bonin 22 ST NG 1 100Lafayette City of Lafayette Louis Doc Bonin 22 ST NG 1 187Lafayette City of Lafayette Rodemacher 22 ST NG 1 13.3Lafayette City of Lafayette Rodemacher 22 ST NG 1 25.4Louisiana Energy & Power Auth Pointe Coupee New Roads 22 IC DFO 1 2.3Louisiana Energy & Power Auth Pointe Coupee New Roads 22 IC DFO 1 2Louisiana Energy & Power Auth Pointe Coupee New Roads 22 IC DFO 1 1.7Louisiana Energy & Power Auth Pointe Coupee New Roads 22 IC DFO 1 1.7Louisiana Energy & Power Auth Pointe Coupee New Roads 22 IC DFO 1 1.1Louisiana Energy & Power Auth Pointe Coupee New Roads 22 IC DFO 1 0.6Louisiana Generating LLC Pointe Coupee Big Cajun 1 22 ST NG 2 133.6Louisiana Generating LLC Pointe Coupee Big Cajun 1 22 ST NG 2 133.6Louisiana Generating LLC Pointe Coupee Big Cajun 2 22 ST SUB 2 638Louisiana Generating LLC Pointe Coupee Big Cajun 2 22 ST SUB 3 632.5Louisiana Generating LLC Pointe Coupee Big Cajun 2 22 ST SUB 2 632.5Louisiana Tech University Lincoln Louisiana Tech University Powe 611 ST NG 4 2.5Louisiana Tech University Lincoln Louisiana Tech University Powe 611 ST NG 4 5
Source: EIA Electricity Historical Spreadsheets Technology Assessment Division, Department of Natural Resources 17

EXHIBIT IAlphabetical Listing of Electric Power Distribution and Generation Utilities and Cogeneration Facilities in Louisiana (2002)
Company County Plant Name NAICS Prime MoverEnergy
Source 1 Sector
Nameplate Capacity (Megawatts)
Lyondell Chemical Co Calcasieu Lyondell Chemical Co Lake Char 325 ST NG 7 4.3M A Patout & Sons Ltd Iberia M A Patout Son Ltd 311 ST AB 7 1M A Patout & Sons Ltd Iberia M A Patout Son Ltd 311 ST AB 7 2Minden City of Webster Minden 22 ST NG 1 12.5Minden City of Webster Minden 22 ST NG 1 12.5Minden City of Webster Minden 22 IC NG 1 10.3Mobil Oil Corp-Chalmette St Bernard Chalmette Refinery LLC 32411 OT OTH 7 5.7Morgan City City of St Mary Morgan City 22 ST NG 1 6Morgan City City of St Mary Morgan City 22 ST NG 1 6Morgan City City of St Mary Morgan City 22 ST NG 1 20.8Morgan City City of St Mary Morgan City 22 ST NG 1 37.5Natchitoches City of Natchitoches Natchitoches 22 IC NG 1 2.7Natchitoches City of Natchitoches Natchitoches 22 IC NG 1 2.7Natchitoches City of Natchitoches Natchitoches 22 IC NG 1 1.5Natchitoches City of Natchitoches Natchitoches 22 ST NG 1 26Natchitoches City of Natchitoches Natchitoches 22 IC NG 1 1.5Natchitoches City of Natchitoches Natchitoches 22 ST NG 1 12.6Natchitoches City of Natchitoches Natchitoches 22 ST NG 1 6Nelson Industrial Steam Co Calcasieu Parish Nelson Industrial Steam Co 22 ST PC 3 113.6Nelson Industrial Steam Co Calcasieu Parish Nelson Industrial Steam Co 22 ST PC 3 113.6NRG South Central Generatg LLC Ouachita NRG Sterlington Power LLC 22 GT NG 2 25NRG South Central Generatg LLC Ouachita NRG Sterlington Power LLC 22 GT NG 2 25NRG South Central Generatg LLC Ouachita NRG Sterlington Power LLC 22 GT NG 2 25NRG South Central Generatg LLC Ouachita NRG Sterlington Power LLC 22 GT NG 2 25NRG South Central Generatg LLC Ouachita NRG Sterlington Power LLC 22 GT NG 2 25NRG South Central Generatg LLC Ouachita NRG Sterlington Power LLC 22 GT NG 2 25NRG South Central Generatg LLC Ouachita NRG Sterlington Power LLC 22 GT NG 2 16NRG South Central Generatg LLC Ouachita NRG Sterlington Power LLC 22 GT NG 2 25NRG South Central Generatg LLC Ouachita NRG Sterlington Power LLC 22 GT NG 2 25Ouachita Operating Services LL Ouachita Ouachita 22 CA NG 2 179.3Ouachita Operating Services LL Ouachita Ouachita 22 CA NG 2 179.3Ouachita Operating Services LL Ouachita Ouachita 22 CA NG 2 122Ouachita Operating Services LL Ouachita Ouachita 22 CT NG 2 179.3Ouachita Operating Services LL Ouachita Ouachita 22 CT NG 2 179.3Ouachita Operating Services LL Ouachita Ouachita 22 CT NG 2 179.3PCS Nitrogen LP Iberville Parish PCS Nitrogen Fertilizer LP 325 GT NG 7 26Perryville Energy Partners Ouachita Perryville 421 CT NG 2 172.9Perryville Energy Partners Ouachita Perryville 421 CA WH 2 187.4Perryville Energy Partners Ouachita Perryville 421 CT NG 2 172.9
Source: EIA Electricity Historical Spreadsheets Technology Assessment Division, Department of Natural Resources 18
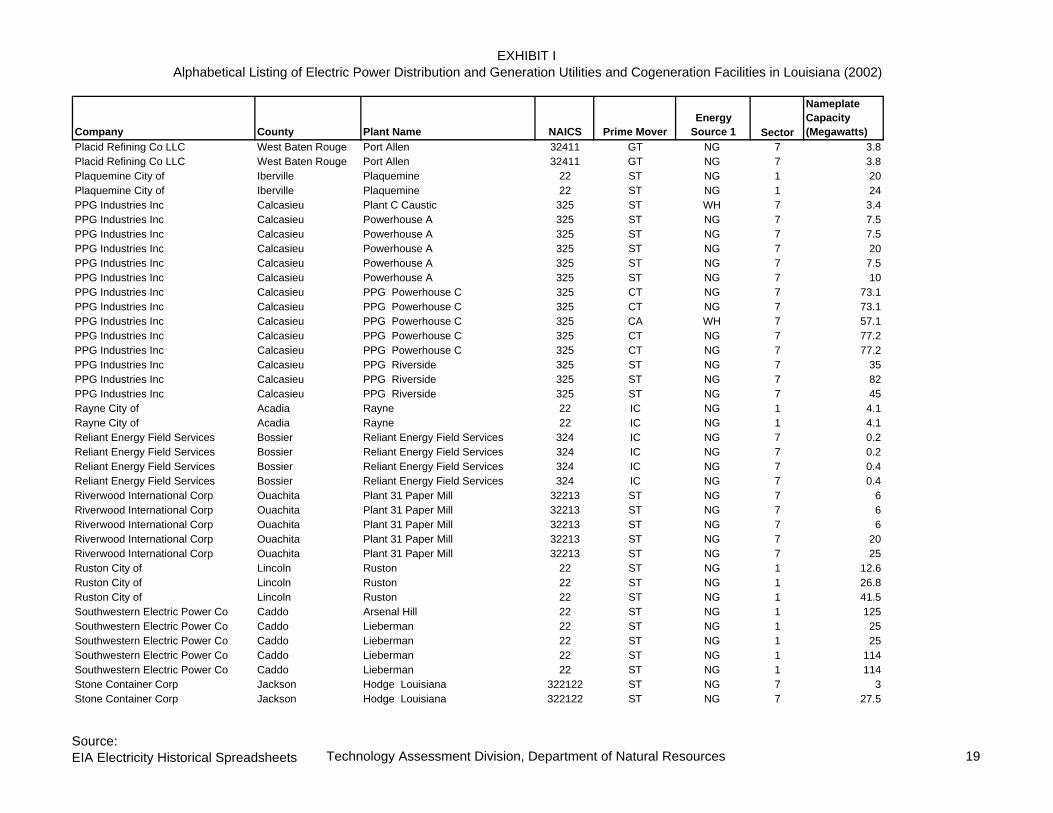
EXHIBIT IAlphabetical Listing of Electric Power Distribution and Generation Utilities and Cogeneration Facilities in Louisiana (2002)
Company County Plant Name NAICS Prime MoverEnergy
Source 1 Sector
Nameplate Capacity (Megawatts)
Placid Refining Co LLC West Baten Rouge Port Allen 32411 GT NG 7 3.8Placid Refining Co LLC West Baten Rouge Port Allen 32411 GT NG 7 3.8Plaquemine City of Iberville Plaquemine 22 ST NG 1 20Plaquemine City of Iberville Plaquemine 22 ST NG 1 24PPG Industries Inc Calcasieu Plant C Caustic 325 ST WH 7 3.4PPG Industries Inc Calcasieu Powerhouse A 325 ST NG 7 7.5PPG Industries Inc Calcasieu Powerhouse A 325 ST NG 7 7.5PPG Industries Inc Calcasieu Powerhouse A 325 ST NG 7 20PPG Industries Inc Calcasieu Powerhouse A 325 ST NG 7 7.5PPG Industries Inc Calcasieu Powerhouse A 325 ST NG 7 10PPG Industries Inc Calcasieu PPG Powerhouse C 325 CT NG 7 73.1PPG Industries Inc Calcasieu PPG Powerhouse C 325 CT NG 7 73.1PPG Industries Inc Calcasieu PPG Powerhouse C 325 CA WH 7 57.1PPG Industries Inc Calcasieu PPG Powerhouse C 325 CT NG 7 77.2PPG Industries Inc Calcasieu PPG Powerhouse C 325 CT NG 7 77.2PPG Industries Inc Calcasieu PPG Riverside 325 ST NG 7 35PPG Industries Inc Calcasieu PPG Riverside 325 ST NG 7 82PPG Industries Inc Calcasieu PPG Riverside 325 ST NG 7 45Rayne City of Acadia Rayne 22 IC NG 1 4.1Rayne City of Acadia Rayne 22 IC NG 1 4.1Reliant Energy Field Services Bossier Reliant Energy Field Services 324 IC NG 7 0.2Reliant Energy Field Services Bossier Reliant Energy Field Services 324 IC NG 7 0.2Reliant Energy Field Services Bossier Reliant Energy Field Services 324 IC NG 7 0.4Reliant Energy Field Services Bossier Reliant Energy Field Services 324 IC NG 7 0.4Riverwood International Corp Ouachita Plant 31 Paper Mill 32213 ST NG 7 6Riverwood International Corp Ouachita Plant 31 Paper Mill 32213 ST NG 7 6Riverwood International Corp Ouachita Plant 31 Paper Mill 32213 ST NG 7 6Riverwood International Corp Ouachita Plant 31 Paper Mill 32213 ST NG 7 20Riverwood International Corp Ouachita Plant 31 Paper Mill 32213 ST NG 7 25Ruston City of Lincoln Ruston 22 ST NG 1 12.6Ruston City of Lincoln Ruston 22 ST NG 1 26.8Ruston City of Lincoln Ruston 22 ST NG 1 41.5Southwestern Electric Power Co Caddo Arsenal Hill 22 ST NG 1 125Southwestern Electric Power Co Caddo Lieberman 22 ST NG 1 25Southwestern Electric Power Co Caddo Lieberman 22 ST NG 1 25Southwestern Electric Power Co Caddo Lieberman 22 ST NG 1 114Southwestern Electric Power Co Caddo Lieberman 22 ST NG 1 114Stone Container Corp Jackson Hodge Louisiana 322122 ST NG 7 3Stone Container Corp Jackson Hodge Louisiana 322122 ST NG 7 27.5
Source: EIA Electricity Historical Spreadsheets Technology Assessment Division, Department of Natural Resources 19

EXHIBIT IAlphabetical Listing of Electric Power Distribution and Generation Utilities and Cogeneration Facilities in Louisiana (2002)
Company County Plant Name NAICS Prime MoverEnergy
Source 1 Sector
Nameplate Capacity (Megawatts)
Stone Container Corp Jackson Hodge Louisiana 322122 ST NG 7 23.3Stone Container Corp Jackson Hodge Louisiana 322122 ST NG 7 15.6Stone Container Corp Jackson Hodge Louisiana 322122 ST NG 7 5Taft Cogeneration LP St Charles Taft Cogeneration Facility 325 CT NG 7 170Taft Cogeneration LP St Charles Taft Cogeneration Facility 325 CT NG 7 170Taft Cogeneration LP St Charles Taft Cogeneration Facility 325 CT NG 7 170Taft Cogeneration LP St Charles Taft Cogeneration Facility 325 CA NG 7 325TEMBEC West Feliciana St Francisville Mill 322122 GT NG 7 45TEMBEC West Feliciana St Francisville Mill 322122 ST BLQ 7 12.5Terrebonne Parish Consol Govt Terrebonne Houma 22 IC NG 1 4.5Terrebonne Parish Consol Govt Terrebonne Houma 22 ST NG 1 12.6Terrebonne Parish Consol Govt Terrebonne Houma 22 IC NG 1 4.5Terrebonne Parish Consol Govt Terrebonne Houma 22 ST NG 1 25.5Terrebonne Parish Consol Govt Terrebonne Houma 22 IC NG 1 1.4Terrebonne Parish Consol Govt Terrebonne Houma 22 IC NG 1 1.4Terrebonne Parish Consol Govt Terrebonne Houma 22 IC NG 1 4.5Terrebonne Parish Consol Govt Terrebonne Houma 22 IC NG 1 2.7Terrebonne Parish Consol Govt Terrebonne Houma 22 IC NG 1 1.4Terrebonne Parish Consol Govt Terrebonne Houma 22 ST NG 1 40.8The American Sugar Refining Co St Bernard Domino Sugar Arabi 311 ST NG 7 5The American Sugar Refining Co St Bernard Domino Sugar Arabi 311 ST NG 7 4Tosco Refining Co Plaquemines Alliance Refinery 32411 OT OG 7 6Tosco Refining Co Plaquemines Alliance Refinery 32411 ST OG 7 19Vulcan Materials Co Ascension Geismar 325188 CT NG 7 45Vulcan Materials Co Ascension Geismar 325188 CT NG 7 45Vulcan Materials Co Ascension Geismar 325188 CA NG 7 23Western Gas Resources Inc ST. Bernard Parish Toca 324 IC NG 7 0.8Western Gas Resources Inc ST. Bernard Parish Toca 324 IC NG 7 0.7Western Gas Resources Inc ST. Bernard Parish Toca 324 IC NG 7 0.5Western Gas Resources Inc ST. Bernard Parish Toca 324 IC NG 7 0.8
28504.1
Source: EIA Electricity Historical Spreadsheets Technology Assessment Division, Department of Natural Resources 20

EXHIBIT IIElectricity Distribution Utilities in Louisiana (2002)
Ultimate Customers All Sectors Class of Ownership, Number of Bundled Ultimate Consumers, Revenue, Sales, and Average Revenue per Kilowatthour for All Sectors by State and Utility, 2002
State Class of Number of Revenue Sales Average RevenueElectric Utility Ownership Consumers (thousand dollars) (thousand kilowatthours) per kilowatthour
(cents)
LouisianaAbbeville City of Publicly Owned 5,195 9,923 122,600 8.09Alexandria City of Publicly Owned 23,731 27,027 635,091 4.26Ashley Chicot Elec Coop, Inc Cooperative 112 129 1,557 8.29Beauregard Electric Coop, Cooperative 34,914 46,083 716,994 6.43Boyce Town of Publicly Owned 447 570 6,885 8.28Claiborne Electric Coop, Inc Cooperative 22,022 32,596 518,032 6.29Cleco Power LLC Investor-Owned 254,260 532,226 8,470,579 6.28Concordia Electric Coop, Inc Cooperative 12,209 13,342 169,130 7.89Dixie Electric Membership Cooperative 79,498 105,800 1,525,451 6.94Elizabeth Town of Publicly Owned 271 342 3,663 9.34Entergy Gulf States Inc Investor-Owned 338,362 1,067,192 18,772,582 5.68Entergy Louisiana Inc Investor-Owned 648,757 1,713,276 29,566,325 5.79Entergy New Orleans Inc Investor-Owned 190,273 414,849 5,877,846 7.06Erath City of Publicly Owned 972 1,415 16,171 8.75Gueydan Town of Publicly Owned 850 1,069 14,602 7.32Jefferson Davis Elec Coop, Cooperative 10,047 14,766 206,317 7.16Jonesville City of Publicly Owned 1,364 2,424 23,540 10.30Kaplan City of Publicly Owned 1,979 3,733 39,150 9.54Lafayette City of Publicly Owned 55,244 103,443 1,755,595 5.89Minden City of Publicly Owned 6,357 10,585 135,788 7.80Morgan City City of Publicly Owned 6,296 11,587 171,522 6.76Natchitoches City of Publicly Owned 7,685 17,785 265,063 6.71New Roads City of Publicly Owned 1,960 3,093 38,018 8.14Northeast Louisiana Power Cooperative 15,098 16,474 237,616 6.93Panola-Harrison Elec Coop, Cooperative 8,162 8,317 143,121 5.81Plaquemine City of Publicly Owned 4,273 6,788 86,523 7.85Pointe Coupee Elec Member Cooperative 9,572 14,360 230,812 6.22Rayne City of Publicly Owned 3,841 5,805 70,398 8.25Ruston City of Publicly Owned 9,147 19,471 244,184 7.97
Source: EIA Electricity Historical Spreadsheets Technology Assessment Division, Department of Natural Resources 21
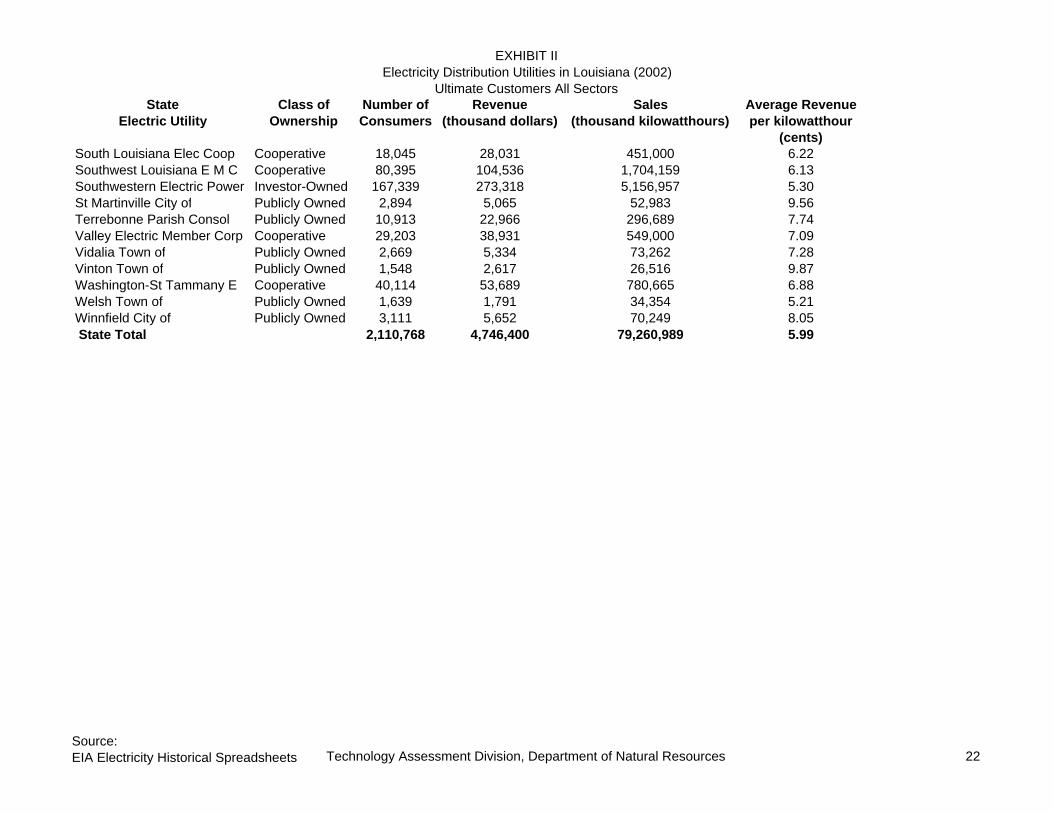
EXHIBIT IIElectricity Distribution Utilities in Louisiana (2002)
Ultimate Customers All SectorsState Class of Number of Revenue Sales Average Revenue
Electric Utility Ownership Consumers (thousand dollars) (thousand kilowatthours) per kilowatthour(cents)
South Louisiana Elec Coop Cooperative 18,045 28,031 451,000 6.22Southwest Louisiana E M C Cooperative 80,395 104,536 1,704,159 6.13Southwestern Electric Power Investor-Owned 167,339 273,318 5,156,957 5.30St Martinville City of Publicly Owned 2,894 5,065 52,983 9.56Terrebonne Parish Consol Publicly Owned 10,913 22,966 296,689 7.74Valley Electric Member Corp Cooperative 29,203 38,931 549,000 7.09Vidalia Town of Publicly Owned 2,669 5,334 73,262 7.28Vinton Town of Publicly Owned 1,548 2,617 26,516 9.87Washington-St Tammany E Cooperative 40,114 53,689 780,665 6.88Welsh Town of Publicly Owned 1,639 1,791 34,354 5.21Winnfield City of Publicly Owned 3,111 5,652 70,249 8.05 State Total 2,110,768 4,746,400 79,260,989 5.99
Source: EIA Electricity Historical Spreadsheets Technology Assessment Division, Department of Natural Resources 22

EXHIBIT IIElectricity Distribution Utilities in Louisiana (2002)
Industrial Sector Customers Class of Ownership, Number of Bundled Ultimate Consumers, Revenue, Sales, and Average Revenue per Kilowatthour for the Industrial Sector by State Utility, 2002
State Class of Number of Revenue Sales Average RevenueElectric Utility Ownership Consumers (thousand dollars) (thousand kilowatthours) per kilowatthour
LouisianaAbbeville City of Publicly Owned 19 2,460 39,236 6.27Claiborne Electric Coop, Inc Cooperative 6 6,867 139,087 4.94Cleco Power LLC Investor-Owned 730 128,296 2,756,212 4.65Concordia Electric Coop, Inc Cooperative 4 1,097 7,128 15.39Dixie Electric Membership Corp Cooperative 297 10,119 178,199 5.68Entergy Gulf States Inc Investor-Owned 3,694 424,026 9,714,398 4.36Entergy Louisiana Inc Investor-Owned 7,034 636,410 14,737,545 4.32Entergy New Orleans Inc Investor-Owned 1,103 24,657 409,152 6.03Gueydan Town of Publicly Owned 31 273 3,019 9.04Jefferson Davis Elec Coop, Inc Cooperative 5 1,829 26,609 6.87Kaplan City of Publicly Owned 23 683 7,664 8.91Minden City of Publicly Owned 29 2,259 33,081 6.83Natchitoches City of Publicly Owned 4 4,703 91,645 5.13New Roads City of Publicly Owned 1 8 100 8.00Northeast Louisiana Power Coop Cooperative 47 1,429 18,349 7.79Panola-Harrison Elec Coop, Inc Cooperative 3 372 7,677 4.85Plaquemine City of Publicly Owned 198 2,094 29,450 7.11Pointe Coupee Elec Member Corp Cooperative 7 3,711 80,582 4.61Rayne City of Publicly Owned 7 235 4,048 5.81Ruston City of Publicly Owned 55 710 29,107 2.44South Louisiana Elec Coop Assn Cooperative 10 2,512 43,000 5.84Southwest Louisiana E M C Cooperative 15 6,777 135,232 5.01Southwestern Electric Power Co Investor-Owned 1,955 42,998 1,077,504 3.99St Martinville City of Publicly Owned 133 1,886 19,401 9.72Valley Electric Member Corp Cooperative 1 665 14,000 4.75Vidalia Town of Publicly Owned 3 1,300 28,757 4.52Washington-St Tammany E C, Inc Cooperative 4 1,399 22,447 6.23Welsh Town of Publicly Owned 11 145 5,695 2.55Winnfield City of Publicly Owned 6 277 3,385 8.18 State Total 15,435 1,310,197 29,661,709 4.42
Source: EIA Electricity Historical Spreadsheets Technology Assessment Division, Department of Natural Resources 23

EXHIBIT IIElectricity Distribution Utilities in Louisiana (2002)
Commercial Sector Customers Class of Ownership, Number of Bundled Ultimate Consumers, Revenue, Sales, and Average Revenue per Kilowatthour for the Commercial Sector by State Utility, 2002
State Class of Number of Revenue Sales Average RevenueElectric Utility Ownership Consumers (thousand dollars) (thousand kilowatthours) per kilowatthour
(cents)LouisianaAbbeville City of Publicly Owned 811 2,752 29,542 9.32Alexandria City of Publicly Owned 2,789 14,856 353,826 4.20Ashley Chicot Elec Coop, Inc Cooperative 4 2 11 18.18Beauregard Electric Coop, Inc Cooperative 2,188 10,165 212,176 4.79Boyce Town of Publicly Owned 41 118 1,473 8.01Claiborne Electric Coop, Inc Cooperative 2,190 6,577 100,751 6.53Cleco Power LLC Investor-Owned 30,720 116,214 1,721,711 6.75Concordia Electric Coop, Inc Cooperative 1,597 3,509 37,591 9.33Dixie Electric Membership Corp Cooperative 4,916 7,993 111,168 7.19Elizabeth Town of Publicly Owned 23 55 620 8.87Entergy Gulf States Inc Investor-Owned 42,127 286,408 4,316,062 6.64Entergy Louisiana Inc Investor-Owned 70,351 403,051 5,538,479 7.28Entergy New Orleans Inc Investor-Owned 16,475 153,776 2,255,283 6.82Erath City of Publicly Owned 141 465 5,315 8.75Gueydan Town of Publicly Owned 108 184 2,505 7.35Jefferson Davis Elec Coop, Inc Cooperative 1,428 4,631 58,947 7.86Jonesville City of Publicly Owned 352 1,280 11,575 11.06Kaplan City of Publicly Owned 255 954 9,860 9.68Lafayette City of Publicly Owned 7,287 55,506 951,276 5.83Minden City of Publicly Owned 1,023 3,673 41,100 8.94Morgan City City of Publicly Owned 1,255 6,397 97,135 6.59Natchitoches City of Publicly Owned 933 6,702 87,966 7.62New Roads City of Publicly Owned 296 1,310 15,700 8.34Northeast Louisiana Power Cooperative 2,582 2,714 31,350 8.66Panola-Harrison Elec Coop, Inc Cooperative 515 720 11,228 6.41Plaquemine City of Publicly Owned 331 552 5,042 10.95Pointe Coupee Elec Member Cooperative 1,830 3,027 39,941 7.58Rayne City of Publicly Owned 447 2,044 24,447 8.36Ruston City of Publicly Owned 1,123 2,107 69,611 3.03
Source: EIA Electricity Historical Spreadsheets Technology Assessment Division, Department of Natural Resources 24

EXHIBIT IIElectricity Distribution Utilities in Louisiana (2002)
Commercial Sector CustomersState Class of Number of Revenue Sales Average Revenue
Electric Utility Ownership Consumers (thousand dollars) (thousand kilowatthours) per kilowatthour(cents)
South Louisiana Elec Coop Cooperative 2,270 10,250 160,000 6.41Southwest Louisiana E M C Cooperative 6,117 17,643 256,707 6.87Southwestern Electric Power Co Investor-Owned 15,921 85,880 1,725,381 4.98St Martinville City of Publicly Owned 277 260 2,524 10.30Terrebonne Parish Consol Gov't Publicly Owned 1,745 10,953 143,168 7.65Valley Electric Member Corp Cooperative 1,512 5,474 74,000 7.40Vidalia Town of Publicly Owned 305 1,598 17,261 9.26Vinton Town of Publicly Owned 239 956 9,430 10.14Washington-St Tammany E C, Cooperative 2,412 7,860 119,324 6.59Welsh Town of Publicly Owned 158 304 4,768 6.38Winnfield City of Publicly Owned 624 2,677 31,627 8.46 State Total 225,718 1,241,597 18,685,881 6.64
Source: EIA Electricity Historical Spreadsheets Technology Assessment Division, Department of Natural Resources 25

EXHIBIT IIElectricity Distribution Utilities in Louisiana (2002)
Residential Sector Customers Class of Ownership, Number of Bundled Ultimate Consumers, Revenue, Sales, and Average Revenue per Kilowatthour for the Residential Sector by State Utility, 2002
State Class of Number of Revenue Sales Average RevenueElectric Utility Ownership Consumers (thousand dollars) (thousand kilowatthours) per kilowatthour
(cents)LouisianaAbbeville City of Publicly Owned 4,249 4,189 48,447 8.65Alexandria City of Publicly Owned 20,939 12,170 281,236 4.33Ashley Chicot Elec Coop, Inc Cooperative 108 127 1,546 8.21Beauregard Electric Coop, Inc Cooperative 32,716 35,854 504,045 7.11Boyce Town of Publicly Owned 406 452 5,412 8.35Claiborne Electric Coop, Inc Cooperative 19,816 19,076 277,325 6.88Cleco Power LLC Investor-Owned 216,595 247,877 3,400,026 7.29Concordia Electric Coop, Inc Cooperative 10,553 8,633 123,311 7.00Dixie Electric Membership Corp Cooperative 74,123 87,398 1,231,937 7.09Elizabeth Town of Publicly Owned 220 227 2,929 7.75Entergy Gulf States Inc Investor-Owned 291,053 339,325 4,519,927 7.51Entergy Louisiana Inc Investor-Owned 565,882 637,901 8,780,158 7.27Entergy New Orleans Inc Investor-Owned 171,064 170,517 2,158,084 7.90Erath City of Publicly Owned 831 950 10,856 8.75Gueydan Town of Publicly Owned 711 612 9,078 6.74Jefferson Davis Elec Coop, Inc Cooperative 8,572 8,283 120,539 6.87Jonesville City of Publicly Owned 1,012 1,144 11,965 9.56Kaplan City of Publicly Owned 1,701 2,096 21,626 9.69Lafayette City of Publicly Owned 45,822 43,103 734,397 5.87Minden City of Publicly Owned 5,305 4,653 61,607 7.55Morgan City City of Publicly Owned 5,041 5,190 74,387 6.98Natchitoches City of Publicly Owned 6,666 5,880 79,410 7.40New Roads City of Publicly Owned 1,609 1,620 19,518 8.30Northeast Louisiana Power Cooperative 10,835 10,990 175,057 6.28Panola-Harrison Elec Coop, Inc Cooperative 7,484 6,844 117,896 5.81Plaquemine City of Publicly Owned 3,744 4,142 52,031 7.96Pointe Coupee Elec Member Cooperative 7,593 7,468 107,832 6.93Rayne City of Publicly Owned 3,387 3,526 41,903 8.41Ruston City of Publicly Owned 7,704 2,475 91,488 2.71
Source: EIA Electricity Historical Spreadsheets Technology Assessment Division, Department of Natural Resources 26

EXHIBIT IIElectricity Distribution Utilities in Louisiana (2002)
Residential Sector CustomersState Class of Number of Revenue Sales Average Revenue
Electric Utility Ownership Consumers (thousand dollars) (thousand kilowatthours) per kilowatthour(cents)
South Louisiana Elec Coop Cooperative 15,609 14,797 244,000 6.06Southwest Louisiana E M C Cooperative 74,263 80,116 1,312,220 6.11Southwestern Electric Power Co Investor-Owned 148,402 132,786 2,154,103 6.16St Martinville City of Publicly Owned 2,484 2,919 31,058 9.40Terrebonne Parish Consol Gov't Publicly Owned 9,168 12,013 153,521 7.82Valley Electric Member Corp Cooperative 27,675 32,705 460,000 7.11Vidalia Town of Publicly Owned 2,318 2,341 26,141 8.96Vinton Town of Publicly Owned 1,304 1,605 16,152 9.94Washington-St Tammany E C, Cooperative 37,674 44,339 637,906 6.95Welsh Town of Publicly Owned 1,469 1,314 22,781 5.77Winnfield City of Publicly Owned 2,481 2,698 35,237 7.66 State Total 1,848,588 2,000,355 28,157,092 7.10
Source: EIA Electricity Historical Spreadsheets Technology Assessment Division, Department of Natural Resources 27

EXHIBIT IIIInvestor Owned Utilities in Louisiana (2002)
Summary PageInvestor Owned Utilities Generator
Capacity Generator Nameplate Age Profile, Categories of Years Generation Sales Number ofCompany Summer, MW 0-10 20-Nov 21-30 31-40 41-50 >50 2002 (000kwh) (000kwh) Consumers
Cleco Power LLC 2,050.0 0 650 963 366 48 23 9,739,251CLECO Evangeline LLC 773 472 0 0 191 110 0 5,376
CLECO, total 2,823.0 472.0 650.0 963.0 557.0 158.0 23.0 9,744,627 8,470,579 254,260Entergy Gulf States Inc 4,476.8 0.0 0.0 1,570.0 1,980.0 771.8 155.0 8,983,325 18,772,582 338,362Entergy Louisiana Inc 5,496.0 0.0 1,821.0 1,138.0 1,827.0 600.0 110.0 11,093,145 29,566,325 648,757
Entergy New Orleans Inc 958.0 0.0 0.0 0.0 541.0 367.0 50.0 2,504,214 5,877,846 190,273Southwestern Electric Power Co 381.0 0.0 0.0 0.0 0.0 330.0 51.0 230,094 5,156,957 167,339
Total 14,134.8 944.0 2,471.0 3,671.0 5,096.0 2,336.8 389.0 32,560,781 67,844,289 1,598,991
Source: EIA Electricity Historical Spreadsheets Technology Assessment Division, Department of Natural Resources 28

EXHIBIT IIIInvestor Owned Utilities in Louisiana (2002)
CLECO (CLECO Evangline LLC and CLECO Power LLC) Generation Capacity MW Energy Source(s) Initial Date of Operation
Parish Plant Name Nameplate Summer Winter Prime Mover Source 1 Source 2 Source 3 Month YearEvangeline Evangeline Powe 188.7 158.0 175.0 CT NG 6 2000Evangeline Evangeline Powe 188.7 156.0 175.0 CT NG 6 2000Evangeline Evangeline Powe 188.7 158.0 175.0 CT NG 6 2000Evangeline Evangeline Powe 124.9 110.0 110.0 CA NG 4 1961Evangeline Evangeline Powe 243.1 191.0 191.0 CA NG 2 1966De Soto Dolet Hills 720.7 650.0 650.0 ST LIG NG PG 4 1986St Mary Franklin 10.0 7.0 7.0 GT NG DFO 1 1973Rapides Rodemacher 445.5 440.0 440.0 ST NG RFO DFO 6 1975Rapides Rodemacher 558.0 523.0 523.0 ST SUB NG 8 1982St Mary Teche 24.9 23.0 23.0 ST NG 7 1953St Mary Teche 54.4 48.0 48.0 ST NG 5 1956St Mary Teche 348.5 359.0 359.0 ST NG DFO 3 1971
2,823.0
Jointly Owned Electric Generating Units, by Company, by Plant 2002
PrimaryNet Summer Energy Unit Percent
Company, Plant Unit ID Capability, M Unit Type Source Status Date Owned Owner CompaniesCLECO Utility Group Inc Dolet Hills 1 650 ST LIG OP 1986 50.0% CLECO(DeSoto Parish) 50.0% SWEPCO
Rodemacher 2 523 ST SUB OP 1982 30.0% CLECO(Rapides Parish) 50.0% Lafayette Public Power Authority
20.0% Louisiana Energy & Power Authority
Source: EIA Electricity Historical Spreadsheets Technology Assessment Division, Department of Natural Resources 29

EXHIBIT IIIInvestor Owned Utilities in Louisiana (2002)
Entergy Gulf States Inc Generation Capacity MW Energy Source(s) Initial Date of Operation
Parish Plant Name Nameplate Summer Winter Prime Mover Source 1 Source 2 Source 3 Month YearEast Baton Rouge Louisiana 1 23.0 15.0 15.0 ST NG DFO 10 1951East Baton Rouge Louisiana 1 62.5 75.0 75.0 ST NG DFO 12 1954East Baton Rouge Louisiana 1 63.0 38.0 38.0 ST NG DFO 9 1954East Baton Rouge Louisiana 1 101.0 90.0 90.0 GT NG OG 9 1982East Baton Rouge Louisiana 1 160.0 148.8 150.4 ST NG 1954East Baton Rouge Louisiana 2 50.0 40.0 40.0 ST NG 1 1950East Baton Rouge Louisiana 2 50.0 40.0 40.0 ST NG 11 1950East Baton Rouge Louisiana 2 75.0 60.0 60.0 ST NG 5 1953Calcasieu R S Nelson 163.2 153.0 154.0 ST NG 1 1960Calcasieu R S Nelson 591.8 500.0 500.0 ST NG RFO 7 1970Calcasieu R S Nelson 614.6 550.0 550.0 ST SUB 1 1982West Feliciana River Bend 1,035.9 980.0 1,006.0 ST NUC 1 1986Iberville Willow Glen 163.2 152.0 155.0 ST NG 1 1960Iberville Willow Glen 239.4 205.0 205.0 ST NG 1 1960Iberville Willow Glen 591.8 450.0 460.0 ST NG RFO 1 1968Iberville Willow Glen 591.8 480.0 500.0 ST NG RFO 1 1973Iberville Willow Glen 591.8 500.0 500.0 ST NG RFO 1 1976
4,476.8Primary
Net Summer Energy Unit PercentCompany, Plant Unit ID Capability, M Unit Type Source Status Date Owned Owner CompaniesEntergy Gulf States Inc. Nelson Coal 6 550 ST SUB OP 1982 70.0% Entergy Gulf States Inc(Calcasieu Parish) 20.0% Sam Rayburn Municipal Power Agcy
10.0% Sam Rayburn G & T Inc R S Nelson 1 98 ST Nat Gas OP 1959(Calcasieu Parish) 2 98 ST Nat Gas OP 1956 36.1% Conoco Inc
1.0% Entergy Gulf States inc13.4% Vista Energy Ltd Partnership49.5% Citgo Petroleum Corp
Riverbend 1 936 NB Uranium OP 1986 70.0% Entergy Gulf states Inc(West Feliciana Parish) 30.0% Entergy Power Inc
Source: EIA Electricity Historical Spreadsheets Technology Assessment Division, Department of Natural Resources 30

EXHIBIT IIIInvestor Owned Utilities in Louisiana (2002)
Entergy Louisiana Inc Generation Capacity MW Energy Source(s) Initial Date of Operation
Parish Plant Name Nameplate Summer Winter Prime Mover Source 1 Source 2 Source 3 Month YearPlaquemines Buras 20.7 12.0 12.0 GT NG DFO 2 1971St Charles Little Gypsy 247.7 244.0 244.0 ST NG DFO 3 1961St Charles Little Gypsy 420.7 415.0 415.0 ST NG DFO 4 1966St Charles Little Gypsy 582.2 545.0 560.0 ST NG DFO 3 1969Ouachita Monroe 25.0 21.0 21.0 ST NG DFO 1 1963Ouachita Monroe 37.5 26.0 26.0 ST NG DFO 1 1965Ouachita Monroe 75.0 70.0 70.0 ST NG DFO 1 1968Jefferson Nine Mile Point 69.0 50.0 50.0 ST NG RFO 5 1951Jefferson Nine Mile Point 112.5 60.0 60.0 ST NG RFO 7 1953Jefferson Nine Mile Point 169.8 125.0 128.0 ST NG RFO 11 1955Jefferson Nine Mile Point 895.1 740.0 750.0 ST NG DFO 6 1973Jefferson Nine Mile Point 895.1 730.0 740.0 ST NG DFO 3 1992Ouachita Sterlington 247.7 210.0 220.0 ST NG DFO 6 1958Ouachita Sterlington 233.0 187.0 198.0 CT NG DFO 9 1974Ouachita Sterlington 66.0 47.0 49.0 CT NG DFO 9 1974Ouachita Sterlington 101.0 93.0 101.0 CA NG 9 1974Lafourche Thibodaux 21.0 19.0 19.0 ST NG RFO 0 1968St Charles Waterford 1 & 2 445.5 400.0 411.0 ST NG RFO 7 1975St Charles Waterford 1 & 2 445.5 411.0 411.0 ST NG RFO 10 1975St Charles Waterford 3 1,199.8 1,091.0 1,103.0 ST NUC 9 1985
5,496.0
Source: EIA Electricity Historical Spreadsheets Technology Assessment Division, Department of Natural Resources 31

EXHIBIT IIIInvestor Owned Utilities in Louisiana (2002)
Entergy New Orleans (NOPSI) Generation Capacity MW Energy Source(s) Initial Date of Operation
Parish Plant Name Nameplate Summer Winter Prime Mover Source 1 Source 2 Source 3 Month YearOrleans A B Paterson 51.7 50.0 50.0 ST NG RFO 4 1950Orleans A B Paterson 81.2 72.0 72.0 ST NG RFO 12 1954Orleans A B Paterson 16.0 11.0 11.0 GT DFO 9 1967Orleans Michoud 115.2 65.0 65.0 ST NG RFO 5 1957Orleans Michoud 261.8 230.0 240.0 ST NG RFO 2 1963Orleans Michoud 582.2 530.0 515.0 ST NG RFO 8 1967
958.0
Source: EIA Electricity Historical Spreadsheets Technology Assessment Division, Department of Natural Resources 32

EXHIBIT IIIInvestor Owned Utilities in Louisiana (2002)
Southwestern Electric Power Company Generation Capacity MW Energy Source(s) Initial Date of Operation
Parish Plant Name Nameplate Summer Winter Prime Mover Source 1 Source 2 Source 3 Month YearCaddo Arsenal Hill 125.0 110.0 110.0 ST NG 3 1960Caddo Lieberman 25.0 25.0 25.0 ST NG 7 1947Caddo Lieberman 25.0 26.0 26.0 ST NG 4 1949Caddo Lieberman 114.0 112.0 115.0 ST NG RFO 6 1957Caddo Lieberman 114.0 108.0 112.0 ST NG RFO 5 1959
381.0
Source: EIA Electricity Historical Spreadsheets Technology Assessment Division, Department of Natural Resources 33

EXHIBIT IVPublicly Owned Electric Utilities in Louisiana with Generation Facilities (2002)
Louisiana Energy and Power Authority
Publicly Owned Utilities, and the Louisiana Energy and Power Authority (LEPA)GeneratorCapacity Generator Nameplate Age Profile, Categories of Years Generation Sales Number of
City Summer, MW 0-10 20-Nov 21-30 31-40 41-50 >50 2002 (000kwh) (000kwh) ConsumersAbbeville City of 0 0 122,600 5,195Alexandria City of 157 78 47 32 0 635,091 23,731Boyce Town of 0 0 6,885 447Elizabeth Town of 0 0 3,663 271Erath City of 0 0 16,171 972Gueydan Town of 0 0 14,602 850Jonesville City of 0 0 23,540 1,364Kaplan City of 0 0 39,150 1,979Lafayette City of 340 45 257 38 428,186 1,755,595 55,244Minden City of 34 34 0 135,788 6,357Morgan City City of 67 56 12 59,447 171,522 6,296Natchitoches City of 53.2 39 13 1.5 0 265,063 7,685New Roads City of 0 0 38,018 1,960Plaquemine City of 0 0 86,523 4,273Rayne City of 5 5 0 70,398 3,841Ruston City of 77 40 25 12 5,025 244,184 9,147St Martinville City of 0 0 52,983 2,894Terrebonne Parish Consol Gov't 88.3 38.6 33.5 10.7 5.5 73,773 296,689 10,913Vidalia Town of 0 0 73,262 2,669Vinton Town of 0 0 26,516 1,548Welsh Town of 0 0 34,354 1,639Winnfield City of 0 0 70,249 3,111Total 822 296 426 56 44 566,431 4,182,846 152,386LEPA1/ 8.7 3.9 2.6 2.2
1/ Joint Ownership see EXHIBIT VII
Source: EIA Electricity Historical Spreadsheets Technology Assessment Division, Department of Natural Resources 34
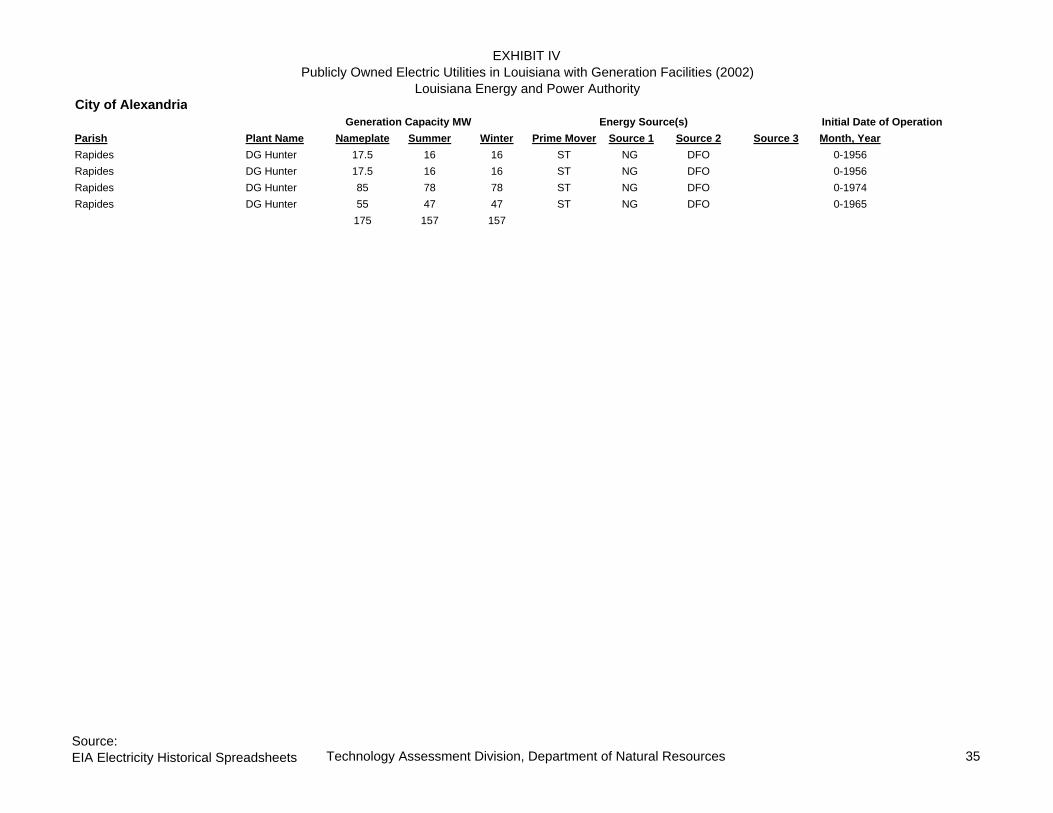
EXHIBIT IVPublicly Owned Electric Utilities in Louisiana with Generation Facilities (2002)
Louisiana Energy and Power AuthorityCity of Alexandria
Generation Capacity MW Energy Source(s) Initial Date of OperationParish Plant Name Nameplate Summer Winter Prime Mover Source 1 Source 2 Source 3 Month, YearRapides DG Hunter 17.5 16 16 ST NG DFO 0-1956Rapides DG Hunter 17.5 16 16 ST NG DFO 0-1956Rapides DG Hunter 85 78 78 ST NG DFO 0-1974Rapides DG Hunter 55 47 47 ST NG DFO 0-1965
175 157 157
Source: EIA Electricity Historical Spreadsheets Technology Assessment Division, Department of Natural Resources 35

EXHIBIT IVPublicly Owned Electric Utilities in Louisiana with Generation Facilities (2002)
Louisiana Energy and Power AuthorityCity of Lafayette
Generation Capacity MW Energy Source(s) Initial Date of OperationParish Plant Name Nameplate Summer Winter Prime Mover Source 1 Source 2 Source 3 Month, YearLafayette Louis Doc Bonin 53.9 45 48 ST NG DFO Jan-77Lafayette Louis Doc Bonin 100 84 88 ST NG DFO Jun-70Lafayette Louis Doc Bonin 187 173 180 ST NG DFO Apr-65Lafayette Rodemacher 13.3 13 13 ST NG DFO 0-1950Lafayette Rodemacher 25.4 25 25 ST NG DFO 0-1950
379.6 340 354
Source: EIA Electricity Historical Spreadsheets Technology Assessment Division, Department of Natural Resources 36

EXHIBIT IVPublicly Owned Electric Utilities in Louisiana with Generation Facilities (2002)
Louisiana Energy and Power AuthorityCity of Minden
Generation Capacity MW Energy Source(s) Initial Date of OperationParish Plant Name Nameplate Summer Winter Prime Mover Source 1 Source 2 Source 3 Month, YearWebster Minden 12.5 12.5 12.5 ST NG DFO 99-1966Webster Minden 12.5 12.5 12.5 ST NG DFO 99-1968Webster Minden 10.3 8.7 8.7 IC NG DFO 0-1965
35.3 33.7 33.7
Source: EIA Electricity Historical Spreadsheets Technology Assessment Division, Department of Natural Resources 37

EXHIBIT IVPublicly Owned Electric Utilities in Louisiana with Generation Facilities (2002)
Louisiana Energy and Power AuthorityCity of Morgan City
Generation Capacity MW Energy Source(s) Initial Date of OperationParish Plant Name Nameplate Summer Winter Prime Mover Source 1 Source 2 Source 3 Month, YearSt Mary Morgan City 6 5.8 5.8 ST NG Jun-63St Mary Morgan City 6 5.8 5.8 ST NG Jun-63St Mary Morgan City 20.8 19.8 19.8 ST NG 99-1970St Mary Morgan City 37.5 36 36 ST NG May-70
70.3 67.4 67.4
Source: EIA Electricity Historical Spreadsheets Technology Assessment Division, Department of Natural Resources 38

EXHIBIT IVPublicly Owned Electric Utilities in Louisiana with Generation Facilities (2002)
Louisiana Energy and Power AuthorityCity of Natchitoches
Generation Capacity MW Energy Source(s) Initial Date of OperationParish Plant Name Nameplate Summer Winter Prime Mover Source 1 Source 2 Source 3 Month, YearNatchitoches Natchitoches 2.7 2.8 2.8 IC NG DFO 0-1962Natchitoches Natchitoches 2.7 2.8 2.8 IC NG DFO 0-1962Natchitoches Natchitoches 1.5 1.5 1.5 IC NG DFO 88-1942Natchitoches Natchitoches 26 26 26 ST NG DFO 88-1972Natchitoches Natchitoches 1.5 1.5 1.5 IC NG DFO 0-1942Natchitoches Natchitoches 12.6 12.6 12.6 ST NG DFO 88-1966Natchitoches Natchitoches 6 6 6 ST NG DFO 88-1962
53 53.2 53.2
Source: EIA Electricity Historical Spreadsheets Technology Assessment Division, Department of Natural Resources 39
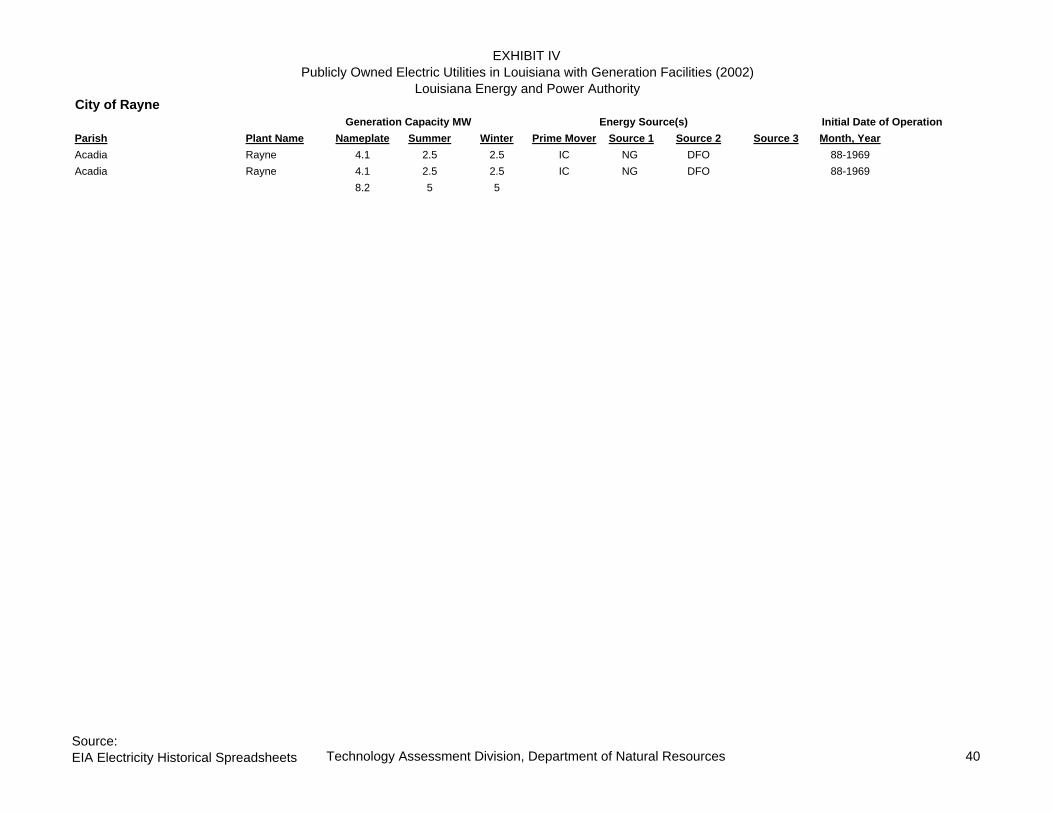
EXHIBIT IVPublicly Owned Electric Utilities in Louisiana with Generation Facilities (2002)
Louisiana Energy and Power AuthorityCity of Rayne
Generation Capacity MW Energy Source(s) Initial Date of OperationParish Plant Name Nameplate Summer Winter Prime Mover Source 1 Source 2 Source 3 Month, YearAcadia Rayne 4.1 2.5 2.5 IC NG DFO 88-1969Acadia Rayne 4.1 2.5 2.5 IC NG DFO 88-1969
8.2 5 5
Source: EIA Electricity Historical Spreadsheets Technology Assessment Division, Department of Natural Resources 40
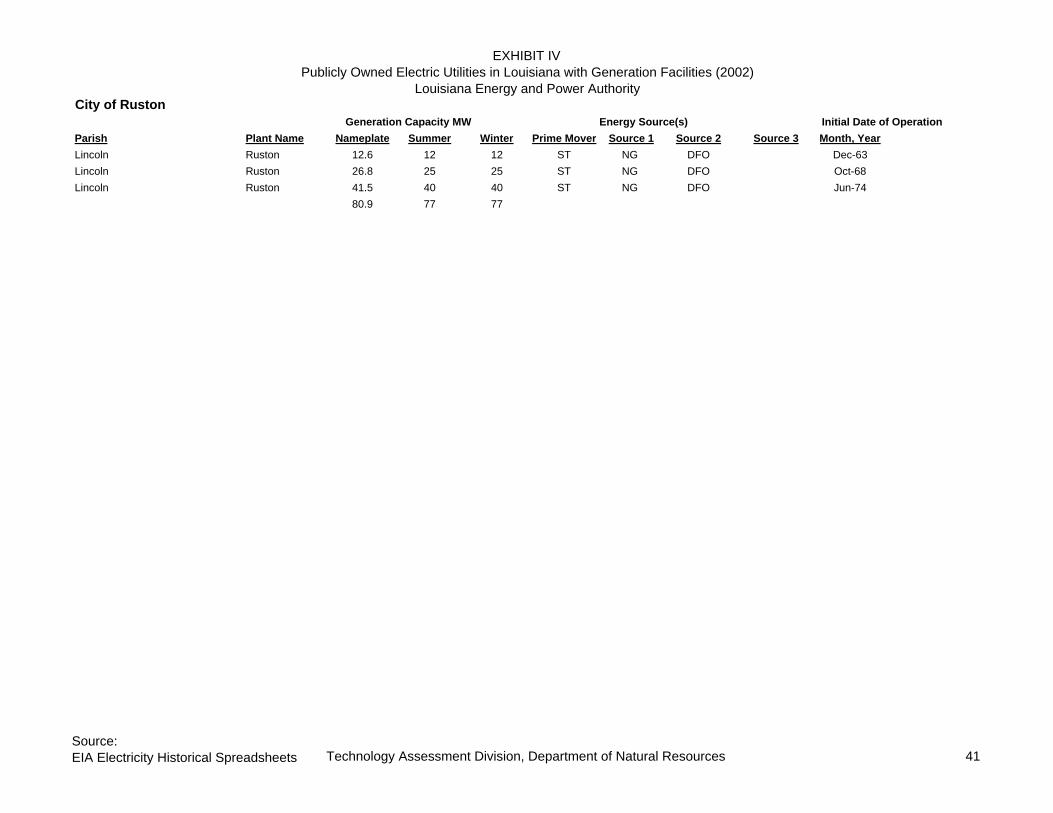
EXHIBIT IVPublicly Owned Electric Utilities in Louisiana with Generation Facilities (2002)
Louisiana Energy and Power AuthorityCity of Ruston
Generation Capacity MW Energy Source(s) Initial Date of OperationParish Plant Name Nameplate Summer Winter Prime Mover Source 1 Source 2 Source 3 Month, YearLincoln Ruston 12.6 12 12 ST NG DFO Dec-63Lincoln Ruston 26.8 25 25 ST NG DFO Oct-68Lincoln Ruston 41.5 40 40 ST NG DFO Jun-74
80.9 77 77
Source: EIA Electricity Historical Spreadsheets Technology Assessment Division, Department of Natural Resources 41

EXHIBIT IVPublicly Owned Electric Utilities in Louisiana with Generation Facilities (2002)
Louisiana Energy and Power AuthorityLouisiana Energy and Power Authority (LEPA) serving Publicly Owned Utilities
Generation Capacity MW Energy Source(s) Initial Date of OperationParish Plant Name Nameplate Summer Winter Prime Mover Source 1 Source 2 Source 3 Month, YearPointe Coupee New Roads 2.3 2.1 2.3 IC DFO NG 88-1965Pointe Coupee New Roads 2 1.8 2 IC DFO NG 88-1971Pointe Coupee New Roads 1.7 1.6 1.7 IC DFO NG 88-1951Pointe Coupee New Roads 1.7 1.6 1.7 IC DFO NG 88-1957Pointe Coupee New Roads 1.1 1 1.1 IC DFO NG 88-1957Pointe Coupee New Roads 0.6 0.6 0.6 IC DFO NG 88-1953
9.4 8.7 9.4
Source: EIA Electricity Historical Spreadsheets Technology Assessment Division, Department of Natural Resources 42

EXHIBIT IVPublicly Owned Electric Utilities in Louisiana with Generation Facilities (2002)
Louisiana Energy and Power AuthorityTerrebonne Parish Consolidated Government
Generation Capacity MW Energy Source(s) Initial Date of OperationParish Plant Name Nameplate Summer Winter Prime Mover Source 1 Source 2 Source 3 Month, YearTerrebonne Houma 4.5 3.7 3.7 IC NG DFO Aug-58Terrebonne Houma 12.6 10 10 ST NG Aug-67Terrebonne Houma 4.5 3.3 3.3 IC NG DFO Aug-58Terrebonne Houma 25.5 23.5 23.5 ST NG Aug-72Terrebonne Houma 1.4 1 1 IC NG DFO Aug-48Terrebonne Houma 1.4 1 1 IC NG DFO Aug-48Terrebonne Houma 4.5 3.7 3.7 IC NG DFO 0-1958Terrebonne Houma 2.7 2.5 2.5 IC NG DFO 0-1953Terrebonne Houma 1.4 1 1 IC NG DFO Aug-48Terrebonne Houma 40.8 38.6 38.6 ST NG Jan-77
88.3
Source: EIA Electricity Historical Spreadsheets Technology Assessment Division, Department of Natural Resources 43

EXHIBIT VICogeneration Facilities in Louisiana(2002), Capacity and Energy Source
Named Cogeneration Facilities in Louisiana, 2002; from Energy Information Administration (EIA) Form 906
Generator Generator Nameplate Age Profile,
Capacity Categories of Years Generation EIA Type
Company Parish Plant Summer, MW 0-10 20-Nov 21-30 31-40 41-50 >50 2002 (000kwh) Generation
Agrilectric Power Partners Ltd Calcasieu Agrilectric Power Partners Ltd 10.9 10.9 2
Agrilectric Power Partners Ltd Calcasieu Agrilectric Power Partners Ltd 1.3 1.3
Air Products & Chemicals Inc Orleans New Orleans 19 19
Air Products & Chemicals Inc Orleans New Orleans 7.8 7.8
American Sugar Refining Inc. St Bernard Domino Sugar Arabi Plant 5 5
American Sugar Refining Inc. St Bernard Domino Sugar Arabi Plant 4 4
BASF Corporation Ascension Geismar 33.7 33.7
BASF Corporation Ascension Geismar 39.2 39.2
Big Cajun 1 Peakers Pointe Coupee Big Cajun 1 Peakers 119 119 2
Big Cajun 1 Peakers Pointe Coupee Big Cajun 1 Peakers 119 119
Boise Cascade Corp Beauregard DeRidder Mill 61.5 61.5
Borden Chemicals & Plastics Ascension Borden Chemicals Plastics Cogen 20.1 20.1
Borden Chemicals & Plastics Ascension Borden Chemicals Plastics Cogen 29.9 29.9
Borden Chemicals & Plastics Ascension Borden Chemicals Plastics Cogen 29.7 29.7
BP America Production Co Cameron Grand Chenier Gas Processing Plant 0.4 0.4
BP America Production Co Cameron Grand Chenier Gas Processing Plant 0.5 0.5
BP America Production Co Cameron Grand Chenier Gas Processing Plant 0.5 0.5
BP America Production Co Cameron Grand Chenier Gas Processing Plant 0.4 0.4
Calasieu Power LLC Calcasieu Calcasieu Power LLC 155 155 34,577 2
Calasieu Power LLC Calcasieu Calcasieu Power LLC 165 165
Calpine Acadia Acadia Energy Center 159 159 350,015 2
Calpine Acadia Acadia Energy Center 159 159 988,626
Calpine Acadia Acadia Energy Center 159 159 87,479
Calpine Acadia Acadia Energy Center 159 159
Calpine Acadia Acadia Energy Center 223 223
Calpine Acadia Acadia Energy Center 223 223
Chevron Oronite Co LLC Plaquemines Oak Point Cogen 4 4
Chevron Oronite Co LLC Plaquemines Oak Point Cogen 4 4
Chevron Oronite Co LLC Plaquemines Oak Point Cogen 4 4
Chevron Oronite Co LLC Plaquemines Oak Point Cogen 4 4
Chevron Oronite Co LLC Plaquemines Oak Point Cogen 4 4
CII Carbon LLC St Bernard CII Carbon LLC 23 23 7,815 2CII Carbon LLC St Bernard CII Carbon LLC 23 23 84,785
Source: EIA Electricity Historical Spreadsheets Technology Assessment Division, Department of Natural Resources 44

EXHIBIT VICogeneration Facilities in Louisiana(2002), Capacity and Energy Source
Named Cogeneration Facilities in Louisiana, 2002; from Energy Information Administration (EIA) Form 906
Generator Generator Nameplate Age Profile,
Capacity Categories of Years Generation EIA Type
Company Parish Plant Summer, MW 0-10 20-Nov 21-30 31-40 41-50 >50 2002 (000kwh) Generation
CITGO Petroleum Corp Calcasieu CITGO Refinery Powerhouse 11.1 11.1 7
CITGO Petroleum Corp Calcasieu CITGO Refinery Powerhouse 7.3 7.3
CITGO Petroleum Corp Calcasieu CITGO Refinery Powerhouse 18.7 18.7
ConocoPhillips Alliance RefineryPlaquemines Alliance Refinery 6 6 7
ConocoPhillips Alliance RefineryPlaquemines Alliance Refinery 19 19
Dow Chemical Co Iberville Dow Power and Utilities 55 55 142165
Dow Chemical Co Iberville Dow Power and Utilities 86 86 18542 7
Dow Chemical Co Iberville Dow Power and Utilities 88 88 151
Dow Chemical Co Iberville Dow Power and Utilities 57 57 209951
Dow Chemical Co Iberville Dow Power and Utilities 55 55 2471
Dow Chemical Co Iberville Dow Power and Utilities 55 55 315
Dow Chemical Co Iberville Dow Power and Utilities 96 96
Dow Chemical Co Iberville Dow Power and Utilities 96 96
Dow Chemical Co Iberville Plaquemine Operations 49 49
Dow Chemical Co Iberville Plaquemine Operations 49 49
Dow Chemical Co - St Charles St Charles Dow St Charles Operations 100 100 64562 7
Dow Chemical Co - St Charles St Charles Dow St Charles Operations 100 100 429649
Dow Chemical Co - St Charles St Charles Dow St Charles Operations 50 50
Dow Chemical Co - St Charles St Charles Dow St Charles Operations 10 10
Dow Chemical Co - St Charles St Charles Dow St Charles Operations 9.6 9.6
Dow Chemical Co - St Charles St Charles Dow St Charles Operations 22 22
DSM Copolymer East Baton Rouge Baton Rouge Plant 2 2 7
DSM Copolymer East Baton Rouge Baton Rouge Plant 2 2
Dynegy Midstream Services Cameron Stingray Facility 2.5 2.5 2
Enterprise Products Optg LP St Bernard Toca Plant 0.8 0.8 7
Enterprise Products Optg LP St Bernard Toca Plant 0.8 0.8
Enterprise Products Optg LP St Bernard Toca Plant 0.7 0.7
Enterprise Products Optg LP St Bernard Toca Plant 0.5 0.5
Exxon Mobil East Baton Rouge ExxonMobil Baton Rouge Cogen 88.6 88.6 7
Exxon Mobil East Baton Rouge ExxonMobil Baton Rouge Cogen 154.4 154.4
Exxon Mobil East Baton Rouge ExxonMobil Baton Rouge Cogen 44.5 44.5
Exxon Mobil East Baton Rouge ExxonMobil Baton Rouge Cogen 44.5 44.5
Exxon Mobil East Baton Rouge ExxonMobil Baton Rouge Turbine Generato 76.7 76.7
Source: EIA Electricity Historical Spreadsheets Technology Assessment Division, Department of Natural Resources 45

EXHIBIT VICogeneration Facilities in Louisiana(2002), Capacity and Energy Source
Named Cogeneration Facilities in Louisiana, 2002; from Energy Information Administration (EIA) Form 906
Generator Generator Nameplate Age Profile,
Capacity Categories of Years Generation EIA Type
Company Parish Plant Summer, MW 0-10 20-Nov 21-30 31-40 41-50 >50 2002 (000kwh) Generation
Exxon Mobil Production Co Iberia ExxonMobil Blue Water Gas Plant 0.6 0.6
Exxon Mobil Production Co Iberia ExxonMobil Blue Water Gas Plant 0.6 0.6
Exxon Mobil Production Co Iberia ExxonMobil Blue Water Gas Plant 0.6 0.6
Exxon Mobil Production Co Iberia ExxonMobil Blue Water Gas Plant 0.6 0.6
Exxon Mobil Production Co Iberia ExxonMobil Blue Water Gas Plant 0.6 0.6
Exxon Mobil Production Co St Mary ExxonMobil Garden City Gas Plant 0.56 0.56
Exxon Mobil Production Co St Mary ExxonMobil Garden City Gas Plant 0.56 0.56
Exxon Mobil Production Co St Mary ExxonMobil Garden City Gas Plant 0.56 0.56
Exxon Mobil Production Co St Mary ExxonMobil Garden City Gas Plant 0.68 0.68
Exxon Mobil Production Co St Mary ExxonMobil Garden City Gas Plant 0.1 0.1
Exxon Mobil Production Co Jefferson ExxonMobil Grand Isle Gas 2.93 2.93
Exxon Mobil Production Co Jefferson ExxonMobil Grand Isle Gas 2.93 2.93
Exxon Mobil Production Co Jefferson ExxonMobil Grand Isle Gas 2.93 2.93
First National Bank-Commerce Concordia Sidney A Murray Jr Hydroelectric 24 24 777,637 2
First National Bank-Commerce Concordia Sidney A Murray Jr Hydroelectric 24 24
First National Bank-Commerce Concordia Sidney A Murray Jr Hydroelectric 24 24
First National Bank-Commerce Concordia Sidney A Murray Jr Hydroelectric 24 24
First National Bank-Commerce Concordia Sidney A Murray Jr Hydroelectric 24 24
First National Bank-Commerce Concordia Sidney A Murray Jr Hydroelectric 24 24
First National Bank-Commerce Concordia Sidney A Murray Jr Hydroelectric 24 24
First National Bank-Commerce Concordia Sidney A Murray Jr Hydroelectric 24 24
Formosa Plastics Corp East Baton Rouge Formosa Plastics 33 33 7
Formosa Plastics Corp East Baton Rouge Formosa Plastics 33 33
Formosa Plastics Corp East Baton Rouge Formosa Plastics 33 33
Formosa Plastics Corp East Baton Rouge Formosa Plastics 11 11
Formosa Plastics Corp East Baton Rouge Formosa Plastics 11 11
Gaylord Container Corp Washington Gaylord Container Bogalusa 34.41 34.41 147316 7
Gaylord Container Corp Washington Gaylord Container Bogalusa 23.25 23.25 188264
Gaylord Container Corp Washington Gaylord Container Bogalusa 34.88 34.88 10336
Georgia Gulf Corp Plaquemine Iberville Georgia Gulf Plaquemine 80 80 1766106 7
Georgia Gulf Corp Plaquemine Iberville Georgia Gulf Plaquemine 80 80 45316
Georgia Gulf Corp Plaquemine Iberville Georgia Gulf Plaquemine 80 80 67441
Georgia-Pacific Corp East Baton Rouge Georgia Pacific Port Hudson 62.96 62.96 283831 7
Source: EIA Electricity Historical Spreadsheets Technology Assessment Division, Department of Natural Resources 46

EXHIBIT VICogeneration Facilities in Louisiana(2002), Capacity and Energy Source
Named Cogeneration Facilities in Louisiana, 2002; from Energy Information Administration (EIA) Form 906
Generator Generator Nameplate Age Profile,
Capacity Categories of Years Generation EIA Type
Company Parish Plant Summer, MW 0-10 20-Nov 21-30 31-40 41-50 >50 2002 (000kwh) Generation
IMC Phosphates Co St James IMC Phosphates Company Uncle Sam 10.23 10.23 157762 7
IMC Phosphates Co St James IMC Phosphates Company Uncle Sam 10.23 10.23
Imperial Sugar Co St James Colonial Sugar Refinery 0.6 0.6 7
Imperial Sugar Co St James Colonial Sugar Refinery 1.7 1.7
Imperial Sugar Co St James Colonial Sugar Refinery 1.5 1.5
Imperial Sugar Co St James Colonial Sugar Refinery 2.1 2.1
International Paper Co Morehouse International Paper Louisiana Mill 21.8 21.8 12544 7
International Paper Co Morehouse International Paper Louisiana Mill 37.5 37.5 24295
IPC-Mansfield Mill De Soto Mansfield Mill 19.94 19.94 60652 7
IPC-Mansfield Mill De Soto Mansfield Mill 31.33 31.33 203579
IPC-Mansfield Mill De Soto Mansfield Mill 25.17 25.17 22645
IPC-Mansfield Mill De Soto Mansfield Mill 21.37 21.37 161538
IPC-Pine Rapides Pineville Mill 22 22 143093 7
Jeanerette Sugar Co Inc Iberia Jeanerette Sugar 2.33 2.33 7
Kaiser Aluminum&Chemical Cor St James Kaiser Aluminum 15 15 151749 7
Kaiser Aluminum&Chemical Cor St James Kaiser Aluminum 15 15 112906
Kaiser Aluminum&Chemical Cor St James Kaiser Aluminum 15 15
Kaiser Aluminum&Chemical Cor St James Kaiser Aluminum 21 21
Kaiser Aluminum&Chemical Cor St James Kaiser Aluminum 17 17
Kaiser Aluminum&Chemical Cor St James Kaiser Aluminum 17 17
Kaiser Aluminum&Chemical Cor St James Kaiser Aluminum 6 6
Louisiana Generating LLC Pointe Coupee Big Cajun 1 119 119 0 2
Louisiana Generating LLC Pointe Coupee Big Cajun 1 119 119 4,274Louisiana Generating LLC Pointe Coupee Big Cajun 2 580 580 20,083Louisiana Generating LLC Pointe Coupee Big Cajun 2 575 575 11,818,851Louisiana Generating LLC Pointe Coupee Big Cajun 2 575 575
Louisiana Generating LLC Ouachita NRG Sterlington Power LLC 25 25 0Louisiana Generating LLC Ouachita NRG Sterlington Power LLC 22 22 223Louisiana Generating LLC Ouachita NRG Sterlington Power LLC 22 22
Louisiana Generating LLC Ouachita NRG Sterlington Power LLC 22 22
Louisiana Generating LLC Ouachita NRG Sterlington Power LLC 19 19
Louisiana Generating LLC Ouachita NRG Sterlington Power LLC 18 18
Louisiana Generating LLC Ouachita NRG Sterlington Power LLC 18 18
Source: EIA Electricity Historical Spreadsheets Technology Assessment Division, Department of Natural Resources 47
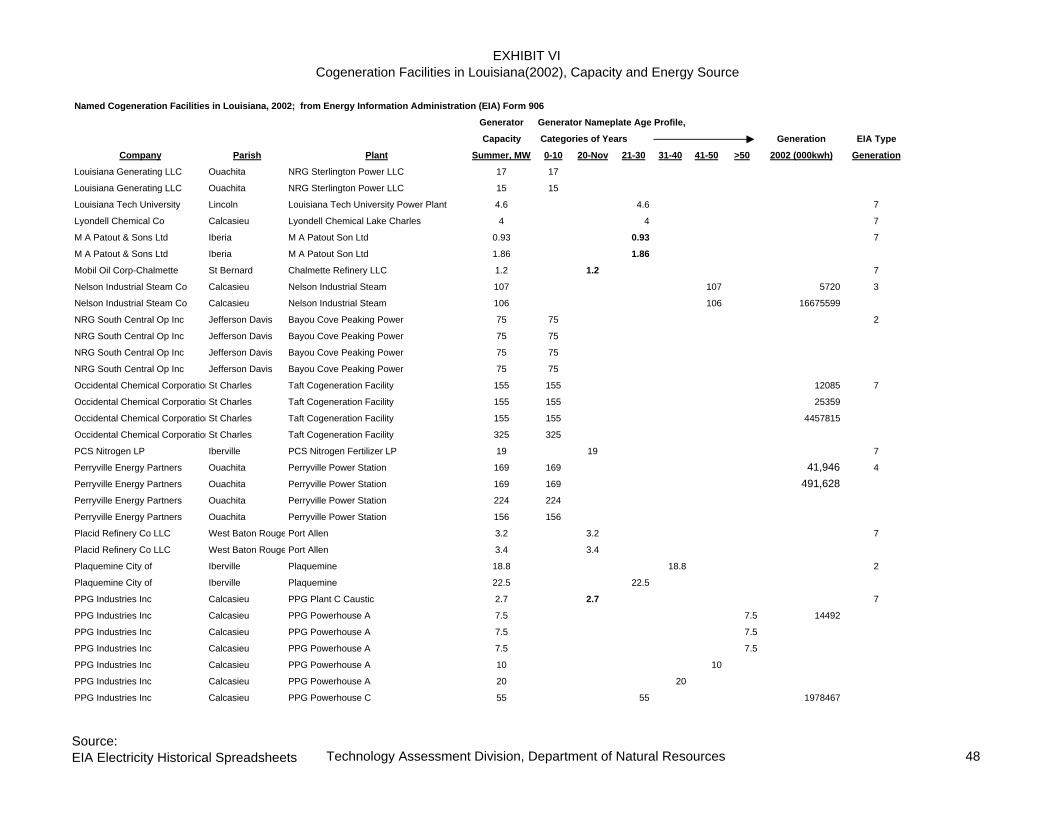
EXHIBIT VICogeneration Facilities in Louisiana(2002), Capacity and Energy Source
Named Cogeneration Facilities in Louisiana, 2002; from Energy Information Administration (EIA) Form 906
Generator Generator Nameplate Age Profile,
Capacity Categories of Years Generation EIA Type
Company Parish Plant Summer, MW 0-10 20-Nov 21-30 31-40 41-50 >50 2002 (000kwh) Generation
Louisiana Generating LLC Ouachita NRG Sterlington Power LLC 17 17
Louisiana Generating LLC Ouachita NRG Sterlington Power LLC 15 15
Louisiana Tech University Lincoln Louisiana Tech University Power Plant 4.6 4.6 7
Lyondell Chemical Co Calcasieu Lyondell Chemical Lake Charles 4 4 7
M A Patout & Sons Ltd Iberia M A Patout Son Ltd 0.93 0.93 7
M A Patout & Sons Ltd Iberia M A Patout Son Ltd 1.86 1.86
Mobil Oil Corp-Chalmette St Bernard Chalmette Refinery LLC 1.2 1.2 7
Nelson Industrial Steam Co Calcasieu Nelson Industrial Steam 107 107 5720 3
Nelson Industrial Steam Co Calcasieu Nelson Industrial Steam 106 106 16675599
NRG South Central Op Inc Jefferson Davis Bayou Cove Peaking Power 75 75 2
NRG South Central Op Inc Jefferson Davis Bayou Cove Peaking Power 75 75
NRG South Central Op Inc Jefferson Davis Bayou Cove Peaking Power 75 75
NRG South Central Op Inc Jefferson Davis Bayou Cove Peaking Power 75 75
Occidental Chemical CorporationSt Charles Taft Cogeneration Facility 155 155 12085 7
Occidental Chemical CorporationSt Charles Taft Cogeneration Facility 155 155 25359
Occidental Chemical CorporationSt Charles Taft Cogeneration Facility 155 155 4457815
Occidental Chemical CorporationSt Charles Taft Cogeneration Facility 325 325
PCS Nitrogen LP Iberville PCS Nitrogen Fertilizer LP 19 19 7
Perryville Energy Partners Ouachita Perryville Power Station 169 169 41,946 4
Perryville Energy Partners Ouachita Perryville Power Station 169 169 491,628Perryville Energy Partners Ouachita Perryville Power Station 224 224
Perryville Energy Partners Ouachita Perryville Power Station 156 156
Placid Refinery Co LLC West Baton Rouge Port Allen 3.2 3.2 7
Placid Refinery Co LLC West Baton Rouge Port Allen 3.4 3.4
Plaquemine City of Iberville Plaquemine 18.8 18.8 2
Plaquemine City of Iberville Plaquemine 22.5 22.5
PPG Industries Inc Calcasieu PPG Plant C Caustic 2.7 2.7 7
PPG Industries Inc Calcasieu PPG Powerhouse A 7.5 7.5 14492
PPG Industries Inc Calcasieu PPG Powerhouse A 7.5 7.5
PPG Industries Inc Calcasieu PPG Powerhouse A 7.5 7.5
PPG Industries Inc Calcasieu PPG Powerhouse A 10 10
PPG Industries Inc Calcasieu PPG Powerhouse A 20 20
PPG Industries Inc Calcasieu PPG Powerhouse C 55 55 1978467
Source: EIA Electricity Historical Spreadsheets Technology Assessment Division, Department of Natural Resources 48

EXHIBIT VICogeneration Facilities in Louisiana(2002), Capacity and Energy Source
Named Cogeneration Facilities in Louisiana, 2002; from Energy Information Administration (EIA) Form 906
Generator Generator Nameplate Age Profile,
Capacity Categories of Years Generation EIA Type
Company Parish Plant Summer, MW 0-10 20-Nov 21-30 31-40 41-50 >50 2002 (000kwh) Generation
PPG Industries Inc Calcasieu PPG Powerhouse C 55 55
PPG Industries Inc Calcasieu PPG Powerhouse C 52 52
PPG Industries Inc Calcasieu PPG Powerhouse C 70.6 70.6
PPG Industries Inc Calcasieu PPG Powerhouse C 70.6 70.6
PPG Industries Inc Calcasieu PPG Riverside 35 35 83348
PPG Industries Inc Calcasieu PPG Riverside 42 42
PPG Industries Inc Calcasieu PPG Riverside 77 77
Quachita Operating Sevices LLCOuachita Ouachita Generating Plant 161 161 416010 2
Quachita Operating Sevices LLCOuachita Ouachita Generating Plant 161 161 741598
Quachita Operating Sevices LLCOuachita Ouachita Generating Plant 161 161
Quachita Operating Sevices LLCOuachita Ouachita Generating Plant 111 111
Quachita Operating Sevices LLCOuachita Ouachita Generating Plant 111 111
Quachita Operating Sevices LLCOuachita Ouachita Generating Plant 111 111
Reliant Energy Field Services Bossier Energy Field Services 0.2 0.2 2
Reliant Energy Field Services Bossier Energy Field Services 1.3 1.3
Reliant Energy Field Services Bossier Energy Field Services 0.9 0.9
Reliant Energy Field Services Bossier Energy Field Services 0.2 0.2
Riverwood International Corp Ouachita Plant 31 Paper Mill 6 6 117759 7
Riverwood International Corp Ouachita Plant 31 Paper Mill 6 6 63524
Riverwood International Corp Ouachita Plant 31 Paper Mill 6 6 85762
Riverwood International Corp Ouachita Plant 31 Paper Mill 28 28
Riverwood International Corp Ouachita Plant 31 Paper Mill 15 15
RS Cogen Calcasieu RS Cogen 60.2 60.2 37,330 3
RS Cogen Calcasieu RS Cogen 167.7 167.7 1,908,918
RS Cogen Calcasieu RS Cogen 167.7 167.7 68,989Stone Container Corp Jackson Stone Container Hodge 3 3 276212 7
Stone Container Corp Jackson Stone Container Hodge 5 5 172720
Stone Container Corp Jackson Stone Container Hodge 15.6 15.6 39553
Stone Container Corp Jackson Stone Container Hodge 27.5 27.5
Stone Container Corp Jackson Stone Container Hodge 23.3 23.3
Tembec USA, LLC West Feliciana St Francisville Mill 15 15 53071 7
Vulcan Materials Co Ascension Geismar Plant 40 40 322599 7
Vulcan Materials Co Ascension Geismar Plant 40 40
Source: EIA Electricity Historical Spreadsheets Technology Assessment Division, Department of Natural Resources 49

EXHIBIT VICogeneration Facilities in Louisiana(2002), Age and Cogeneration Type
Generation Capacity MW Energy Source(s) Initial Date of Operation
Parish Plant Name Nameplate Summer Winter Prime Mover Source 1 Source 2 Source 3 Month, Year
Calcasieu Agrilectric Power Partners Ltd 12.1 10.9 10.9 ST AB NG 7 1984
Calcasieu Agrilectric Power Partners Ltd 1.5 1.3 1.3 ST AB NG 8 1995
Orleans New Orleans 23.4 19 23.4 GT NG 12 1984
Orleans New Orleans 7.8 7.8 7.8 ST NG 6 1995
St Bernard Domino Sugar Arabi Plant 5 5 5 ST NG 1 1949
St Bernard Domino Sugar Arabi Plant 4 4 4 ST NG 1 1949
Ascension Geismar 35.7 33.7 37.7 GT NG 7 1985
Ascension Geismar 41.2 39.2 43.2 GT NG OG 11 1998
Pointe Coupee Big Cajun 1 Peakers 128 119 125 GT NG 6 2001
Pointe Coupee Big Cajun 1 Peakers 128 119 125 GT NG 7 2001
Beauregard DeRidder Mill 61.5 61.5 61.5 ST BLQ WDS NG 10 1969
Ascension Borden Chemicals Plastics Cogen 26 20.1 23.2 GT NG 4 1985
Ascension Borden Chemicals Plastics Cogen 38.8 29.9 32.5 GT NG 9 1986
Ascension Borden Chemicals Plastics Cogen 38.8 29.7 33.9 GT NG 11 1986
Cameron Grand Chenier Gas Processing Plant 0.4 0.4 0.4 ST NG 1 1966
Cameron Grand Chenier Gas Processing Plant 0.5 0.5 0.5 ST NG 1 1966
Cameron Grand Chenier Gas Processing Plant 0.5 0.5 0.5 ST NG 1 1966
Cameron Grand Chenier Gas Processing Plant 0.4 0.4 0.4 ST NG 1 1966
Calcasieu Calcasieu Power LLC 155 155 160 GT NG 5 2000
Calcasieu Calcasieu Power LLC 165 165 170 GT NG 4 2001
Acadia Acadia Energy Center 185 159 174 CT NG 7 2002
Acadia Acadia Energy Center 185 159 174 CT NG 7 2002
Acadia Acadia Energy Center 185 159 174 CT NG 8 2002
Acadia Acadia Energy Center 185 159 174 CT NG 8 2002
Acadia Acadia Energy Center 240 223 226 CA NG 7 2002
Acadia Acadia Energy Center 240 223 226 CA NG 8 2002
Plaquemines Oak Point Cogen 4.7 4 5 GT NG 10 1999
Plaquemines Oak Point Cogen 4.7 4 5 GT NG 10 1999
Plaquemines Oak Point Cogen 4.7 4 5 GT NG 10 1999
Plaquemines Oak Point Cogen 4.7 4 5 GT NG 10 1999
Plaquemines Oak Point Cogen 4.7 4 5 GT NG 10 1999
St Bernard CII Carbon LLC 23 23 23 ST PC 1 1951
St Bernard CII Carbon LLC 23 23 23 ST PC 1 1951
Calcasieu CITGO Refinery Powerhouse 25 11.1 9.1 ST OG NG 1 1942
Calcasieu CITGO Refinery Powerhouse 25 7.3 12.2 ST OG NG 1 1942
Source: EIA Electricity Historical Spreadsheets Technology Assessment Division, Department of Natural Resources 50

EXHIBIT VICogeneration Facilities in Louisiana(2002), Age and Cogeneration Type
Generation Capacity MW Energy Source(s) Initial Date of Operation
Parish Plant Name Nameplate Summer Winter Prime Mover Source 1 Source 2 Source 3 Month, Year
Calcasieu CITGO Refinery Powerhouse 25 18.7 14.5 ST OG NG 3 1969
Plaquemines Alliance Refinery 6 6 6 OT OG 12 1971
Plaquemines Alliance Refinery 19 19 19 ST OG 1 1990
Iberville Dow Power and Utilities 57 55 55 CA NG OG OTH 6 1958
Iberville Dow Power and Utilities 88 86 86 CA NG OG OTH 6 1962
Iberville Dow Power and Utilities 90 88 88 CA NG OG OTH 6 1966
Iberville Dow Power and Utilities 57 57 57 CA NG OG OTH 6 1969
Iberville Dow Power and Utilities 70 55 60 CT NG OG OTH 11 1978
Iberville Dow Power and Utilities 70 55 60 CT NG OG OTH 2 1979
Iberville Dow Power and Utilities 125 96 104 CT NG OG 12 1982
Iberville Dow Power and Utilities 125 96 104 CT NG OG 5 1983
Iberville Plaquemine Operations 53 49 51 CS NG 12 1969
Iberville Plaquemine Operations 53 49 51 CS NG 12 1969
St Charles Dow St Charles Operations 116 100 116 CT NG 12 1996
St Charles Dow St Charles Operations 116 100 116 CT NG 1 1997
St Charles Dow St Charles Operations 50 50 50 CA NG 12 2002
St Charles Dow St Charles Operations 10 10 10 CA NG 4 1987
St Charles Dow St Charles Operations 9.6 9.6 9.6 CT NG OG 3 1980
St Charles Dow St Charles Operations 22 22 22 CA NG 2 1997
East Baton Rou Baton Rouge Plant 3 2 2.5 ST NG 1 1959
East Baton Rou Baton Rouge Plant 3 2 2.5 ST NG 1 1959
Cameron Stingray Facility 2.5 2.5 0.8 GT NG 9 1977
St Bernard Toca Plant 0.8 0.8 0.8 IC NG 6 1958
St Bernard Toca Plant 0.8 0.8 0.8 IC NG 6 1958
St Bernard Toca Plant 0.7 0.7 0.7 IC NG 2 1997
St Bernard Toca Plant 0.5 0.5 0.5 IC NG 8 2001
East Baton Rou ExxonMobil Baton Rouge Cogen 90 88.6 92.6 CT NG OG 4 1999
East Baton Rou ExxonMobil Baton Rouge Cogen 156.8 154.4 161.4 CT NG OG 1 1999
East Baton Rou ExxonMobil Baton Rouge Cogen 45 44.5 46.5 CA NG OG 1 1952
East Baton Rou ExxonMobil Baton Rouge Cogen 45 44.5 46.5 CA NG OG 1 1952
East Baton Rou ExxonMobil Baton Rouge Turbine Generator 85.3 76.7 83.9 GT NG 5 1990
Iberia ExxonMobil Blue Water Gas Plant 0.6 0.6 0.6 IC NG 11 1978
Iberia ExxonMobil Blue Water Gas Plant 0.6 0.6 0.6 IC NG 11 1978
Iberia ExxonMobil Blue Water Gas Plant 0.6 0.6 0.6 IC NG 11 1978
Iberia ExxonMobil Blue Water Gas Plant 0.6 0.6 0.6 IC NG 11 1978
Source: EIA Electricity Historical Spreadsheets Technology Assessment Division, Department of Natural Resources 51

EXHIBIT VICogeneration Facilities in Louisiana(2002), Age and Cogeneration Type
Generation Capacity MW Energy Source(s) Initial Date of Operation
Parish Plant Name Nameplate Summer Winter Prime Mover Source 1 Source 2 Source 3 Month, Year
Iberia ExxonMobil Blue Water Gas Plant 0.6 0.6 0.6 IC NG 11 1978
St Mary ExxonMobil Garden City Gas Plant 0.6 0.56 0.56 ST NG 11 1997
St Mary ExxonMobil Garden City Gas Plant 0.6 0.56 0.56 ST NG 1 1964
St Mary ExxonMobil Garden City Gas Plant 0.6 0.56 0.56 ST NG 1 1964
St Mary ExxonMobil Garden City Gas Plant 0.8 0.68 0.78 GT NG 6 1968
St Mary ExxonMobil Garden City Gas Plant 0.1 0.1 0.1 IC NG 6 1968
Jefferson ExxonMobil Grand Isle Gas 3 2.93 2.96 IC NG 1 1965
Jefferson ExxonMobil Grand Isle Gas 3 2.93 2.96 IC NG 1 1965
Jefferson ExxonMobil Grand Isle Gas 3 2.93 2.96 IC NG 1 1965
Concordia Sidney A Murray Jr Hydroelectric 24 24 24 HY WAT 7 1990
Concordia Sidney A Murray Jr Hydroelectric 24 24 24 HY WAT 8 1990
Concordia Sidney A Murray Jr Hydroelectric 24 24 24 HY WAT 6 1990
Concordia Sidney A Murray Jr Hydroelectric 24 24 24 HY WAT 5 1990
Concordia Sidney A Murray Jr Hydroelectric 24 24 24 HY WAT 6 1990
Concordia Sidney A Murray Jr Hydroelectric 24 24 24 HY WAT 5 1990
Concordia Sidney A Murray Jr Hydroelectric 24 24 24 HY WAT 6 1990
Concordia Sidney A Murray Jr Hydroelectric 24 24 24 HY WAT 7 1990
East Baton Rou Formosa Plastics 38.2 33 37 GT NG 3 1985
East Baton Rou Formosa Plastics 42.7 33 37 GT NG 7 1990
East Baton Rou Formosa Plastics 38.8 33 37 GT NG 7 1996
East Baton Rou Formosa Plastics 12 11 11 ST NG 5 1985
East Baton Rou Formosa Plastics 12 11 11 ST NG 10 1990
Washington Gaylord Container Bogalusa 37 34.41 34.78 ST NG 4 1999
Washington Gaylord Container Bogalusa 25 23.25 23.5 ST NG 3 1981
Washington Gaylord Container Bogalusa 37.5 34.88 35.25 ST NG 6 1979
Iberville Georgia Gulf Plaquemine 102 80 90 GT NG OTH 5 1997
Iberville Georgia Gulf Plaquemine 102 80 90 GT NG OTH 5 1997
Iberville Georgia Gulf Plaquemine 102 80 90 GT NG OTH 5 1997
East Baton Rou Georgia Pacific Port Hudson 67.7 62.96 63.64 ST NG BLQ WDS 6 1986
St James IMC Phosphates Company Uncle Sam 11 10.23 10.34 ST OTH 1 1968
St James IMC Phosphates Company Uncle Sam 11 10.23 10.34 ST OTH 1 1968
St James Colonial Sugar Refinery 0.7 0.6 0.7 ST NG 9 1930
St James Colonial Sugar Refinery 2.5 1.7 1.7 ST NG 3 1977
St James Colonial Sugar Refinery 1.7 1.5 1.5 ST NG 2 1957
St James Colonial Sugar Refinery 2.5 2.1 2 ST NG 9 1969
Source: EIA Electricity Historical Spreadsheets Technology Assessment Division, Department of Natural Resources 52

EXHIBIT VICogeneration Facilities in Louisiana(2002), Age and Cogeneration Type
Generation Capacity MW Energy Source(s) Initial Date of Operation
Parish Plant Name Nameplate Summer Winter Prime Mover Source 1 Source 2 Source 3 Month, Year
Morehouse International Paper Louisiana Mill 21.8 21.8 21.8 ST NG BLQ WDS 12 1960
Morehouse International Paper Louisiana Mill 37.5 37.5 37.5 ST NG BLQ WDS 11 1967
De Soto Mansfield Mill 40 19.94 23.18 ST WDS 10 1981
De Soto Mansfield Mill 40 31.33 31.29 ST WDS NG TDF 12 1981
De Soto Mansfield Mill 30 25.17 19.77 ST WDS 12 1981
De Soto Mansfield Mill 25 21.37 19.91 GT NG 8 1995
Rapides Pineville Mill 25 22 28 ST NG 8 1968
Iberia Jeanerette Sugar 2.5 2.33 2.35 ST AB 10 1983
St James Kaiser Aluminum 16 15 17 GT NG 3 1969
St James Kaiser Aluminum 16 15 17 GT NG 4 1969
St James Kaiser Aluminum 16 15 17 GT NG 4 1969
St James Kaiser Aluminum 24.7 21 24 GT NG 4 1974
St James Kaiser Aluminum 18.7 17 17 ST NG 2 1958
St James Kaiser Aluminum 18.7 17 17 ST NG 2 1958
St James Kaiser Aluminum 7.2 6 6 ST NG 2 1969
Pointe Coupee Big Cajun 1 113.6 119 125 ST NG DFO 6 1972
Pointe Coupee Big Cajun 1 113.6 119 125 ST NG DFO 6 1972
Pointe Coupee Big Cajun 2 638 580 575 ST SUB DFO 7 1981
Pointe Coupee Big Cajun 2 632.5 575 575 ST SUB DFO 7 1982
Pointe Coupee Big Cajun 2 632.5 575 575 ST SUB DFO 4 1983
Ouachita NRG Sterlington Power LLC 25 25 27.5 GT NG 6 2000
Ouachita NRG Sterlington Power LLC 25 22 24.5 GT NG 6 2000
Ouachita NRG Sterlington Power LLC 25 22 24.9 GT NG 3 2001
Ouachita NRG Sterlington Power LLC 25 22 24.8 GT NG 3 2001
Ouachita NRG Sterlington Power LLC 25 19 21.5 GT NG 6 2001
Ouachita NRG Sterlington Power LLC 25 18 20 GT NG 6 2001
Ouachita NRG Sterlington Power LLC 25 18 21 GT NG 3 2001
Ouachita NRG Sterlington Power LLC 16 17 19.5 GT NG 9 2000
Ouachita NRG Sterlington Power LLC 25 15 16.5 GT NG 4 2000
Lincoln Louisiana Tech University Power Plant 5 4.6 4.8 ST NG 4 1983
Calcasieu Lyondell Chemical Lake Charles 4.3 4 4.04 ST NG 1 1982
Iberia M A Patout Son Ltd 1 0.93 1 ST AB NG MSW 10 1981
Iberia M A Patout Son Ltd 2 1.86 2 ST AB NG MSW 10 1981
St Bernard Chalmette Refinery LLC 5.7 1.2 1.5 OT OTH 3 1990
Calcasieu Nelson Industrial Steam 113.6 107 109 ST PC NG 2 1959
Source: EIA Electricity Historical Spreadsheets Technology Assessment Division, Department of Natural Resources 53

EXHIBIT VICogeneration Facilities in Louisiana(2002), Age and Cogeneration Type
Generation Capacity MW Energy Source(s) Initial Date of Operation
Parish Plant Name Nameplate Summer Winter Prime Mover Source 1 Source 2 Source 3 Month, Year
Calcasieu Nelson Industrial Steam 113.6 106 108 ST PC NG 5 1959
Jefferson Davis Bayou Cove Peaking Power 80 75 85 GT NG 9 2002
Jefferson Davis Bayou Cove Peaking Power 80 75 85 GT NG 7 2002
Jefferson Davis Bayou Cove Peaking Power 80 75 80 GT NG 7 2002
Jefferson Davis Bayou Cove Peaking Power 80 75 85 GT NG 10 2002
St Charles Taft Cogeneration Facility 170 155 180 CT NG PL 7 2002
St Charles Taft Cogeneration Facility 170 155 180 CT NG 8 2002
St Charles Taft Cogeneration Facility 170 155 180 CT NG 9 2002
St Charles Taft Cogeneration Facility 325 325 325 CA NG OG 10 2002
Iberville PCS Nitrogen Fertilizer LP 26 19 23 GT NG 11 1986
Ouachita Perryville Power Station 210.5 169 180 CT NG 6 2002
Ouachita Perryville Power Station 210.5 169 180 CT NG 7 2002
Ouachita Perryville Power Station 237 224 235 CA NG 7 2002
Ouachita Perryville Power Station 172.9 156 162.5 CT NG 6 2001
West Baton RouPort Allen 3.8 3.2 3.4 GT NG 5 1990
West Baton RouPort Allen 3.8 3.4 3.6 GT NG 5 1990
Iberville Plaquemine 20 18.8 18.8 ST NG 12 1971
Iberville Plaquemine 24 22.5 22.5 ST NG 0 1976
Calcasieu PPG Plant C Caustic 3.4 2.7 2.7 ST OTH 10 1986
Calcasieu PPG Powerhouse A 7.5 7.5 7.5 ST NG 6 1943
Calcasieu PPG Powerhouse A 7.5 7.5 7.5 ST NG 6 1943
Calcasieu PPG Powerhouse A 7.5 7.5 7.5 ST NG 5 1943
Calcasieu PPG Powerhouse A 10 10 10 ST NG 10 1950
Calcasieu PPG Powerhouse A 20 20 20 ST NG 8 1957
Calcasieu PPG Powerhouse C 73.1 55 63 CT NG 8 1977
Calcasieu PPG Powerhouse C 73.1 55 63 CT NG 6 1978
Calcasieu PPG Powerhouse C 57.1 52 52 CA NG 9 1977
Calcasieu PPG Powerhouse C 77.2 70.6 78.6 CT NG 8 1986
Calcasieu PPG Powerhouse C 77.2 70.6 78.6 CT NG 8 1986
Calcasieu PPG Riverside 35 35 40 ST NG 9 1947
Calcasieu PPG Riverside 45 42 46 ST NG 6 1950
Calcasieu PPG Riverside 82 77 82 ST NG 2 1969
Ouachita Ouachita Generating Plant 179.3 161 161 CT NG 8 2002
Ouachita Ouachita Generating Plant 179.3 161 161 CT NG 8 2002
Ouachita Ouachita Generating Plant 179.3 161 161 CT NG 8 2002
Source: EIA Electricity Historical Spreadsheets Technology Assessment Division, Department of Natural Resources 54

EXHIBIT VICogeneration Facilities in Louisiana(2002), Age and Cogeneration Type
Generation Capacity MW Energy Source(s) Initial Date of Operation
Parish Plant Name Nameplate Summer Winter Prime Mover Source 1 Source 2 Source 3 Month, Year
Ouachita Ouachita Generating Plant 122 111 111 CA NG 8 2002
Ouachita Ouachita Generating Plant 122 111 111 CA NG 8 2002
Ouachita Ouachita Generating Plant 122 111 111 CA NG 8 2002
Bossier Energy Field Services 0.2 0.2 0.7 IC NG 1 1961
Bossier Energy Field Services 0.4 1.3 0.9 IC NG 1 1961
Bossier Energy Field Services 0.4 0.9 0.3 IC NG 1 1961
Bossier Energy Field Services 0.2 0.2 0.2 IC NG 1 1961
Ouachita Plant 31 Paper Mill 6 6 6 ST NG WDS BLQ 1 1928
Ouachita Plant 31 Paper Mill 6 6 6 ST NG WDS BLQ 1 1930
Ouachita Plant 31 Paper Mill 6 6 6 ST NG WDS BLQ 1 1948
Ouachita Plant 31 Paper Mill 25 28 28 ST NG WDS BLQ 1 1964
Ouachita Plant 31 Paper Mill 20 15 15 ST NG WDS BLQ 1 1977
Calcasieu RS Cogen 70 60.2 65.8 CA NG 12 2002
Calcasieu RS Cogen 195 167.7 183.3 CT NG 12 2002
Calcasieu RS Cogen 195 167.7 183.3 CT NG 12 2002
Jackson Stone Container Hodge 3 3 3 ST NG 1 1938
Jackson Stone Container Hodge 5 5 5 ST NG 12 1952
Jackson Stone Container Hodge 15.6 15.6 15.6 ST NG 8 1957
Jackson Stone Container Hodge 27.5 27.5 27.5 ST NG 8 1972
Jackson Stone Container Hodge 23.3 23.3 23.3 ST NG 10 1972
West Feliciana St Francisville Mill 12.5 15 15 ST BLQ 3 1966
Ascension Geismar Plant 45 40 48 CT NG 10 1985
Ascension Geismar Plant 45 40 48 CT NG 11 1985
Source: EIA Electricity Historical Spreadsheets Technology Assessment Division, Department of Natural Resources 55

EXHIBIT VIIJointly Owned Electric Generating Plant in Louisiana (2002)
Jointly Owned Electric Generating Units, by Company, by Plant 2002
PrimaryNet Summer Energy Unit Percent
Company, Plant Unit ID Capability, MW Unit Type Source Status Date Owner Companies OwnedCLECO Utility Group Inc Dolet Hills (DeSoto Parish) 1 650 ST LIG OP 1986 CLECO 50.0%
Southwestern Electric Power Company (SWEPCO) 50.0% Rodemacher (Rapides Parish) 2 523 ST SUB OP 1982 CLECO 30.0%
Lafayette Public Power Authority 50.0%Louisiana Energy & Power Authority 20.0%
Entergy Gulf States Inc. Nelson Coal (Calcasieu Parish) 6 550 ST SUB OP 1982 Entergy Gulf States Inc 70.0%
Sam Rayburn Municipal Power Agency 20.0%Sam Rayburn G & T Inc 10.0%
R S Nelson (Calcasieu parish) 1 98 ST Nat Gas OP 19592 98 ST Nat Gas OP 1956 Conoco Inc 36.1%
Entergy Gulf States inc 1.0%Vista Energy Ltd Partnership 13.4%
Citgo Petroleum Corp 49.5% Riverbend (West Feliciana Parish) 1 936 NB Uranium OP 1986 Entergy Gulf States Inc 70.0%
Entergy Power Inc 30.0%
City of Natchitoches Natchitoches (Natchitoches Parish) 10 26 ST Nat Gas OP 1972
2 1.5 IC Nat Gas OP 19423 1.5 IC Nat Gas OP 19426 2.8 IC Nat Gas OP 19627 2.8 IC Nat Gas OP 19628 6 ST Nat Gas OP 19629 12.6 ST Nat Gas OP 1966 City of Lafayette 100.0%
Source: EIA Electricity Historical Spreadsheets Technology Assessment Division, Department of Natural Resources 56.

EXHIBIT VIIILouisiana 2002 Net Generation by Type of Producer and Energy Source
YEAR STATE TYPE OF PRODUCER ENERGY SOURCE GENERATION (Megawatthours)
2002 LA Total Electric Power Industry Coal 22,050,9062002 LA Total Electric Power Industry Petroleum 1,864,5362002 LA Total Electric Power Industry Natural Gas 47,900,8482002 LA Total Electric Power Industry Other Gases 1,497,6242002 LA Total Electric Power Industry Nuclear 17,305,3282002 LA Total Electric Power Industry Hydroelectric 891,4412002 LA Total Electric Power Industry Other Renewables 2,862,7912002 LA Total Electric Power Industry Other 597,4902002 LA Total Electric Power Industry Total 94,970,9642002 LA Electric Generators, Electric Utilities Coal 12,258,6942002 LA Electric Generators, Electric Utilities Petroleum 68,4602002 LA Electric Generators, Electric Utilities Natural Gas 25,085,9942002 LA Electric Generators, Electric Utilities Other Gases 203,4842002 LA Electric Generators, Electric Utilities Nuclear 17,305,3282002 LA Electric Generators, Electric Utilities Hydroelectric 02002 LA Electric Generators, Electric Utilities Other Renewables 02002 LA Electric Generators, Electric Utilities Other 02002 LA Electric Generators, Electric Utilities Total 54,921,9602002 LA Electric Generators, Independent Power Producers Coal 9,766,6812002 LA Electric Generators, Independent Power Producers Petroleum 118,5812002 LA Electric Generators, Independent Power Producers Natural Gas 6,105,3442002 LA Electric Generators, Independent Power Producers Other Gases 02002 LA Electric Generators, Independent Power Producers Nuclear 02002 LA Electric Generators, Independent Power Producers Hydroelectric 891,4412002 LA Electric Generators, Independent Power Producers Other Renewables 59,0872002 LA Electric Generators, Independent Power Producers Other 02002 LA Electric Generators, Independent Power Producers Total 16,941,1342002 LA Combined Heat and Power, Electric Power Coal 02002 LA Combined Heat and Power, Electric Power Petroleum 1,646,2292002 LA Combined Heat and Power, Electric Power Natural Gas 3,6832002 LA Combined Heat and Power, Electric Power Other Gases 02002 LA Combined Heat and Power, Electric Power Nuclear 02002 LA Combined Heat and Power, Electric Power Hydroelectric 02002 LA Combined Heat and Power, Electric Power Other Renewables 0
Source:EIA Electricity Historical Spreadsheets Technology Assessment Division, Department of Natural Resources 57
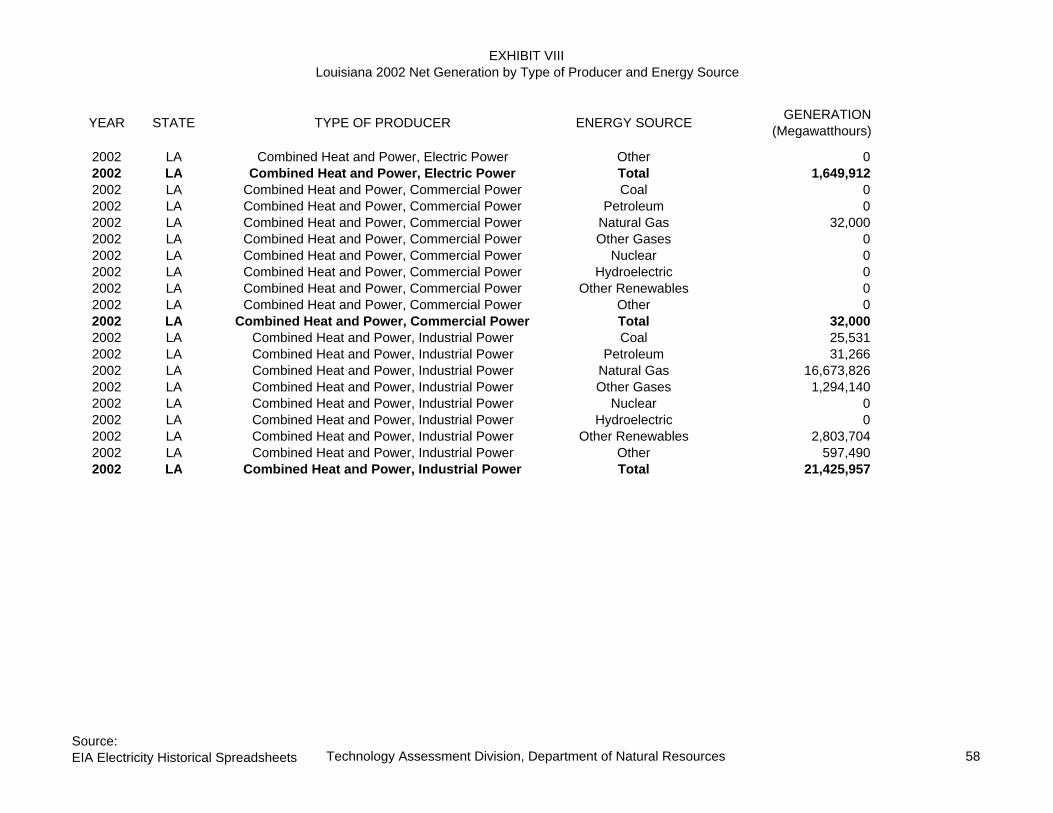
EXHIBIT VIIILouisiana 2002 Net Generation by Type of Producer and Energy Source
YEAR STATE TYPE OF PRODUCER ENERGY SOURCE GENERATION (Megawatthours)
2002 LA Combined Heat and Power, Electric Power Other 02002 LA Combined Heat and Power, Electric Power Total 1,649,9122002 LA Combined Heat and Power, Commercial Power Coal 02002 LA Combined Heat and Power, Commercial Power Petroleum 02002 LA Combined Heat and Power, Commercial Power Natural Gas 32,0002002 LA Combined Heat and Power, Commercial Power Other Gases 02002 LA Combined Heat and Power, Commercial Power Nuclear 02002 LA Combined Heat and Power, Commercial Power Hydroelectric 02002 LA Combined Heat and Power, Commercial Power Other Renewables 02002 LA Combined Heat and Power, Commercial Power Other 02002 LA Combined Heat and Power, Commercial Power Total 32,0002002 LA Combined Heat and Power, Industrial Power Coal 25,5312002 LA Combined Heat and Power, Industrial Power Petroleum 31,2662002 LA Combined Heat and Power, Industrial Power Natural Gas 16,673,8262002 LA Combined Heat and Power, Industrial Power Other Gases 1,294,1402002 LA Combined Heat and Power, Industrial Power Nuclear 02002 LA Combined Heat and Power, Industrial Power Hydroelectric 02002 LA Combined Heat and Power, Industrial Power Other Renewables 2,803,7042002 LA Combined Heat and Power, Industrial Power Other 597,4902002 LA Combined Heat and Power, Industrial Power Total 21,425,957
Source:EIA Electricity Historical Spreadsheets Technology Assessment Division, Department of Natural Resources 58