low-cost aquifer storage and recovery: implications for · pdf filelow-cost aquifer storage...
TRANSCRIPT

Case Study
Low-Cost Aquifer Storage and Recovery: Implications forImproving Drinking Water Access for Rural Communities
in Coastal BangladeshS. Sultana1; K. M. Ahmed2; S. M. Mahtab-Ul-Alam3; M. Hasan4; A. Tuinhof5; S. K. Ghosh6;
M. S. Rahman7; P. Ravenscroft8; and Y. Zheng9
Abstract: Fresh water resources are scarce in rural communities in the southern deltaic plains of Bangladesh where both shallow and deepgroundwater is frequently brackish, and fresh water ponds have been increasingly salinized by inundation during storm surges and brackish-water aquaculture. Low-cost aquifer storage and recovery (ASR) schemes were constructed at 13 villages in three coastal districts by devel-oping storage in shallow confined fine to medium sand aquifers overlain by variable thicknesses of silt and clay. A typical ASR schemeconsisted of a double-chambered graded sand filtration tank with a volume of 19.5 m3 that feeds filtered pond water to four to six largediameter (d ¼ 30.5 or 56 cm) infiltration wells through PVC pipes fitted with stop valves and flow meters. The infiltration wells werecompleted at 18–31 m below ground and filled with well-sorted gravel capped with a thin layer of fine sand that acts as a second stagefilter. Infiltration rates at 13 sites averaged 3 m3=day (range: 3–6 m3=day) over one year of operation. At 11 sites where water was abstracted,the recovery rate ranged from 5 to 40%. The source pond source water frequently had turbidity values of ≥ 100 NTU. After sand filtration, theturbidity is typically 5 NTU. Despite this, clogging management involving frequent (monthly to weekly) manual washing to remove finematerials deposited in the sand filtration tank and the infiltration wells is found to be necessary and effective, with post-manual-washingoperational infiltration rates restored to annual average values. E. coli counts in recovered water are greatly reduced compared to raw pondwater, although E. coli is still detected in about half of the samples. Arsenic in recovered water was detected to be at level of >100 μg=Lrepeatedly at three sites, suggesting that As risks must be carefully managed and require further investigation. DOI: 10.1061/(ASCE)HE.1943-5584.0001100. © 2014 American Society of Civil Engineers.
Author keywords: Managed aquifer recharge; Aquifer storage and recovery; Low cost; Climate resilience; Coastal Bangladesh;Groundwater; Water security; Water scarcity; Clogging; Arsenic.
Introduction
The residents of the southwestern coastal districts Bagerhat,Khulna, and Satkhira in Bangladesh have limited access to safedrinking water due to widespread salinity in surface and ground-water, elevated arsenic in groundwater, and a rapidly growing pop-ulation [Ahmed et al. 2004; British Geological Survey (BGS) andDepartment of Public Health Engineering (DPHE) 2001; Khan et al.2003; Khanom and Salehin 2012]. The shallow aquifer is mostlybrackish, with fresh water available in small pockets at shallowdepths over limited areas. Rural communities collect rainwater
for drinking and cooking during the monsoon season. In the dryseason, the communities use pond water, which is being threatenedby inundation from cyclonic storm surges and by ponds convertedto brackish-water shrimp aquaculture (Ahmed et al. 2009). Theregion is vulnerable to impacts of climate change and sea level rises[Department of Environment (DOE) 1993].
With abundant monsoon precipitation, aquifer storage and re-covery (ASR) in brackish aquifers is an option for climate-resilient,year-round water supplies in coastal Bangladesh (Maliva andMissimer 2010; Pyne 2005). To the best of the authors’ knowledge,no prior work has succeeded in demonstrating its utility in this
1Assistant Professor, Dept. of Geology, Faculty of Earth and Environ-mental Sciences, Univ. of Dhaka, Curzon Hall Campus, Dhaka 1000,Bangladesh.
2Professor, Dept. of Geology, Faculty of Earth and EnvironmentalSciences, Univ. of Dhaka, Curzon Hall Campus, Dhaka 1000, Bangladesh.
3Graduate Research Assistant, Dept. of Geology, Faculty of Earthand Environmental Sciences, Univ. of Dhaka, Curzon Hall Campus,Dhaka 1000, Bangladesh.
4Graduate Research Assistant, Dept. of Geology, Faculty of Earthand Environmental Sciences, Univ. of Dhaka, Curzon Hall Campus,Dhaka 1000, Bangladesh.
5Hydrologist, Acacia Water, Jan van Beaumontstraat 1, 2805 RNGouda, Netherlands.
Note. This manuscript was submitted on December 14, 2013; approvedon September 9, 2014; published online on November 7, 2014. Discussionperiod open until April 7, 2015; separate discussions must be submitted forindividual papers. This paper is part of the Journal of Hydrologic Engi-neering, © ASCE, ISSN 1084-0699/B5014007(12)/$25.00.
6Superintendent Engineer, Dept. of Public Health Engineering, DPHEBhavan, 14, Shaheed Captain Mansur Ali Sarani, Kakrail, Dhaka 1000,Bangladesh.
7Executive Engineer, Dept. of Public Health Engineering, DPHEBhavan, 14, Shaheed Captain Mansur Ali Sarani, Kakrail, Dhaka 1000,Bangladesh.
8WASH Specialist, Water and Environmental Sanitation Section,UNICEF Bangladesh, BSL Office Complex, 1 Minto Rd., Dhaka 1000,Bangladesh; presently, Consultant, Water and Sanitation Program(WSP), c/o World Bank, Plot E 32, Sher-e-Bangla Nagar, Agargaon,Dhaka 1207, Bangladesh.
9Professor, School of Earth and Environmental Sciences, Queens Col-lege, City Univ. of New York, 65-30 Kissena Blvd., Flushing, NY 11367;and Adjunct Senior Research Scientist, Lamont-Doherty Earth Observatoryof Columbia Univ., Palisades, NY 10964; formerly, WASH Specialist,Water and Environmental Sanitation Section, UNICEF Bangladesh, BSLOffice Complex, 1 Minto Rd., Dhaka 1000, Bangladesh (correspondingauthor). E-mail: [email protected]; [email protected]
© ASCE B5014007-1 J. Hydrol. Eng.
J. Hydrol. Eng. 2015.20.
Dow
nloa
ded
from
asc
elib
rary
.org
by
UN
IVE
RSI
TY
OF
DH
AK
A o
n 02
/18/
15. C
opyr
ight
ASC
E. F
or p
erso
nal u
se o
nly;
all
righ
ts r
eser
ved.

region because low-cost construction, maintenance, and opera-tional methods are yet to be developed to suit local conditionsand technical capacities. Previous attempts in India (Gale et al.2006) illustrate the difficulty. For example, capturing monsoon run-off through ASR wells was proposed as a concept for an alluvialcoastal aquifer in eastern India, with a model simulating an en-hanced annual recharge rate up to 0.22 m (Holländer et al.2009). However, subsequent field testing of the concept was notsuccessful due to high particle loadings of the source water(Holländer et al. 2009), leading those authors to conclude thatlow-cost pretreatment technology was needed to lower particulateconcentrations of source water.
That clogging emerged as a challenge to ASR application incoastal aquifers in South Asia is not surprising because a reductionin hydraulic conductivity beneath infiltration facilities and aroundrecharge wells is a frequent reason for abandonment of ASRschemes anywhere (Martin 2013). Despite the improved under-standing of many physical, chemical, and biological factors thatcontribute to clogging (Pyne 1994), studies indicate the needfor clogging management techniques specific to the aquifer andsource-water conditions. Clogging can occur around the wellscreen, in the filter pack, or in the aquifer (Martin 2013). Consid-erable uncertainty still exists concerning the causes and degree ofclogging in ASR (Maliva and Missimer 2010). Field testing isdesirable to address design, operation, and maintenance needs.
In addition to clogging, the risk that reactive organic matter in pondwater could mobilize As in shallow groundwater in Bangladesh hasbeen a subject of debate (Datta et al. 2011; McArthur et al. 2011;Neumann et al. 2010; Sengupta et al. 2008). Because pond waterfrequently contains high levels of pathogens (Hoque 1999; Lubyet al. 2008), the potential to reduce microbial contaminationthrough ASR is appealing but has not been evaluated.
To evaluate the feasibility of ASR for rural community watersupply in coastal Bangladesh, 13 low-cost ASR schemes were con-structed at sites (Fig. 1) chosen to encompass a range of aquifersalinity (Table 1). Managing the risks of clogging by pond waterwith high particle loadings was considered during the design, con-struction, and implementation phases, and countermeasures includeda sand filtration tank and a sand filter placed at the top of the infil-tration wells. Clogging management methods employing poweredand/or manual washing were tested to develop operational protocolsacceptable to rural communities. Their efficacy was assessed throughobservation of operational infiltration rates. Monitoring of microbialand chemical water quality, including As, was conducted for sourcepond water and recovered groundwater for risk assessment.
Study Area and Coastal Aquifer Characteristics
The region has three distinct seasons: a hot humid summer fromMarch to June, a warm rainy monsoon from July to October,
Fig. 1. Locations of 13 aquifer storage and recovery (ASR) sites in three districts of coastal Bangladesh. Target aquifer for ASR is the confinedshallow brackish aquifer common in coastal Bangladesh where the thickness of surficial clay layer and the confined shallow aquifer range from 3 to21 m and 10 to >15 m, respectively (Table 1 for aquifer characteristics)
© ASCE B5014007-2 J. Hydrol. Eng.
J. Hydrol. Eng. 2015.20.
Dow
nloa
ded
from
asc
elib
rary
.org
by
UN
IVE
RSI
TY
OF
DH
AK
A o
n 02
/18/
15. C
opyr
ight
ASC
E. F
or p
erso
nal u
se o
nly;
all
righ
ts r
eser
ved.
and a cool dry winter from November to February. Annual rainfallranges from 1,500 to 2,000 mm with about 70% occurring duringthe monsoon. With an elevation of less than 10 m, southwesterncoastal Bangladesh is characterized by a gentle sloping surfaceshaped by sea level fluctuations in the Holocene (Islam and Tooley1999). The area is also known for the world’s largest mangroveforest, the Sundarbans. Human settlements are located along a largenumber of rivers and their tributaries flowing into the Bay ofBengal. Rivers are perennial, tidal, and seasonally flushed bymonsoonal rain.
The coastal aquifer system in Bangladesh is hydrogeologicallycomplex, characterized by frequent facies changes in both horizon-tal and vertical directions (Morgan and McIntire 1959), resulting ina heterogeneous distribution of high and low permeability layers[French Geological Survey (BRGM) 2005; Bangladesh WaterDevelopment Board (BWDB) 2013]. The aquifer sedimentswere supplied by the Ganges-Brahmaputra-Meghna rivers in theQuaternary period and overlapped with a deltaic arc (Umitsu 1993).
The target storage zone for the 13 ASR pilot sites is the shallowbrackish-water aquifer. It is composed of unconsolidated very fineto medium sand, occasionally interbedded with silty clay (Table 1).Surficial deposits are silty clay, clay, and clay loam. Groundwaterlevels are tidally influenced and fluctuate from 1 to 2.5 m below theground surface. Quartz is the dominant mineral in the aquifer sand,with feldspar, mica, and variable quantities of clay minerals withoccasional wood fragments. Aquifer hydraulic conductivity wasestimated at the ASA site through rising-head and falling-head slugtests and determined to be approximately 4.5 m=day (Barker 2013).A hydrochemical study (Bahar and Reza 2010) of 26 shallowgroundwater samples from southwestern Bangladesh found thatmost groundwater is slightly alkaline, with electrical conductivity(EC) ranging from ∼1 to 9.4 mS=cm and two major hydrochemicalfacies (Naþ − Kþ − Cl− − SO2−
4 and Naþ − Kþ − HCO−3 ).
Materials and Methods
Several designs of low-cost ASR schemes were considered. Theones that prioritized the ease of clogging management were se-lected for piloting. A typical ASR scheme (Fig. 2) comprises adouble-chambered filtration tank, multiple (4–6) large diameter(30.5 cm; 56 cm) infiltration wells that form a circle with a 3-mradius [Fig. 2(a)], and one abstraction well (diameter 5 cm)equipped with a hand pump. To monitor the performance of theASR, two piezometers (diameter 3.8 cm) are installed inside theinfiltration well screened at the top and bottom of the screened sec-tion of the well [Fig. 2(c)], with an additional four piezometersplaced at a 1-m radial distance away from the infiltration wells[Fig. 2(a)]. Local drillers employed direct circulation rotary andreverse circulation percussion drilling methods that used water-based drilling mud built from clay with cow dung as additives.Washing was carried out immediately after drilling to remove drill-ing mud from the borehole to prevent permanent formation dam-age. Washing continued until the water became clear, usually afterabout 1–1.5 h. Gravel was placed inside the well up to the top andto 1 m above the screen section in the annular space.
Turbidity of pond water at intake and after pretreatment at thesand filtration tank, and of recovered groundwater from the abstrac-tion well [Fig. 2(a)] were monitored daily with locally-madeturbidity tubes (Science workshop, University of Dhaka, Dhaka,Bangladesh) based on visual comparison scale. A turbidity meter(Lutron model TU-2016, Taipei, Taiwan) was used to calibrate theturbidity tubes. Electrical conductivity (EC), temperature, and pHwere also monitored daily using a portable conductivity meter
(HANNA HI 8733, Europe, Romania) and pH meter (HANNAHI 98127, Europe, Romania). When the EC of the abstractedgroundwater drops below the potable water limit (1,000 mg=Lchloride, or about 2 mS=cm), the local communities are allowedto collect water from the ASR. The volume of abstraction is re-corded by a flow meter attached to the sprout of the hand pumpof the abstraction well. Water levels in all the piezometers arerecorded daily.
The initial (and presumed maximum) infiltration rates were de-termined through falling head tests immediately after constructionwas completed, while the operational infiltration rates were deter-mined from daily monitoring data. For falling head tests, infiltrationwells were first topped up with filtered pond water from the filtra-tion tank by opening the gate valves to fully saturate the gravel.Then the rate of drop of the water level was measured using a stop-watch. This rate and the infiltration well diameter allowed anestimation of the presumably maximum infiltration rate before op-eration. Infiltration was monitored daily with a flow meter installedbetween the filtration tank and the infiltration well. The daily op-eration infiltration rate was calculated by dividing the total volumeof water by the number of days since infiltration started.
A preliminary water quality assessment was carried out. E. coliwas measured on May 24, 2013, Sept 20, 2013, and March 14,2014, for raw pond water and abstraction well water samples usingcompact Dry Nissui EC 240 plates (Tokyo, Japan) by adapting themanufacturer’s protocol (Kodaka et al. 2006) for water analysis byeither pipetting 1 mL of the water sample to the plates or adding amembrane filter after the 100-mL water sample has been processed.Care was taken to maintain sterile conditions by using alcoholwipes. Pond water samples collected before and after the filtrationtank plus groundwater samples from the abstraction wells were ob-tained on four dates: July 11, 2012, September 15, 2012, March 30,2013, and July 12, 2013. Samples were filtered through 0.45-mmembrane syringe filters and were acidified to 1% nitric acidand then sent for analysis of cations and trace elements includingAs, Fe, and Mn at Swiss Federal Institute of Aquatic Science andTechnology (EAWAG), Zurich, Switzerland by inductively coupledplasma optical emission spectrometry (ICP-OES) following stan-dard protocols. A nonacidified aliquot was sent for Cl analysisby ion chromatograph following standard protocols at EAWAG.Arsenic in abstracted groundwater was monitored weekly usingthe EconoQuick test kit (Industrial Test Systems, Rock Hill, SouthCarolina; George et al. 2012).
Design and Construction of ASR Schemes
The design for the ASR schemes included a sand filtration tank topretreat pond water; four to six large diameter infiltration wells; andan abstraction well equipped with a hand pump. Schematic designsof the sand filtration chamber, infiltration wells, piezometers,and the abstraction well are shown in Fig. 2. The cost includingmaterial and labor for the ASR schemes ranged from US$5,000to US$7,000, with the abstraction well (US$ 100) only a smallpercentage of the cost.
Sand Filtration Tank
The purpose of the tank is to remove or reduce suspended solids,organic matter, pathogens, and other compounds. The filtrationtank (dimension: 4.3 × 2.1 × 2.1 m3) is double chambered withsand in one chamber and filtered water in another [Fig. 2(b)].It is either placed at ground level or elevated up to 3 m to increasethe hydraulic head for infiltration. To prevent leaves, fish, andother debris from entering, a screen is placed at the intake point
© ASCE B5014007-3 J. Hydrol. Eng.
J. Hydrol. Eng. 2015.20.
Dow
nloa
ded
from
asc
elib
rary
.org
by
UN
IVE
RSI
TY
OF
DH
AK
A o
n 02
/18/
15. C
opyr
ight
ASC
E. F
or p
erso
nal u
se o
nly;
all
righ
ts r
eser
ved.

Tab
le1.
Aquifer
Characteristicsof
13ASR
Sitesin
Three
Districts
ofCoastal
Bangladesh
Serial
number
Upazila
Union
Village
Site
Latitu
deLongitude
Clay
thickness
(m)
Aquifer
thickness
(m)
Aquifer
lithology
Ambient
GW
ECa
(mS=
cm)
Pond
ECb
(mS=
cm)
Recovered
GW
ECc
(mS=
cm)
Volum
eof
infiltration(m
3)
Volum
eof
abstraction
(m3)
Minim
umMaxim
umMinim
umMaxim
um
BagerhatDistrict
1Mongla
Sundarban
Bastola
MOB
22.410
89.661
6>15
F-M
Sand
7.7
0.305
0.885
0.41
2.24
1804
742
2Mongla
Chila
Chila
MOC
22.405
89.644
119
F-M
Sand
15.5
0.107
2.8
1.02
3.81
2124
110
3Morrelganj
Hoglapasha
Borhoripur
MGS
22.579
89.920
1412
VF-FSand,
FSand
6.01
0.14
0.41
0.68
2.47
1752
249
4Morrelganj
Daibagnyahati
Daibagnyahati
MGD
22.559
89.860
11>15
FSand
4.5
0.5
0.8
0.55
0.87
2277
488
5Sarankhola
Dhansagor
Amragachhia
SAA
22.334
89.809
15>15
FSand,
F-M
Sand
8.8
0.15
0.49
0.24
0.88
1556
243
KhulnaDistrict
6Batiaghata
Gongarampur
Boronpara
BAB
22.634
89.514
9>15
F-M
Sand
6.47
2.2
3.9
0.33
31049
191
7Batiaghata
Gongarampur
Gangarampur
BAG
22.667
89.513
5>15
VF-FSand,
FSand
4.2
0.6
1.1
0.57
1.86
1933
429
8Dacope
Pankhali
Baruikhali
DAB
22.574
89.500
812
FSand
11.07
2.6
4.32
2.8
3.99
1444
353
9Dacope
Chalna
Chalna
DAC
22.597
89.515
21>15
F-M
Sand
4.7
1.6
2.9
1.8
2.9
2125
734
10Paikgachha
Paikgacha
Laskar
PAL
22.568
89.330
3>15
FSand
8.7
1.47
2.4
No
abstraction
1334
—
Satkhira
District
11Assasuni
Assasuni
Assasuni
ASA
22.547
89.178
12>15
F-M
Sand
7.7
1.16
3.96
1.43
3.68
1874
446
12Kaliganj
Kaliganj
Kaliganj
KAK
22.448
89.039
14>15
FSand
4.3
0.5
1.26
0.74
1.38
1551
532
13Sh
yamnagar
Shyamnagar
Chandipur
SHC
22.354
89.105
14>15
FSand,
F-M
Sand
7.26
0.15
4.5
No
abstraction
395
—
a Ambientgroundwater
electrical
conductiv
ity(G
WEC)was
measuredat
each
site
before
infiltrationbegan.
b Pon
dwater
electrical
conductiv
ity(EC)which
was
measureddaily
betweenJuly
2012
andJuly
2013.
c Recovered/abstractedgroundwaterelectricalconductiv
ity(EC)m
easureddaily,w
asreported
forthe
period
betweenthestartin
gdateof
abstractionandJuly2013.T
DS(m
g=L)isabout670
times
ofECinmS=
cm.
The
Bangladeshdrinking
water
quality
standard
forClis
1,000mg=
L.
© ASCE B5014007-4 J. Hydrol. Eng.
J. Hydrol. Eng. 2015.20.
Dow
nloa
ded
from
asc
elib
rary
.org
by
UN
IVE
RSI
TY
OF
DH
AK
A o
n 02
/18/
15. C
opyr
ight
ASC
E. F
or p
erso
nal u
se o
nly;
all
righ
ts r
eser
ved.

of a suction pump (nominal discharge 0.002 m3=s at a head of38 m) that lifts water from the pond. The sand filter has coarsebrown sand (0.5–2 mm) from Sylhet at the bottom and a finer sand(<0.5 mm) at the top. The coarse Sylhet sand is brought by boatfrom northeastern Bangladesh; the finer sand is locally sourced. Ontop of the sand filter, a ‘Geojute’ mesh (a biodegradable fabricwoven from jute fibers available locally) is placed to retain the sus-pended solids. Water slowly percolates downward, removing par-ticles and pathogens, with no chemical treatment. The filtered wateris directed to infiltration wells under gravity via a pipe networkfitted with stop valves and flow meters [Fig. 2(a)].
Infiltration Wells
Most infiltration wells were constructed with a diameter 56 cm butsome had a diameter of 30.5 cm. To minimize clogging risk, asecond stage of filtration was included in the infiltration wells[Fig. 2(c)]. A 15-cm layer of fine sand was placed in the top sectionof the well filled with well-sorted gravel of >2 mm diameter. Theupper section of the well was cased with a 30.5-cm-diameter PVCpipe, with length ranging from 3 to 21 m depending on surficialclay layer thickness [Fig. 2(c)]. The casing is connected to thescreen below through a reducing socket. The screen is made froma mild steel rod frame wrapped with plastic-coated galvanized iron(GI) wire mesh with 1 mm openings. To prevent percolation of un-treated water, sand recovered during drilling is used to fill the an-nular space at least 30 cm above the screen, and then sealed withlocal clay.
Abstraction Well
The abstraction well, a conventional suction-mode hand tubewell,is placed at the center of a 3-m-radius ring of infiltration wells[Fig. 2(a)] and is screened over about half the thickness of the targetaquifer. As elsewhere in the world, separate recovery wells are usedto exploit the aquifer’s natural filtration ability to remove nutrientsand microorganisms during storage (McQuarrie and Carlson 2003;Pavelic et al. 2005; Pyne 2002).
Operation and Maintenance
Engagement of the community is critical because pond water isoften the only fresh water source during the dry season. Therefore,community consent is required for infiltration in the ASR systems.To prevent clogging by air entrainment during infiltration, which ismost likely when water is allowed to cascade into the well, a flow-control valve was connected to the deeper piezometer installedinside the infiltration well at a level below the static water levelof infiltration well to maintain a positive pressure. The maintenancetasks mostly needed for management of cogging are as follows.
Maintenance of the Sand Filtration Tank
The Geojute canvas on top of the sand filter is washed weekly toremove fine materials [Fig. 3(a)]. Additionally, fine sand below theGeojute canvas is manually washed and replaced every 4–6 weekswhen the operational infiltration rate shows a noticeable decline.
(a)
(b) (c)
Monitoring well
Abstraction well
Infiltration well
Filtration Tank
Source pond
3 m
1m Abstraction well
Piezometer
Infiltration well
Jute Canvas
Fine Sand
Sylhet Sand
3.8 cm (1.5 in) diaShallow Piezometer
3.8 cm (1.5 in) diaDeep Piezometer
55.8 cm (22 in) diaBorehole
30.5 cm (12 in) PVC Casing
Clay Sealing
Fine Sand
Back Filled Sand for Annular Space
Reducing Socket
45.7 cm (18 in ) ScreenGI wire with plastic coatingand with 1 mm slot opening
Sorted Gravel (> 2mm)
Clay
Fine Sand
Silty Clay
Very Fine Sand
Very Fine Sand
Fig. 2. Design components of the low-cost ASR schemes piloted in coastal Bangladesh: (a) schematic diagram illustrating the configuration of keycomponents of a representative ASR scheme with four infiltration wells, one abstraction well in the center, and four additional piezometers, with aphotograph of the ASR scheme from the BAG site; (b) schematic drawing of sand filtration chamber to pretreat pond water; (c) schematic drawing of alarge diameter infiltration well; the lithology represents what is typically encountered in coastal Bangladesh (Table 1 for aquifer characteristics)
© ASCE B5014007-5 J. Hydrol. Eng.
J. Hydrol. Eng. 2015.20.
Dow
nloa
ded
from
asc
elib
rary
.org
by
UN
IVE
RSI
TY
OF
DH
AK
A o
n 02
/18/
15. C
opyr
ight
ASC
E. F
or p
erso
nal u
se o
nly;
all
righ
ts r
eser
ved.

Maintenance of Infiltration Wells
The sand and gravel are periodically backwashed, and when nec-essary, replaced from the upper part of the casing. The top fine sandlayer is replaced once a month. When there is a reduction in theoperational infiltration rate, power backwashing is performed usinga mechanical pump (nominal discharge 0.008 m3=s at a head of38 m) by injecting pond water through a 10 m hose inserted intothe infiltration wells [Fig. 3(b)]. This energized flow of water stirsup the gravel, removing the fines. Power backwashing was per-formed typically every 6 months. Although this method is quick,it can result in loss of large amounts of gravel. Moreover, contrac-tors need to be hired at a cost of US$100 each time. Starting in July2013, a simpler approach was adopted involving manually diggingout the gravel to a depth of about 1.5 m, and then washingwith water [Fig. 3(c)]. Visual comparison of gravels before andafter washing indicated that fine materials have been removed[Fig. 3(d)]. This method costs about US$10, results in no gravelloss, and can be done by the community themselves. Manualwashing is carried out at intervals of 1 to 2 months.
Results and Discussion
Recovery of Fresh Water
Water with a TDS of <600 mg=L (EC c. 1 mS=cm), is generallyconsidered to be palatable. Water becomes increasingly unpalatablewhen TDS exceeds 1,000 mg=L (EC c. 2 mS=cm). Bangladeshdrinking standard allows for 1,000 mg=L of chloride in coastalarea. However, fresh water with TDS <1,000 mg=L is so scarcein southwestern coastal Bangladesh that villagers often toleratedrinking water with EC up to 4 mS=cm (TDS ∼ 2,700 mg=L).
The EC of pond water at 13 sites (Table 1) ranged from veryfresh (0.1 mS=cm) to brackish (4.5 mS=cm), depending on dis-tance to tidal river channels or brackish-water shrimp cultivation.
EC varied over time and were higher during dry season than themonsoon when pond water is diluted by rainwater. The ambientshallow groundwater in the target aquifer is brackish with ECranging from 4.2 to 15.5 mS=cm (equivalent TDS ∼ 3,000 to10,000 mg=L, Table 1). The recovered water is usually fresh butis occasionally slightly brackish, with EC ranging from 0.24 to4 mS=cm (Table 1), reflecting different degrees of freshening.
Daily monitoring of the EC of the abstraction well as the infil-tration progressed was used to guide when abstraction could beginfor community water supply. At the 11 sites where water has beenabstracted, the infiltration volume ranged from 394 to 2,277 m3.The recovery rate, estimated based on the volume of water ab-stracted and the volume of water infiltrated (Table 1) ranged from5 to 40%. Sites were not ready for abstraction at the same timebecause the volume of infiltration and the ambient groundwatersalinity differed (Table 1). In two cases, no water was abstractedin 2013 due to high EC in recovered water (Table 1), although ab-straction was possible in 2014 after two summers of infiltration.
Clogging Risks and Management Efficacy
There is an inherent risk of clogging because pond water turbidityranges from 5 to 160 NTU with a mode of ∼100 NTU (Table 2).Higher values of pond water turbidity were observed in the earlymonsoon, and lower values during the peak monsoon. After pre-treatment in the sand tank, the turbidity of filtered pond water de-creased significantly at all sites but was still detectable (Table 2).Based on the modal value of turbidity of filtered pond water, thesites have been categorized as at low (0 NTU), medium (5 NTU)and high (>10 NTU) risk for clogging of infiltration wells(Table 2). Studies of an ASR site from Bolivar, South Australia,which used wastewater as source of injection, indicated low risksof short-term and long-term clogging when turbidity is <3 NTU,total nitrogen <10 mg=L, and pH < 7.2 (Pavelic et al. 2007a, b).Therefore, even though the risks of short-term clogging have been
Fig. 3. Photographs of clogging management methods: (a) washing the ‘Geojute’ cover of the sand filtration chamber; (b) power backwashing ofgravel pack of infiltration wells that costs about US$100 each time; (c) manual washing of gravel pack of infiltration well that costs about US$10 eachtime; (d) difference of gravel before and after manual washing
© ASCE B5014007-6 J. Hydrol. Eng.
J. Hydrol. Eng. 2015.20.
Dow
nloa
ded
from
asc
elib
rary
.org
by
UN
IVE
RSI
TY
OF
DH
AK
A o
n 02
/18/
15. C
opyr
ight
ASC
E. F
or p
erso
nal u
se o
nly;
all
righ
ts r
eser
ved.

reduced by sand filtration, there is a need to manage clogging forthe infiltration wells (see subsequent discussion). Furthermore, re-covered well water has a turbidity mode of 5 NTU (Table 2) and canalso be a risk factor for clogging over long term.
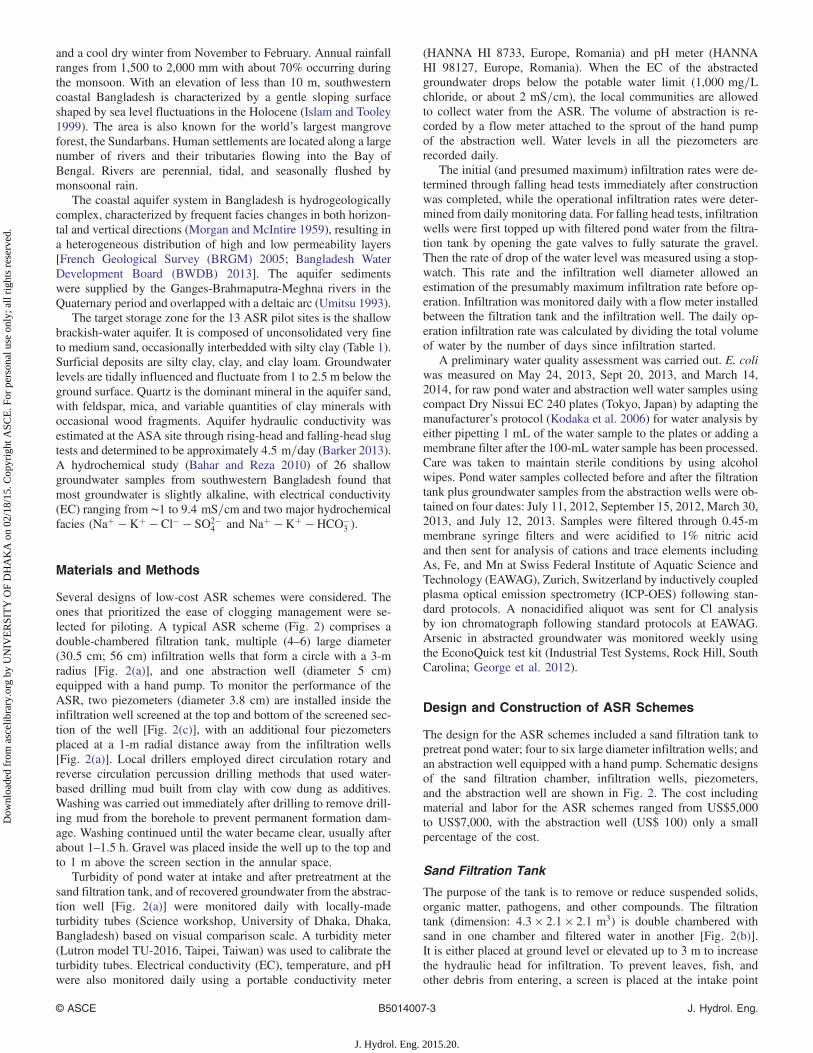
The initial and presumably maximum infiltration rates, deter-mined through falling head tests, varied from 6 to 20 m3=d (assum-ing that infiltration during each day would be 24 h, Fig. 4). Exceptfor three sites (BAB, SAA, and DAC, Fig. 4), the actual initialoperational infiltration rates were lower than the initial rates deter-mined from falling head tests, with site SHC showing the largestdifference (Fig. 4). The operational infiltration rates are expected tobe lower than the maximum rates because infiltration was inter-mittent, occurring only during the working hours of the pump op-erators, and subject to interruption due to pump failures and poweroutages. Furthermore, there is not enough pond water for infiltra-tion as monsoon rain wanes because villagers do not want to divertpond water for ASR systems as water level drops in the pond.
Changes in operational infiltration rates were used to assess theefficacy of clogging management methods. Of particular concern isthat the operational infiltration rates after one year had significantlydeclined compared to the initial operational rates (Fig. 4),especially for four sites where the reduction ranged from 59 to80%. The reductions in infiltration rates were highly variable acrossthe sites (Fig. 4) and do not correspond to the turbidity risks fromfiltered pond water categorized as low, medium and high (Table 2).This suggests that reduction in infiltration rates is influenced byfactors other than the turbidity in filtered water and that the locationof clogging is the infiltration well. To test whether washing of in-filtration wells could reverse the decline in infiltration rates,pumped backwashing [Fig. 3(b)] was used first at a few sites. Thisdid improve the operational infiltration rates although data were notcollected immediately after backwashing and thus could not be re-ported. Manual washing of gravel [Figs. 3(c and d)] took place inJuly 2013 and resulted in large increases in infiltration rates at allsites (Fig. 4). At site MGD, which had a 43% reduction in infiltra-tion rate, the infiltration rate has rebounded to about 9 m3=d postwashing, similar to the initial operational infiltration rate. However,most sites were not restored to the initial operational infiltrationrates but rather restored to the average operational infiltration rates(Fig. 4), which ranged from 3 to 6 m3=d over one year betweenJuly 2012 and July 2013. Although manual washing was success-ful, it is possible that clogging may become severe in the future andis consequently being monitored.
The pond water (28–36°C) is warmer than groundwater(27–30°C) but this does not appear to have changed the viscosityof the water enough to be of great concern. The pond water pHranged from 7.5 to 8.5, similar enough to groundwater with pHranging between 6.6 and 7.5.
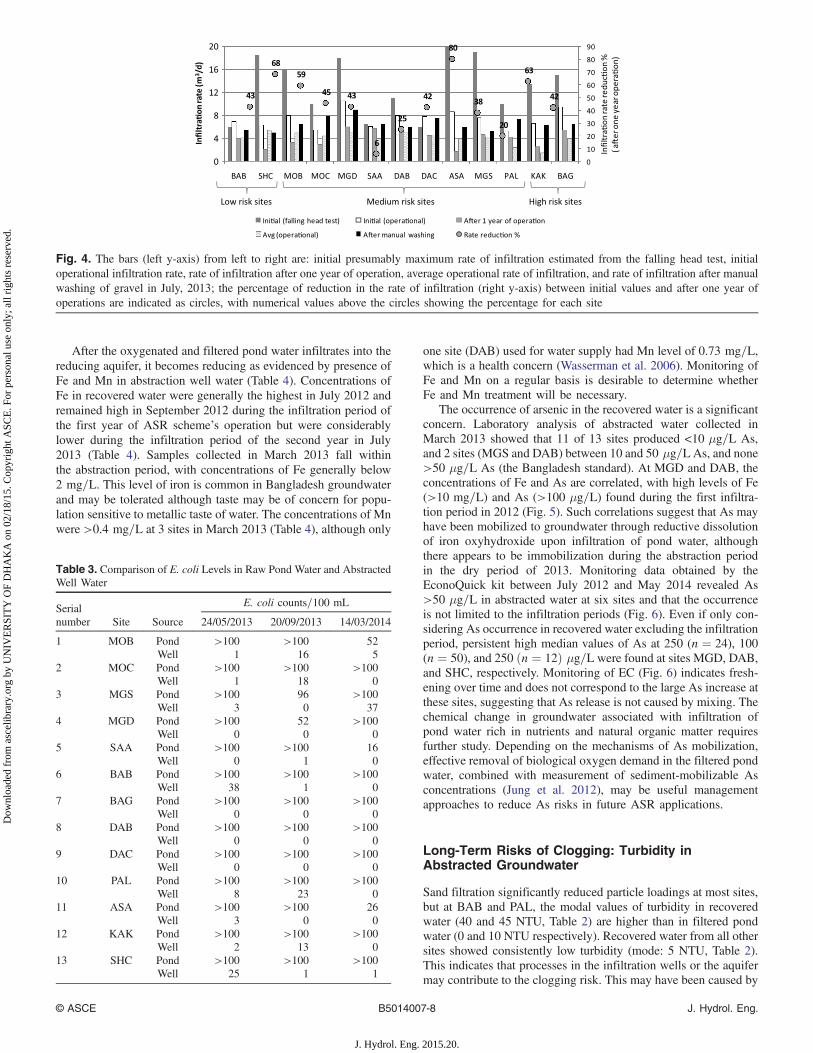
Drinking Water Quality
The drinking water withdrawn from the abstraction wells showedimprovement in terms of E. coli compared to pond water. Pondwater from all 13 sites, sampled on three dates, contained E. colicounts that were too high to quantify (>100 cfu=100 mL, Table 3).In comparison, the recovered groundwater, while not free of E. coli,has significantly reduced levels and occurrence rates of E. coli(Table 3). Nevertheless, about half of the samples still displayednonzero E. coli counts (Table 3), suggesting a need for disinfectionof the recovered water to ensure safety. Alternatively, abstraction ofgroundwater could be deferred for a period of time to take advan-tage of the aquifer’s natural process to disinfect, although thisrequires further study.T
able
2.Tu
rbidity
(inNTU)of
Raw
andFilteredPo
ndWaters,andGroundw
ater
from
Abstractio
nWells
betweenJuly
2012
andJuly
2013
Subjectedto
Daily
Monito
ring
Serial
number
Site
Pond
water
Filteredpond
water
Riskorderof
clogging
basedon
modeof
filteredwater
Abstractedwellwater
Minim
umMaxim
umMode
Median
Mean
Minim
umMaxim
umMode
Median
Mean
Minim
umMaxim
umMode
Median
Mean
6BAB
90150
100
100
115
560
05
5Low
5150
4045
5013
SHCa
15100
4040
400
750
515
Low
560
55
81
MOB
45150
100
100
100
5100
55
15Medium
55
55
52
MOC
40130
100
100
905
905
515
Medium
5150
55
404
MGD
540
55
105
55
55
Medium
580
510
305
SAA
5150
2020
355
455
55
Medium
5150
540
458
DAB
45150
100
100
110
55
55
5Medium
5150
55
259
DAC
20150
6565
805
55
55
Medium
520
55
511
ASA
10110
7540
555
55
55
Medium
55
55
53
MGS
10150
2525
357
6010
1515
High
575
55
2010
PALa
30150
5555
650
9510
510
High
15110
4550
5512
KAK
60160
100
100
115
070
1515
20High
535
55
107
BAG
10150
110
110
100
0150
155
40High
015
55
5a Sitesarenotabstracted
forwater
supply
dueto
high
EC
values
(Table
1).
© ASCE B5014007-7 J. Hydrol. Eng.
J. Hydrol. Eng. 2015.20.
Dow
nloa
ded
from
asc
elib
rary
.org
by
UN
IVE
RSI
TY
OF
DH
AK
A o
n 02
/18/
15. C
opyr
ight
ASC
E. F
or p
erso
nal u
se o
nly;
all
righ
ts r
eser
ved.
After the oxygenated and filtered pond water infiltrates into thereducing aquifer, it becomes reducing as evidenced by presence ofFe and Mn in abstraction well water (Table 4). Concentrations ofFe in recovered water were generally the highest in July 2012 andremained high in September 2012 during the infiltration period ofthe first year of ASR scheme’s operation but were considerablylower during the infiltration period of the second year in July2013 (Table 4). Samples collected in March 2013 fall withinthe abstraction period, with concentrations of Fe generally below2 mg=L. This level of iron is common in Bangladesh groundwaterand may be tolerated although taste may be of concern for popu-lation sensitive to metallic taste of water. The concentrations of Mnwere >0.4 mg=L at 3 sites in March 2013 (Table 4), although only
one site (DAB) used for water supply had Mn level of 0.73 mg=L,which is a health concern (Wasserman et al. 2006). Monitoring ofFe and Mn on a regular basis is desirable to determine whetherFe and Mn treatment will be necessary.
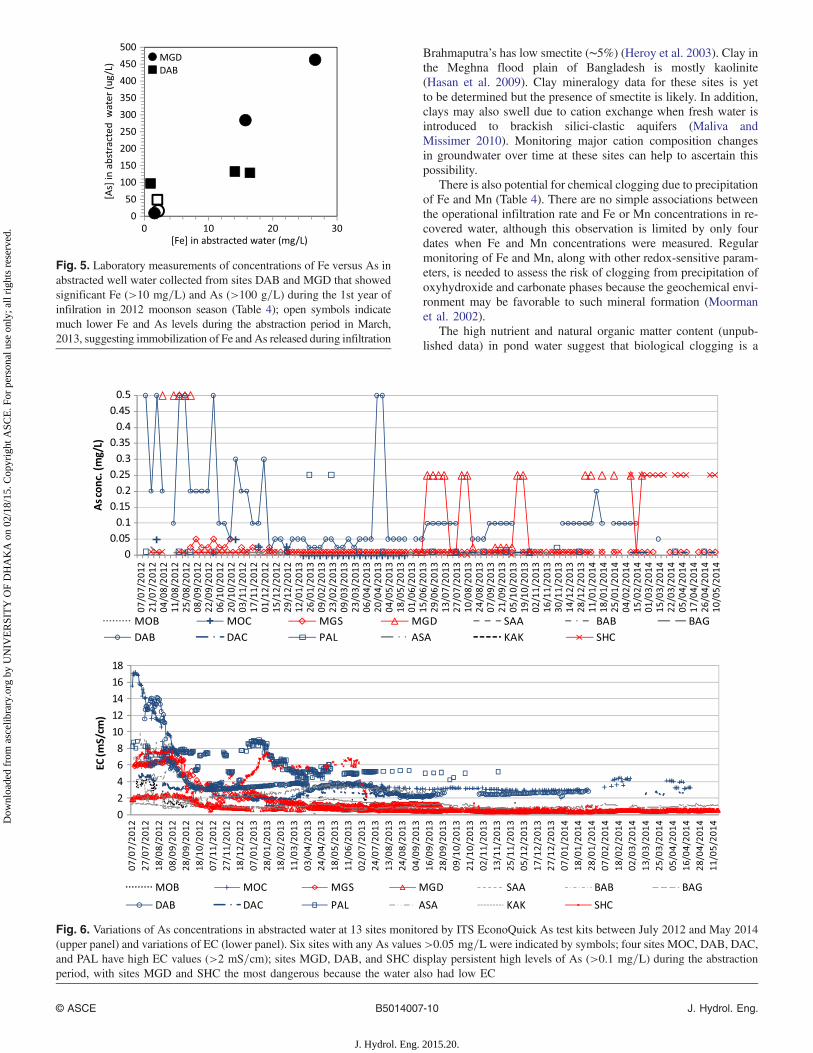
The occurrence of arsenic in the recovered water is a significantconcern. Laboratory analysis of abstracted water collected inMarch 2013 showed that 11 of 13 sites produced <10 μg=L As,and 2 sites (MGS and DAB) between 10 and 50 μg=L As, and none>50 μg=L As (the Bangladesh standard). At MGD and DAB, theconcentrations of Fe and As are correlated, with high levels of Fe(>10 mg=L) and As (>100 μg=L) found during the first infiltra-tion period in 2012 (Fig. 5). Such correlations suggest that As mayhave been mobilized to groundwater through reductive dissolutionof iron oxyhydroxide upon infiltration of pond water, althoughthere appears to be immobilization during the abstraction periodin the dry period of 2013. Monitoring data obtained by theEconoQuick kit between July 2012 and May 2014 revealed As>50 μg=L in abstracted water at six sites and that the occurrenceis not limited to the infiltration periods (Fig. 6). Even if only con-sidering As occurrence in recovered water excluding the infiltrationperiod, persistent high median values of As at 250 (n ¼ 24), 100(n ¼ 50), and 250 ðn ¼ 12Þ μg=L were found at sites MGD, DAB,and SHC, respectively. Monitoring of EC (Fig. 6) indicates fresh-ening over time and does not correspond to the large As increase atthese sites, suggesting that As release is not caused by mixing. Thechemical change in groundwater associated with infiltration ofpond water rich in nutrients and natural organic matter requiresfurther study. Depending on the mechanisms of As mobilization,effective removal of biological oxygen demand in the filtered pondwater, combined with measurement of sediment-mobilizable Asconcentrations (Jung et al. 2012), may be useful managementapproaches to reduce As risks in future ASR applications.
Long-Term Risks of Clogging: Turbidity inAbstracted Groundwater
Sand filtration significantly reduced particle loadings at most sites,but at BAB and PAL, the modal values of turbidity in recoveredwater (40 and 45 NTU, Table 2) are higher than in filtered pondwater (0 and 10 NTU respectively). Recovered water from all othersites showed consistently low turbidity (mode: 5 NTU, Table 2).This indicates that processes in the infiltration wells or the aquifermay contribute to the clogging risk. This may have been caused by
Fig. 4. The bars (left y-axis) from left to right are: initial presumably maximum rate of infiltration estimated from the falling head test, initialoperational infiltration rate, rate of infiltration after one year of operation, average operational rate of infiltration, and rate of infiltration after manualwashing of gravel in July, 2013; the percentage of reduction in the rate of infiltration (right y-axis) between initial values and after one year ofoperations are indicated as circles, with numerical values above the circles showing the percentage for each site
Table 3. Comparison of E. coli Levels in Raw Pond Water and AbstractedWell Water
Serialnumber Site Source
E. coli counts=100 mL
24/05/2013 20/09/2013 14/03/2014
1 MOB Pond >100 >100 52Well 1 16 5
2 MOC Pond >100 >100 >100
Well 1 18 03 MGS Pond >100 96 >100
Well 3 0 374 MGD Pond >100 52 >100
Well 0 0 05 SAA Pond >100 >100 16
Well 0 1 06 BAB Pond >100 >100 >100
Well 38 1 07 BAG Pond >100 >100 >100
Well 0 0 08 DAB Pond >100 >100 >100
Well 0 0 09 DAC Pond >100 >100 >100
Well 0 0 010 PAL Pond >100 >100 >100
Well 8 23 011 ASA Pond >100 >100 26
Well 3 0 012 KAK Pond >100 >100 >100
Well 2 13 013 SHC Pond >100 >100 >100
Well 25 1 1
© ASCE B5014007-8 J. Hydrol. Eng.
J. Hydrol. Eng. 2015.20.
Dow
nloa
ded
from
asc
elib
rary
.org
by
UN
IVE
RSI
TY
OF
DH
AK
A o
n 02
/18/
15. C
opyr
ight
ASC
E. F
or p
erso
nal u
se o
nly;
all
righ
ts r
eser
ved.

inadequate development of the infiltration wells. Other mecha-nisms that may contribute to clogging are discussed next.
Swelling and dispersion of clay, especially reactive clays such asmontmorillonite (smectite) is a well-known risk for clogging,where as little as 5% of clay in the storage zone can result in a
rapid degradation of ASR performance (Brown and Silvey1973). The target aquifer is composed of unconsolidated fine tomedium sand with variable amounts of clay coatings (Table 1).Illite is ubiquitous in both the Ganges and Brahmaputra rivers, withthe Ganges sediment having high smectite (∼30%) while the
Table 4. Concentrations of Arsenic, Iron, Manganese, and Chloride in Raw Pond Water and Groundwater from Abstraction Wells
Site
Concentration of arsenic (μg=L)
Pond water before filtration Abstracted groundwater
11/7/2012 15/9/2012 30/3/2013 12/7/2013 11/7/2012 15/9/2012 30/3/2013 12/7/2013
MOB 4 2 7 6 bdl 1 1 1MOC 1 bdl 7 3 29 11 5 5MGS 5 1 6 5 15 8 15 12MGD 3 bdl 3 4 463 284 9 16SAA 3 bdl 2 3 18 12 4 11BAB 3 bdl 4 5 bdl bdl 1 1BAG 5 6 6 19 bdl bdl 3 2DAB 4 2 3 4 129 133 49 97DAC 2 1 4 3 8 4 5 4PAL 2 1 4 5 3 2 6 4ASA bdl bdl 2 2 6 6 4 3KAK bdl 5 7 21 bdl bdl 1 4SHCa bdl bdl 5 4 bdl 1 2 2
Site Concentration of iron (mg=L)MOB 1.4 0.6 0.2 0.1 3.3 0.8 1.0 0.1MOC bdl 0.5 0.3 0.1 37.5 13.1 1.8 0.1MGS 0.5 4.7 0.2 0.9 6.2 0.8 0.4 3.6MGD 0.1 bdl 0.2 0.2 26.6 15.7 1.6 2.2SAA 4.2 1.0 0.8 0.8 5.1 4.3 0.1 1.2BAB bdl bdl 1.6 0.5 1.1 2.3 2.0 1.1BAG 1.0 bdl 0.3 0.8 1.6 1.6 1.7 1.7DAB 1.5 0.7 0.2 0.1 16.4 14.1 2.0 1.0DAC 1.4 5.2 0.2 0.1 3.6 5.0 0.9 0.8PAL bdl 0.0 1.4 0.0 4.5 3.4 0.2 0.0ASA 0.2 0.0 0.6 0.2 1.0 1.9 1.2 bdlKAK 1.2 0.9 0.1 0.2 3.0 1.7 0.4 0.3SHCa 0.6 1.1 0.5 0.4 3.6 5.3 2.4 0.1
Site Concentration of manganese (mg=L)MOB 0.3 0.1 0.1 0.0 0.4 0.1 0.2 0.2MOC 0.0 0.1 0.0 0.0 4.3 0.3 0.2 0.2MGS 0.0 bdl 0.0 0.1 1.0 0.0 0.0 0.1MGD 0.1 bdl 0.0 0.0 0.6 0.4 0.2 0.2SAA 0.0 bdl 0.0 0.0 0.8 0.2 0.0 0.1BAB bdl bdl 0.3 0.1 0.2 0.1 0.2 0.1BAG 0.1 bdl 0.0 0.2 0.2 0.2 0.3 0.2DAB 0.3 0.1 0.0 0.1 5.6 1.0 0.7 1.0DAC 0.2 0.1 0.1 0.0 0.8 0.2 0.2 0.2PAL 0.2 0.2 0.9 0.3 0.4 0.6 0.5 0.6ASA 0.0 bdl 0.0 0.2 0.1 0.1 0.2 0.0KAK 0.0 0.0 0.0 0.1 0.3 0.1 0.2 0.1SHCa 0.2 0.2 0.4 0.2 0.5 1.0 1.2 1.1
Site Concentration of chloride (mg=L)MOB 201 142 127 130 856 163 260 211MOC 1,017 439 755 1,832 4,628 1,704 572 666MGS 65 56 67 41 1,229 479 142 48MGD 104 65 92 52 340 228 82 51SAA 20 37 22 15 1,615 1,056 8 246BAB 772 155 3,384 1,482 678 296 369 393BAG 256 101 206 133 294 243 226 200DAB 674 640 887 693 2,988 781 735 706DAC 448 314 452 397 845 495 375 450PAL 495 407 632 480 1,524 1,395 1,132 1,228ASA 287 307 733 614 295 356 681 521KAK 108 80 101 27 201 66 147 65SHCa 40 107 13 18 973 1,267 1,634 1,618
aSites are not abstracted for water supply.
© ASCE B5014007-9 J. Hydrol. Eng.
J. Hydrol. Eng. 2015.20.
Dow
nloa
ded
from
asc
elib
rary
.org
by
UN
IVE
RSI
TY
OF
DH
AK
A o
n 02
/18/
15. C
opyr
ight
ASC
E. F
or p
erso
nal u
se o
nly;
all
righ
ts r
eser
ved.
Brahmaputra’s has low smectite (∼5%) (Heroy et al. 2003). Clay inthe Meghna flood plain of Bangladesh is mostly kaolinite(Hasan et al. 2009). Clay mineralogy data for these sites is yetto be determined but the presence of smectite is likely. In addition,clays may also swell due to cation exchange when fresh water isintroduced to brackish silici-clastic aquifers (Maliva andMissimer 2010). Monitoring major cation composition changesin groundwater over time at these sites can help to ascertain thispossibility.
There is also potential for chemical clogging due to precipitationof Fe and Mn (Table 4). There are no simple associations betweenthe operational infiltration rate and Fe or Mn concentrations in re-covered water, although this observation is limited by only fourdates when Fe and Mn concentrations were measured. Regularmonitoring of Fe and Mn, along with other redox-sensitive param-eters, is needed to assess the risk of clogging from precipitation ofoxyhydroxide and carbonate phases because the geochemical envi-ronment may be favorable to such mineral formation (Moormanet al. 2002).
The high nutrient and natural organic matter content (unpub-lished data) in pond water suggest that biological clogging is a
Fig. 5. Laboratory measurements of concentrations of Fe versus As inabstracted well water collected from sites DAB and MGD that showedsignificant Fe (>10 mg=L) and As (>100 g=L) during the 1st year ofinfilration in 2012 moonson season (Table 4); open symbols indicatemuch lower Fe and As levels during the abstraction period in March,2013, suggesting immobilization of Fe and As released during infiltration
Fig. 6. Variations of As concentrations in abstracted water at 13 sites monitored by ITS EconoQuick As test kits between July 2012 and May 2014(upper panel) and variations of EC (lower panel). Six sites with any As values >0.05 mg=L were indicated by symbols; four sites MOC, DAB, DAC,and PAL have high EC values (>2 mS=cm); sites MGD, DAB, and SHC display persistent high levels of As (>0.1 mg=L) during the abstractionperiod, with sites MGD and SHC the most dangerous because the water also had low EC
© ASCE B5014007-10 J. Hydrol. Eng.
J. Hydrol. Eng. 2015.20.
Dow
nloa
ded
from
asc
elib
rary
.org
by
UN
IVE
RSI
TY
OF
DH
AK
A o
n 02
/18/
15. C
opyr
ight
ASC
E. F
or p
erso
nal u
se o
nly;
all
righ
ts r
eser
ved.

concern. On the basis of sand column tests, Okubo and Matsumoto(1983) suggested that source water should have a TDS of <2 mg=Land soluble organic carbon concentration of <10 mg=L in order tomaintain a high infiltration rate. That biological clogging hasnot emerged as an issue at our sites may be due to one or moreof the following factors: the short time period of operation; thesmall quantity of infiltration so far, and the frequent backwash-ing. Although pond waters are rich in nutrients such as nitrate(1–60 mg=L) and phosphate (0.2–1.5 mg=L), so are the ambientgroundwaters. Thus in that sense, there is not a great changedue to infiltration besides introducing natural organic matter thatmay have higher reactivity in pond water (Mladenov et al. 2010).
Implications and Challenges for Upscaling
Although in its infancy, freshening of the brackish groundwater(Fig. 6) and recovery of fresh water (Table 1) was achieved withone season of infiltration at 11 out of 13 pilot sites. There has alsobeen significant reduction in fecal indicator bacteria (Table 3) andturbidity (Table 2), although increasing arsenic (Table 4 and Fig. 6)is concerning and requires management. Despite the high physicalclogging risk due to source water turbidity, management has so farbeen effective in maintaining average operational infiltration ratesof 3–6 m3 per day over one year (Fig. 3).
In addition to the risks of clay swelling and chemical andbiological clogging, there are general limitations to the applicabilityof ASR using ponds as source water. First, fresh water ponds arescarce and valuable to local communities, hence future ASRsystems will need to secure alternative fresh water sources byeffectively capturing the rain. Second, because power outagesare common, the design could benefit from either greater relianceon gravity or incorporation of solar-powered pumping. Third, man-agement of clogging is time consuming and labor intensive andrequires sustained community engagement. Fourth, the operationalcost of abstraction, together with the associated financing mecha-nisms, need to be carefully assessed with respect to people’s abilityto pay. Fifth, appropriate institutional arrangements betweencommunities, the private sector, nongovernment organizations,and local governments need to be established, especially formonitoring water quality. We are cautiously optimistic that thesechallenges can be met by the industrious coastal Bangladeshicommunity.
Conclusions
Pilot testing of low-cost, small-scale ASR schemes that infiltratepond water into shallow brackish aquifers has demonstrated thepotential of ASR to provide potable water in acutely water scarceareas of coastal Bangladesh. Short-term clogging risks from sus-pended particles in pond water have been minimized throughtwo stages of sand filtration and by frequent manual washing.Long-term clogging from clay swelling and chemical and biologi-cal mechanisms requires further investigation, along with the needto disinfect and to monitor As content in recovered water to ensuresafety.
Acknowledgments
This paper reflects the view of the authors only and not that ofUNICEF. We thank UNICEF staff Kamrul Alam, Lalit Patra, Astridvan Agthoven, Hans Spruijt, and Carel de Rooy for crucial supportduring the incubation stage. We thank UNICEF for funding this
work. We are grateful for the rural communities for allowing usto test ASR systems, for field staff for monitoring the performanceof the systems, and for Richard Johnston of EAWAG in providingchemical analysis of water samples.
References
Ahmed, K. M., et al. (2004). “Arsenic enrichment in groundwater ofthe alluvial aquifers in Bangladesh: An overview.” Appl. Geochem.,19(2), 181–200.
Ahmed, N., Allison, E. H., and Muir, J. F. (2009). “Rice fields to prawnfarms: A blue revolution in southwest Bangladesh?” Aquacult. Int., 18,555–574.
Bahar, M. M., and Reza, M. S. (2010). “Hydrochemical characteristicsand quality assessment of shallow groundwater in a coastal area ofSouthwest Bangladesh.” Environ. Earth Sci., 61(5), 1065–1073.
Bangladesh Water Development Board (BWDB). (2013). “Establishmentof monitoring network and mathematical model study to assess salinityintrusion in groundwater in the coastal area of Bangladesh due to cli-mate change.” Synthesis Rep., Bangladesh Water Development Board,Dhaka, Bangladesh.
Barker, J. L. (2013). “Numerical evaluation of community scale aquiferstorage, transfer and recovery technology.” M.Sc. thesis, Univ. ofWestern Ontario, London, ON, Canada.
British Geological Survey (BGS) and Department of Public HealthEngineering (DPHE). (2001). “Arsenic contamination of groundwaterin Bangladesh.” British Geological Survey Rep. WC/00/19, D. G.Kinniburgh and P. L. Smedley, eds., British Geological Survey,Keyworth, U.K.
Brown, D. L., and Silvey, W. D. (1973). “Underground storage and retrievalof freshwater from a brackish water aquifer.” Underground Waste Man-agement and Artificial Recharge: Proc., 2nd Int. Symp., J. Braunstein,ed., U.S. Geological Survey, New Orleans, 379–419.
Datta, S., et al. (2011). “Perennial ponds are not an important source ofwater or dissolved organic matter to groundwaters with high arsenicconcentrations in West Bengal, India.” Geophys. Res. Let., 38, L20404.
Department of Environment (DOE). (1993). “Assessment of the vulnerabil-ity of coastal areas to sea level rise and other effects of global climatechange—Pilot study Bangladesh.” Government of Bangladesh, Dhaka,Bangladesh.
French Geological Survey (BRGM). (2005). “Groundwater resources andhydro-geological investigations in and around Khulna City.” LocalGovernment Engineering Dept., Government of Bangladesh, Dhaka,Bangladesh.
Gale, I. N., et al. (2006). “Managed aquifer recharge: An assessment of itsrole and effectiveness in watershed management.” British GeologicalSurvey Commissioned Rep. CR/06/107N, British Geological Survey,Environmental Science Centre, Nottingham, U.K.
George, C. M., et al. (2012). “Evaluation of an arsenic test kit for rapidwell screening in Bangladesh.” Environ. Sci. Technol., 46(20),11213–11219.
Hasan, M. A., et al. (2009). “Geochemistry and mineralogy of shallowalluvial aquifers in Daudkandi upazila in the Meghna flood plain,Bangladesh.” Environ. Geol., 57(3), 499–511.
Heroy, D. C., Kuehl, S. A., and Goodbred, S. L. (2003). “Mineralogy ofthe ganges and Brahmaputra rivers: Implications for river switchingand late quaternary climate change.” Sediment. Geol., 155(3–4),343–359.
Holländer, H. M., Mull, R., and Panda, S. N. (2009). “A concept for man-aged aquifer recharge using ASR-wells for sustainable use of ground-water resources in an alluvial coastal aquifer in eastern India.” Phys.Chem. Earth, Parts A/B/C, 34(4–5), 270–278.
Hoque, B. A. (1999). “Biological contamination of tubewell water.” Proc.,8th Annual Scientific Conf. of ICDDR, B, International Centre forDiarrhoeal Disease Research, Bangladesh, Dhaka, Bangladesh.
Islam, M. S., and Tooley, M. J. (1999). “Coastal and sea-level changesduring the Holocene in Bangladesh.” Quat. Int., 55(1), 61–75.
© ASCE B5014007-11 J. Hydrol. Eng.
J. Hydrol. Eng. 2015.20.
Dow
nloa
ded
from
asc
elib
rary
.org
by
UN
IVE
RSI
TY
OF
DH
AK
A o
n 02
/18/
15. C
opyr
ight
ASC
E. F
or p
erso
nal u
se o
nly;
all
righ
ts r
eser
ved.

Jung, H. B., Bostick, B. C., and Zheng, Y. (2012). “Field, experimental, andmodeling study of arsenic partitioning across a redox transition in aBangladesh aquifer.” Environ. Sci. Technol., 46(3), 1388–1395.
Khan, M. M., Sakauchi, F., Sonoda, T., Washio, M., and Mori, M. (2003).“Magnitude of arsenic toxicity in tube-well drinking water inBangladesh and its adverse effects on human health including cancer:Evidence from a review of the literature.” Asian Pac. J. Cancer Prev.,4(1), 7–14.
Khanom, S., and Salehin, M. (2012). “Salinity constraints to different wateruses in coastal areas of Bangladesh: A case study.” Bangladesh J. Sci.Res., 25(1), 33–42.
Kodaka, H., Mizuochi, S., Teramura, H., and Nirazuka, T. (2006).“Comparison of the compact dry EC with the most probably numbermethod (AOAC Offical Method 966.24) for enumeration of Escherichiacoli and coliform bacteria in raw meats.” J. AOAC Int., 89(1), 100–114.
Luby, S. P., Gupta, S. K., Sheikh, M. A., Johnston, R. B., Ram, P. K., andIslam, M. S. (2008). “Tubewell water quality and predictors of contami-nation in three flood-prone areas in Bangladesh.” J. Appl. Microbiol.,105(4), 1002–1008.
Maliva, R. G., and Missimer, T. M. (2010). “Aquifer storage and recoveryand the development of sustainable water supplies.” IDA J., 2, 74–80.
Maliva, R. G., and Missimer, T. M. (2010). “Aquifer storage and recoveryand managed aquifer recharge using wells: Planning, hydrogeology,design, and operation.” Methods in water resources evaluation,Schlumberger Water Services, TX.
Martin, R., ed. (2013). “Clogging issues associated with managed aquiferrecharge methods.” IAH Commission on Managing Aquifer Recharge,⟨www.iah.org/recharge/clogging.htm⟩.
McArthur, J. M., Ravenscroft, P., and Sracek, O. (2011). “Aquifer arsenicsource.” Nature Geoscience, 4(10), 655–656.
McQuarrie, J. P., and Carlson, K. (2003). “Secondary benefits of aquiferstorage and recovery: Disinfection by-product control.” J. Environ.Eng., 10.1061/(ASCE)0733-9372(2003)129:5(412), 412–418.
Mladenov, N., et al. (2010). “Dissolved organic matter sources andconsequences for iron and arsenic mobilization in Bangladesh aquifers.”Environ. Sci. Technol., 44, 123–128.
Moorman, J. H. N., Colin, M. G., and Stuyfzand, P. J. (2002). “Ironprecipitation clogging of a recovery well following nearby deepwell injection.” Management of aquifer recharge for sustainability,P. J. Dillon, ed., Balkema, Lisse, Netherlands, 209–214.
Morgan, J. P., and McIntire, W. G. (1959). “Quaternary geology of theBengal basin, east Pakistan, and India.” Geol. Soc. Am. Bull., 70(3),319–342.
Neumann, R. B., Ashfaque, K. N., Badruzzaman, A. B. M., Ashraf Ali, M.,Shoemaker, J. K., and Harvey, C. F. (2010). “Anthropogenic influenceson groundwater arsenic concentrations in Bangladesh.” Nat. Geosci.,3(1), 46–52.
Okubo, T., and Matsumoto, J. (1983). “Biological clogging of sand andchanges of organic-constituents during artificial recharge.” WaterRes., 17(7), 813–821.
Pavelic, P., Dillon, P. J., and Barry, K. E. (2007a). “Management of clog-ging for reclaimed water ASR in a carbonate aquifer.” Management ofAquifer Recharge for Sustainability: Proc., 6th Int. Symp. on ManagedAquifer Recharge of Groundwater, P. Fox, ed., Acacia Publishing,Arizona, 148–161.
Pavelic, P., Dillon, P. J., Barry, K. E., Vanderzalm, J. L., Correll, R. L., andRinck-Pfeiffer, S. M. (2007b). “Water quality effects on cloggingrates during reclaimed water ASR in a carbonate aquifer.” J. Hydrol.,334(1–2), 1–16.
Pavelic, P., Nicholson, B. C., Dillon, P. J., and Barry, K. E. (2005). “Fateof disinfection by-products in groundwater during aquifer storageand recovery with reclaimed water.” J. Contam. Hydrol., 4,351–373.
Pyne, R. D. G. (1994). “Seasonal storage of reclaimed water and surfacewater in brackish aquifers using aquifer storage recovery wells.” Arti-ficial Recharge of Groundwater II: Proc., 23rd Int. Symp. on ArtificialRecharge of Ground Water, A. I. Johnson and R. D. G. Pyne, eds.,ASCE, 282–298.
Pyne, R. D. G. (2002). “Aquifer storage recovery wells: The path ahead.”Florida Water Resour. J., 19–27.
Pyne, R. D. G. (2005). Aquifer storage and recovery: A guide to ground-water recharge through wells, ASR Press, FL.
Sengupta, S., et al. (2008). “Do ponds cause arsenic-pollution of ground-water in the Bengal basin? An answer from West Bengal.” Environ. Sci.Technol., 42(14), 5156–5164.
Umitsu, M. (1993). “Late quaternary sedimentary environments andlandforms in the Ganges Delta.” Sediment. Geol., 83(3–4), 177–186.
Wasserman, G. A., et al. (2006). “Water manganese exposure and children’sintellectual function in Araihazar, Bangladesh.” Environ. HealthPerspect., 114(1), 124–129.
© ASCE B5014007-12 J. Hydrol. Eng.
J. Hydrol. Eng. 2015.20.
Dow
nloa
ded
from
asc
elib
rary
.org
by
UN
IVE
RSI
TY
OF
DH
AK
A o
n 02
/18/
15. C
opyr
ight
ASC
E. F
or p
erso
nal u
se o
nly;
all
righ
ts r
eser
ved.